
Original quantitative research – Association between annual exposure to air pollution and systolic blood pressure among adolescents in Montréal, Canada

HPCDP Journal Home
Published by: The Public Health Agency of Canada
Date published: April 2023
ISSN: 2368-738X
Submit a manuscript
About HPCDP
Browse
Previous | Table of Contents | Next
Erica Marrone, MScAuthor reference footnote 1; Cristina Longo, PhDAuthor reference footnote 2; Jennifer O’Loughlin, PhDAuthor reference footnote 3; Paul J. Villeneuve, PhDAuthor reference footnote 4; Michael Zappitelli, MD, MScAuthor reference footnote 5; Gillian Bartlett-Esquilant, PhDAuthor reference footnote 1; Tracie A. Barnett, PhDAuthor reference footnote 1
https://doi.org/10.24095/hpcdp.43.4.04
This article has been peer reviewed.
Author references
Correspondence
Tracie A. Barnett, Department of Family Medicine, McGill University, 5858 Côte-des-Neiges, Suite 300, Montréal, QC H3S 1Z1; Tel: 514-398-7375; Email: tracie.barnett@mcgill.ca
Suggested citation
Marrone E, Longo C, O’Loughlin J, Villeneuve PJ, Zappitelli M, Bartlett-Esquilant G, Barnett TA. Association between annual exposure to air pollution and systolic blood pressure among adolescents in Montréal, Canada. Health Promot Chronic Dis Prev Can. 2023;43(4):191-8. https://doi.org/10.24095/hpcdp.43.4.04
Abstract
Introduction: In adults, chronic exposure to air pollution is associated with elevated blood pressure, but few studies have examined this relationship in youth. We investigated the association between annual ambient concentrations of air pollutants (fine particulate matter [PM2.5] and nitrogen dioxide [NO2]) and systolic blood pressure (SBP) among adolescents in Montréal, Canada.
Methods: Participants were students aged 15 to 17 years who provided SBP and residential postal code data in 2004/05 through their enrolment in the Nicotine Dependence in Teens study. Annual estimates for 2004 of residential exposure to NO2 and PM2.5 were provided by the Canadian Urban Environmental Health Research Consortium and linked to participants’ residential postal code. Elevated SBP was defined as SBP ≥ 90th percentile adjusted for age, sex and height. Logistic regression was used to estimate odds ratios and 95% confidence intervals (CIs) for each pollutant with respect to elevated SBP, adjusted for relevant confounders.
Results: The sample consisted of 508 adolescents (mean age: 16.9, 46% male); 4% had elevated SBP. Although estimates were not statistically significant, there were generally modest positive associations between pollutant levels and SBP. The adjusted prevalence odds ratio of elevated SBP was 1.33 (95% CI: 0.64, 3.05) for every interquartile range (IQR) increase in residential PM2.5 levels (2.1µg/m3). Similarly, the adjusted prevalence odds ratio of elevated SBP was 1.17 (95% CI: 0.47, 2.70) for every IQR increase in residential NO2 levels (10.2 ppb).
Conclusion: Findings support a possible relationship between exposure to air pollutants and increased SBP in adolescents, warranting further investigation for this important public health concern.
Keywords: chronic disease prevention, blood pressure, air pollution, adolescent, health equity, cohort study
Highlights
- Our cohort study investigated the relation between air pollution exposure and systolic blood pressure in a Quebec adolescent population.
- Adolescents living in more polluted areas reported lower levels of physical activity and greater cigarette use in the past three months, and had greater material and social deprivation, than those living in the less polluted areas.
- Results cannot exclude a meaningful association between long-term exposure to air pollution and the prevalence of elevated systolic blood pressure in Montréal adolescents.
Introduction
Elevated blood pressure (BP) has long been recognized as a major health burden and a major risk factor for stroke, cardiovascular disease (CVD), end-stage renal disease and overall mortality.Footnote 1 In youth, primary hypertension (HTN), defined as elevated BP with no identifiable cause, is more common in older children and adolescents than in younger children.Footnote 2 The prevalence of this condition is estimated to be between 3% and 5% in the United States and may be higher in certain ethnic groups such as Blacks and Latin Americans.Footnote 3 Data on BP trajectories from childhood to adulthood illustrate that higher BP in childhood is associated with higher BP in adulthood and the onset of HTN in young adulthood.Footnote 4
Moreover, normal BP in childhood is inversely associated with HTN in mid-adulthood.Footnote 1 This relationship is stronger in older children and adolescents.Footnote 5 The goal of early identification and management of elevated BP in children and adolescents is to prevent the development of HTN-related end-organ disease, including CVD, later in life.Footnote 6 Both elevated BP (previously referred to as “pre-HTN”) and HTN in youth are underdiagnosed,Footnote 7 further contributing to the elevated risk of poor cardiovascular outcomes in adulthood.
Air pollution, and more specifically, short- and long-term exposure to fine particulate matter (PM2.5), is associated with increases in arterial BP values in adults with pre-existing health conditions,Footnote 8Footnote 9 as well as with incident HTN in otherwise healthy Canadian adults.Footnote 10 A recent meta-analysis demonstrated that long-term exposure to PM2.5 and nitrogen dioxide (NO2) was associated with systolic blood pressure (SBP) values in children.Footnote 11 Air pollution is hypothesized to influence BP through biphasic increases consisting of an initial response within minutes to hours, due to acute autonomic nervous system imbalance,Footnote 12 and subsequent BP elevation due to increased arterial vasoconstriction responsivenessFootnote 13 caused by endothelial dysfunction, oxidative stress and inflammation.Footnote 8
With high levels of industrialization and motorized vehicle use in developed countries, air pollution and its public health impacts have elevated concern among environmental health researchers, environmental regulatory agencies and the public.Footnote 14 Common outdoor air pollutants of considerable concern in adults include PM2.5 and NO2, and in urban areas, traffic-related sources including gasoline-fuelled or diesel-fuelled transportation methods represent the dominant sources.Footnote 14 Better understanding of the extent to which these air pollutants affect human health is pivotal for decision-makers to implement appropriate regulations and public health policies.
Objective
Previous studies examining the relationship between chronic air pollution and BP in children have reported inconsistent findings, and none have specifically focussed on adolescents in North America.Footnote 15Footnote 16Footnote 17Footnote 18 Given that elevated BP during adolescence in particular is a risk factor for HTN and CVD in adulthood, the objective of this study was to investigate the association between annual residential concentrations of two outdoor ambient air pollutants (PM2.5 and NO2) and SBP among Grade 11 students from 10 public high schools in Montréal, Canada, all of which were measured in 2004/05.
Methods
Ethics approval
The study received ethics approval from the Montréal Department of Public Health Ethics Review Committee, the McGill University Faculty of Medicine Institutional Review Board (A05-M48-02A) and the Ethics Research Committee of the Centre de recherche du Centre hospitalier de l’Université de Montréal (ND 06.087). Informed consent was obtained from all individual participants included in the Nicotine Dependence in Teens study.
Study design
We undertook an analysis of data from the Nicotine Dependence in Teens (NDIT) study, for which a detailed description of the data collection has been previously published.Footnote 19 Briefly, the original sample included 1294 Grade 7 students (response proportion: 54%) recruited in 1999/2000 in a purposive sample of 10 public high schools in and around Montréal, Quebec. The sample of students was similar at baseline to a 1999 provincially representative sample of children aged 12 years in Quebec.Footnote 20 NDIT schools were selected to include a mix of (1) English and French language schools; (2) urban, suburban and rural schools; and (3) schools located in high, medium and low socioeconomic status (SES) neighbourhoods. NDIT data collection consisted primarily of self-report questionnaires completed at school by students every three months from Grade 7 to 11 (1999–2005), for a total of 20 cycles during high school. Anthropometric characteristics and BP were measured during cycles 1, 12 and 19.
For the current study, we analyzed data from Grade 11 students aged under 18 years who completed cycle 19 in 2004/05 and for whom BP measures and postal code data were available. Participants whose residential postal codes were located outside the census division from the location in which nitrogen dioxide (NO2) concentrations were estimated were excluded, since the estimates are inaccurate with respect to individual residential exposure. While research has shown that residential estimates of NO2 are valid measures of individual exposure for those living close to roads,Footnote 21 this has not been established for those living further away.
Data sources
Using participant-reported, six-digit residential postal codes from NDIT questionnaires, neighbourhood and air quality data were obtained from the Canadian Urban Environmental Health Research Consortium (CANUE). In urban areas, six-digit residential postal codes most often correspond to one side of a city block or to a single apartment building; in rural areas, a single postal code may represent a larger area.Footnote 22 In the NDIT dataset, one of 10 study schools was located in a rural area; the other nine schools were located in suburban and urban areas. Postal code data were provided by DMTI Spatial Inc., via CANUE under the current SMART Agreement with Canadian universities. For our analysis, we extracted postal code–defined environmental (e.g. air quality) and neighbourhood (e.g. material and social deprivation) data using the coordinate locations from the CanMap Postal Code Suite version 2015.3 (DMTI Spatial, Inc., Markham, ON, CA).
Blood pressure
SBP was measured by trained technicians using standardized methods.Footnote 23 Participants rested for five minutes before BP was assessed; the measurement was taken while the participant was sitting, using an oscillometric device (Dinamap XL, model CR9340, Critikon, Inc., Tampa, FL, US), on the right arm, using an appropriate cuff size selected according to arm circumference. Aligned with Canadian pediatric guidelines,Footnote 24 SBP percentiles adjusted for age, sex and height were calculated using the natural spline quantile regression model developed by Rosner et al.Footnote 25 SBP was considered to be elevated when SBP was ≥ 90th percentile adjusted for age, sex and height, as there is no consensus on cut-offs for elevated BP for adolescents in Canadian guidelines.Footnote 24
Air quality exposures
Two outdoor air quality measures provided by CANUE and linked to NDIT participants’ six-digit residential postal codes were investigated: PM2.5 and NO2. Ground-level PM2.5 in 2004 was estimated by combining a 0.01-degree × 0.01-degree resolution optimal estimate–based aerosol optical depth retrieval from the NASA MODIS instrument with aerosol vertical profile and scattering properties simulated by the GEOS-Chem chemical transport model.Footnote 26 A geographically weighted regression that incorporates ground-based observations was then applied to adjust for any residual bias in the satellite-derived PM2.5 estimates.Footnote 26 The annual PM2.5 estimates used in this analysis have a spatial resolution of about one kilometre. Residential exposures to 2004 annual mean concentrations of NO2 were estimated using a national land-use regression model (LUR) developed from National Air Pollution Surveillance monitoring data using methods reported by Hystad et al.Footnote 27 The model explained 73% of the variation in observed National Air Pollution Surveillance measurements with a root mean square error of 2.9 ppb.
Covariates
Body mass index (BMI) percentiles based on the World Health Organization (WHO) growth curves, number of bouts per week of moderate-to-vigorous physical activity (MVPA) and alcohol and cigarette consumption in the past three months were considered as confounders and were measured in the same cycle as SBP. Material and social deprivation indexes based on the 2001 Canadian census derived from Pampalon et al.,Footnote 28 parental education, ethnicity and country of birth were collected during earlier NDIT cycles and were also adjusted for in the models (available from the authors upon request).
Statistical analyses
Missing data for cigarette consumption (2.2%), material and social deprivation index (1.7%), alcohol consumption (0.6%), parental education (1.8%) and ethnicity (10.8%) were imputed using the nearest neighbour method (data available from the authors upon request).Footnote 29 Logistic regression models were used to quantify the relationship between each air quality index measure (NO2, PM2.5) with SBP categorized as normal (< 90th percentile adjusted for age, sex and height) or elevated (≥ 90th percentile adjusted for age, sex and height) reporting crude and adjusted associations (i.e. controlling for BMI, MVPA, alcohol and cigarette consumption, deprivation indexes, parental education, ethnicity and country of birth). Air quality measures (i.e. annual average concentrations of PM2.5 and NO2) were scaled to their respective interquartile ranges to describe increases in exposure.
Three sensitivity analyses were performed to assess the robustness of our findings. First, a complete case analysis was performed and compared to findings based on the imputed sample. Second, a generalized linear mixed-effects model was conducted for NO2 and PM2.5 independently to adjust for school-level random clustering effects, and respective odds ratios (ORs) and confidence intervals (CIs) were compared with those for which school clustering was not controlled. Third, unadjusted and adjusted ORs were calculated from the logistic regression models using a different outcome definition, that of the 2017 guidelines from the American Academy of Pediatrics, defining elevated BP as SBP ≥ 120 mmHg in adolescents ≥13 years old.Footnote 4 We compared those results with our initial results using the definition of elevated SBP as ≥ 90th percentile adjusted for age, sex and height. All statistical analyses were carried out in R version 3.5.1 (R Foundation for Statistical Computing, Vienna, AT).
Patient and public involvement statement
During the NDIT study conducted by O’Loughlin et al.,Footnote 19 the study team maintained frequent personalized contact with NDIT participants (particularly after they had left high school, when data collections were less frequent) via telephone calls to verify contact information, newsletters highlighting NDIT results, emails and holiday cards.Footnote 19 NDIT participants helped create the study name and logo, and designed an NDIT t-shirt that was given to all participants.Footnote 19
Results
The NDIT sample comprised 1294 Grade 7 students at baseline; 844 (65%) completed the questionnaire in cycle 19, and 800 of 844 (95%) provided BP data. After excluding participants aged 18 or above, or who did not provide BP or postal code data, or who were located outside the division where NO2 estimates were derived, the analytic sample comprised 508 adolescents (Figure 1; mean [SD] age 16.9 [0.34] years; 46% male). Most students (98%) attended an urban or suburban school. Adolescents with missing BP values were slightly less likely to have university-educated parents (data available from the authors upon request).
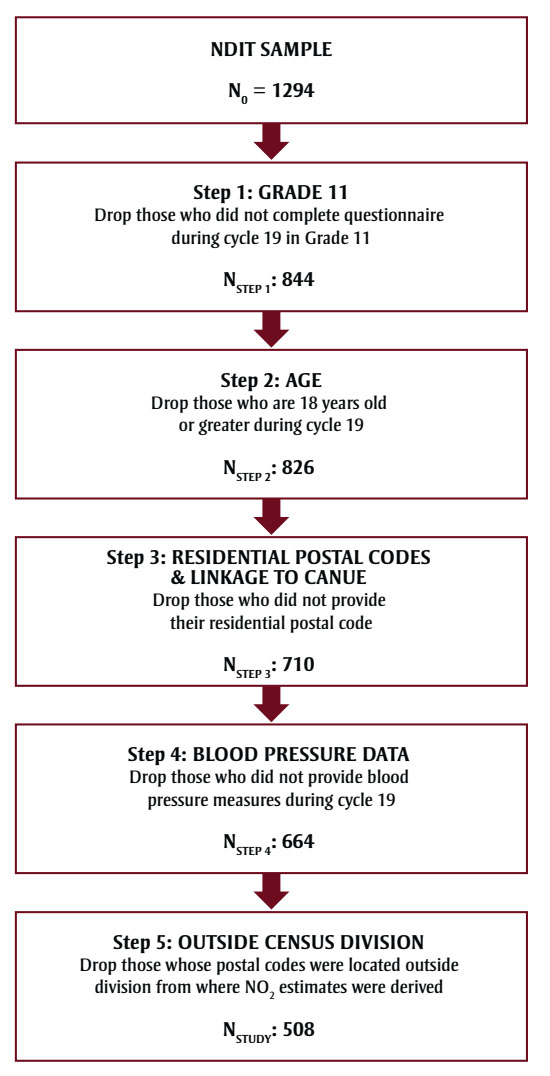
Figure 1 - Text description
Figure 1 illustrates the process to obtain the final analytic sample of 508 adolescents. There are 5 steps in the process. The process begins with a sample from the Nicotine Dependence in Teens (NDIT) dataset of N0 = 1294 adolescents.
| Step number | Step name | Description of exclusion criterion | Remaining sample size |
|---|---|---|---|
| Step 1 | Grade 11 | Drop those who did not complete questionnaire during cycle 19 in Grade 11. | NStep 1 = 844 |
| Step 2 | Age | Drop those who are 18 years old or greater during cycle 19. | NStep 2 = 826 |
| Step 3 | Residential postal codes and linkage to Canadian Urban Environmental Health Research Consortium (CANUE) |
Drop those who did not provide their residential postal code |
NStep 3 = 710 |
| Step 4 | Blood pressure data | Drop those who did not provide blood pressure measures during cycle 19 |
NStep 4 = 664 |
| Step 5 | Outside census division | Drop those whose postal codes were located outside division from where NO2 estimates were derived | NStudy = 508 |
In the end, the analytic sample comprised 508 adolescents.
Abbreviations: CANUE, Canadian Urban Environmental Health Research Consortium; NDIT, Nicotine Dependency in Teens study.
Seventy-seven percent of adolescents in the analytic sample were White, and 93% were born in Canada; 40% had at least one parent with a university education. According to the WHO BMI cut-offs, 81% had a normal BMI, 12% were overweight and 7% were obese. Three-quarters (76%) were nonsmokers, and half (51%) reported drinking alcohol occasionally. Adolescents in our sample were exposed to median residential levels of PM2.5 and NO2 of 10.7 µg/m3 and 22.1 ppb in 2004, respectively. According to the 2020 Canadian Ambient Air Quality Standards (CAAQS), acceptable annual averages were < 8 µg/m3 and < 17 ppb for PM2.5 and NO2, respectively. Thus, the median air quality exposure levels in the NIDT sample were slightly higher than the 2020 CAAQS recommendations.
We categorized neighbourhoods into less exposed (i.e. where PM2.5 and NO2 levels were below the sample median) and more exposed (i.e. where PM2.5 and NO2 and levels were above the sample median). Compared to adolescents living in less exposed neighbourhoods, a higher proportion of those living in more exposed areas were smokers and a lower proportion were White. Adolescents living in more exposed areas reported lower levels of physical activity (i.e. fewer bouts of MVPA per week, on average) than those living in the less exposed areas. A higher proportion of those living in more exposed areas were living in neighbourhoods with greater material and social deprivation, and were more likely to be female, compared to those living in less exposed areas (Table 1). There were no notable differences between groups in age, being Canadian-born, weight group classification, alcohol consumption in the past three months, and having at least one parent who was university-educated.
| Characteristics | Less exposed neighbourhoods | More exposed neighbourhoods | Total sample, n = 508 |
||
|---|---|---|---|---|---|
| NO2 ≤ 10.7 ppb, n = 254 |
PM2.5 ≤ 22.1 μg/m3, n = 261 |
NO2 > 10.7 ppb, n = 254 |
PM2.5 > 22.1 μg/m3, n = 247 |
||
| Sex (%) | |||||
| Males | 49 | 49 | 43 | 43 | 46 |
| Females | 51 | 51 | 57 | 57 | 54 |
| Age, y, mean (SD) | 16.9 (0.3) | 16.9 (0.3) | 16.9 (0.4) | 16.9 (0.3) | 16.9 (0.3) |
| White (%) | 84 | 82 | 70 | 72 | 77 |
| Born in Canada | |||||
| Yes | 95 | 95 | 92 | 92 | 93 |
| No | 5 | 5 | 8 | 8 | 7 |
| Weight group (%) | |||||
| Obese | 5 | 6 | 9 | 7 | 7 |
| Overweight | 12 | 14 | 11 | 10 | 12 |
| Normal | 82 | 79 | 78 | 81 | 80 |
| Underweight | 1 | 1 | 2 | 2 | 1 |
| MVPA, bouts/week, mean (SD) | 12.5 (11.1) | 12.1 (11.4) | 8.5 (8.7) | 8.8 (8.4) | 10.5 (10.2) |
| Any cigarette use in past 3 months (%) | |||||
| No | 83 | 82 | 69 | 70 | 76 |
| Yes | 17 | 18 | 31 | 30 | 24 |
| Alcohol use in past 3 months (%) | |||||
| None | 28 | 28 | 26 | 26 | 27 |
| Occasional | 50 | 49 | 52 | 53 | 51 |
| Frequent | 22 | 23 | 22 | 21 | 22 |
| At least 1 parent university educated (%) | 41 | 41 | 39 | 40 | 40 |
| Material deprivation quintilea (%) | |||||
| 5 (most deprived) | 2 | 1 | 17 | 18 | 9 |
| 4 | 5 | 7 | 17 | 15 | 11 |
| 3 | 11 | 12 | 14 | 13 | 13 |
| 2 | 19 | 20 | 19 | 18 | 19 |
| 1 (least deprived) | 63 | 60 | 33 | 36 | 48 |
| Social deprivation quintileFootnote a (%) | |||||
| 5 (most deprived) | 15 | 16 | 40 | 40 | 28 |
| 4 | 16 | 15 | 27 | 28 | 21 |
| 3 | 17 | 18 | 19 | 18 | 18 |
| 2 | 18 | 18 | 8 | 8 | 13 |
| 1 (least deprived) | 34 | 33 | 6 | 6 | 20 |
The mean (SD) SBP in our sample was 114.3 (10.8) mmHg in male adolescents and 105.4 (8.6) mmHg in female adolescents, and 16.9% of all adolescents had SBP measures ≥ 120 mmHg, which is considered elevated according to American pediatric guidelines on HTN (data not shown).Footnote 4 Overall, 21 (4%) adolescents had elevated SBP according to our study definition (SBP ≥ 90th percentile adjusted for age, sex and height). Mean and median air quality exposures were consistently higher in the elevated SBP group compared to the normal SBP group (data available from the authors upon request). Crude SBP measures were very similar between those living in less versus more exposed neighbourhoods (Table 2), whereas SBP percentiles adjusted for age, sex and height were slightly lower among those living in more exposed areas, compared to those in less exposed areas (Table 2).
| Characteristics | Less exposed neighbourhoods Mean (SD) |
More exposed neighbourhoods Mean (SD) |
||
|---|---|---|---|---|
| NO2 ≤ 10.7 ppb | PM2.5 ≤ 22.1 μg/m3 | NO2 > 10.7 ppb | PM2.5 > 22.1 μg/m3 |
|
| SBP, mmHg | ||||
| Males | 114.7 (11.7) | 114.2 (11.0) | 114.0 (10.2) | 114.4 (10.7) |
| Females | 105.2 (8.1) | 105.3 (8.2) | 105.5 (8.9) | 105.4 (9.0) |
| Total sample | 110.0 (11.1) | 109.2 (10.6) | 109.1 (10.3) | 109.6 (10.7) |
| SBP, age-sex-height-adjusted percentile | 39.60 (27.23) | 39.00 (26.72) | 37.16 (27.58) | 37.98 (26.93) |
In the logistic regression models, none of the estimates were statistically significant, indicating that the findings are inconclusive. The unadjusted OR estimates for elevated SBP for every interquartile range (IQR) increase in PM2.5 (2.1 µg/m3) and NO2 (10.2 ppb) levels were 1.55 (95% CI: 0.81, 3.18) and 1.34 (0.65, 2.67), respectively. In the adjusted models, the estimated prevalence odds ratio of elevated SBP was 1.33 (0.64, 3.05) for every IQR increase in residential PM2.5 levels. Similarly, the prevalence odds ratio of elevated SBP was 1.17 (0.47, 2.70) for every IQR increase in residential NO2 levels (Table 3). The complete case and generalized linear mixed-effects models sensitivity analyses supported that the results were robust (data available from the authors upon request). Using the AAP definition for elevated SBP, the estimated magnitude of the effect was close to null for NO2, and seemingly protective for PM2.5 (data available from the authors upon request).
| Pollutant and IQR | Unadjusted OR (95% CI) |
Adjusted ORFootnote a (95% CI) |
|---|---|---|
| PM2.5 (IQR: 2.1 μg/m3) | 1.55 (0.81, 3.18) |
1.33 (0.64, 3.05) |
| NO2 (IQR: 10.2 ppb) | 1.34 (0.65, 2.67) |
1.17 (0.47, 2.70) |
Discussion
Results of this analysis suggest that long-term exposure to air pollution may be associated with an increased prevalence odds of elevated SBP in Montréal adolescents; however, we cannot make firm conclusions based on our results due to the lack of power, the possible role of chance and the lack of substantial variation in the exposures. Nevertheless, a stronger association may be present in those exposed to higher air pollution levels. Findings were consistent across complete case and generalized linear mixed-effects model sensitivity analyses, but results supported a null effect for NO2 and a protective effect for PM2.5 when using the 2017 AAP definition of elevated SBP. Diastolic blood pressure (DBP) was not investigated since no participants had elevated DBP as per the AAP definition (i.e. > 80 mmHg) or age-sex-height-adjusted DBP percentile ≥ 90.
Only five studiesFootnote 15Footnote 16Footnote 17Footnote 30Footnote 31 have evaluated the association between long-term exposure to NO2 and PM2.5 and SBP in children, all of which undertook cross-sectional analyses. Two studies conducted in EuropeFootnote 15Footnote 30 reported differing associations between both air pollutants and SBP in children. In the Netherlands, BP was measured in 1400 participants aged 12 years, and annual average exposures to NO2 and PM2.5 were estimated by LUR models.Footnote 15 The authors reported adjusted slope coefficients for NO2 and PM2.5 of 0.03 (95% CI: −0.70, 0.64) and −0.07 (−0.97, 0.82), respectively, showing a null effect of long-term exposure of PM2.5 and NO2 on SBP. A plausible reason for this observation may relate to selection bias, since the researchers excluded all children with asthma, and thus examined a relatively healthier sample of participants. In contrast, a German study of 2368 children aged 10 yearsFootnote 30 reported small but positive associations between each pollutant and SBP: a 0.11 mmHg (−0.45, 0.67) increase in SBP for every IQR increase in NO2, and a 1.01 mmHg (−0.90, 2.92) increase in SBP for every IQR increase in PM2.5.
Three studies conducted in AsiaFootnote 16Footnote 17Footnote 31 reported stronger positive associations between air pollutants and SBP, possibly because their participants were exposed to greater average concentrations of PM2.5 and NO2 compared to those in our study. An analysis of the Global Burden of Diseases Study revealed that among the 10 most populous countries in the world, the United States had the lowest population-weighted amount of PM2.5 (annual average of approximately 10 μg/m3) over the last 25 years, while Bangladesh, India, Pakistan and China were the top four countries with the greatest amounts of PM2.5, ranging from annual averages of 60 μg/m3 to 90 μg/m3.Footnote 32 Sughis et al.Footnote 17 evaluated the association between prehypertension, defined as SBP ≥ 120–139 mmHg or DBP ≥ 80–89 mmHg, in 166 children aged 8 to 12 years (mean age 9.9 years) from two schools, each situated in an area with high (located next to a highway) compared to low (located next to a park in a new residential settlement) air pollution in Lahore, Pakistan. The adjusted OR for BP > 120 mmHg was 2.56 (95% CI: 0.96, 6.78) for children attending school in the more polluted area compared to those in the less polluted area.
Two studies in China used SBP percentiles, in addition to SBP, in their outcome assessment. Dong et al.Footnote 31 evaluated the association between SBP as well as the prevalence of HTN, defined as SBP and DBP ≥ 95th percentile, and satellite estimates of NO2 in 9354 children aged 5 to 17 (mean age: 10.9 years, SD: 2.5). Their results showed that for every IQR increase in NO2, SBP increased by 1.15 mmHg (95% CI: 0.84, 1.46). Additionally, the adjusted prevalence odds of being hypertensive in their sex-stratified models increased by 28% in males (OR: 1.28; 95% CI: 1.14, 1.43) and 39% in females (1.39; 1.23, 1.56). Using data from the same study as well as the same outcome definitions, Zhang et al.Footnote 16 evaluated the association with PM2.5 in 43 785 children aged between 7 and 18 (mean age: 11.3 years, SD: 3.1). After adjusting for covariates, every 10 μg/m3 increase in PM2.5 was associated with a 1.46 mmHg (0.05, 2.88) increase in SBP, and 31% higher odds (1.31; 0.86, 1.98) of being hypertensive.
Overall, although our estimates were imprecise, the general trend we observed suggested increased SBP was associated with increased air pollution, and was mostly consistent with the existing literature evaluating the association between long-term exposure to NO2 and PM2.5 and SBP in children.
Strengths and limitations
Strengths of this study include the examination of the association between long-term exposure to air pollution and BP in a subset of North American adolescents. Trends in pollution levels for the study sample were very stable during the previous (2003) and same year (2004/05) that SBP was measured, increasing confidence in the validity of the pollution levels (i.e. average annual exposure) and reducing the likelihood of exposure misclassification. In addition, SBP was assessed by trained technicians using standardized procedures, which reduces the possibility of outcome misclassification. Lastly, covariate data pertaining to sociodemographic information and behaviours were included in adjusted models, with little missing information.
Limitations include the observational study design, which limits causal inferences. Duration of residence at the reported postal code and frequency of moving were unknown. Without exposure history, it is not possible to examine long-term exposure to air pollution and SBP. Selection bias is a possibility, as only 39.3% (508 of 1294) of the NDIT baseline sample and 60.2% (508 of 844) of adolescents who responded in cycle 19 were included in the analysis. However, it is unlikely to have substantially changed our findings, as NDIT participants were representative of the general Quebec adolescent population, with the exception that those included in our sample may have been of higher socioeconomic status, since a slightly greater proportion had university-educated parents.
Exposure misclassification may also be a concern. Grade 11 students spend much of their day at school. Thus, air pollution levels assessed at their home address may not accurately reflect their “true” daytime exposure, unless school and residences share the same postal code. Further, the PM2.5 estimates used in this study had a spatial resolution of one kilometre, based on participants’ home. If major variations existed within this buffer zone, actual exposure may differ from assigned exposure. However, any misclassification was likely nondifferential (i.e. PM2.5 estimates did not depend on SBP measures), which would bias results towards the null.
Additionally, we did not have data on traffic noise and participants’ second-hand smoke exposure, which are hypothesized to influence BP and air pollution and could have confounded our results. Two studies, however, reported that associations between SBP and long-term air pollution exposure were not confounded by traffic-noise exposure.Footnote 15Footnote 30 As well, while the etiological associations likely stand, the data used in this study were collected 15 to 20 years ago, which may limit current practical applications of our findings. Lastly, our analyses were based on a study originally designed for other research questions; as a result, power was limited to observe a small effect.
Conclusion
This study provides evidence suggestive of a possible positive association between NO2 and PM2.5 and SBP in adolescents; however, results were inconclusive due to the imprecision of our estimates. Further investigation is needed to provide a stronger basis for causal inference, including more frequent or even continuous monitoring of BP outcomes and air pollution exposures over time, and associated analyses. If accumulating evidence establishes air pollution as a “modifiable” environmental risk factor for elevated BP and HTN, benefits to public health could be substantial in Canada and around the world.
Acknowledgements
Funding
Data used in this analysis were drawn from the NDIT (Nicotine Dependence in Teens) Study, which was funded by the Canadian Cancer Society (grants 010271 and 017435), the Canadian Institutes of Health Research (grants MOP86471 and TMH-109787), the Centre for Addiction and Mental Health Foundation, the Canada Foundation for Innovation (grants 20289 and 16014) and the Ontario Ministry of Research and Innovation. EM received a CIHR Canada Graduate Scholarship Master’s Award for the completion of this work. CL is a Marie Curie RESPIRE-3 postdoctoral fellow. JOL holds a Canada Research Chair in the Early Determinants of Adult Chronic Disease. TAB is a Fonds de recherche Québec–Santé (FRQS) Senior Scholar.
Conflicts of interest
The authors declare that they have no actual or potential conflicts of interest.
Authors’ contributions and statement
EM, JOL and TAB contributed to the study conceptualization. Data curation was performed under the supervision of JOL as part of the NDIT study. Formal analysis was performed by EM with supervision from CL and TAB. MZ gave scientific input on study outcomes, and PJV gave scientific input on study exposures. EM wrote the original draft, and CL, JOL, PJV, MZ, GBE and TAB reviewed and edited the manuscript. All authors read and approved the final manuscript.
The content and views expressed in this article are those of the authors and do not necessarily reflect those of the Government of Canada.