
At-a-glance – The contribution of active transportation to population physical activity levels

HPCDP Journal Home
 Download in PDF format (568 kB, 7 pages)
Published by: The Public Health Agency of Canada
Date published: May 2025
ISSN: 2368-738X
Submit a manuscript
About HPCDP
Browse
Previous | Table of Contents | Next
Stephanie A. Prince, PhDAuthor reference footnote 1Author reference footnote 2Author reference footnote *; Gregory P. Butler, MScAuthor reference footnote 1Author reference footnote *
https://doi.org/10.24095/hpcdp.45.5.03
This article has been peer reviewed.

Recommended Attribution
At-a-glance by Prince SA and Butler GP in the HPCDP Journal licensed under a Creative Commons Attribution 4.0 International License
Author references
Correspondence
Stephanie A. Prince, Centre for Surveillance and Applied Research, Public Health Agency of Canada, 785 Carling Avenue, Ottawa, ON K1A 0K9; Tel: 613-324-7860; Email: Stephanie.prince.ware@phac-aspc.gc.ca
Suggested citation
Prince SA, Butler GP. The contribution of active transportation to population physical activity levels. Health Promot Chronic Dis Prev Can. 2024;45(5):249-55. https://doi.org/10.24095/hpcdp.45.5.03
Abstract
We explored the contribution of active (nonmotorized) transportation, including walking and cycling, to physical activity (PA) levels and its association with PA recommendations adherence (youth: ≥ 60 min/day; adults: ≥ 150 min/week) using self-reported domain-specific and accelerometer-measured PA from Cycles 4 to 6 (2014–2019) of the Canadian Health Measures Survey (N = 8620). Recreation and household or occupational PA were similar for users and non-users, but accelerometer-measured PA was significantly higher among active transportation users (12–17 years: 56.6 vs. 47.7 min/day; 18–64 years: 33.4 vs. 22.8 min/day, 65–79 years: 21.5 vs. 13.7 min/day). Active transportation was not associated with meeting the PA recommendation for youth after adjusting for confounders (adjusted odds ratio [aOR] = 1.39; 95% confidence interval [CI]: 0.91–2.11), but it was for adults (18–64 years: aOR = 2.71, 95% CI: 2.18–3.37; 65–79 years: aOR = 2.26, 95% CI: 1.39–3.69). Given its contribution to population PA levels, supporting active transportation should be considered an important tool for health promotion.
Keywords: exercise, transportation, public health surveillance
Highlights
- Recreation and household or occupational physical activity were similar for active transportation users and non-users.
- Accelerometer-measured physical activity was higher among active transportation users across all age groups.
- Participating in active transportation increases the likelihood of achieving the physical activity recommendation for adults and is important for health promotion.
Introduction
Physical activity (PA) is protective against many chronic conditions and all-cause mortality and promotes positive mental health and well-being.Footnote 1Footnote 2Footnote 3 Measuring PA across several domains, including recreational, occupational or school, household and transportation domains, is important for population surveillance.Footnote 4Footnote 5 Although PA promotion often prioritizes leisure PA, largely because most of the earlier evidence showing the benefits of PA for health based on studies with self-reported leisure PA,Footnote 6Footnote 7Footnote 8 examination of all domains provides critical information to informing PA promotion activities.
Active transportation, or self-powered or nonmotorized travel, involves walking, cycling or other means of getting to destinations like work or school, running errands or shopping for groceries, visiting friends, going to places of entertainment and various other trips.Footnote 9 Data from the 2021 Canadian Community Health Survey show that 61.0% of youth and 41.7% of adults engage in some form of active transportation to get to destinations.Footnote 5 The 2021 Canadian Census (collected during the COVID-19 pandemic) recorded that 6.2% of working Canadians reported using active transportation as their main mode of commuting to work (down from 6.9% in 2016).Footnote 10 An additional 1.7% and 1.3% reported walking and cycling, respectively, when they used multiple modes of transportation to commute.Footnote 10
Active transportation is a valuable and often overlooked tool for achieving the PA recommendations identified in Canada’s 24-Hour Movement Guidelines.Footnote 11 Specifically, the guidelines recommend that adults achieve 150 minutes of weekly moderate-to-vigorous intensity physical activity (MVPA) and children and youth engage in an average of 60 minutes of MVPA per day. Active transportation is associated with higher levels of PA and an increased likelihood of achieving PA recommendations.Footnote 12 Further, it is likely that active transportation promotes additional PA rather than replacing other forms of PA.Footnote 12 Previous studies conducted in Canada (largely using nonrepresentative samples) also suggested that active transportation, including walking to and from public transit, results in a greater likelihood of meeting the PA recommendations,Footnote 13Footnote 14Footnote 15 but with some evidence of compensation among older adults.Footnote 16 Transportation-related PA (especially cycling) is associated with better cardiometabolic healthFootnote 17 and reduced risk of cardiovascular disease,Footnote 18Footnote 19Footnote 20Footnote 21 type 2 diabetes,Footnote 21Footnote 22 cancer-related mortalityFootnote 18 and all-cause mortality.Footnote 18Footnote 19Footnote 20Footnote 21
Most of the research exploring the association between active transportation and PA has emerged from Australia, Europe and the United States.Footnote 12 The objective of this study was to determine the association between active transportation and PA recommendations and to understand the contribution of active transportation to Canadians’ overall PA levels.
Methods
This study combined data from Cycles 4 to 6 (2014–2019) of the Canadian Health Measures Survey (CHMS). The CHMS is an ongoing cross-sectional survey, conducted by Statistics Canada, that collects self-reported and directly measured health information from a nationally representative sample of the household-dwelling population aged 3 to 79 years in Canada.Footnote 23 Excluded are people living in the three territories and certain remote regions, on reserves and other Indigenous settlements, and in institutions, which equates to approximately 4% of the target population.Footnote 23 The CHMS is collected year-round across all seasons.
The analyzed sample included 8620 youth and adults (aged 12–79 years) with complete and valid self-reported and accelerometer-measured PA.
Youth respondents were asked about the number of minutes per day they spent doing different types of MVPA over the previous 7 days. Adult respondents were asked about the number of minutes they spent doing different types of MVPA in the previous 7 days for a minimum of 10 continuous minutes. Self-reported average minutes per day spent in total and domain-specific MVPA was estimated for transportation, recreational and occupational or household PA. “Active transportation users” were defined as those people who used nonmotorized ways, such as walking or cycling, to get to school, work, the bus stop, and so on, or for running errands, going shopping or visiting friends.
After completing the household section of the CHMS questionnaire, respondents who attended a clinic visit were asked to wear an Actical accelerometer (Philips Respironics, Oregon, US) over their right hip during waking hours for 7 consecutive days. A minimum of 4 days with 10 hours or more of wear time per day was required. Previously validated movement intensity thresholdsFootnote 24Footnote 25 were applied to derive time spent being sedentary and being physically active at light, moderate and vigorous intensity PA. PA recommendation adherence was defined as an average of 60 or more minutes per day and 150 or more minutes per week of accelerometer-measured MVPA for youth and adults, respectively.Footnote 11
Adherence to the PA recommendation was estimated using proportions and 95% confidence intervals (CIs) and compared between active transportation users and non-users using the Rao-Scott chi-square (X2) test. We used multivariate logistic regression to determine the association between self-reported active transportation use and PA recommendation adherence for youth (12–17 years) and adults (18–64 and 65–79 years) while adjusting for age, sex, income quintile and ethnicity (not racialized, racialized, Indigenous Peoples).
T tests compared time spent in self-reported PA domains and accelerometer-measured MVPA among active transportation users and non-users. All measures of PA were log-transformed after adding a constant to address the high number of zeroes. All analyses were weighted using combined cycle accelerometer subsample survey weights. Degrees of freedom were set at 33. To account for survey design effects, 95% CIs were estimated using the bootstrap-balanced repeated replication technique with 500 replicate weights. Statistical significance was set at p < 0.05. Statistical analyses were performed using SAS Enterprise Guide version 7.1 (SAS Institute Inc., Cary, NC, US).
The CHMS protocol was approved by the Health Canada–Public Health Agency of Canada Research Ethics Board.
Results
Almost three-quarters (70.5%) of youth, less than half (44.2%) of adults aged 18 to 64 years and one-third (33.8%) of adults aged 65 to 79 years used active means of transportation. Across all ages, adherence to the PA recommendation was significantly higher among active transportation users than non-users (12–17 years: 33.3 vs. 25.1%; 18–64 years: 62.5 vs. 37.6%; 65–79 years: 35.5 vs. 20.5%) (see Figure 1).
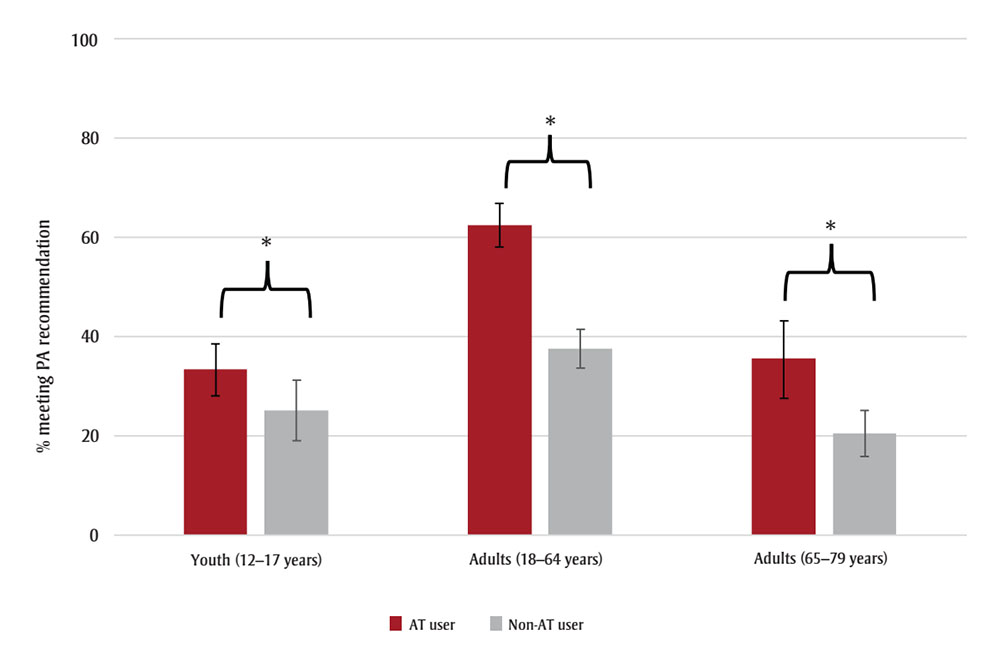
Figure 1 : Descriptive text
| Age group | AT user - Percentage meeting PA recommendations (95% confidence interval) |
Non-AT user - Percentage meeting PA recommendations (95% confidence interval) |
|---|---|---|
| Youth (12–17 years) | 33.3 (28.1, 38.5) | 25.1 (18.9, 31.2) |
| Adults (18–64 years) | 62.5 (58.2, 66.8) | 37.6 (33.7, 41.4) |
| Adults (65–79 years) | 35.5 (27.6, 43.3) | 20.5 (15.9, 25.1) |
Source: Canadian Health Measures Survey, Cycles 4 to 6 (2014–2019).
Abbreviations: AT, active transportation; CI, confidence interval; MVPA, moderate-to-vigorous intensity physical activity; PA, physical activity.
Note: Error bars represent 95% CIs.
* p < 0.05.
While the PA recommendation adherence point estimate was higher among active transportation–using youth, active transportation was not associated with meeting the PA recommendation after adjusting for confounders (adjusted odds ratio [aOR] = 1.39, 95% confidence interval [CI]: 0.91–2.11). Adult active transportation users were significantly more likely than adult non-users to meet the PA recommendation, even after adjusting for confounders (18–64 years: aOR = 2.71, 95% CI: 2.18–3.37; 65–79 years: aOR = 2.26, 95% CI: 1.39–3.69). Further adjustment for season of response had little effect on the effect estimates, and season was not a significant predictor in the models (results not shown).
Average time spent in recreation and occupational or household PA did not differ statistically between active transportation users and non-users, while time spent in accelerometer-measured MVPA was significantly higher for active transportation users than non-users across all age groups (12–17 years: 56.6 vs. 47.7 min/day; 18–64 years: 33.4 vs. 22.8 min/day; 65–79 years: 21.5 vs 13.7 min/day) (see Figure 2).
Figure 2. Average minutes per day spent in (a) different self-reported PA domains and (b) accelerometer-measured MVPA by active transportation–using and non-using youth (12–17 years) and adults (18–64 and 65–79 years), Canada (excluding territories)
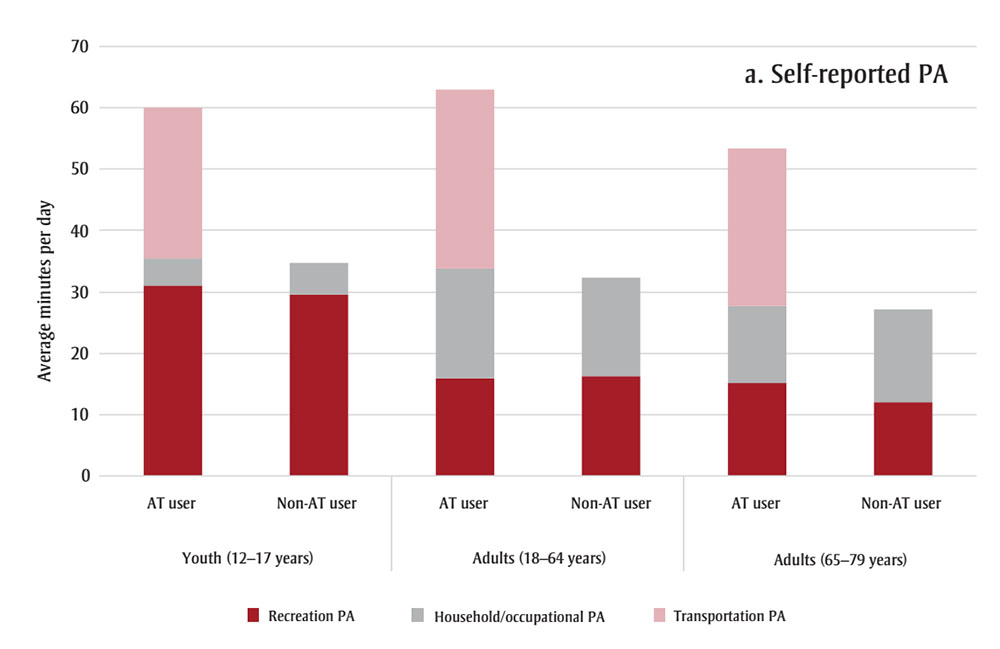
Figure 2A : Descriptive text
| Age group | AT user - Recreation PA | Non-AT user - Recreation PA | AT user - Household/occupation PA | Non-AT user - Household/occupation PA | AT user - Transportation PA | Non-AT user - Transportation PA |
|---|---|---|---|---|---|---|
| Youth (12-17 years) | 31.1 | 29.5 | 4.4 | 5.3 | 24.5 | 0 |
| Adults (18-64 years) | 15.9 | 16.2 | 17.9 | 16.2 | 29.1 | 0 |
| Adults (65-79 years) | 15.1 | 12 | 12.6 | 15.2 | 25.6 | 0 |
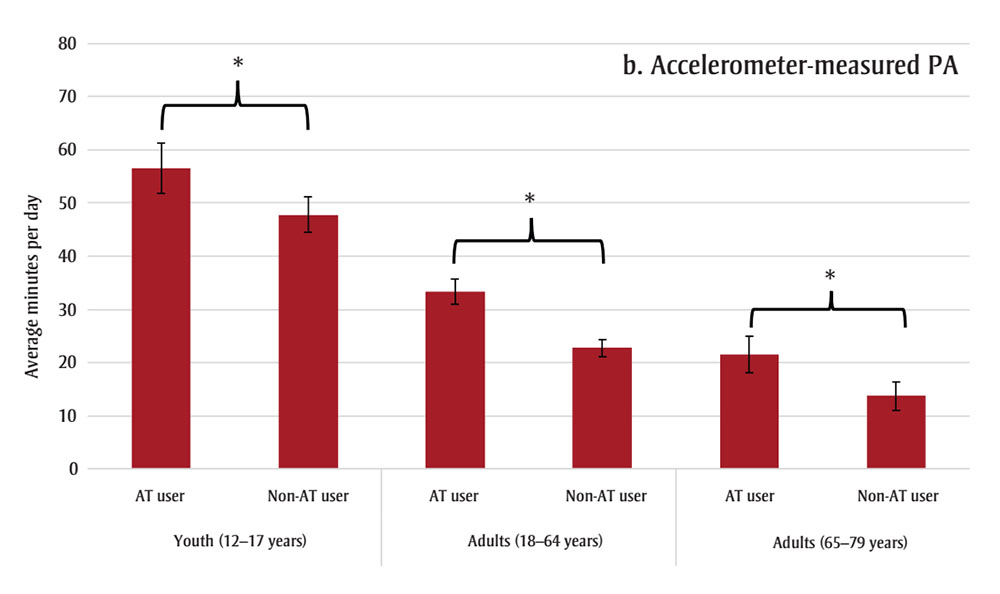
Figure 2B : Descriptive text
| Age group | AT user | Non-AT user |
|---|---|---|
| Youth (12-17 years) | 56.6 (51.9, 61.3) | 47.7 (44.4, 51.2) |
| Adults (18-64 years) | 33.4 (31, 35.8) | 22.8 (21.2, 24.4) |
| Adults (65-79 years) | 22.8 (18.2, 24.9) | 13.7 (11.1, 16.3) |
Source: Canadian Health Measures Survey, Cycles 4 to 6 (2014–2019).
Abbreviations: AT, active transportation; MVPA, moderate-to-vigorous intensity physical activity; PA, physical activity.
Note: Error bars represent 95% confidence intervals.
* p < 0.05.
Discussion
The results of this study suggest that participating in active transportation increases the likelihood of achieving the PA recommendations of the 24-Hour Movement Guidelines among adults. Canadians that engaged in active transportation had similar levels of occupational or household and recreational PA, but higher levels of accelerometer-measured MVPA. As such, active transportation appears to be additive rather than substitutive across PA domains.
Recent estimates show that only 49.2% of adults and 35.6% of youth in Canada, adhere to the PA recommendations.Footnote 5 Walking is generally more prevalent than cycling, males report more time spent in active transportation than do females, and active transportation use declines with age.Footnote 9 Our findings are similar to recent systematic reviews that suggested that those who engage in active transportation also engage in more device-measured total PA and that active transportation does not generally displace other activity.Footnote 12Footnote 26Footnote 27
The World Health Organization’s Global Action Plan on Physical Activity 2018–2030 has a target reduction of 15% in the global prevalence of physical inactivity among adolescents and adults by 2030.Footnote 28 The plan calls for investments in policies and urban and transport planning to promote walking and cycling and other forms of active transportation.Footnote 28A Common Vision for Increasing Physical Activity and Reducing Sedentary Living in Canada: Let’s Get MovingFootnote 29 and the 2017 Chief Public Health Officer of Canada’s ReportFootnote 30 recognized the importance of the physical environment for providing supportive and accessible opportunities to integrate PA into the daily lives of Canadians. One of the strategic imperatives of the Common Vision identifies supporting active transportation and transit solutions (e.g. enhancing bike routes, integrating public transportation systems).Footnote 29 Canadian research has shown that the active living friendliness or walkability of a neighbourhood is positively associated with accelerometer-measured MVPA and active transportation–based PA by youth and adults.Footnote 31 Systematic review evidence has also shown that the creation and improvement of infrastructure that supports pedestrians and cyclists (e.g. sidewalks, street connectivity, bike paths, traffic calming zones) is positively associated with active transportation.Footnote 32Footnote 33Footnote 34
The literature showing causal effects of supportive infrastructure on active transportation suggests that investments in sidewalks and cycling infrastructure, for example, by the transportation or infrastructure sectors, could also be viewed as public health investments.Footnote 32 The National Active Transportation StrategyFootnote 35 outlines a vision for advancing active transportation through evidence-based investments in new and existing infrastructure that supports active transportation.
The perceived comfort and safety of infrastructure is a key consideration for promoting active transportation.Footnote 36Footnote 37 The Canadian Bikeway Comfort and Safety (Can-BICS) classification system provides a standard naming convention for cycling infrastructure across cities in Canada and a three-tier classification system based on the safety and comfort of people using bicycle facilities.Footnote 38 Research using 2022 OpenStreetMap data found that 34% of Canadian neighbourhoods had no cycling infrastructure, 40% had no medium- or high-comfort cycling infrastructure and only 5% (for 6% of the population) had the highest category of Can-BICS.Footnote 39 Improving the safety and comfort of walking and cycling infrastructure in Canada is likely an important way of promoting active transportation and contributing to the daily PA of Canadians and hence their health.
Strengths and limitations
This study includes data from a nationally representative sample of Canadians with measured and self-reported PA. In our assessment of the association between active transportation and PA recommendation adherence, we adjusted for important sociodemographics that have shown to be associated with PA and active transportation (i.e. age, sex, income quintile and ethnicity). In addition, a sensitivity analysis assessed whether season of data collection affected the estimates. It is possible, however, that the results could be affected by residual confounding from variables not included in the models.
Important limitations of this work need to be acknowledged. There is a discordance between the self-reported and accelerometer-measured PA data; the self-reported PA data reflect a 7-day recall in the week before the household questionnaire, while the accelerometer data are collected the week after the visit to the clinic. It is also possible that those who wore an accelerometer changed their PA habits as a result of being monitored. In addition, comparisons of self-reported and accelerometer-measured total PA levels (Figure 2) indicate that participants who engaged in active transportation may overreport their PA levels. Previous work has also found that self-reported and accelerometer-measured levels of PA differ.Footnote 40Footnote 41 Future work could explore whether engaging in certain types of PA biases this discordance.
Finally, the survey questions group walking, cycling and other forms of active transportation together. It would be important for future work, if possible, to explore the separate contributions of walking, cycling and other modes of active transportation to population PA levels.
Conclusion
Active transportation is an important domain for health promotion and provides important health benefits. Canadians, and especially adults, who engaged in active forms of transportation were more likely to adhere to the PA recommendations and engaged in more PA than those who do not. Policy and programs developed to promote PA should include active transportation as a core component.
Acknowledgements
The authors would like to thank Robert Geneau, Marisol T. Betancourt and Karen C. Roberts for their review of the manuscript.
Funding
None.
Conflicts of interest
The authors have no conflicts of interest to disclose. Dr. Robert Geneau, Editor-in-Chief, was not involved in the deliberation of this article as he provided a critical review of the manuscript.
Authors’ contributions and statement
- SAP: Conceptualization, formal analysis, methodology, validation, writing – original draft, writing – review and editing.
- GPB: Conceptualization, methodology, validation, writing – original draft, writing – review and editing.
Both authors read and approved the final version of the manuscript.
The content and views expressed in this article are those of the authors and do not necessarily reflect those of the Government of Canada.