
Chapter 1: Mapping Connections: An understanding of neurological conditions in Canada – Impacts of neurological conditions
1. Impacts of Neurological Conditions
Diseases, disorders, and injuries of the brain, spinal cord, and peripheral nervous system can have varying impacts both within and across conditions. These conditions can affect the mobility, dexterity, skin and joint sensation, behaviour, bladder or bowel function, communication or speech and language, perception, cognition, consciousness, and emotion of the affected individual. Although certain neurological conditions, such as epilepsy or injuries, may be highly amenable to treatment and can, in effect, be cured, the course of most of these functional deficits is often chronic, and may be episodic, static, or progressive. Depending on their severity, which can range from little to no functional impairment to debilitating incapacity, these deficits often have profound consequences on the life and well-being of individuals living with a neurological condition, their families, caregivers, and communities. Several Study projects [1][2][5][8][9][10][11] and surveys [3][16] specifically investigated these impacts in quantitative and qualitative terms.
1.1 Neurological conditions affect many aspects of life
In collaboration with the Agency, Statistics Canada added a neurological conditions module to the 2010 and 2011 annual Canadian Community Health Survey (CCHS), where respondents were asked whether they, or a household member living in the same private dwelling, had one of 18 neurological conditions [3].Footnote 8 Further, the Agency and Statistics Canada conducted follow-up interviews with a subsample of these respondents or their household member about their neurological condition and its impacts. The response rate for this new survey, entitled the 'Survey on Living with Neurological Conditions in Canada' (SLNCC), was high, at 81.6%. Findings from the SLNCC 2011-2012 Project [16] were based on structured interviews with 4,409 Canadians (or their proxy respondents) about their condition. When transposed to the Canadian population using Statistics Canada population weights, this sample represented close to 1,738,000 private household residents with a neurological condition. When possible, results from the SLNCC were reported for all 18 neurological conditions together and for each condition individually.
Another Study project, the Everyday Experience of Living with and Managing a Neurological Condition (LINC) Project[9], conducted a survey between 2010 and 2012 on 754 volunteer adults with a neurological condition concerning the impacts of their condition.Footnote 9 Although the LINC survey may not have been fully representative of the overall population with the targeted neurological conditions, most LINC Project [9] findings were concordant with those of the SLNCC. Considered together, these projects documented the diversity, extent, and intensity of the impacts of neurological conditions on affected individuals.
There is no normal anymore…everything you took for granted in your life has just kind of gone out the window, and you don’t even know what’s going to be thrown at you next. It can be different every time.
~ Individual living with a neurological condition
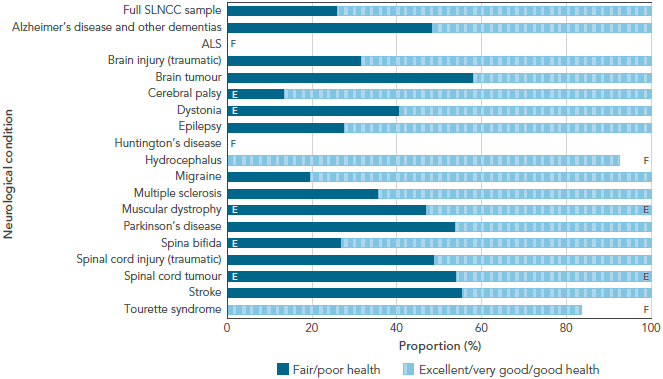
Having a neurological condition affects one’s general health. Overall, 25.4% of Canadians age 18 years and older with a neurological condition reported only ‘fair’ or ‘poor’ general health compared with 10.2% in the Canadian population without neurological conditions [3]. Even when these proportions were age-standardized, Canadians with a neurological condition reported a proportion that was 2.6 times higher than that of their counterparts without neurological conditions. Further, when migraine was removed from the population with a neurological condition, the proportion of Canadians with a neurological condition reporting ‘fair’ or ‘poor’ general health jumped to 46.2%; this proportion was 3.7 times higher than that seen in the age-standardized Canadian population without neurological conditions. Over half of Canadians who reported brain or spinal cord tumour, Parkinson's disease, or stroke had ‘fair’ or ‘poor’ general health (Figure 1-1)[16]. To varying degrees, the majority of Canadians with other neurological conditions reported ‘good’, ‘very good’, or ‘excellent’ general health.
Figure 1-1: General health among respondents age 15+ years living with a neurological condition, Canada, 2011-2012, SLNCC 2011-2012 Project [16]
NOTES:
SLNCC: Survey on Living with Neurological Conditions in Canada. Data were weighted to represent the Canadian population living with a neurological condition and were based on self- or proxy-report.
ALS: Amyotrophic lateral sclerosis.
E: Interpret with caution; coefficient of variation between 16.6% and 33.3%.
F: Data were unreportable due to small sample size or high sampling variability
SOURCE: 2011-2012 SLNCC data (Statistics Canada).
Text Equivalent - Figure 1-1
The bar graph shows the distribution of self-reported general health in two categories (fair/poor versus excellent/very good/good) for each neurological condition under study. On the graph, the horizontal axis shows the proportion of the population in each general health category, and the vertical axis lists the populations by neurological condition.
The distribution of fair/poor health varied by neurological condition, from 13.6% among those with cerebral palsy to 58.1% among those with a brain tumour. Self-reported fair/poor health was also high among those with stroke (55.4%), spinal cord tumour (54.1%), Parkinson's disease (53.9%), spinal cord injury (48.9%), and Alzheimer's disease and other dementias (48.4%).
Data were from the 2011-2012 SLNCC from Statistics Canada. SLNCC stands for Survey on Living with Neurological Conditions in Canada. ALS stands for amyotrophic lateral sclerosis. Data were weighted to represent the Canadian population living with a neurological condition and were based on self- or proxy-report. E signals that the reader should interpret the data with caution, because the coefficient of variation was between 16.6% and 33.3%. F signals that the data were unreportable due to small sample size or high sampling variability.
The table lists the proportion of the population in each general health category for each of the neurological conditions under study:
| Neurological condition | Excellent/very good/good health (%) | Fair/poor health (%) |
|---|---|---|
| Full SLNCC sample | 74.0 | 26.0 |
| Alzheimer's disease and other dementias | 51.6 | 48.4 |
| ALS | F | F |
| Brain injury (traumatic) | 68.4 | 31.6 |
| Brain tumour | 41.9 | 58.1 |
| Cerebral palsy | 86.4 | 13.6 E |
| Dystonia | 59.5 | 40.5 E |
| Epilepsy | 72.4 | 27.6 |
| Huntington's disease | F | F |
| Hydrocephalus | 92.5 | F |
| Migraine | 80.4 | 19.6 |
| Multiple sclerosis | 64.4 | 35.6 |
| Muscular dystrophy | 53.1 E | 46.9 E |
| Parkinson's disease | 46.1 | 53.9 |
| Spina bifida | 73.2 | 26.8 E |
| Spinal cord injury (traumatic) | 51.1 | 48.9 |
| Spinal cord tumour | 46.0 E | 54.1 E |
| Stroke | 44.6 | 55.4 |
| Tourette syndrome | 83.6 | F |
Having a neurological condition affects one’s mental health. A quarter of respondents to the LINC survey perceived their mental health to be ‘fair’ or ‘poor’ [9]. High stress was experienced by a third of Canadian adults with a neurological condition, with 34.9% having reported that most days were ‘quite a bit’ or ‘extremely’ stressful compared with 22.0% in the Canadian population without neurological conditions [3]. When age-standardized, stress levels among Canadians living with a neurological condition were 1.5 times higher than among those without neurological conditions. Levels of high stress varied by neurological condition, from 18.0% for those with cerebral palsy to 47.3% for those with dystonia [16].
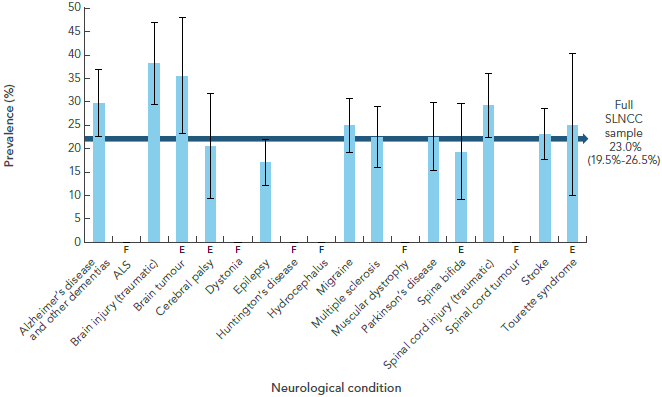
The prevalence of self-reported diagnosed mood or anxiety disorder among Canadian adults with a neurological condition was 22.6%, compared with 8.6% in the Canadian population without neurological conditions [3].Footnote 10 Differences in age distribution did not change this finding. The highest prevalence of self-reported diagnosed mood disorders was seen in those with a traumatic brain injury (38.3%) or brain tumour (35.5%) (Figure 1-2)[16]. Among LINC respondents, 11.5% reported a diagnosis of depression that was ‘moderate’ or ‘severe’ [9]. In the CCHS national survey, 17.1% of Canadian adults with a neurological condition reported symptoms consistent with depression, compared with 7.8% in those without neurological conditions [3]. When age-standardized, this rate was still about twice as high in those living with a neurological condition than in their counterparts without neurological conditions.
Figure 1-2: Prevalence of mood disorders among respondents age 15+ years living with a neurological condition, Canada, 2011-2012, SLNCC 2011-2012 Project [16]
NOTES:
SLNCC: Survey on Living with Neurological Conditions in Canada. Data were weighted to represent the Canadian population living with a neurological condition and were based on self- or proxy-report. The 95% confidence interval shows an estimated range of values which is likely to include the true prevalence 19 times out of 20.
ALS: Amyotrophic lateral sclerosis.
E: Interpret with caution; coefficient of variation between 16.6% and 33.3%.
F: Data were unreportable due to small sample size or high sampling variability
SOURCE: 2011-2012 SLNCC data (Statistics Canada).
Text Equivalent - Figure 1-2
The bar graph shows the prevalence of self-reported mood disorders for each neurological condition under study. On the graph, the horizontal axis shows the populations by neurological condition, and the vertical axis lists the prevalence.
Based on point estimates, the prevalence of mood disorders varied by neurological condition, from 17.1% among those with epilepsy to 38.3% among those with a traumatic brain injury. Self-reported mood disorders was also high among those with brain tumour (35.5%).
Data were from the 2011-2012 SLNCC from Statistics Canada. SLNCC stands for Survey on Living with Neurological Conditions in Canada. ALS stands for amyotrophic lateral sclerosis. Data were weighted to represent the Canadian population living with a neurological condition and were based on self- or proxy-report. E signals that the reader should interpret the data with caution, because the coefficient of variation was between 16.6% and 33.3%. F signals that the data were unreportable due to small sample size or high sampling variability.
The table lists the prevalence of mood disorders for each of the neurological conditions under study:
| Neurological condition | Has mood disorder (%) |
|---|---|
| Full SLNCC sample | 23.0 |
| Alzheimer's disease and other dementias | 29.7 |
| ALS | F |
| Brain injury (traumatic) | 38.3 |
| Brain tumour | 35.5 E |
| Cerebral palsy | 20.4 E |
| Dystonia | F |
| Epilepsy | 17.1 |
| Huntington's disease | F |
| Hydrocephalus | F |
| Migraine | 24.9 |
| Multiple sclerosis | 22.5 |
| Muscular dystrophy | F |
| Parkinson's disease | 22.5 |
| Spina bifida | 19.3 E |
| Spinal cord injury (traumatic) | 29.2 |
| Spinal cord tumour | F |
| Stroke | 23.0 |
| Tourette syndrome | 25.1 E |
Having a neurological condition leads to feelings of stigmatization. Based on results from the SLNCC for various neurological conditions, 5% to 36% of Canadians age 15 years and older with a neurological condition perceived that others felt uncomfortable around them or avoided them, that they were left out of activities, or that they were embarrassed by their condition [16].
Having a neurological condition poses limitations on daily life for the majority of Canadians living with one of these conditions. Limitations in at least one usual activity were experienced by 89.3% of Canadians with a neurological condition age 15 years and older, ranging from 66.3% for Tourette syndrome to 92.7% for migraine [16]. Half (50.6%) of Canadians age 18 years and older with a neurological condition ‘sometimes’ or ‘often’ experienced activity limitations, compared with 26.7% in the Canadian population without neurological conditions [3]. Even when age differences were controlled, the proportion of Canadians with a neurological condition reporting activity limitations was twice as high as the proportion among those without neurological conditions. Excluding migraine, 76.9% of Canadians age 18 years and older with a neurological condition experienced limitations of their usual activities (compared with 28.1% among those without neurological conditions), and when these proportions were age-standardized, the proportion of those living with a neurological condition reporting activity limitations was three times higher than in the Canadian population without neurological conditions. Along the same lines, 69.5% of respondents in the LINC convenience sample (which excluded migraine) reported that their activities were ‘often’ restricted, compared with 38.4% of Canadians reporting two or more other chronic conditions [9].Footnote 11
Having a neurological condition causes impairments of function that affect quality of life. Functional impairments were documented in two ways using national survey data [10][16]. The first was based on categories for certain functional attributes included in the Health Utilities Index-Mark 3 (HUI-3) (cognition, mobility, dexterity, speech, vision, hearing, emotion, and pain and discomfort) [16].Footnote 12 The second was based on global HUI-3 scores for those with specific neurological conditions, with scores falling between a minimum value of -0.36 (worse than dead), through to 0.0 (dead), to a maximum value of 1.0 (full health) [10].
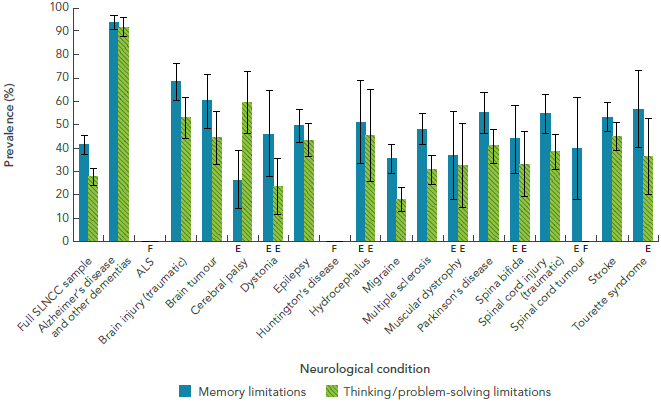
- Impaired cognition: The highest prevalence of impaired cognition was seen among Canadians with Alzheimer’s disease and other dementias (93.7%),Footnote 13 although respondents with other neurological conditions also reported difficulty with memory and their ability to think or solve problems (Figure 1-3) [16].
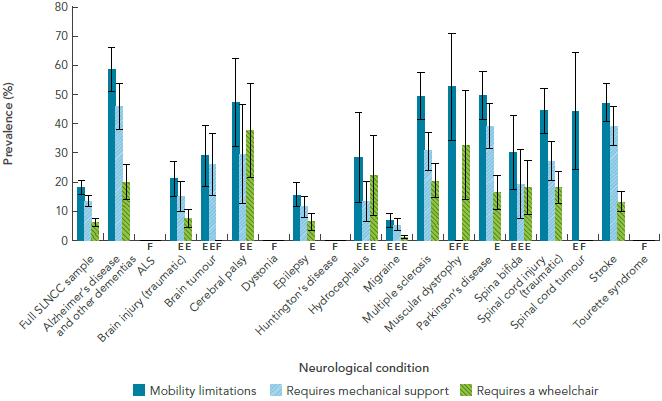
- Impaired mobility: About half of Canadians with Alzheimer’s disease and other dementias, cerebral palsy, multiple sclerosis, muscular dystrophy, Parkinson's disease, spinal cord injury or tumour, and stroke reported limitations on their mobility (Figure 1-4) [16].
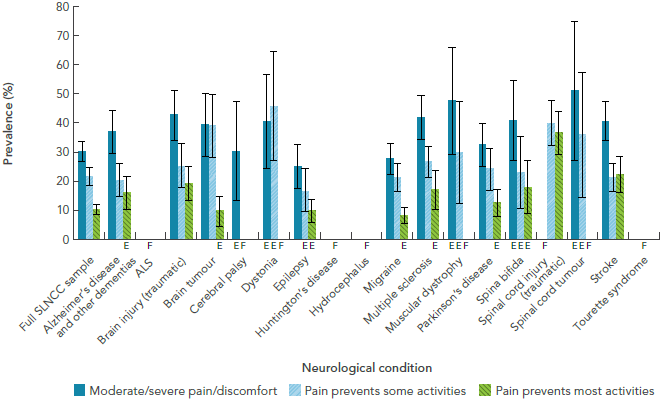
- Pain and discomfort: Moderate or severe pain varied in the Canadian population living with a neurological condition (Figure 1-5) [16]. In 36.6% of individuals with a traumatic spinal cord injury, the pain was significant enough to prevent their ability to engage in most activities.
- Impaired dexterity: The prevalence of hand-finger dexterity impairment was less than 10% among respondents to the SLNCC [16]. The low prevalence of impaired upper limb function estimated in this survey was not consistent with findings from the LINC Project [9], where 42.5% of adults had upper limb dysfunction rated as ‘moderate’ or ‘severe’.Footnote 14
I just had to pick an activity that matched my ability level. Maybe the activity wasn’t quite the same as what I truly desired, but I was willing to bargain with my multiple sclerosis.
~ Individual living with a neurological condition
Figure 1-3: Prevalence of impaired cognition among respondents age 15+ years living with a neurological condition, Canada, 2011-2012, SLNCC 2011-2012 Project [16]
NOTES:
SLNCC: Survey on Living with Neurological Conditions in Canada. Data were weighted to represent the Canadian population living with a neurological condition and were based on self- or proxy-report. The 95% confidence interval shows an estimated range of values which is likely to include the true prevalence 19 times out of 20.
ALS: Amyotrophic lateral sclerosis.
E: Interpret with caution; coefficient of variation between 16.6% and 33.3%.
F: Data were unreportable due to small sample size or high sampling variability
SOURCE: 2011-2012 SLNCC data (Statistics Canada).
Text Equivalent - Figure 1-3
The bar graph shows the prevalence of self-reported impaired cognition for each neurological condition under study. Impaired cognition is shown in two categories (memory limitations and thinking/problem-solving limitations). On the graph, the horizontal axis shows the populations by neurological condition, and the vertical axis lists the prevalence for these two categories.
Based on point estimates, the prevalence of memory limitations was usually higher than thinking/problem-solving limitations, except among those with cerebral palsy, where thinking/problem-solving limitations were higher at 59.7% (compared to 26.5% for memory limitations). Memory limitations were highest among those with Alzheimer's disease and other dementias at 93.7%, and lowest among those with cerebral palsy at 26.5%. Thinking/problem-solving limitations were highest among those with Alzheimer's disease and other dementias at 91.8%, and lowest among those with migraine at 18.2%.
Data were from the 2011-2012 SLNCC from Statistics Canada. SLNCC stands for Survey on Living with Neurological Conditions in Canada. ALS stands for amyotrophic lateral sclerosis. Data were weighted to represent the Canadian population living with a neurological condition and were based on self- or proxy-report. E signals that the reader should interpret the data with caution, because the coefficient of variation was between 16.6% and 33.3%. F signals that the data were unreportable due to small sample size or high sampling variability.
The table lists the prevalence of memory and thinking/problem-solving limitations for each of the neurological conditions under study:
| Neurological condition | Memory limitations (%) | Thinking/problem-solving limitations (%) |
|---|---|---|
| Full SLNCC sample | 41.6 | 27.8 |
| Alzheimer's disease and other dementias | 93.7 | 91.8 |
| ALS | F | F |
| Brain injury (traumatic) | 68.3 | 53.0 |
| Brain tumour | 60.1 | 44.4 |
| Cerebral palsy | 26.5 E | 59.7 |
| Dystonia | 46.3 E | 23.7 E |
| Epilepsy | 49.8 | 43.4 |
| Huntington's disease | F | F |
| Hydrocephalus | 51.0 E | 45.6 E |
| Migraine | 35.4 | 18.2 |
| Multiple sclerosis | 48.2 | 30.6 |
| Muscular dystrophy | 37.1 E | 32.7 E |
| Parkinson's disease | 55.1 | 41.0 |
| Spina bifida | 43.9 E | 33.1 E |
| Spinal cord injury (traumatic) | 54.5 | 38.6 |
| Spinal cord tumour | 39.9 E | F |
| Stroke | 53.3 | 45.0 |
| Tourette syndrome | 56.9 | 36.5 E |
Figure 1-4: Prevalence of impaired mobility among respondents age 15+ years living with a neurological condition, Canada, 2011-2012, SLNCC 2011-2012 Project [16]
NOTES:
SLNCC: Survey on Living with Neurological Conditions in Canada. Data were weighted to represent the Canadian population living with a neurological condition and were based on self- or proxy-report. The 95% confidence interval shows an estimated range of values which is likely to include the true prevalence 19 times out of 20.
ALS: Amyotrophic lateral sclerosis.
E: Interpret with caution; coefficient of variation between 16.6% and 33.3%.
F: Data were unreportable due to small sample size or high sampling variability
SOURCE: 2011-2012 SLNCC data (Statistics Canada).
Text Equivalent - Figure 1-4
The bar graph shows the prevalence of self-reported impaired mobility for each neurological condition under study. Impaired mobility is shown in three categories (mobility limitations, requires mechanical support, and requires a wheelchair). On the graph, the horizontal axis shows the populations by neurological condition, and the vertical axis lists the prevalence for these three categories.
Based on point estimates, the prevalence of mobility limitations was always the highest category because it contains the other two categories. Mobility limitations were highest among those with Alzheimer's disease and other dementias at 58.4%, but was also high among those with muscular dystrophy at 52.4%. Mobility limitations were lowest among those with migraine at 6.6%. The requirement of mechanical support such as braces, a cane, or crutches was highest among those with Alzheimer's disease and other dementias at 45.7%, and again lowest among those with migraine at 5.2%. Wheelchair was required for mobility for 37.6% of those with cerebral palsy and 32.5% of those with muscular dystrophy.
Data were from the 2011-2012 SLNCC from Statistics Canada. SLNCC stands for Survey on Living with Neurological Conditions in Canada. ALS stands for amyotrophic lateral sclerosis. Data were weighted to represent the Canadian population living with a neurological condition and were based on self- or proxy-report. E signals that the reader should interpret the data with caution, because the coefficient of variation was between 16.6% and 33.3%. F signals that the data were unreportable due to small sample size or high sampling variability.
The table lists the prevalence of mobility limitations, requirement for mechanical support, and requirement for wheelchair for each of the neurological conditions under study:
| Neurological condition | Mobility limitations (%) | Requires mechanical support (%) | Requires a wheelchair (%) |
|---|---|---|---|
| Full SLNCC sample | 18.2 | 13.3 | 6.0 |
| Alzheimer's disease and other dementias | 58.4 | 45.7 | 19.6 |
| ALS | F | F | F |
| Brain injury (traumatic) | 21.0 | 14.9 E | 7.4 E |
| Brain tumour | 28.9 E | 25.9 E | F |
| Cerebral palsy | 47.1 | 29.3 E | 37.6 E |
| Dystonia | F | F | F |
| Epilepsy | 15.5 | 11.4 | 6.3 E |
| Huntington's disease | F | F | F |
| Hydrocephalus | 28.4 E | 13.2 E | 22.1 E |
| Migraine | 6.6 E | 5.2 E | 1.0 E |
| Multiple sclerosis | 49.3 | 30.4 | 20.2 |
| Muscular dystrophy | 52.5 E | F | 32.5 E |
| Parkinson's disease | 49.6 | 39.1 | 16.4 E |
| Spina bifida | 29.9 E | 19.0 E | 18.0 E |
| Spinal cord injury (traumatic) | 44.3 | 27.1 | 18.0 |
| Spinal cord tumour | 44.2 E | F | F |
| Stroke | 46.9 | 38.9 | 13.2 |
| Tourette syndrome | F | F | F |
Figure 1-5: Prevalence of pain and discomfort among respondents age 15+ years living with a neurological condition, Canada, 2011-2012, SLNCC 2011-2012 Project [16]
NOTES:
SLNCC: Survey on Living with Neurological Conditions in Canada. Data were weighted to represent the Canadian population living with a neurological condition and were based on self- or proxy-report. The 95% confidence interval shows an estimated range of values which is likely to include the true prevalence 19 times out of 20.
ALS: Amyotrophic lateral sclerosis.
E: Interpret with caution; coefficient of variation between 16.6% and 33.3%.
F: Data were unreportable due to small sample size or high sampling variability
SOURCE: 2011-2012 SLNCC data (Statistics Canada).
Text Equivalent - Figure 1-5
The bar graph shows the prevalence of self-reported pain and discomfort for each neurological condition under study. Pain and discomfort is shown in three categories (moderate/severe, pain prevents some activities, and pain prevents most activities). On the graph, the horizontal axis shows the populations by neurological condition, and the vertical axis lists the prevalence for these three categories.
The categories of pain/discomfort preventing some and most activities were complimentary. The category of moderate/severe pain was independent. Based on point estimates, moderate/severe pain was highest for those with a spinal cord tumour, at 51.2%. It was also high for those with muscular dystrophy (47.6%) and brain injury (42.7%). The prevention of some activities due to pain was highest for those with dystonia (45.8%). The prevention of most activities due to pain was highest for those with spinal cord injury, at 36.6%, but was also high for those with stroke, at 22.2%.
Data were from the 2011-2012 SLNCC from Statistics Canada. SLNCC stands for Survey on Living with Neurological Conditions in Canada. ALS stands for amyotrophic lateral sclerosis. Data were weighted to represent the Canadian population living with a neurological condition and were based on self- or proxy-report. E signals that the reader should interpret the data with caution, because the coefficient of variation was between 16.6% and 33.3%. F signals that the data were unreportable due to small sample size or high sampling variability.
The table lists the prevalence of moderate/severe pain, pain preventing some activities, and pain preventing most activities for each of the neurological conditions under study:
| Neurological condition | Moderate/severe pain/discomfort (%) | Pain prevents some activities (%) | Pain prevents most activities (%) |
|---|---|---|---|
| Full SLNCC sample | 29.9 | 21.6 | 10.2 |
| Alzheimer's disease and other dementias | 37.0 | 20.4 | 16.0 E |
| ALS | F | F | F |
| Brain injury (traumatic) | 42.7 | 25.4 | 19.3 |
| Brain tumour | 39.5 | 39.0 | 9.7 E |
| Cerebral palsy | 30.4 E | F | F |
| Dystonia | 40.4 E | 45.9 E | F |
| Epilepsy | 25.0 | 16.5 E | 9.8 E |
| Huntington's disease | F | F | F |
| Hydrocephalus | F | F | F |
| Migraine | 27.8 | 21.2 | 8.1 E |
| Multiple sclerosis | 41.8 | 26.5 | 17.1 E |
| Muscular dystrophy | 47.6 E | 29.8 E | F |
| Parkinson's disease | 32.6 | 24.1 | 12.6 E |
| Spina bifida | 40.8 E | 23.0 E | 17.9 E |
| Spinal cord injury (traumatic) | F | 40.0 | 36.6 |
| Spinal cord tumour | 51.2 E | 35.8 E | F |
| Stroke | 40.5 | 21.4 | 22.2 |
| Tourette syndrome | F | F | F |
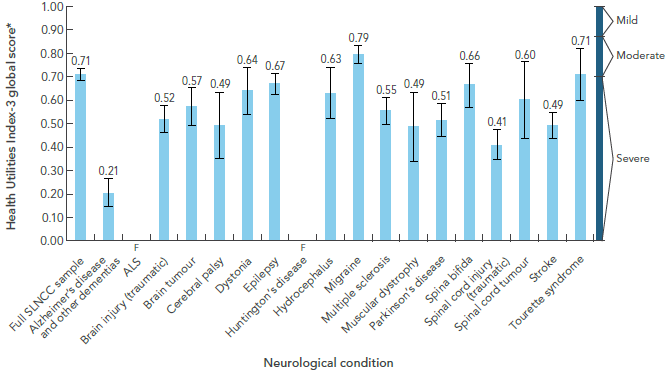
- Greater overall disability: Figure 1-6 presents global HUI-3 scores by neurological condition [10]. The global HUI-3 score (which is derived from eight HUI-3 attributes) for each of the targeted neurological conditions (except migraine and Tourette syndrome) was less than 0.7, which generally indicates a significant impairment in quality of life (severe disability).Footnote 15 For migraine, the global HUI-3 score of 0.79 corresponded to a level of moderate disability. The lowest global HUI-3 score of 0.21 was associated with Alzheimer’s disease and other dementias.Footnote 16 Although not shown, the proportion of Canadians with a neurological condition within the ‘severe’ or ‘moderate’ disability categories ranged from 42.4% for migraine to 94.9% for Alzheimer’s disease and other dementias. Further, the individual scores for three HUI-3 attributes – cognition, mobility, and pain and discomfort – were similar in range, irrespective of the type of neurological condition. These findings underscore the commonalities in functional disabilities shared by many of those living with different neurological conditions.
Figure 1-6: Average Health Utilities Index global score among respondents age 15+ years living with a neurological condition, Canada, 2011-2012, Microsimulation Project [10]
NOTES:
SLNCC: Survey on Living with Neurological Conditions in Canada. Data were weighted to represent the Canadian population living with a neurological condition and were based on self- or proxy-report. The 95% confidence interval shows an estimated range of values which is likely to include the true value 19 times out of 20.
ALS: Amyotrophic lateral sclerosis.
* A score of 1.0 = no disability; 0.89-0.99 = mild disability; 0.70-0.88 = moderate disability; <0.70 = severe disability.
F: Data were unreportable due to small sample size or high sampling variability
SOURCE: 2011-2012 SLNCC data (Statistics Canada).
Text Equivalent - Figure 1-6
The bar graph shows the Health Utilities Index - Mark 3 (HUI3) global score for each neurological condition under study. The HUI score can range from negative values to 1. A score of one indicates no disability, a score between 0.89 and 0.99 indicates mild disability, a score between 0.70 and 0.88 indicates moderate disability, and a score less than 0.70 indicates severe disability. On the graph, the horizontal axis shows the populations by neurological condition, and the vertical axis shows the HUI score, ranging from 0 to 1.
In general, almost all the HUI scores were under 0.70, indicating severe disability. Based on point estimates, only the HUI score for migraine (at 0.79) and Tourette syndrome (at 0.71) were in the moderate disability range. The lowest HUI score was for Alzheimer's disease and other dementias, at 0.21.
Data were from the 2011-2012 SLNCC from Statistics Canada. SLNCC stands for Survey on Living with Neurological Conditions in Canada. ALS stands for amyotrophic lateral sclerosis. Data were weighted to represent the Canadian population living with a neurological condition and were based on self- or proxy-report. F signals that the data were unreportable due to small sample size or high sampling variability.
The table lists the HUI global score for each of the neurological conditions under study:
| Neurological condition | HUI score |
|---|---|
| Full SLNCC sample | 0.71 |
| Alzheimer's disease and other dementias | 0.21 |
| ALS | F |
| Brain injury (traumatic) | 0.52 |
| Brain tumour | 0.57 |
| Cerebral palsy | 0.49 |
| Dystonia | 0.64 |
| Epilepsy | 0.67 |
| Huntington's disease | F |
| Hydrocephalus | 0.63 |
| Migraine | 0.79 |
| Multiple sclerosis | 0.55 |
| Muscular dystrophy | 0.49 |
| Parkinson's disease | 0.51 |
| Spina bifida | 0.66 |
| Spinal cord injury (traumatic) | 0.41 |
| Spinal cord tumour | 0.60 |
| Stroke | 0.49 |
| Tourette syndrome | 0.71 |
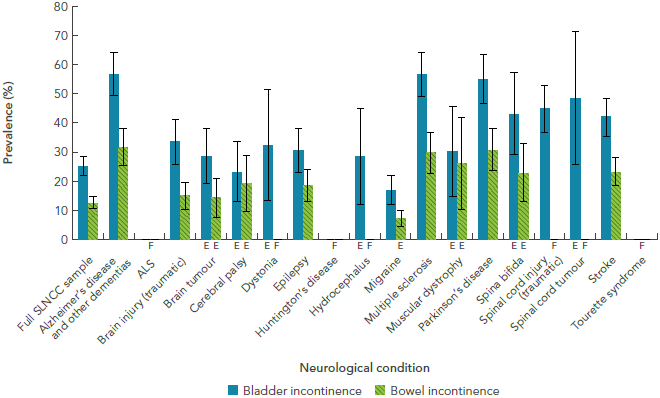
In addition to impairments measured by HUI-3 scores and its components, the SLNCC 2011-2012 Project [16] found that bladder and bowel incontinence was a frequent symptom for those with certain neurological conditions (Figure 1-7). The prevalence of bladder incontinence was greatest among those with Alzheimer’s disease and other dementias, multiple sclerosis, and Parkinson's disease. Moreover, this project also demonstrated that medication side effects also interfered with quality of life. Of the 51.9% of Canadians with a neurological condition who were taking medication for their condition, 29.7% reported medication side effects that affected their lives ‘moderately’ (23.8%), ‘quite a bit’ (17.4%), or ‘severely’ (7.1%) [16].
I'm self-employed and I’ve lost clients because of my condition.
~ Individual living with a neurological condition
FIGURE 1-7: Prevalence of bladder and bowel incontinence among respondents age 15+ years living with a neurological condition, Canada, 2011-2012, SLNCC 2011-2012 Project [16]
NOTES:-
SLNCC: Survey on Living with Neurological Conditions in Canada. Data were weighted to represent the Canadian population living with a neurological condition and were based on self- or proxy-report. The 95% confidence interval shows an estimated range of values which is likely to include the true prevalence 19 times out of 20.
ALS: Amyotrophic lateral sclerosis.
E: Interpret with caution; coefficient of variation between 16.6% and 33.3%.
F: Data were unreportable due to small sample size or high sampling variability
SOURCE: 2011-2012 SLNCC data (Statistics Canada).
Text Equivalent - Figure 1-7
The bar graph shows the prevalence of bladder and bowel incontinence for each neurological condition under study. Bladder and bowel incontinence are shown in separate categories. On the graph, the horizontal axis shows the populations by neurological condition, and the vertical axis lists the prevalence for these two categories.
Based on point estimates, bladder incontinence was always higher than bowel incontinence for every neurological condition. Self-reported bladder incontinence was highest for those with Alzheimer's disease and other dementias and multiple sclerosis (both at 56.8%), but was also high for those with Parkinson's disease (55.0%) and spinal cord tumour (48.5%). Self-reported bowel incontinence was highest for those with Alzheimer's disease and other dementias (31.7%) and was also high for those with Parkinson's disease (30.8%) and multiple sclerosis (29.7%).
Data were from the 2011-2012 SLNCC from Statistics Canada. SLNCC stands for Survey on Living with Neurological Conditions in Canada. ALS stands for amyotrophic lateral sclerosis. Data were weighted to represent the Canadian population living with a neurological condition and were based on self- or proxy-report. E signals that the reader should interpret the data with caution, because the coefficient of variation was between 16.6% and 33.3%. F signals that the data were unreportable due to small sample size or high sampling variability.
The table lists the prevalence of bladder and bowel incontinence for each of the neurological conditions under study:
| Neurological condition | Bladder incontinence (%) | Bowel incontinence (%) |
|---|---|---|
| Full SLNCC sample | 24.9 | 12.5 |
| Alzheimer's disease and other dementias | 56.8 | 31.7 |
| ALS | F | F |
| Brain injury (traumatic) | 33.6 | 15.0 |
| Brain tumour | 28.6 E | 14.1 E |
| Cerebral palsy | 23.1 E | 19.2 E |
| Dystonia | 32.2 E | F |
| Epilepsy | 30.6 | 18.5 |
| Huntington's disease | F | F |
| Hydrocephalus | 28.3 E | F |
| Migraine | 16.8 | 7.2 E |
| Multiple sclerosis | 56.8 | 29.7 |
| Muscular dystrophy | 30.1 E | 26.0 E |
| Parkinson's disease | 55.0 | 30.8 |
| Spina bifida | 43.2 E | 22.8 E |
| Spinal cord injury (traumatic) | 44.8 | F |
| Spinal cord tumour | 48.5 E | F |
| Stroke | 41.9 | 23.2 |
| Tourette syndrome | F | F |
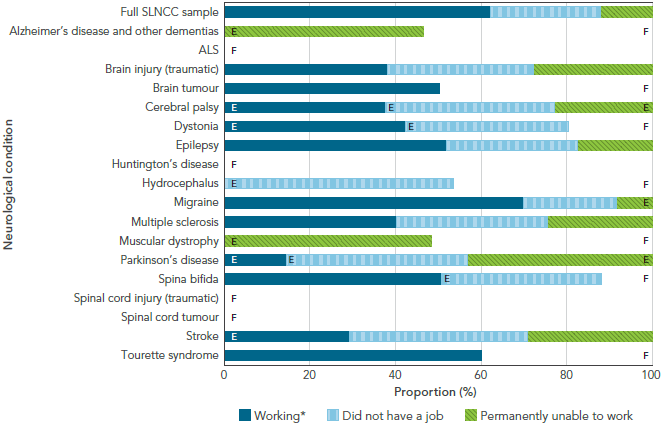
Having a neurological condition affects one’s ability to work. Based on findings from two national surveys, 8.1% of adults age 18 to 64 years with a neurological condition were permanently unable to work, compared with 1.7% among those without neurological conditions [3]. Excluding migraine, this proportion increased to a quarter (25.4%) of the working-age population living with a neurological condition being permanently unable to work. When age-standardized, the prevalence of permanent unemployment among those with a neurological condition was five times higher than in the population without neurological conditions, and 12 times higher when migraine was removed from analysis [3]. Figure 1-8 shows the wide variability in working status for Canadians age 18 to 64 years living with a neurological condition [16].
We couldn’t consider leaving our employment situations, as we had young family members and financial obligations. So we had to reduce our involvement in household activities or leisure pursuits in order to have sufficient energy to work full time.
~ LINC Project participant
FIGURE 1-8: Working status among respondents age 18 to 64 years living with a neurological condition, Canada, 2011-2012, SLNCC 2011-2012 Project [16]
NOTES:
SLNCC: Survey on Living with Neurological Conditions in Canada. Data were weighted to represent the Canadian population living with a neurological condition and were based on self- or proxy-report.
ALS: Amyotrophic lateral sclerosis.
E: Interpret with caution; coefficient of variation between 16.6% and 33.3%.
F: Data were unreportable due to small sample size or high sampling variability
*: 'Working' indicates respondent had a job or business in the last week.
SOURCE: 2011-2012 SLNCC data (Statistics Canada).
Text Equivalent - Figure 1-8
The bar graph shows the distribution of work status for Canadians age 18 to 64 years in each neurological condition under study. Work status is shown in three categories (working, did not have a job, and permanently unable to work). On the graph, the horizontal axis shows how the population is divided into these three categories and adds to 100%, and the vertical axis lists the populations by neurological condition.
Working indicated that the respondent had a job or business in the last week. Migraine has the most respondents in the working category, at 69.9%. Those with Parkinson's disease had the lowest proportion in the working category, at 14.6%. Of those who did not have a job in the past week, the highest proportion was seen in those with hydrocephalus, at 53.5%. Of those who were permanently unable to work, the highest proportion was seen in those with muscular dystrophy, at 48.5%.
Data were from the 2011-2012 SLNCC from Statistics Canada. SLNCC stands for Survey on Living with Neurological Conditions in Canada. ALS stands for amyotrophic lateral sclerosis. Data were weighted to represent the Canadian population living with a neurological condition and were based on self- or proxy-report. E signals that the reader should interpret the data with caution, because the coefficient of variation was between 16.6% and 33.3%. F signals that the data were unreportable due to small sample size or high sampling variability.
The table lists the distribution of work status by working, did not have a job, and permanently unable to work for each of the neurological conditions under study:
| Neurological condition | Working (%) | Did not have a job (%) | Permanently unable to work (%) |
|---|---|---|---|
| Full SLNCC sample | 62.1 | 26.0 | 12.0 |
| Alzheimer's disease and other dementias | F | F | 46.6 E |
| ALS | F | F | F |
| Brain injury (traumatic) | 38.2 | 34.1 | 27.8 |
| Brain tumour | 50.1 | F | F |
| Cerebral palsy | 37.9 E | 39.3 E | 22.9 E |
| Dystonia | 42.4 E | 38.0 E | F |
| Epilepsy | 51.9 | 30.6 | 17.5 |
| Huntington's disease | F | F | F |
| Hydrocephalus | F | 53.5 E | F |
| Migraine | 69.9 | 21.8 | 8.3 E |
| Multiple sclerosis | 40.2 | 35.1 | 24.7 |
| Muscular dystrophy | F | F | 48.5 E |
| Parkinson's disease | 14.6 E | 42.2 E | 43.2 E |
| Spina bifida | 50.7 | 37.7 E | F |
| Spinal cord injury (traumatic) | F | F | F |
| Spinal cord tumour | F | F | F |
| Stroke | 29.5 E | 41.4 | 29.4 |
| Tourette syndrome | 57.0 | F | F |
Having a neurological condition contributes to financial insecurity. A third (35%) of adults with a neurological condition surveyed in the LINC Project [9] reported that their family had experienced a financial crisis in the previous year, and 14% of those who were employed had been demoted or had taken a cut in pay.
1.2 Neurological conditions affect children and their families
The LINC Project [9] investigated the impact of neurological conditions on parents and their children. Based on a survey of 74 parents and subsequent interviews with 47 parents from a cohort study, this project provided insights on the experiences of children living with a neurological condition and those of their parents.
Having a neurological condition affects the quality of life of children. Children with a neurological condition obtained lower scores on a pediatric quality of life scale than children with other chronic conditions or without any of these conditions. Based on their parents’ assessment, the majority of children with a neurological condition had good general health. However, fewer parents reported that their child had good mental health, with about a third stating that their child’s mental health was ‘fair’ or ‘poor’.
Parents of children with neurological conditions repeatedly noted that they had to call in to work to say they were either going to be late or they were unable to report that day. The lack of predictability around their children’s needs added to the need for flexibility.
~ Project researcher
Children living with a neurological condition face barriers in daily living and future opportunities. In the LINC project [9], about 15% of children living with a neurological condition were described by their parents as housebound. Close to half of parents reported that their child required the use of assistive devices. Over 40% of parents felt that their child had limited educational opportunities.
Neurological conditions affect the quality of life of parents. The LINC Project [9] not only assessed the impact of neurological conditions on children, but also considered the impact on their parents. Parents largely reported good general and mental health, yet a third of interviewed parents reported having personally accessed mental health assistance. Altogether, close to a quarter of parents reported financial issues in the year prior to the survey, whether a financial crisis, pay cut or demotion, or the fact that caregiving impeded a parent’s ability to work outside the home. In spite of these difficulties, the majority of parents reported being satisfied with life.
Mothers felt they were forced to trade in their role as a financial contributor to the household for a role of full-time, unpaid caregiving.
~ Project researcher
1.3 Neurological conditions affect First Nations and Métis individuals in different facets of their lives
The Native Women’s Association of Canada (NWAC) Project [11] team performed a qualitative analysis of material obtained from interviews with 17 individuals with a neurological condition or their caregivers, 22 key informants, and 41 participants in four research circles. Aboriginal women were the target population of this project and, as a result, the majority of participants were women (69 women, 11 men). Overall, 65 participants were First Nations individuals, seven were Métis, and eight were non-Aboriginal individuals. No Inuit participants were interviewed.
It does affect the family and I think because pain is something that brings out anger a lot in everybody. We get angry because we’re always in pain, and they get angry because they don’t want to see it in their loved ones… there are certain things that we can’t control in life, and one of them is illness.
~ NWAC Project participant
The four interconnected categories of impacts identified in this project as occurring in the day-to-day lives of First Nations and Métis individuals were:
- Physical impacts: Pain, exhaustion, mobility impairment, dependence, and other physical symptoms such as dizziness, nausea, and tremors.
- Emotional impacts: Fear, anger, anxiety, loneliness, guilt, and helplessness.
- Cognitive or mental health impacts: Confusion and disorientation, short-term memory loss, and depression.
- Spiritual impacts: Spiritual impacts were identified in terms of how individuals used their spiritual-being to cope with other impacts, either as an individual coping with a neurological condition or as a caregiver. In some cases, their spiritual needs were not met; therefore, it was more challenging to use spirituality as a coping mechanism. Important aspects of spirituality were the teachings from their traditions, a positive attitude, access to traditional ceremonies (some participants noted difficulty in having such needs met at health care facilities), and seeking the advice and guidance of Elders (some participants noted difficulty in finding Elders to help them with their journey).
Aboriginal people are affected doubly by stigmatization. People mix stereotypes about neurological conditions and social conditions.
~ Physician
First Nations and Métis individuals, particularly women (as few men were included in the data collection), were affected by social and health inequities. Many participants suffered from multiple conditions (such as diabetes or cardiovascular diseases) in addition to their neurological condition, and this tended to augment the impacts they had to endure. The project team concluded that culturally relevant, patient-centred care that considers the whole person (including their other ailments) rather than specialized reductionist approaches to healing neurological conditions would likely result in better outcomes for First Nations and Métis individuals.
1.4 Neurological conditions affect informal caregiversFootnote 17
The interRAI Project [8] investigated the extent and impact of neurological conditions on informal caregivers of individuals in long-term care programs (home care and long-term facilities). For a third of individuals in a home care program, the caregiver (who often lived with the individual affected by a neurological condition and was often their spouse or child) provided assistance with daily living support for 22 or more hours per week. Among individuals in a home care program with ALS, 58% received this level of care.
People with a neurological condition don’t live in a vacuum – the impacts of these conditions hit their family and friends as well. We don’t talk about that often enough. Patients come with families, and we don’t do a very good job of caring for them.
~ Physician
The level of distress doubles when caring for an individual with a neurological condition. Distress was experienced by 28% of caregivers to individuals with a neurological condition, but only by 13% of caregivers to individuals without a neurological condition.Footnote 18
When you take on the role of a caregiver, you enter a life-altering mode. In one phase of your life, you are doing all sorts of wonderful things as a couple, and then in the next phase you are changing your spouse’s diaper. This quantum leap in relationships is burdened with all sorts of psychological and emotional overlays.
~ Informal caregiver
Caregiver distress is greater if the neurological condition is accompanied by cognitive impairment or behavioural issues. The caregivers of more than a third of residents with Alzheimer’s disease and other dementias and Huntington’s disease reported distress. The interRAI Project [8] also determined that the priority level assigned to an individual with a neurological condition, as determined by the interRAI ‘Method for Assigning Priority Levels’ (MAPLe) (used by case managers to determine the urgency of service requirements, regardless of type of care needed) also predicted the likelihood of caregiver distress.
1.5 Looking ahead: 2011 to 2031
Results from the Microsimulation Project [10], which are based on status quo assumptions,Footnote 19 project that:
- The average health status (as defined by HUI-3 scores) of Canadians living with the seven modelled neurological conditions will remain relatively stable over the next 20 years, with the global HUI-3 score being lowest for Alzheimer’s disease and other dementias and highest for epilepsy (but still remaining below the 0.7 threshold indicating severe disability).Footnote 20
- By 2031, more Canadians living with the seven modelled neurological conditions will experience severe disability. In particular, the number of Canadians living with Alzheimer’s disease and other dementias experiencing severe disability is projected to increase to the level seen for Canadians with hospitalized traumatic brain injury. However, hospitalized traumatic brain injury will continue to have the greatest number of individuals experiencing severe disability.
- Individuals who develop a neurological condition will experience a substantial number of years living with restricted health, more so than their counterparts without these conditions. Individuals born during the current decade (2010 to 2020) are projected to lose, on average, between 14 to 41 equivalent years of life living in full health (depending on the condition) (Table 1-1).
| Years of life in full health lost | ||
|---|---|---|
| Condition | Men | Women |
| Alzheimer's disease and other dementias | 16.0 | 15.2 |
| Brain injury (traumatic)Footnote † | 19.8 | 21.2 |
| Cerebral palsy | 33.2 | 41.3 |
| Epilepsy | 14.1 | 15.3 |
| Multiple sclerosis | 17.2 | 19.8 |
| Parkinson's disease/parkinsonism | 15.1 | 15.7 |
| Spinal cord injury (traumatic)Footnote † | 22.0 | 24.7 |
NOTES:
SOURCE: POHEM-Neurological (Statistics Canada and Public Health Agency of Canada). |
||
- In general, indirect economic costs due to working-age deaths (age 15 to 74 years) are projected to decrease. In contrast to the overall increase in the number of individuals living with a neurological condition, the proportion of deaths expected to occur during the working years will generally decrease. More specifically, the number of working-age deaths will decrease within the core workforce (age 15 to 64 years) and increase for older workers (age 65 to 74 years). As a result, projections show a complex pattern of deaths and derived indirect costs to the economy.
- The impact of working-age deaths on indirect economic costs varies by neurological condition – an increase is projected for Alzheimer’s disease and other dementias, a decrease is projected for spinal cord injury, and an initial increase then decrease is projected for the remaining conditions. Indirect economic costs due to premature death will be greatest for hospitalized traumatic brain injury ($63 million in 2011 and $49 million in 2031), followed by epilepsy ($41 million in 2011 and $32 million in 2031).
- Indirect economic costs due to working-age disability will increase, however. These costs will be greatest for hospitalized traumatic brain injury (rising from $7.3 billion in 2011 to $8.2 billion in 2031), followed by epilepsy (from $2.5 billion in 2011 to $2.8 billion in 2031).
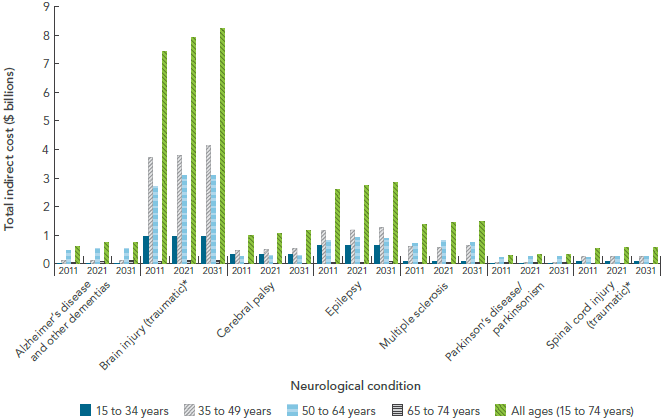
- The total indirect economic cost, which combines working-age premature death and disability, will increase for each neurological condition and will vary between $0.3 billion to $8.2 billion in 2031 (depending on the condition) (Figure 1-9).
FIGURE 1-9: Projected indirect economic costs due to working-age death and disability, by select neurological condition and age group, Canada, 2011, 2021, and 2031, Microsimulation Project [10]
NOTES:
* Traumatic brain and spinal cord injuries were based on hospitalized cases, and excluded injuries that did not present to hospital. Data were expressed in 2010 Canadian dollars.
SOURCE: POHEM-Neurological (Statistics Canada and Public Health Agency of Canada).
Text Equivalent - Figure 1-9
The bar graph is a complex display showing projected indirect economic costs over time, by age group, and for a selection of neurological conditions. These indirect economic costs are due to working-age death and disability. On the graph, the horizontal axis shows three concepts: first, there are seven neurological conditions (Alzheimer's disease and other dementias, brain injury, cerebral palsy, epilepsy, multiple sclerosis, Parkinson's disease/parkinsonism, and spinal cord injury). Second, for each neurological condition, three time periods are shown (2011, 2021, and 2031). Finally, for each time period, total indirect costs are presented for five age groups (15 to 34 years, 35 to 49 years, 50 to 64 years, 65 to 74 years, and 15 to 74 years). The vertical axis lists the total indirect costs.
Data were expressed in 2010 Canadian dollars. Brain injury had the highest total indirect economic costs, regardless of time period or age group. Relatively speaking, Parkinson's' disease/parkinsonism had the lowest total indirect economic costs, regardless of time or age group. Costs typically increased in age group until peaking in either the 35 to 49 or 50 to 64 year age group and then declining. Costs always increased over time.
Data were from the POHEM-Neurological modelling platform from Statistics Canada and Public Health Agency of Canada. Traumatic brain and spinal cord injuries were based on hospitalized cases, and excluded injuries that did not present to hospital.
The table lists the various total indirect costs over time and age group for each of the neurological conditions under study:
FIGURE 1-9: Projected indirect economic costs due to working-age death and disability, by select neurological condition and age group, Canada, 2011, 2021, and 2031, Microsimulation Project [10]
| Age group | Calendar year | ||
|---|---|---|---|
| 2011 | 2021 | 2031 | |
| 15 to 34 years | $0 | $0 | $0 |
| 35 to 49 years | $112,844,799 | $109,254,395 | $116,592,572 |
| 50 to 64 years | $447,333,517 | $534,219,873 | $511,483,343 |
| 65 to 74 years | $47,275,142 | $73,503,213 | $94,501,057 |
| All ages (15 to 74 years) | $607,453,458 | $716,977,481 | $722,576,972 |
| Age group | Calendar year | ||
|---|---|---|---|
| 2011 | 2021 | 2031 | |
| 15 to 34 years | $934,678,114 | $939,983,298 | $926,658,200 |
| 35 to 49 years | $3,723,046,415 | $3,793,292,910 | $4,114,091,772 |
| 50 to 64 years | $2,688,389,415 | $3,069,458,281 | $3,063,140,697 |
| 65 to 74 years | $56,828,931 | $89,363,545 | $114,425,932 |
| All ages (15 to 74 years) | $7,402,942,874 | $7,892,098,034 | $8,218,316,601 |
| Age group | Calendar year | ||
|---|---|---|---|
| 2011 | 2021 | 2031 | |
| 15 to 34 years | $292,816,305 | $295,626,412 | $305,069,532 |
| 35 to 49 years | $451,180,875 | $478,549,848 | $534,184,671 |
| 50 to 64 years | $235,818,246 | $279,414,212 | $290,606,116 |
| 65 to 74 years | $3,540,606 | $6,069,898 | $8,173,856 |
| All ages (15 to 74 years) | $983,356,032 | $1,059,660,369 | $1,138,034,175 |
| Age group | Calendar year | ||
|---|---|---|---|
| 2011 | 2021 | 2031 | |
| 15 to 34 years | $614,204,025 | $612,906,709 | $617,705,276 |
| 35 to 49 years | $1,144,520,510 | $1,170,306,145 | $1,266,888,342 |
| 50 to 64 years | $792,668,655 | $890,004,020 | $886,515,608 |
| 65 to 74 years | $26,446,697 | $42,059,342 | $53,069,580 |
| All ages (15 to 74 years) | $2,577,839,888 | $2,715,276,216 | $2,824,178,807 |
| Age group | Calendar year | ||
|---|---|---|---|
| 2011 | 2021 | 2031 | |
| 15 to 34 years | $48,887,361 | $53,246,136 | $50,649,314 |
| 35 to 49 years | $591,143,646 | $571,488,147 | $633,061,104 |
| 50 to 64 years | $695,644,896 | $784,350,716 | $741,508,085 |
| 65 to 74 years | $16,277,843 | $24,209,523 | $30,509,618 |
| All ages (15 to 74 years) | $1,351,953,746 | $1,433,294,522 | $1,455,728,121 |
| Age group | Calendar year | ||
|---|---|---|---|
| 2011 | 2021 | 2031 | |
| 15 to 34 years | $0 | $0 | $0 |
| 35 to 49 years | $32,119,356 | $30,629,460 | $34,712,133 |
| 50 to 64 years | $205,874,102 | $244,042,356 | $231,347,677 |
| 65 to 74 years | $20,854,230 | $30,975,246 | $39,453,987 |
| All ages (15 to 74 years) | $258,847,688 | $305,647,063 | $305,513,797 |
| Age group | Calendar year | ||
|---|---|---|---|
| 2011 | 2021 | 2031 | |
| 15 to 34 years | $61,869,283 | $64,486,818 | $63,457,105 |
| 35 to 49 years | $238,995,891 | $233,205,547 | $251,351,490 |
| 50 to 64 years | $199,516,671 | $233,241,232 | $227,326,624 |
| 65 to 74 years | $4,719,765 | $7,380,615 | $9,491,829 |
| All ages (15 to 74 years) | $505,101,611 | $538,314,213 | $551,627,049 |
1.6 Knowledge gaps
While generating a wealth of new information pertaining to the impacts of neurological conditions, the Study also pointed to gaps that may guide future research endeavours. The synthesis of Study findings identified knowledge gaps in the impacts of neurological conditions on:
- Canadians living in varying social and economic situations;
- First Nations, Inuit, and Métis individuals, with a need for fulsome representation of each of these Aboriginal groups;Footnote 21
- Children, both those affected by a neurological condition and those living with an affected parent or sibling;
- Formal caregivers for individuals with severe, debilitating neurological conditions;
- Canadians who were excluded from surveys such as the CCHS and the SLNCC;Footnote 22 and
- Canadians with less prevalent neurological conditions, such as those outside the scope of this Study or those affected by less common conditions such as ALS, Huntington’s disease, and dystonia.
Maximizing the use of existing data collection processes (such as those identified by the interRAI Project [8] or other processes not presented in this report like the functional scale of the Système de mesures de l’autonomie fonctionnelle)Footnote 23 or incorporating data on the impacts of neurological conditions into existing national data resources (such as the Canadian Longitudinal Study on Aging [5],Footnote 24 health administrative data [2], or electronic medical record networks [6]) could help address some of these gaps in pan-Canadian data on the impacts of neurological conditions.
1.7 Key themes
In this chapter on the impacts of neurological conditions in Canada, it was noted that:
- Individuals with different neurological conditions share many of the same impacts. This means that the functional needs of the affected individual may be consistent, to varying degrees, across conditions.
- The manifestations of neurological conditions, which are often progressive, vary with the stage of the condition as well as the age of the affected individual.
- Neurological conditions impose significant impacts on the well-being and financial security of individuals with the condition, their caregivers, and the community.
- The capacity of individuals to respond to the disabilities associated with their neurological condition can be influenced by social determinants of health, such as their economic situation, educational status, or access to community resources.
- In particular, financial insecurity and cognitive impairment are major barriers to self-efficacy and self-management for Canadians living with a neurological condition.
- Stigmatization can be a substantial additional burden for those with a neurological condition.
- First Nations and Métis individuals experience unique impacts of neurological conditions, in addition to the impacts encountered by non-Aboriginal individuals.
Microsimulation modelling of seven neurological conditions projects that by 2031:
- An increased number of Canadians will experience severe disability, based on a validated HUI-3 score of their health status.
- Individuals with each of the modelled conditions will experience more years of restricted health than their counterparts without these conditions.
- The combined indirect economic cost based on both working-age premature death and disability will increase for each of the modelled neurological conditions.