
Meeting between Patrick Borbey, PSC President, and Darlene Heather Carreau, Chief Administrator of the Courts Administration Service
*Information valid as of February, 2021
Introduction
Deputy Head
Ms. Darlene Heather Carreau was appointed as the Chief Administrator of the Courts Administration Service (CAS), on December 21, 2020.
Ms. Carreau is exercising the Public Service Commission’s (PSC) authority for the first time as Deputy Head (DH). A copy of the New Direction in Staffing (NDS) highlights for DHs is attached as Annex A.
Organizational Context
Mandate
CAS provides services to the Federal Court of Appeal, the Federal Court, the Court Martial Appeal Court of Canada and the Tax Court of Canada. CAS is responsible for meeting the courts' requirements and ensuring public access to both the courts and their records. The following are a few examples of specific functions:
- providing litigants and their counsel with services relating to court hearings;
- informing litigants on rules of practice, court directives and procedures;
- maintaining court records;
- processing documents filed by or issued to litigants, and recording all proceedings; and
- serving as a depository to allow for the enforcement of decisions made by the courts and federal administrative tribunals, such as the Canada Industrial Relations Board and Canadian Human Rights Tribunal.
Challenges
During the current pandemic crisis, CAS has maintained its regular staffing activities as its services are considered essential to maintaining the operation of the Federal Court of Appeal, Court Martial Appeal Court of Canada, and Tax Court. In addition, CAS continued their yearly recruitment of University graduates for their Law Clerk Program. Under this initiative, graduates of law programs can be appointed to an 11-month term position to work under the direction of Judges in Courts. Recruitment under this program must be conducted every year to attract the best talent from top Universities around the world. To support the unique needs of this program, while ensuring compliance with all legislated requirements, the PSC implemented an administrative arrangement with CAS for the consideration of persons with a priority entitlement.
Population and Staffing Activities
Population
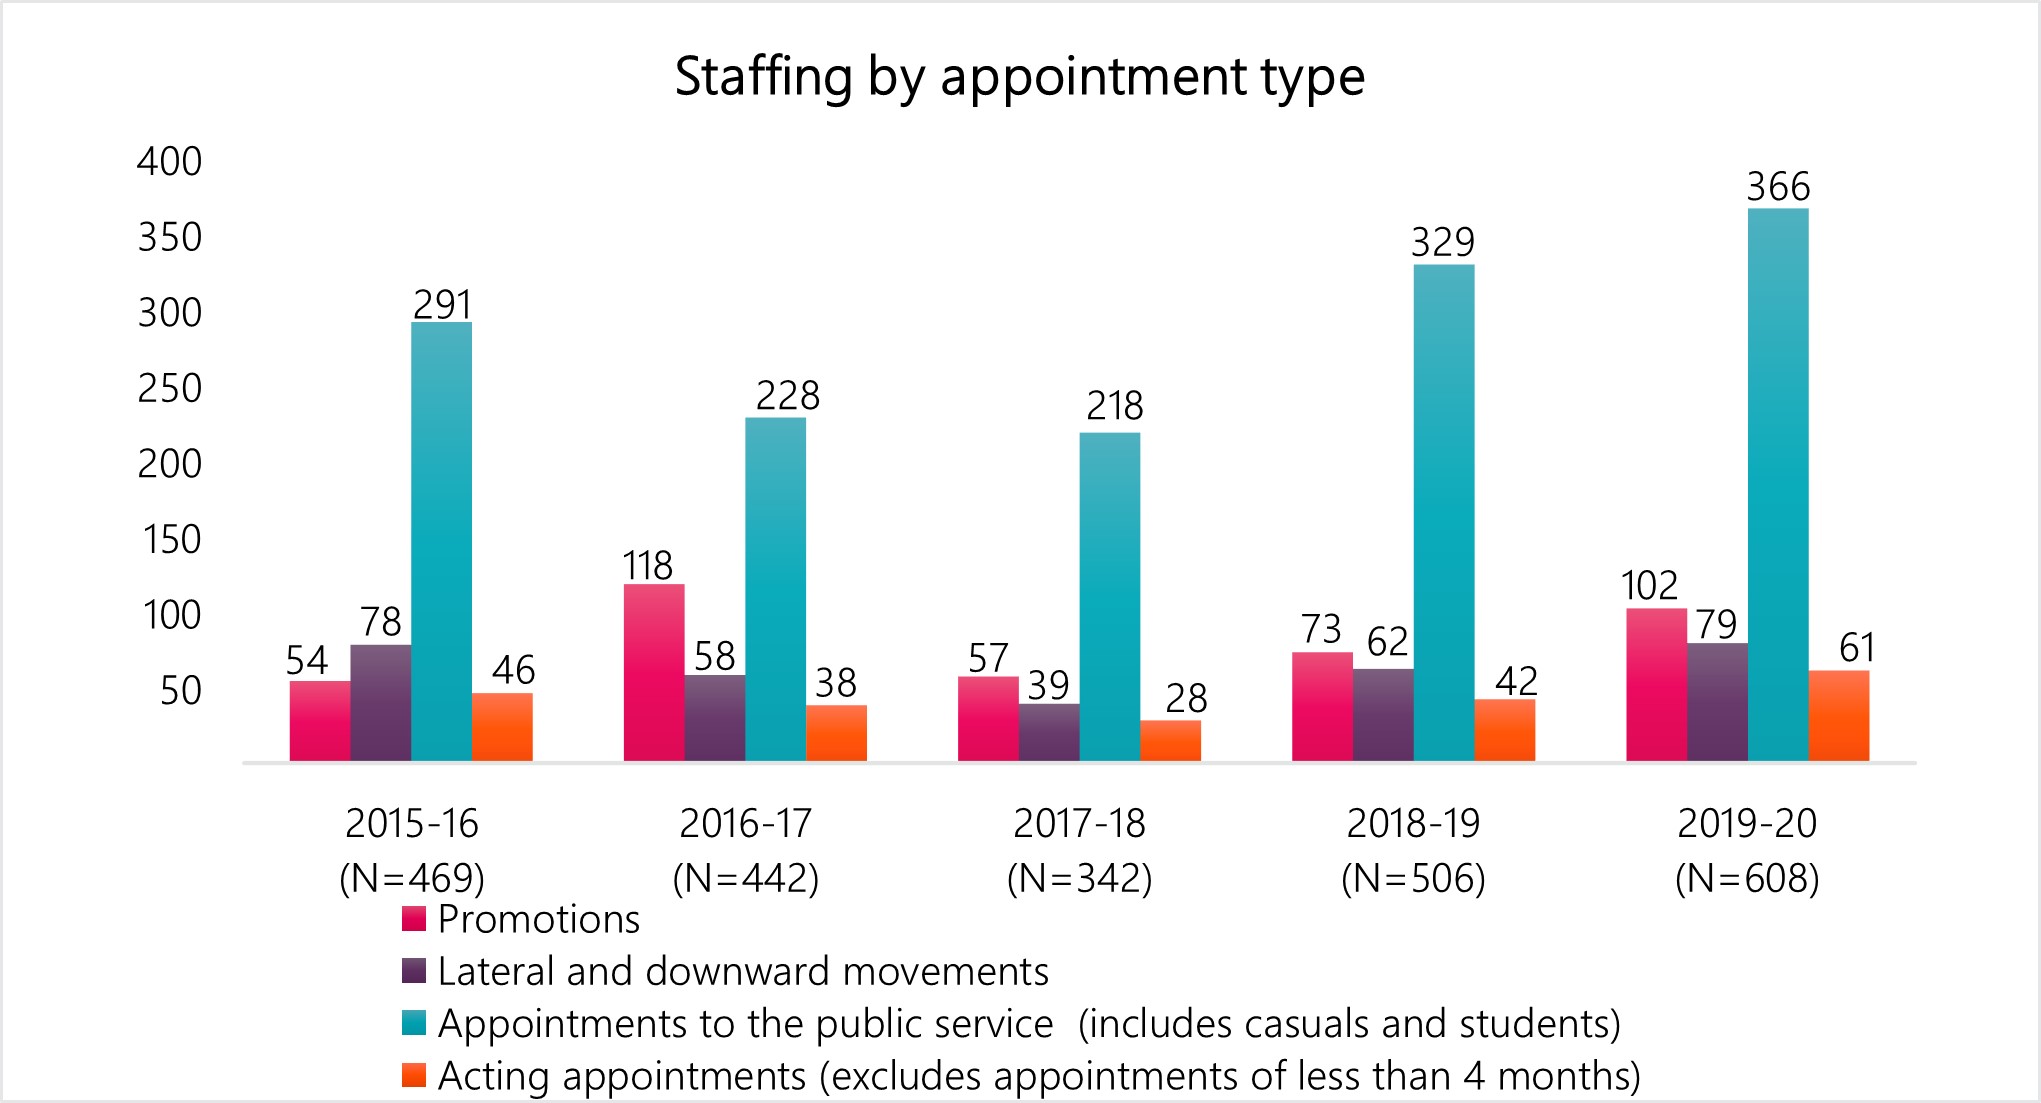
CAS is a medium-size organization that has a population of 790 employees (as of March 31, 2020). In the 2019-2020 fiscal year, it performed 608 staffing actions.
Staffing Activities
In 2019-2020, CAS proceeded with a total of 608 staffing activities:
- 366 appointments to the public service (including casuals and students);
- 102 promotions;
- 61 acting appointments; and
- 79 lateral and downward movements.
Please refer to Annex B for additional details on staffing activities.
Time to Staff
There is insufficient data to provide time to staff results for internal or external staffing processes at CAS.
Staffing Framework
New Direction in Staffing Implementation
CAS’s staffing policies were updated in 2016-2017 to reflect some of the changes brought by the NDS. CAS continued its policy review work in 2017-2018, by adopting a new Staffing Monitoring Framework.
Appointment Delegation and Accountability Instrument Annex D Reporting
Use of the Public Service Official Languages Exclusion Approval Order and the Public Service Official Languages Appointment Regulations
In 2019-2020, CAS reported exclusions under the Public Service Official Languages Exclusion Approval Order and Public Service Official Languages Appointment Regulations that were still within the initial two-year period to become bilingual.
Approved Deputy Head Exceptions to the National Area of Selection Requirements for an External Advertised Appointment Process
In 2019-2020, CAS reported that they had not used any DH exceptions to the National Area of Selection.
Results of Organizational Cyclical Assessment
CAS has until October 1st, 2021 to report their first cyclical assessment results to the PSC.
Inquiries and Trends
CAS has made 24 inquiries to the Staffing Support Advisor since April 1, 2020. Questions were concerning clarification of staffing requirements and guidance on how to prepare their cyclical assessment.
Oversight
Audits
Past Audits
CAS was among the departments and agencies selected for the pilot System-Wide Staffing Audit (SWSA) that was published in 2018. SWSA was a review of system-wide compliance in staffing. In all, 25 departments and agencies participated in the audit, providing a sample of 386 appointments; 5 of these appointments were from CAS. The audit report can be found at the following hyperlink: https://www.canada.ca/en/public-service-commission/services/publications/results-system-wide-staffing-audit.html#l.
Current Audits
CAS was among the 30 organizations selected for the Audit of Employment Equity Representation in Recruitment that was recently completed. The objective of the Audit was to determine whether the four designated employment equity groups were proportionately represented in recruitment processes and to identify key factors that influence representation in the appointment system among the four designated employment equity groups. The audit report was published in January 2021.
Investigations
| Nature of Issue | Cases Received | Cases Referred by Organization | Closed - Not Accepted | Completed Unfounded | Completed Founded | Ongoing |
|---|---|---|---|---|---|---|
| s.66 External Appointments (Merit, Error, Omission, Improper Conduct) | 9 | 0 | 2 | 0 | 0 | 7 |
| s.69 Fraud | 7 | 3 | 4 | 3 | 3 | 0 |
| s.118 Improper Political Activities - Employees | 1 | 0 | 1 | 0 | 0 | 0 |
| Total | 17 | 3 | 7 | 3 | 3 | 7 |
Note: The numbers may not add up as discontinued cases, and cases resolved via early intervention are not included in this table.
There were three founded investigations from January 8, 2020 to January 8, 2021:
- In two of these investigations, an employee committed fraud by knowingly providing false information regarding their education in two appointment processes conducted by CAS.
- The third investigation was concerning an employee who committed fraud by submitting a job application containing false information about their work experience in an appointment process conducted by CAS.
- The ordered corrective actions in all three founded investigations included that the appointment of both employees, made as a result of these appointment processes, be revoked. In addition, the employees must notify the Commission before accepting any position or work within the federal public service, and before accepting work through casual employment, for a period of three years.
Staffing and Non-Partisanship Survey Results
45.2% of CAS employees completed the 2018 Staffing and Non-Partisanship Survey, compared to 47.6% for the public service in general. Below are key findings from CAS’s 2018 Staffing and Non-Partisanship Survey results:
- 61.8% of employees agreed that people hired can do the job, compared to 67.6% in organizations of similar size, and 53.8% in the federal public service.
- 74.0% of managers agreed that the New Direction in Staffing has improved the way they hire and appoint persons to and within their organization, compared to 69.4% in organizations of similar size, and 56.1% in the federal public service.
- 68.1% of managers agreed that within their organization, the administrative process to staff a position is burdensome, compared to 84.0% in organizations of similar size, and 87.9% in the federal public service.
Diversity Profile
As presented in the table below, there are gaps for Aboriginal peoples and persons with disabilities.
| Designated Group | Public Service Work Force Availability (WFA) |
CAS EE data 2018-2019 |
CAS EE data 2017-2018 |
Representation across the Public Service of Canada |
|---|---|---|---|---|
| Women | 52.7% | 64.9% | 66.3% | 54.8% |
| Aboriginal Peoples | 4.0% | 2.4% | 3.7% | 5.1% |
| Persons with Disabilities | 9.0% | 6.3% | 6.2% | 5.2% |
| Members of Visible Minorities | 15.3% | 20.4% | 17.8% | 16.7% |
Source: Employment Equity in the Public Service of Canada 2018-2019, and Employment Equity in the Public Service of Canada 2017-2018, Treasury Board of Canada Secretariat
Priority Entitlements and Veterans
Appointments of Persons with a Priority Entitlement
From April 1, 2019 to January 7, 2021, CAS appointed one person with a priority entitlement (PPE) indeterminately who was one of their own PPEs.
Appointments of Persons with a Canadian Armed Forces Priority Entitlement
From the coming into force of the Veterans Hiring Act on July 1, 2015 until January 4, 2021, CAS has not made any appointments of persons with a Canadian Armed Forces priority entitlement.
Priority Clearance Requests
From April 1, 2019 to January 7, 2021, CAS submitted 315 priority clearance requests.
| Priority Clearance Type | Amount | Percentage |
|---|---|---|
Internal advertised processes
|
63 | 20% |
| Internal non-advertised processes | 71 | 22.5% |
External advertised processes
|
101 | 32% |
| External non-advertised processes | 56 | 17.8% |
| Appointment of persons with a priority entitlement (includes term and indeterminate appointments) | 1 | 0.3% |
| Student bridging | 22 | 7% |
| Section 43 | 1 | 0.3% |
| Total | 315 | 100% |
Source: Priority Information Management System
COVID-19 Related Priority Clearance Requests
Since March 11, 2020, CAS has submitted one priority clearance request related to COVID-19 to the PSC.
Persons with a Priority Entitlement
CAS had six persons with a priority entitlement activated in the Priority Information Management System (PIMS) on January 13, 2021:
| Priority Entitlement Type | Amount |
|---|---|
| Leave of Absence Returnee/Replacement | 4 |
| Relocation of Spouse or Common-law Partner | 2 |
| Total | 6 |
Non-Partisanship in the Public Service
Since 2006-2007, the PSC received two candidacy requests from the same CAS employee:
- In 2016-2017, permission was granted to the employee to seek nomination as, and be a candidate, in a provincial by-election.
- In 2019-2020, a request for candidacy in a provincial by-election was submitted, however the employee withdrew before the PSC rendered its decision.
2018 Staffing and Non-partisanship Survey results related to political activities:
- 4.9% of the respondents indicated that they engaged in political activities (other than voting or seeking political candidacy) between January 1 and December 31, 2017, which is significantly higher than the Public Service in general (2.4%).
- 82.7% of the respondents indicated that they are aware of their rights and obligations for engaging in political activities to a moderate and great extent, which is slightly higher than the Public Service in general (80.1%).
General awareness sessions on political activities and non-partisanship for employees can be delivered upon request. The CAS Designated Political Activities Representative (DPAR) is Adèle Anderson, Chief, Workplace Management. The DPAR acts as a liaison with the PSC on matters related to political activities and non-partisanship.
Public Service Commission Initiatives
CAS requested the help of the Personnel Psychology Centre to support their talent management program. A service agreement was put in place to provide specialized assessment, coaching and executive counselling services. The objective is to promote greater self-awareness and targeted learning in order to develop the leadership potential of managers and executives.
Recruitment Programs
Federal Internship Program for Canadians with Disabilities
CAS is currently not participating in the Federal Internship Program for Canadians with Disabilities (FIPCD). The FIPCD is an excellent initiative to contribute to the Government of Canada’s Accessibility Strategy by having an intern and supporting them in skill development to increase their employability. The program also offers for a 50% salary reimbursement to hiring departments for the duration of the internship period. In addition, the PSC provides guidance on possible training opportunities offered by schools and associations.
Should CAS wish to hire interns, they may contact the PSC to explore this option at: cfp.diversitedetalent-talentdiversity.psc@canada.ca
Employment Opportunity for Students with Disabilities / Indigenous Student Employment Opportunity
Since January 1, 2020, CAS has submitted 1 request for the referral of students with disabilities, and 1 request for Indigenous students through Federal Student Work Experience Program (FSWEP). The Employment Opportunity for Students with Disabilities (EOSD) and Indigenous Student Employment Opportunity (ISEO) are excellent recruitment options to increase diversity in the workplace by hiring students living with disabilities or indigenous students. Managers and students are provided with resources, such as onboarding tools, training, and networking events. The candidates from both these initiatives are available year-round in the FSWEP ongoing inventory.
- Number of available students in EOSD: 4424Footnote 1
- Number of available students in ISEO: 2211Footnote 2
Federal Student Work Experience Program
CAS has submitted 15 requests for referrals from FSWEP since January 2020. This program remains an excellent way for an organization to renew its workforce and bring new energy, ideas and approaches to its workplace. The number of available students in this program is 84,744Footnote 3.
Post-Secondary Recruitment
CAS has submitted 10 requests for referrals from the Post-Secondary Recruitment inventories in 2020.
Participation in initiatives related to the hiring of Indigenous Peoples
CAS is currently not participating in any initiatives related to the hiring of Indigenous Peoples. The PSC’s Aboriginal Centre of Expertise and the Treasury Board Secretariat’s Office of the Chief Human Resources Officer have developed an Indigenous Career Pathways (ICP) that may be of interest to CAS. It provides information on indigenous recruitment, career progression, as well as development and retention:
- The Inventory of Indigenous Applicants facilitates the matching between hiring managers and candidates by sourcing Indigenous talents from existing inventories of the PSC and proactively promoting their profiles to federal organizations.
- The Indigenous Recruitment Toolkit provides a repository of tools, resources and advice on indigenous recruitment, outreach and initiatives that PSC and other departments offer.
- The ICP was officially launched in OCHRO’s newsletter of November 2020 and an event was held on December 11, 2020 in collaboration with the Canada School of Public Service (CSPS). 1,233 participants attended the webcast, which the CSPS has called the largest Indigenous tailored event in 2020.
Staffing Support
Public Service of Commission Representatives and Organizational Contacts
The Staffing Support Advisor assigned to this organization is Daniel Morin. The primary organizational contact is Richard Vallée, Chief, Workforce Management, and the Head of HR is Vicky Lefebvre, Executive Director (Finance and Human Resources).
PREPARED BY:
Daniel Morin
Staffing Support Advisor
APPROVED BY:
Lynn Brault
Director General, Staffing Support, Priorities and Political Activities Directorate
Policy and Communications Sector
Patricia Jaton
Vice-President
Policy and Communications Sector
Annexes:
- Annex A – The New Direction in Staffing (NDS) highlights for DHs
- Annex B - Data on Population and Staffing Activities
Annex A
A New direction in Staffing – A merit-based system that is effective, efficient and fair
Appointment Policy
New focus on core requirements to provide sub-delegated persons greater discretion in making an appointment
- One Appointment Policy, no duplication with legal requirements
- Broader focus on values-based system, away from rules-based system
- Appointments Policy supported by streamlined guidance:
- A roadmap to the requirements in legislation, regulations and policy
- Options and considerations for decision-making where there is discretion
- Clear expectations for priority entitlements
- No restrictions to assessment methods for EX appointments
- Exceptions to National Area of Selection approved by deputy head
Delegation
- New ability to customize organizational staffing system based on unique context and evolving business needs
- Deputy head establish a direction on the use of advertised and non-advertised appointment processes
- Deputy heads to establish requirement(s) for sub-delegated persons to articulate, in writing, their selection decision
- Clarity on requirements related to investigations
- Attestation form to reinforce the accountabilities of sub-delegated persons
All PSC monitoring and reporting requirements now found in the Appointment Delegation and Accountability Instrument
Monitoring and Reporting
Monitoring built by organizations, targeted to their needs
- Annual Departmental Staffing Accountability Report no longer required
- Annual reporting to the PSC limited to:
- Use of Public Service Official Language Exclusion Approval Order
- Exceptions to the National Area of Selection approved by the deputy head
- Results of any internal investigations
- Actions taken following any PSC investigations or audits.
- Deputy head responsible for ongoing monitoring of organizational staffing system based on the organization’s unique context
- Assessment of adherence to requirements, based on organization’s own risks, at the minimum every five years
PSC Oversight
System wide-focus
- Government-wide compliance audit every two years
- Renewed Survey of Staffing administered in alternating years with government-wide audit
- System-wide effectiveness and efficiency reviews to support continuous improvement
- Targeted PSC audits as a result of identified system-wide or organizational risks or at the deputy head request
- Investigations conducted when there is a reason to believe there was political influence, fraud or improper conduct in an appointment process
This document should be read in conjunction with the Public Service Employment Act, the Public Service Employment Regulations, the PSC Appointment Policy and the PSC Appointment Delegation and Accountability Instrument.
Annex B
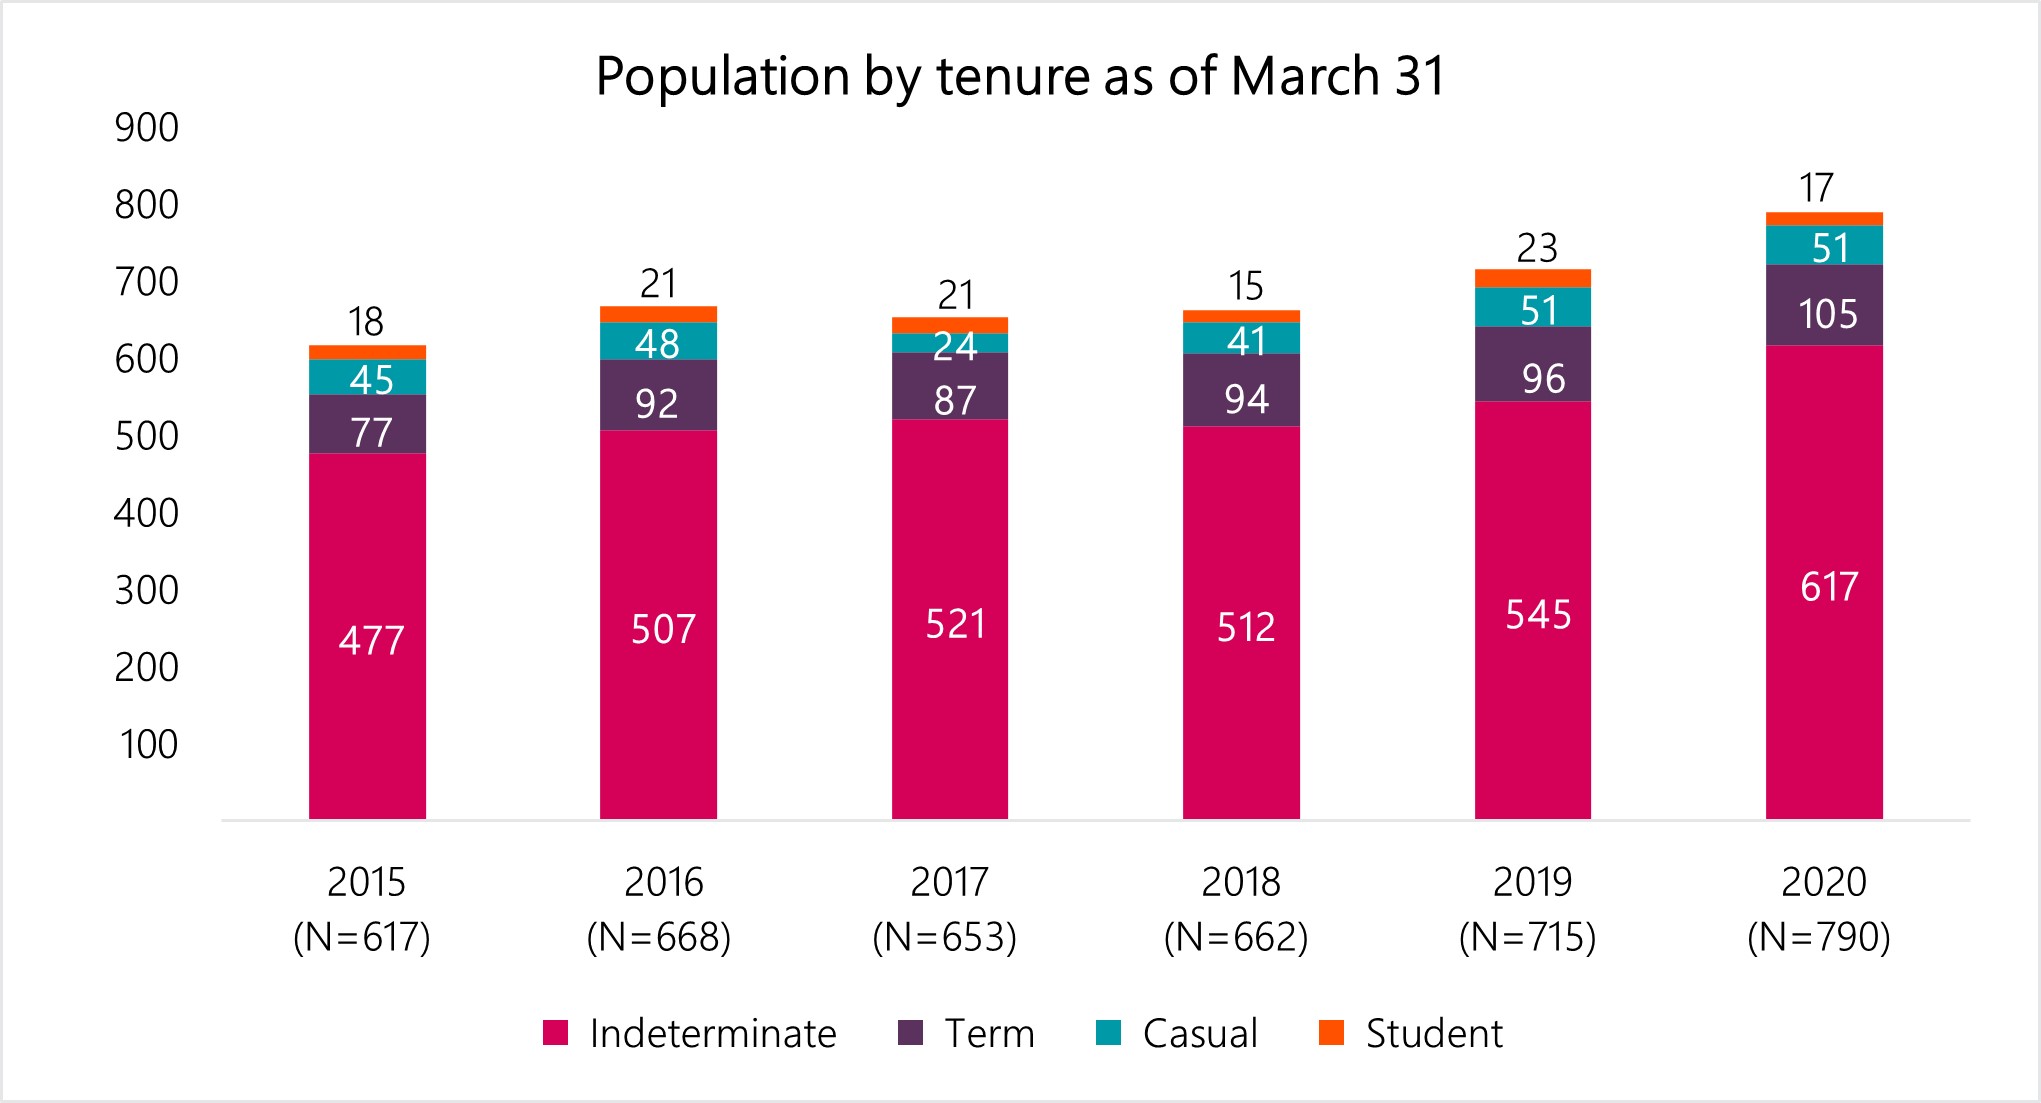
Population by tenure as of March 31
Figure 1 - Population by tenure as of March 31
Text version
| Year | Indeterminate population | Term population | Casual population | Student population | Total population |
|---|---|---|---|---|---|
| As of March 31, 2015 | 477 | 77 | 45 | 18 | 617 |
| As of March 31, 2016 | 507 | 92 | 48 | 21 | 668 |
| As of March 31, 2017 | 521 | 87 | 24 | 21 | 653 |
| As of March 31, 2018 | 512 | 94 | 41 | 15 | 662 |
| As of March 31, 2019 | 545 | 96 | 51 | 23 | 715 |
| As of March 31, 2020 | 617 | 105 | 51 | 17 | 790 |
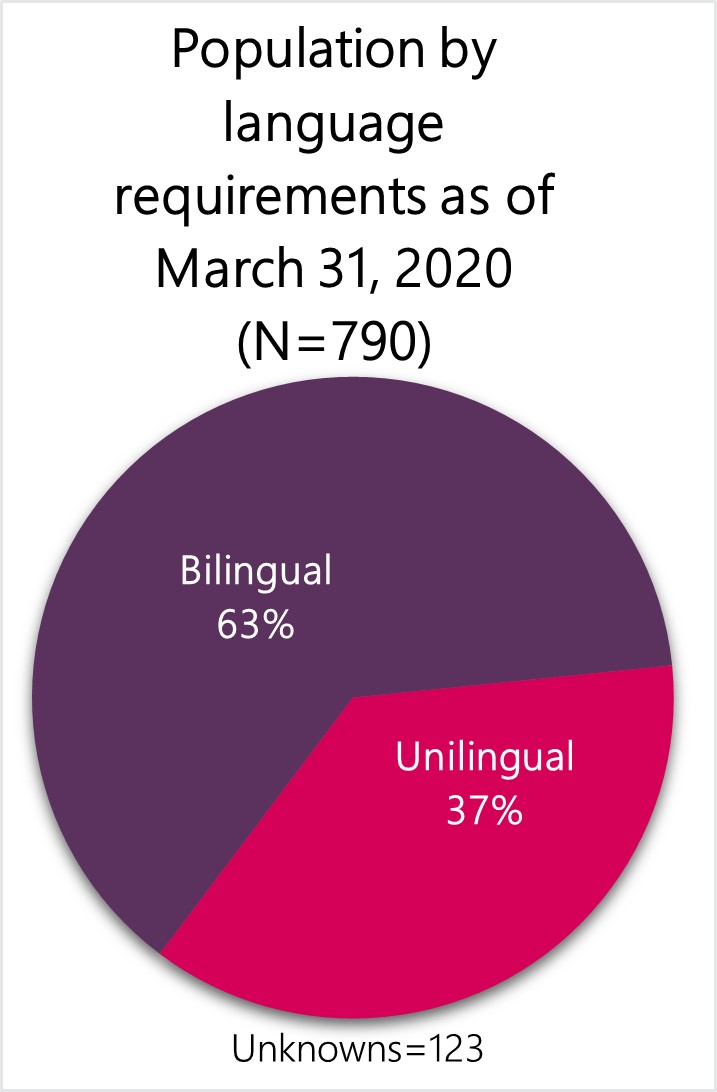
Population by language requirements as of March 31, 2020
Figure 2 - Population by language requirements as of March 31, 2020
Text version
| Linguistic requirements of the position | Population as of March 31, 2020 | Percentage of population as of March 31, 2020 |
|---|---|---|
| Bilingual | 421 | 63% |
| Unilingual | 246 | 37% |
| Unknowns | 123 | 0% |
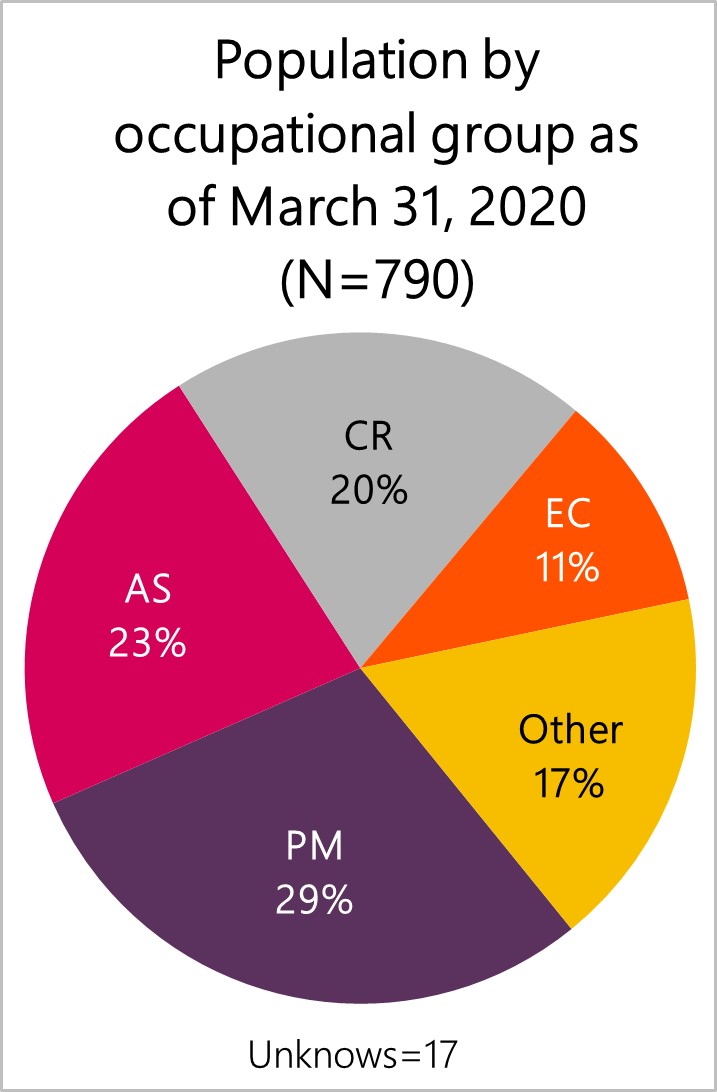
Population by occupational group as of March 31, 2020
Figure 3 - Population by occupational group as of March 31, 2020
Text version
| Occupational group | Population as of March 31, 2020 | Percentage of population as of March 31, 2020 |
|---|---|---|
| PM – Programme Administration | 226 | 29% |
| AS – Administrative Services | 174 | 23% |
| CR – Clerical and Regulatory | 156 | 20% |
| EC – Economics and Social Science Services | 82 | 11% |
| Other | 135 | 17% |
| Unknowns | 17 | 0% |
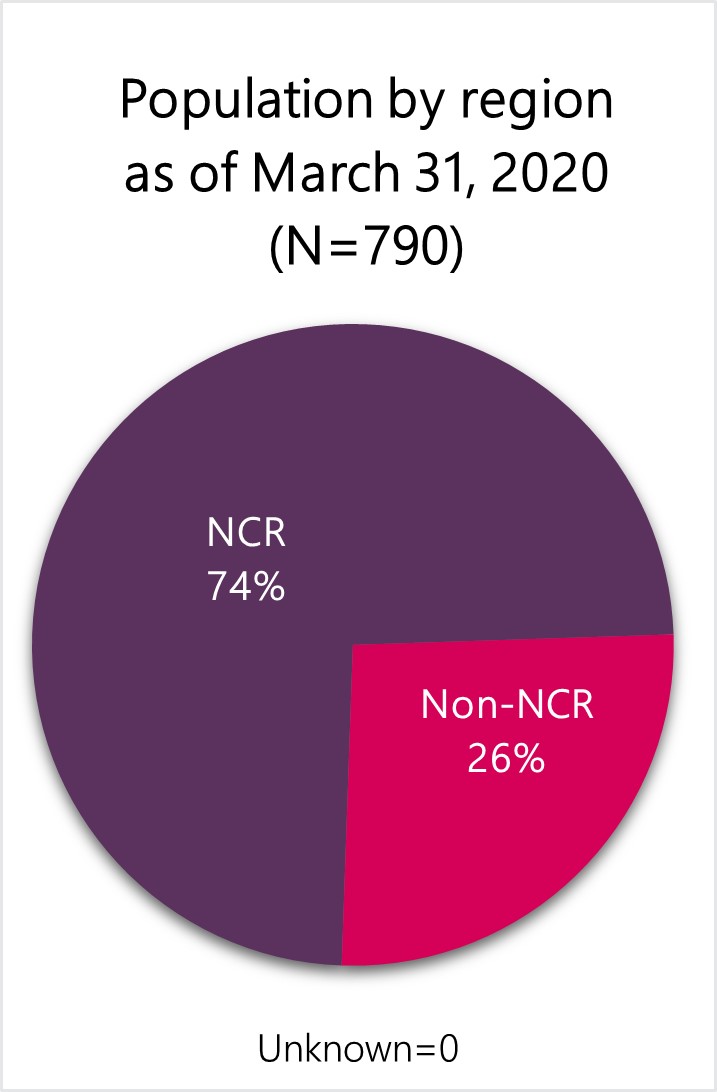
Population by region as of March 31, 2020
Figure 4 - Population by region as of March 31, 2020
Text version
| Region | Population as of March 31, 2020 | Percentage of population as of March 31, 2020 |
|---|---|---|
| National Capital Region (NCR) | 584 | 74% |
| Non-NCR | 206 | 26% |
| Unknown | 0 | 0% |
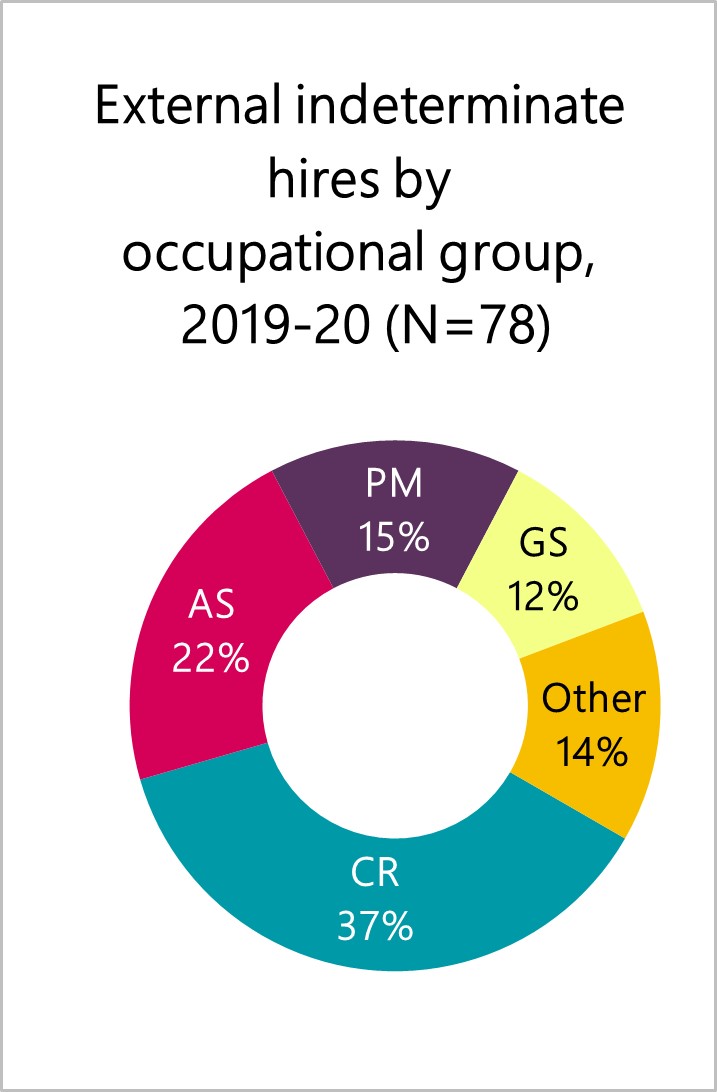
External indeterminate hires by occupational group, 2019-2020
Figure 5 - External indeterminate hires by occupational group, 2019-20
Text version
| Occupational group | Number of indeterminate hiring activities | Percentage of all indeterminate hiring activities |
|---|---|---|
| CR – Clerical and Regulatory | 29 | 37% |
| AS – Administrative Services | 17 | 22% |
| PM – Programme Administration | 12 | 15% |
| GS – General Services | 9 | 12% |
| Other | 11 | 14% |
| Total | 78 | 100% |
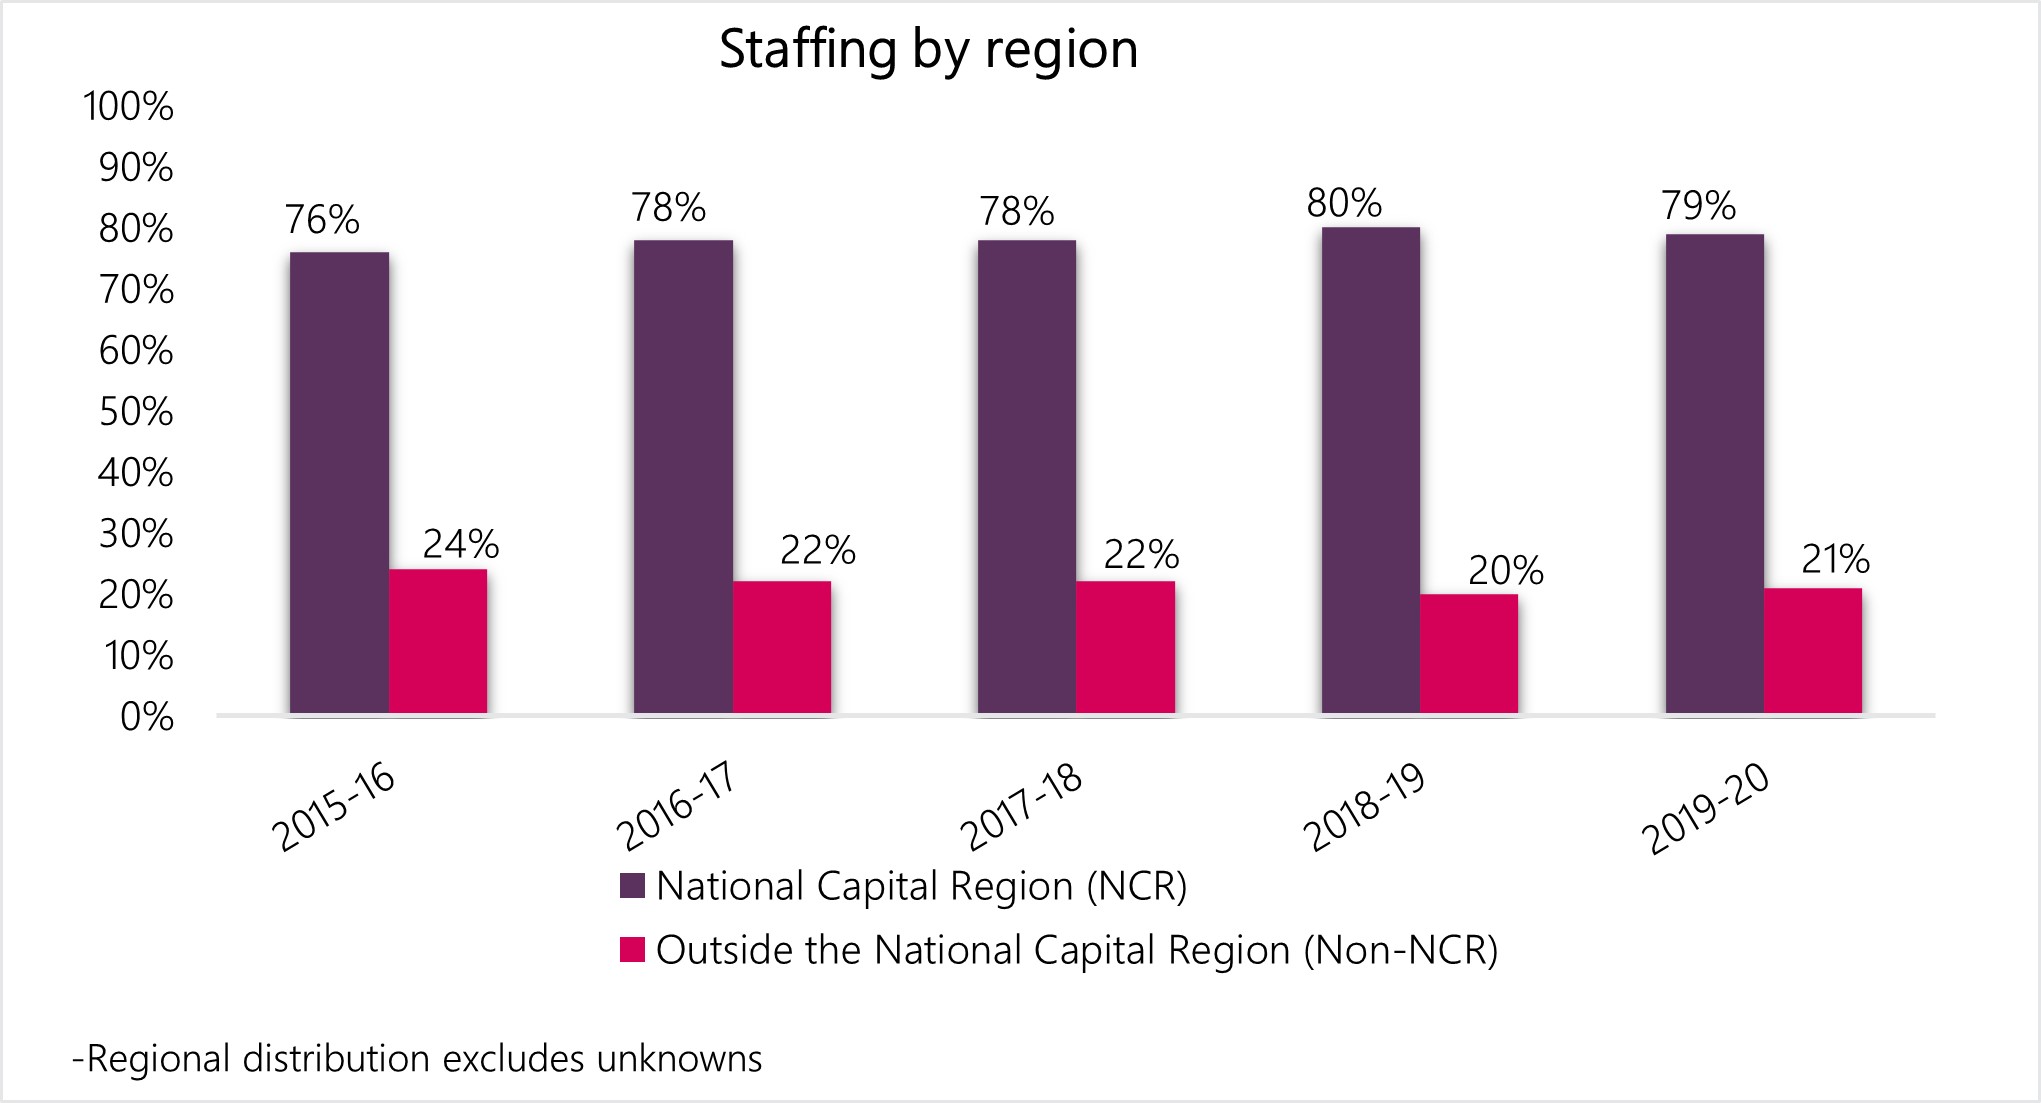
Staffing by region
Figure 6 - Staffing by region
Text version
| Fiscal year | Percentage of staffing activities in the National Capital Region (NCR) | Percentage of staffing activities in all other regions (Non-NCR) |
|---|---|---|
| 2015 to 2016 | 76% | 24% |
| 2016 to 2017 | 78% | 22% |
| 2017 to 2018 | 78% | 22% |
| 2018 to 2019 | 80% | 20% |
| 2019 to 2020 | 79% | 21% |
* Regional distribution excludes unknowns
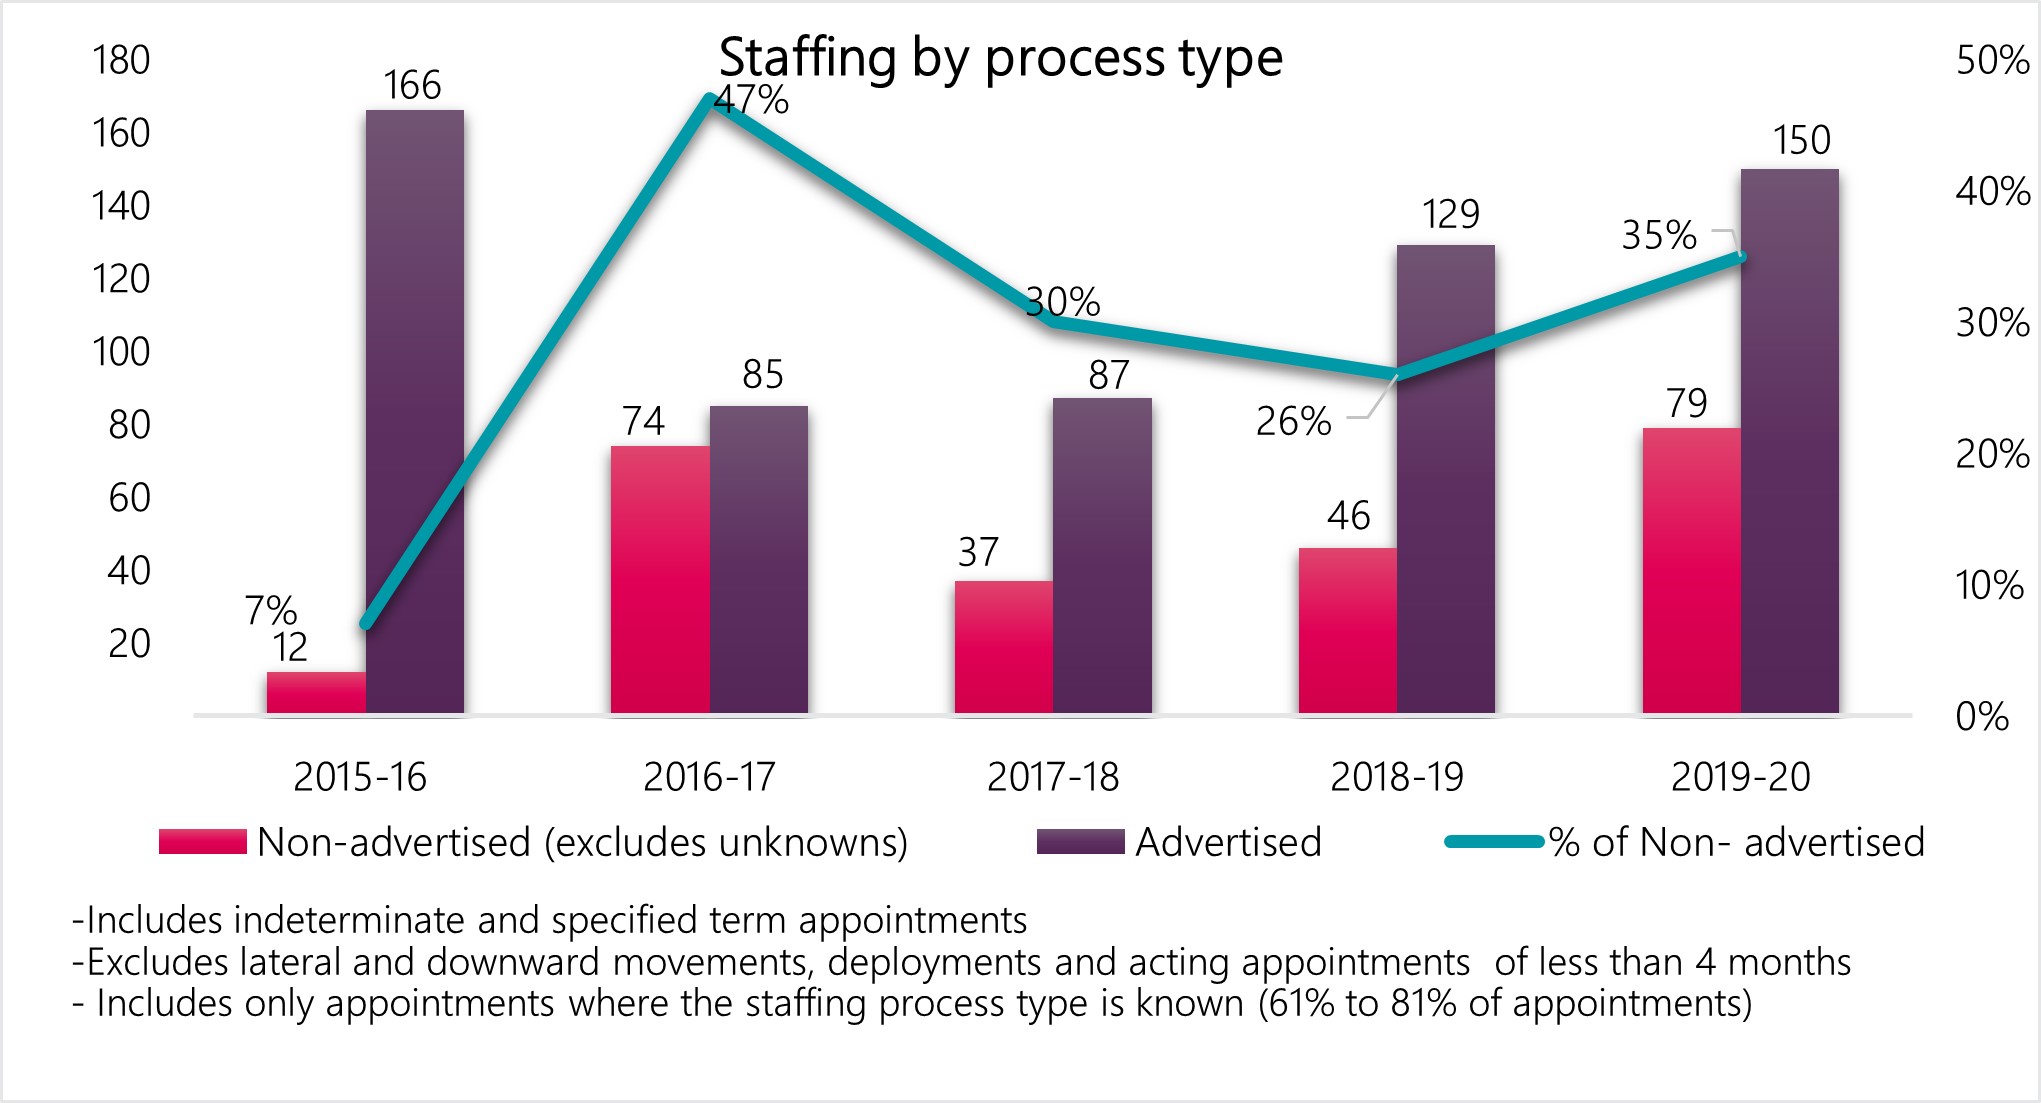
Staffing by process type
Figure 7 - Staffing by process type
Text version
| Fiscal year | Non-advertised processes (excludes unknowns) | Advertised processes | % of Non- advertised processes |
|---|---|---|---|
| 2015 to 2016 | 12 | 166 | 7% |
| 2016 to 2017 | 74 | 85 | 47% |
| 2017 to 2018 | 37 | 87 | 30% |
| 2018 to 2019 | 46 | 129 | 26% |
| 2019 to 2020 | 79 | 150 | 35% |
- Includes indeterminate and specified term appointments
- Excludes lateral and downward movements, deployments and acting appointments of less than 4 months
- Includes only appointments where the staffing process type is known (61% to 81% of appointments)
Staffing by appointment type
Figure 8 - Staffing by appointment type
Text version
| Fiscal year | Promotions | Lateral and downward movements | Appointments to the public service (includes casuals and students) | Acting appointments (excludes appointments of less than 4 months) | Total |
|---|---|---|---|---|---|
| 2015 to 2016 | 54 | 78 | 291 | 46 | 469 |
| 2016 to 2017 | 118 | 58 | 228 | 38 | 442 |
| 2017 to 2018 | 57 | 39 | 218 | 28 | 342 |
| 2018 to 2019 | 73 | 62 | 329 | 42 | 506 |
| 2019 to 2020 | 102 | 79 | 366 | 61 | 608 |
Staffing by tenure
Figure 9 - Staffing by tenure
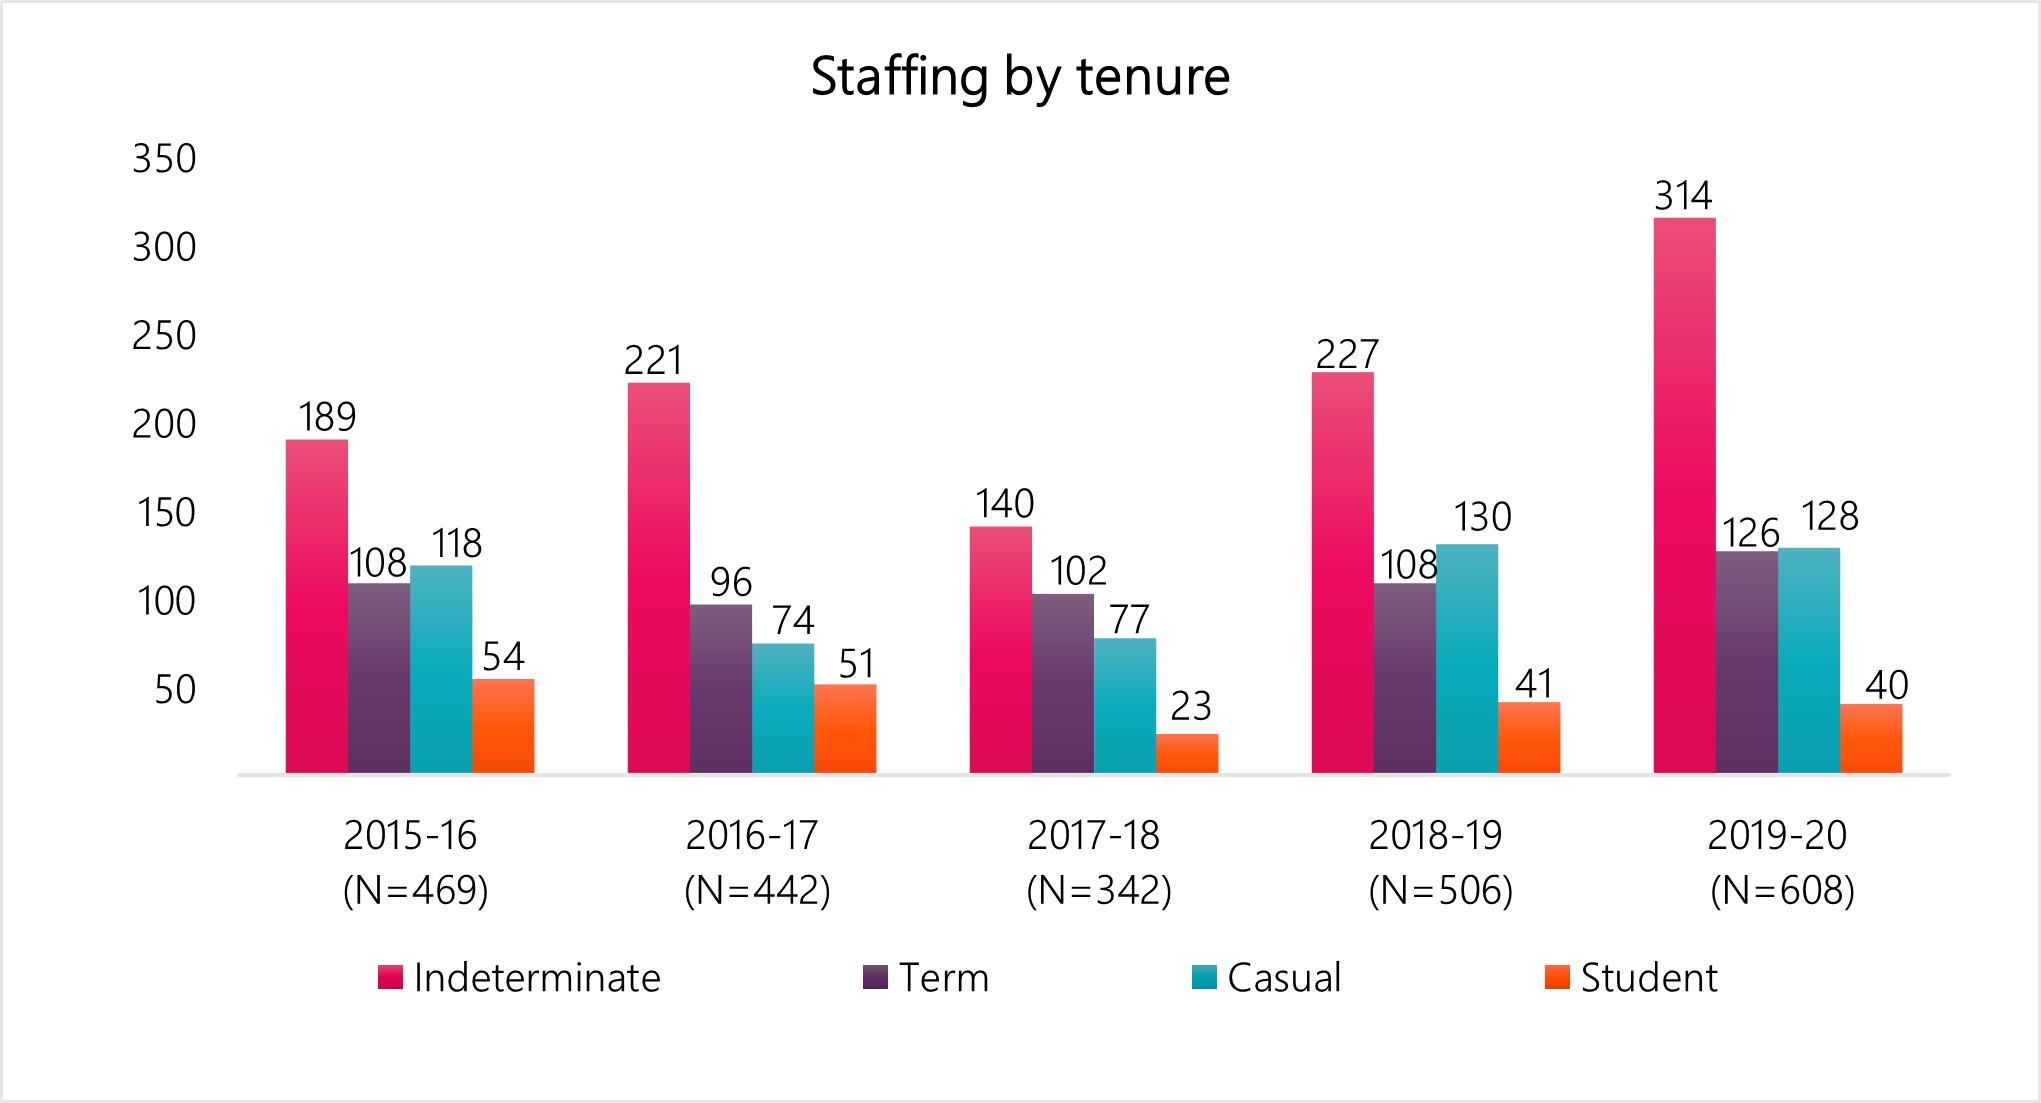
Text version
| Fiscal year | Indeterminate staffing activities | Term staffing activities | Casual staffing activities | Student staffing activities | Total staffing activities |
|---|---|---|---|---|---|
| 2015 to 2016 | 189 | 108 | 118 | 54 | 469 |
| 2016 to 2017 | 221 | 96 | 74 | 51 | 442 |
| 2017 to 2018 | 140 | 102 | 77 | 23 | 342 |
| 2018 to 2019 | 227 | 108 | 130 | 41 | 506 |
| 2019 to 2020 | 314 | 126 | 128 | 40 | 608 |
Key findings - Staffing and non-partisanship survey (2018)
- 61.8% of employees agreed that people hired can do the job, compared to 67.6% in organizations of similar size, and 53.8% in the federal public service
- 74.0% of managers agreed that the New Direction in Staffing has improved the way they hire and appoint persons to and within their organization, compared to 69.4% in organizations of similar size, and 56.1% in the federal public service
- 68.1% of managers agreed that within their organization, the administrative to staff a position is burdensome, compared to 84.0% in organizations of similar size, and 87.9% in the federal public service
Student program hires
Figure 10 - Student program hires
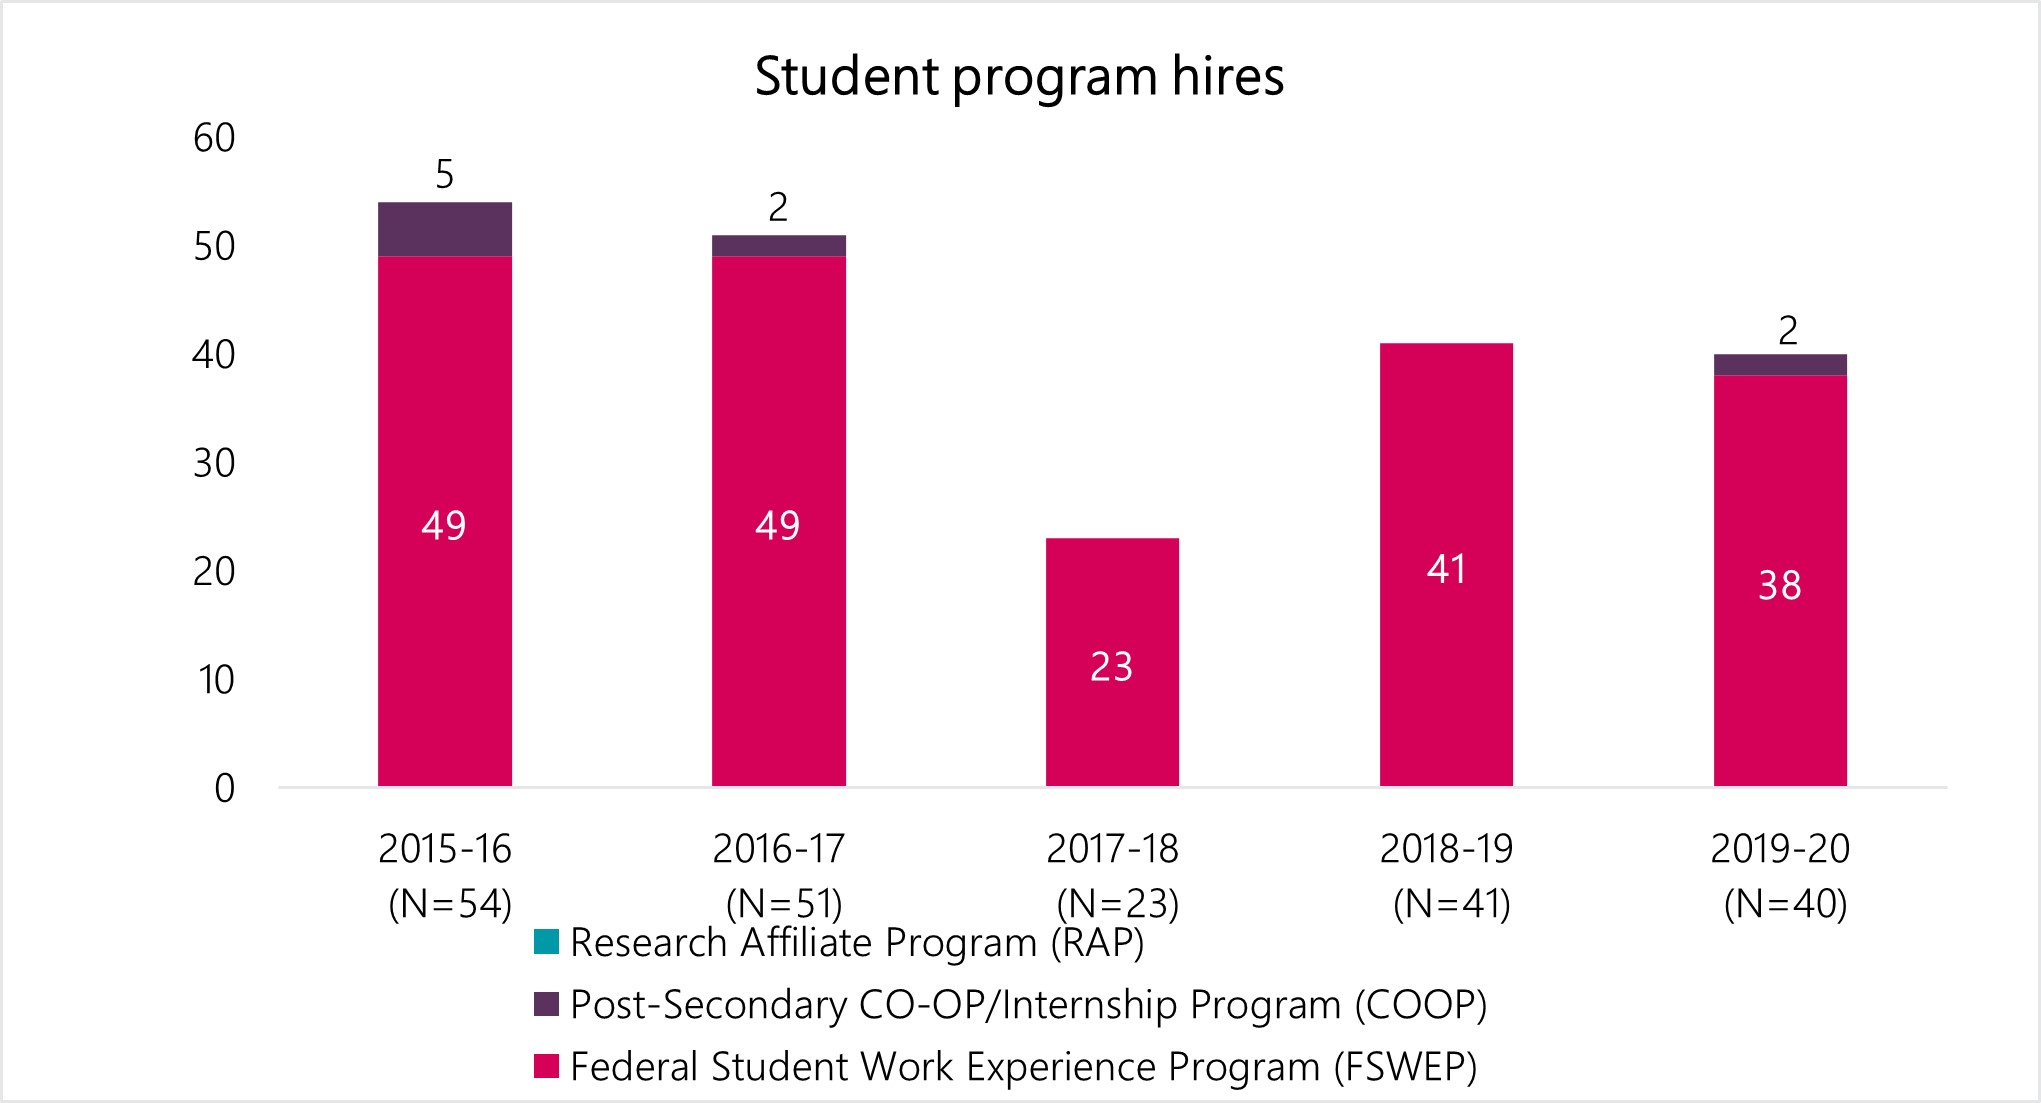
Text version
| Fiscal year | Federal Student Work Experience Program | Post-Secondary Co-op/Internship Program | Research Affiliate Program | Total |
|---|---|---|---|---|
| 2015 to 2016 | 49 | 5 | 0 | 54 |
| 2016 to 2017 | 49 | 2 | 0 | 51 |
| 2017 to 2018 | 23 | 0 | 0 | 23 |
| 2018 to 2019 | 41 | 0 | 0 | 41 |
| 2019 to 2020 | 38 | 2 | 0 | 40 |
External indeterminate and term hiring activities: Post-Secondary Recruitment Program and former student hires
Figure 11 - External indeterminate and term hiring activities: Post-Secondary Recruitment Program and former student hires
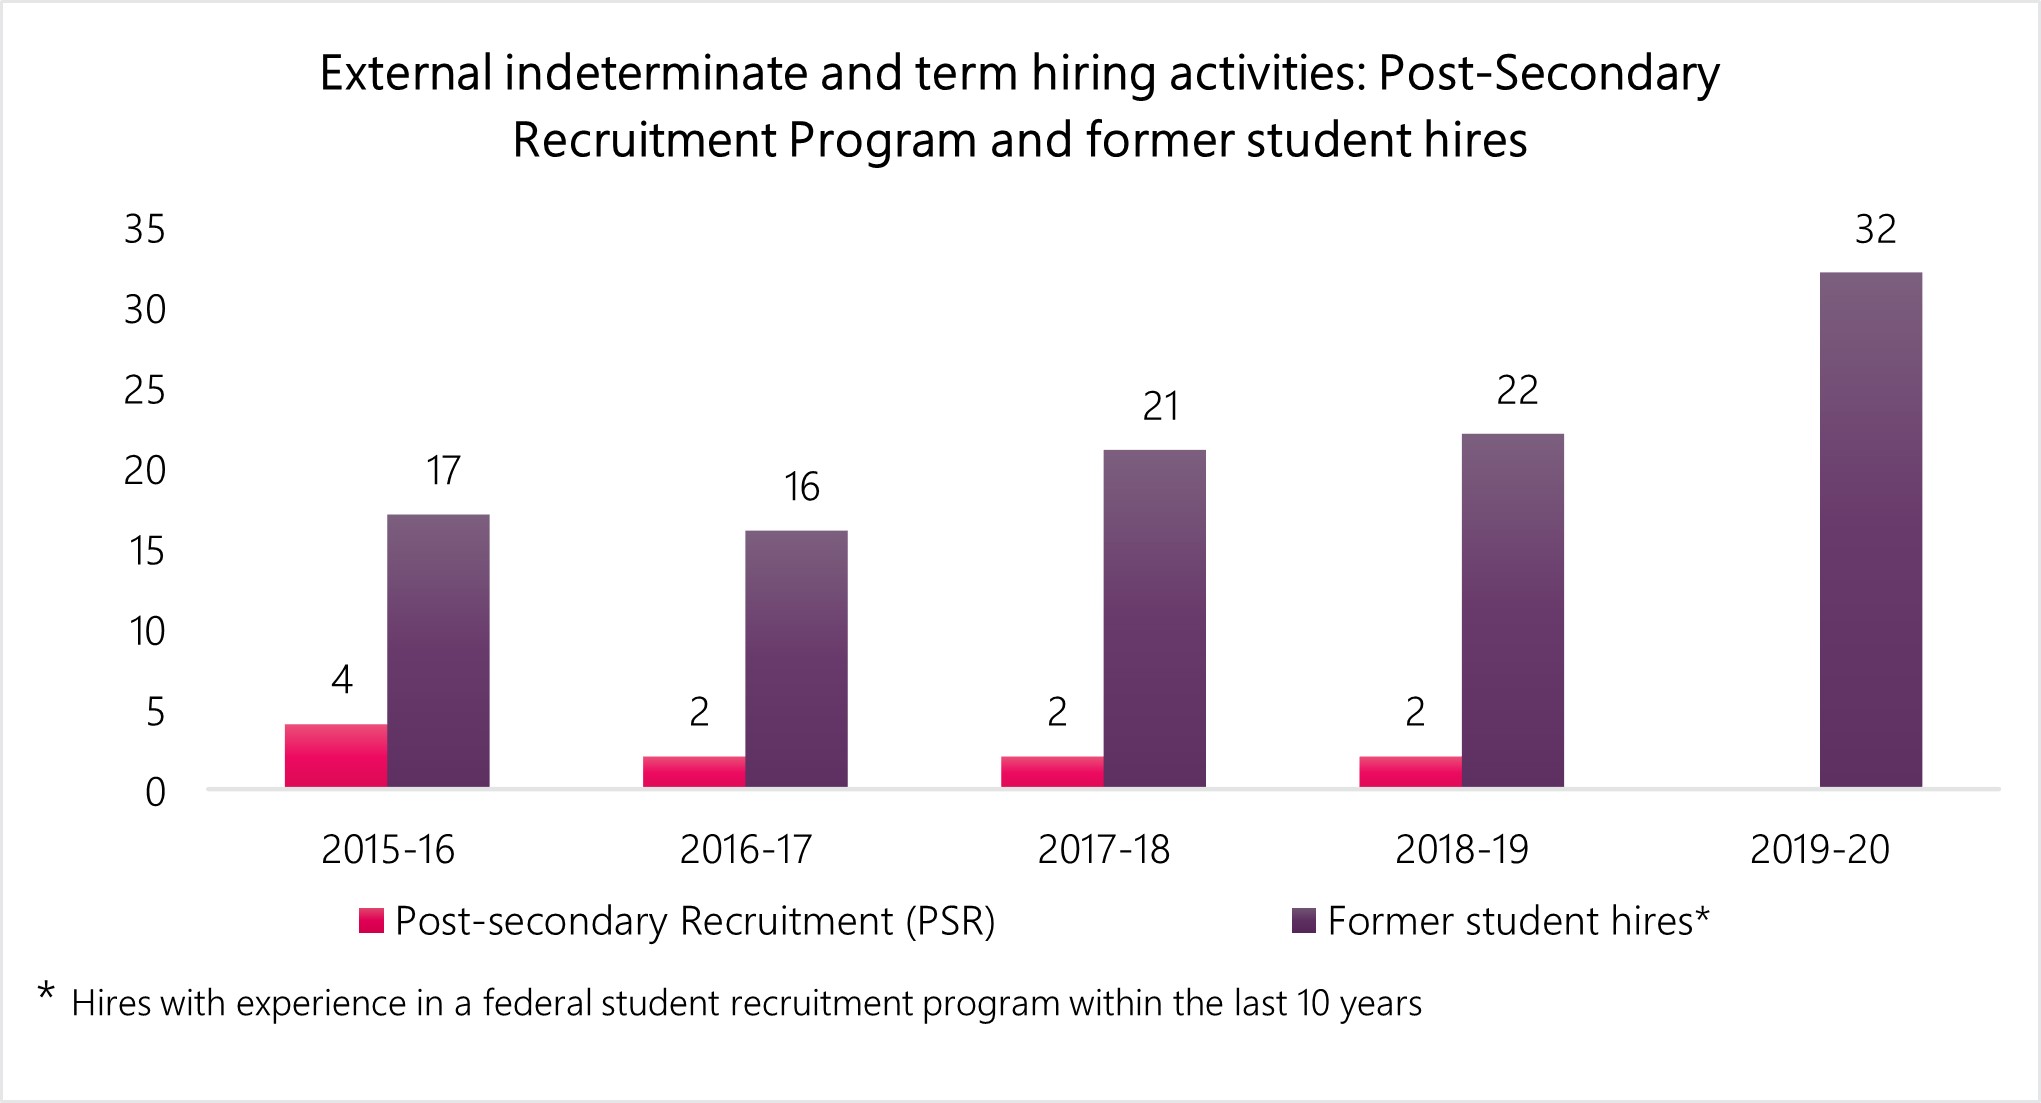
Text version
| Fiscal year | Post-Secondary Recruitment Program hires | Hiring of former students |
|---|---|---|
| 2015 to 2016 | 4 | 17 |
| 2016 to 2017 | 2 | 16 |
| 2017 to 2018 | 2 | 21 |
| 2018 to 2019 | 2 | 22 |
| 2019 to 2020 | 0 | 32 |
Hiring of former students includes indeterminate and term hires with experience in a federal student recruitment program within the last 10 years.
Internal time to staff
Figure 12 - Internal time to staff Public service median = 175 days, 2019-2020
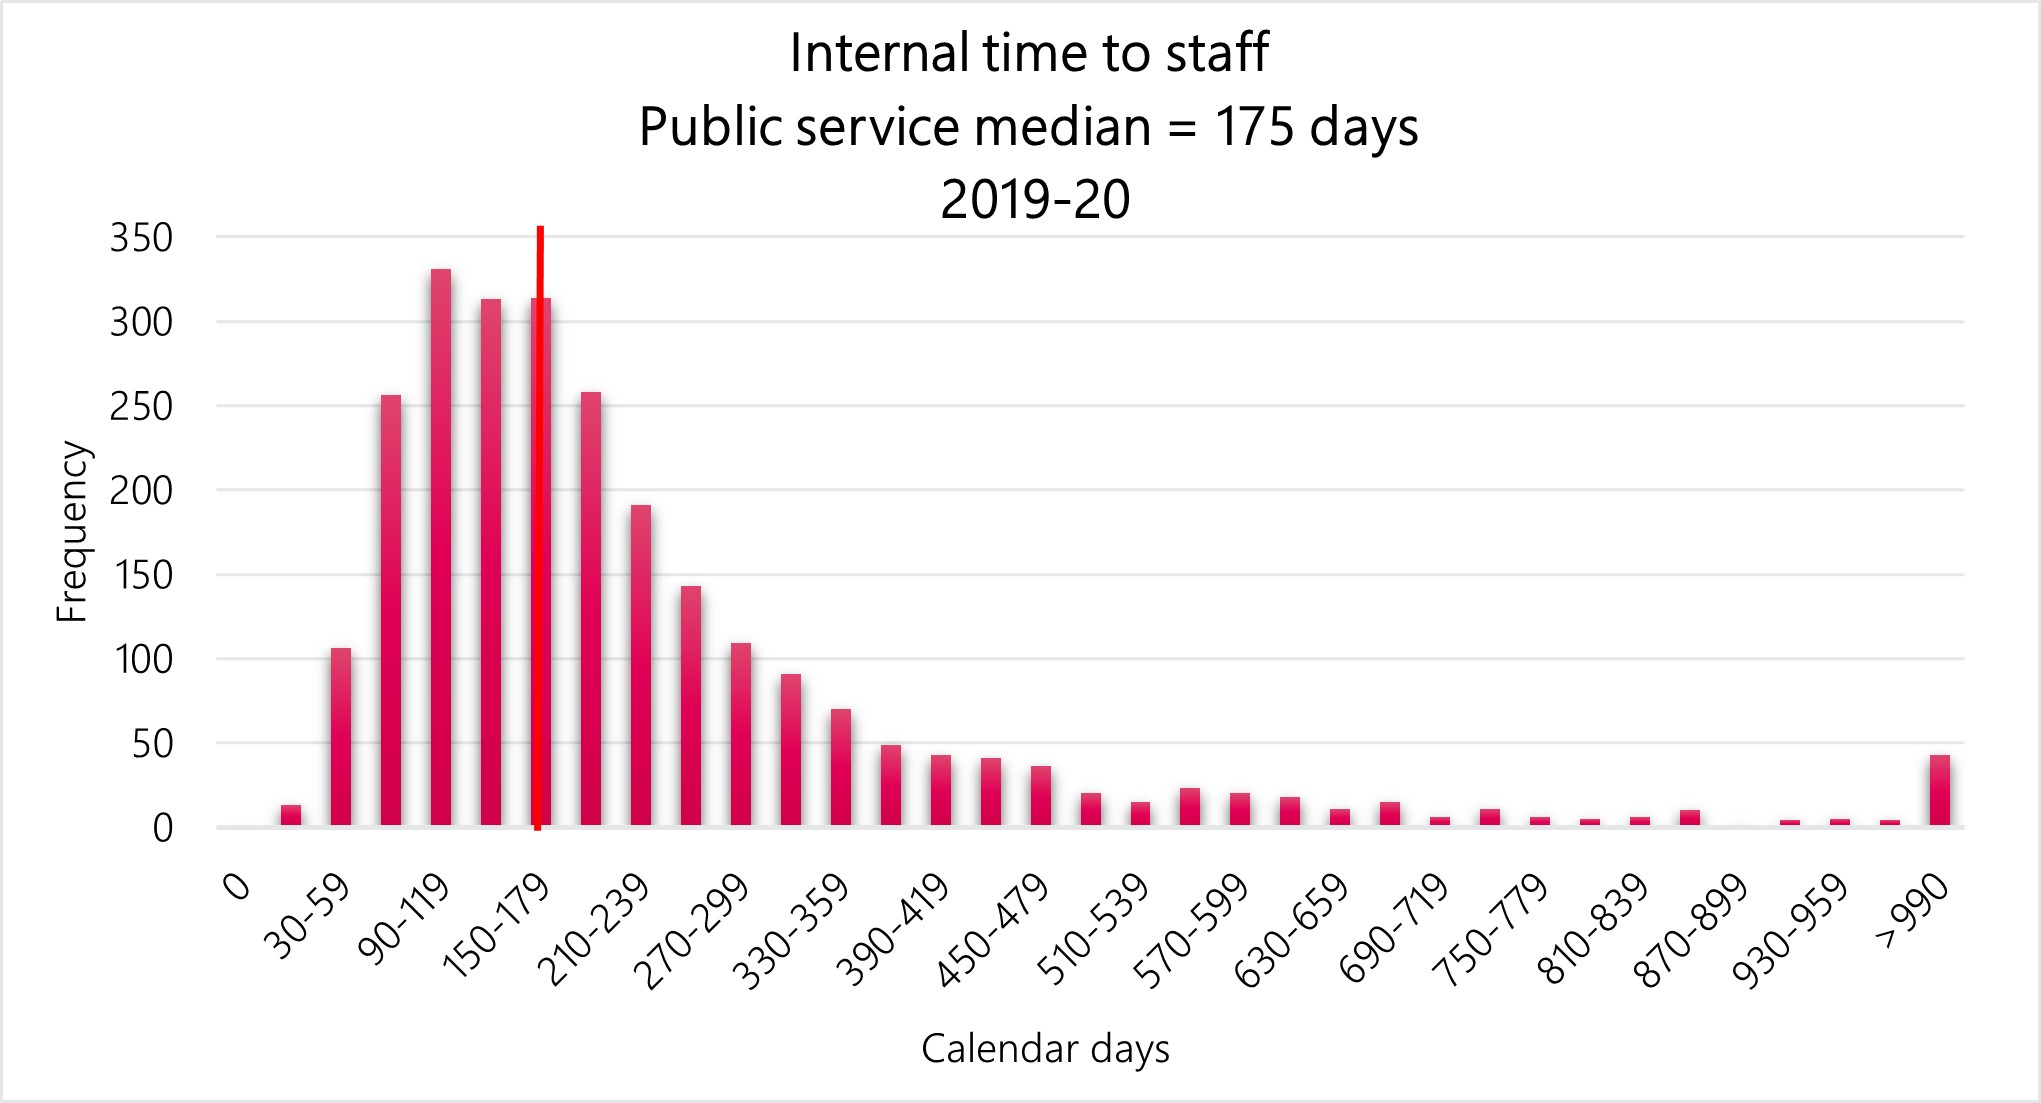
Text version
| Number of calendar days | The number of internal appointments for which the TTS-IA was within the specified number of calendar days for organizations subject to the Public Service Employment Act |
|---|---|
| 0 calendar days | 0 |
| 0 to 29 calendar days | 13 |
| 30 to 59 calendar days | 106 |
| 60 to 89 calendar days | 256 |
| 90 to 119 calendar days | 331 |
| 120 to 149 calendar days | 313 |
| 150 to 179 calendar days | 314 |
| 180 to 209 calendar days | 258 |
| 210 to 239 calendar days | 191 |
| 240 to 269 calendar days | 143 |
| 270 to 299 calendar days | 109 |
| 300 to 329 calendar days | 91 |
| 330 to 359 calendar days | 70 |
| 360 to 389 calendar days | 49 |
| 390 to 419 calendar days | 43 |
| 420 to 449 calendar days | 41 |
| 450 to 479 calendar days | 36 |
| 480 to 509 calendar days | 20 |
| 510 to 539 calendar days | 15 |
| 540 to 569 calendar days | 23 |
| 570 to 599 calendar days | 20 |
| 600 to 629 calendar days | 18 |
| 630 to 659 calendar days | 11 |
| 660 to 689 calendar days | 15 |
| 690 to 719 calendar days | 6 |
| 720 to 749 calendar days | 11 |
| 750 to 779 calendar days | 6 |
| 780 to 809 calendar days | 5 |
| 810 to 839 calendar days | 6 |
| 840 to 869 calendar days | 10 |
| 870 to 899 calendar days | 1 |
| 900 to 929 calendar days | 4 |
| 930 to 959 calendar days | 5 |
| 960 to 989 calendar days | 4 |
| More than 990 calendar days | 43 |
Internal time to staff is calculated as the number of calendar days between the opening date of the advertisement and the date of the first notification,
The median internal time to staff for the public service (organizations subject to the Public Service Employment Act) for fiscal year 2019 to 2020 is 175 days
Internal time to staff for fiscal year 2019 to 2020
The data is insufficient for providing results on internal process times for the Courts Administration Service.
External time to staff
Figure 13 - External time to staff Public service median = 203 days, 2019-2020
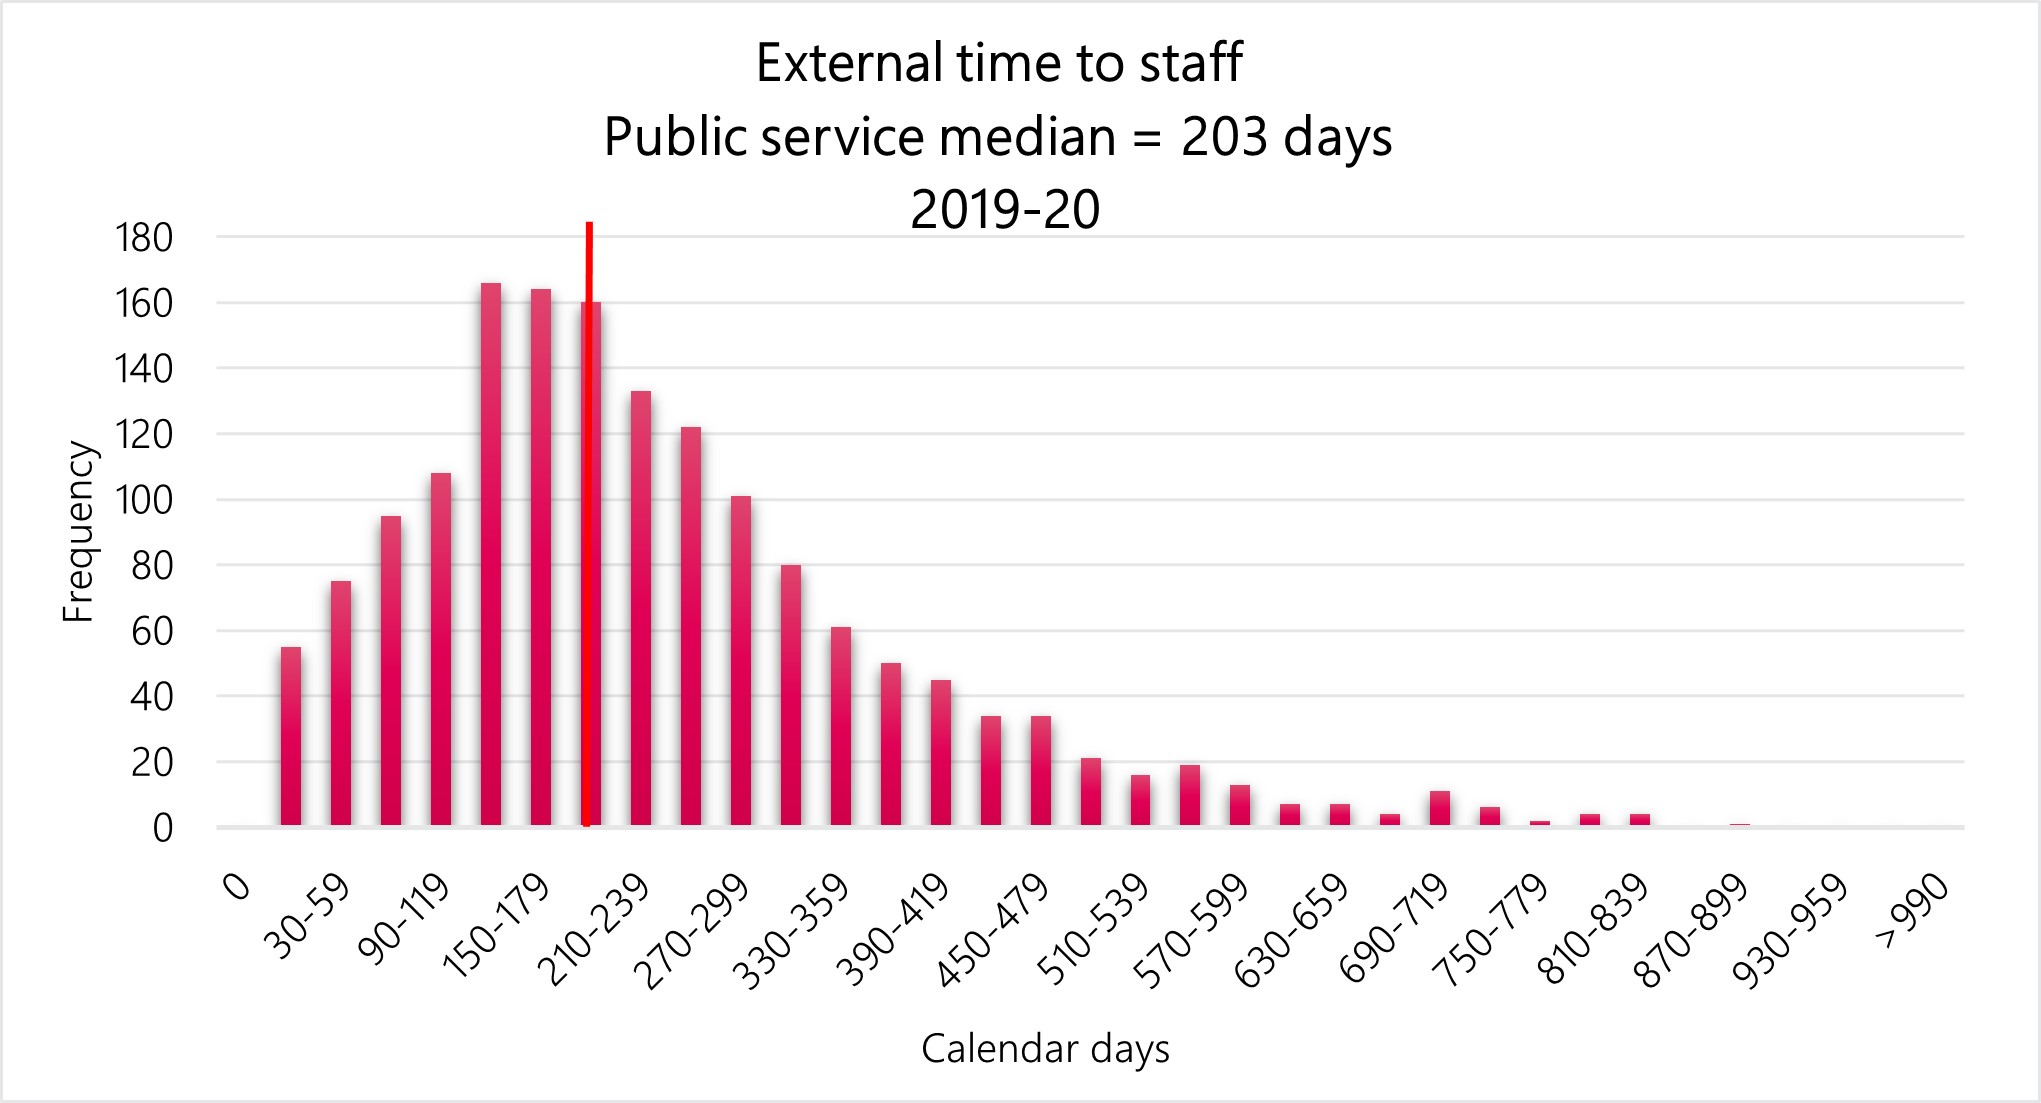
Text version
| Number of calendar days | The number of external appointment processes for which the TTS-EA was within the specified number of calendar days for organizations subject to the Public Service Employment Act |
|---|---|
| 0 calendar days | 0 |
| 0 to 29 calendar days | 55 |
| 30 to 59 calendar days | 75 |
| 60 to 89 calendar days | 95 |
| 90 to 119 calendar days | 108 |
| 120 to 149 calendar days | 166 |
| 150 to 179 calendar days | 164 |
| 180 to 209 calendar days | 160 |
| 210 to 239 calendar days | 133 |
| 240 to 269 calendar days | 122 |
| 270 to 299 calendar days | 101 |
| 300 to 329 calendar days | 80 |
| 330 to 359 calendar days | 61 |
| 360 to 389 calendar days | 50 |
| 390 to 419 calendar days | 45 |
| 420 to 449 calendar days | 34 |
| 450 to 479 calendar days | 34 |
| 480 to 509 calendar days | 21 |
| 510 to 539 calendar days | 16 |
| 540 to 569 calendar days | 19 |
| 570 to 599 calendar days | 13 |
| 600 to 629 calendar days | 7 |
| 630 to 659 calendar days | 7 |
| 660 to 689 calendar days | 4 |
| 690 to 719 calendar days | 11 |
| 720 to 749 calendar days | 6 |
| 750 to 779 calendar days | 2 |
| 780 to 809 calendar days | 4 |
| 810 to 839 calendar days | 4 |
| 840 to 869 calendar days | 0 |
| 870 to 899 calendar days | 1 |
| 900 to 929 calendar days | 0 |
| 930 to 959 calendar days | 0 |
| 960 to 989 calendar days | 0 |
| More than 990 calendar days | 0 |
External time to staff is calculated as the number of calendar days between the opening date of the advertisement and the date of the first estimated external hire.
The median external time to staff for the public service (organizations subject to the Public Service Employment Act) for fiscal year 2019 to 2020 is 203 days.
External time to staff for fiscal year 2019 to 2020
The data is insufficient for providing results on external process times for the Courts Administration Service.
Technical notes:
- The Time to Staff - Internal Appointments (TTS-IA) is the median number of calendar days between the opening date of an internal advertisement and the date of the first Notice of Appointment or Proposal of Appointment (NAPA) from the Public Service Resourcing System for internal term and indeterminate positions. As NAPAs are not required for all internal staffing actions, this measure is limited to reporting on internal promotional appointments.
- The Time to Staff - External Appointments (TTS-EA) is the median number of calendar days between the opening date of an external advertisement and the date of the first estimated appointment of an individual from outside an organization subject to the Public Service Employment Act for term and indeterminate positions. Because data between systems is linked using a probabilistic match, errors in data linkage are a potential source of measurement error.
- Only estimated term and indeterminate appointments/notifications are included (deployments, casual and acting appointments are excluded).
Sources:
- Hiring and staffing activities data are derived from information received from the Treasury Board of Canada Secretariat Incumbent File. The Incumbent File is extracted from the Public Services and Procurement Canada’s pay system. The data constitutes an estimate of hiring and staffing activities to and within organizations.
- Information from the Priority Information Management System and the Public Services Resourcing System is also used to determine if staffing actions are advertised or non-advertised as well as for calculating time to staff.
- The data are not expected to match an organization’s human resources data, due to methodology and timing differences
- The Time to Staff - Internal Appointments (TTS-IA) is the median number of calendar days between the opening date of an internal advertisement and the date of the first Notice of Appointment or Proposal of Appointment (NAPA) from the Public Service Resourcing System for internal term and indeterminate positions. As NAPAs are not required for all internal staffing actions, this measure is limited to reporting on internal promotional appointments
- Only estimated term and indeterminate appointments/notifications are included (deployments, casual and acting appointments are excluded)
- The Time to Staff - External Appointments (TTS-EA) is the median number of calendar days between the opening date of an external advertisement and the date of the first estimated appointment of an individual from outside an organization subject to the Public Service Employment Act for term and indeterminate positions. Only estimated term and indeterminate appointments/notifications are included (deployments, casual and acting appointments are excluded)
- Because data between systems is linked using a probabilistic match, errors in data linkage are a potential source of measurement error
- Hiring and staffing activities data are derived from information received from the Treasury Board of Canada Secretariat Incumbent File. The Incumbent File is extracted from the Public Services and Procurement Canada’s pay system. The data constitutes an estimate of hiring and staffing activities to and within organizations.
- Information from the Priority Information Management System and the Public Services Resourcing System is also used to determine if staffing actions are advertised or non-advertised as well as for calculating time to staff.
- The data are not expected to match an organization’s human resources data, due to methodology and timing differences.