
Employment Equity in the Public Service of Canada for Fiscal Year 2018 to 2019
On this page
- Message from the President of the Treasury Board
- Measuring employment equity in the public service
- Toward a culture of diversity and inclusion in the public service
- Employee networks
- The way forward: progress in adopting an inclusive mindset
- About this report
- About the data
- Appendix: statistical tables of employment equity data specific to compliance requirements of section 21 of the Employment Equity Act

Message from the President of the Treasury Board
I am pleased to present the 27th annual report to Parliament on employment equity in the Public Service of Canada.
Employment equity is an important building block in establishing a diverse and inclusive public service. The Employment Equity Act requires the public service to meet representation goals for the four designated employment equity groups.
In 2018–19, the public service was successful in achieving these goals for women, Indigenous peoples, and members of a visible minority. But more is left to do to welcome into our midst persons living with disabilities.
The under-representation in that area is in good part due to the widening of the range of disabilities considered within the Canadian Survey on Disability, and the data has not yet reflected that new definition. At the Treasury Board of Canada Secretariat, the Office of Public Service Accessibility has been put in place to help the public service work toward an improved representation and a more inclusive workplace for this group, to carry out our responsibilities as an Employer under the Accessible Canada Act.
We also took steps to create safer, healthier and more inclusive and diverse workplaces for all our employees by launching the Centre for Wellness, Inclusion and Diversity. The Centre offers support and tools to employees and managers who want to improve their workplace by exchanging new practices and ideas.
Overall, I am pleased with the progress made by the public service toward recruiting, developing and retaining a diverse workforce. Looking ahead, departments will need to continue to focus attention on Canada’s changing population, ensure the public service is representative of the people it serves and, increasingly, strive to ensure all our employees feel valued. To this end, managers will need to continue to recruit people who have a variety of experience, backgrounds and skills, and equip and support them to succeed.
I invite you to read this report and discover for yourself how the government is making progress in building an inclusive, accessible public service, where all employees can perform to their full potential for the betterment of Canada.
Original signed by
The Honourable Jean-Yves Duclos
President of the Treasury Board of Canada
Measuring employment equity in the public service
New workforce availability benchmarks for employment equity reporting
With the release of data from the 2016 Census and the 2017 Canadian Survey on Disability, workforce availability estimates (WFAs), which are used as benchmarks to measure employment equity for the public service, have been updated.
While all the WFA estimates have increased, the one for persons with disability has more than doubled. This is the result of new questions to screen for disabilities in the 2017 Canadian Survey on Disability and 2016 Census to better reflect the number of persons with a variety of disabilities available in the workforce.
| Employment equity designated groups |
Previous WFA benchmark (Census 2011) |
WFA (Census 2016) |
Labour market availability |
2018–19 core public administration representation |
|---|---|---|---|---|
Table 1 NotesNote: To determine WFA, additional criteria are applied to the LMA population, for example, education levels, citizenship, and National Occupational Classification code comparisons. While the resulting WFA is a subset of LMA, certain employment equity groups may present with a greater percentage of the CPA available workforce as a result of the application of these criteria.
|
||||
| Women | 52.5% | 52.7% | 48.2% | 54.8% |
| Indigenous peoplestable 1 note 1 | 3.4% | 4.0% | 4.0% | 5.1% |
| Persons with disabilitiestable 1 note 2 | 4.4% | 9.0% | 9.1% | 5.2% |
| Members of visible minorities | 13.0% | 15.3% | 21.3% | 16.7% |
Labour market availability and workforce availability
Labour market availability (LMA) is the share of designated group members in the Canadian labour market. As mentioned, the federal public service uses WFA, a subset of LMA, as the benchmark for assessing employment equity of the four designated groups. The Employment Equity Act does not specify which one to use. WFA considers certain factors, such as citizenship, location, working age (15 to 64) and education specific to the public service, to determine a more precise estimate than LMA can provide of designated groups members available for hire in the federal public service. While the resulting WFA is a subset of LMA, certain employment equity groups, for example, women, may present with a greater percentage of the core public administration available workforce as a result of the application of these criteria.
Representation
The proportion of women and Indigenous peoples in the public service meets or exceeds both their estimated WFA and LMA, but additional progress could be made in terms of members of visible minorities reflecting their LMA. The representation of persons with disabilities is lower than the new WFA or the LMA.
Data disaggregation
To provide a better understanding of the unique workplace issues and experiences of employees, this year’s report provides new details on disaggregation of the four designated groups.
It should be noted that Indigenous employees and employees with disabilities had a greater tendency to identify their subgroup as “other” rather than one of the specific subgroup categories. As a result, the disaggregated analysis for these two designated groups is more limited.
New occupational groups for reporting
A new occupational group structure has replaced the former occupational categories in Schedule III of the Employment Equity Regulations as a result of an update of the Regulations. This new structure now has over 30 occupational groups instead of the six previous ones. Both can be found in this report (see Tables 3.1 and 3.2 in Appendix). Providing both groups in this report allows for a more precise understanding of the distribution of the designated groups within the core public administration.
The following infographics provide further details on the state of designated group representation in the core public administration.
Infographic 1 - Text version
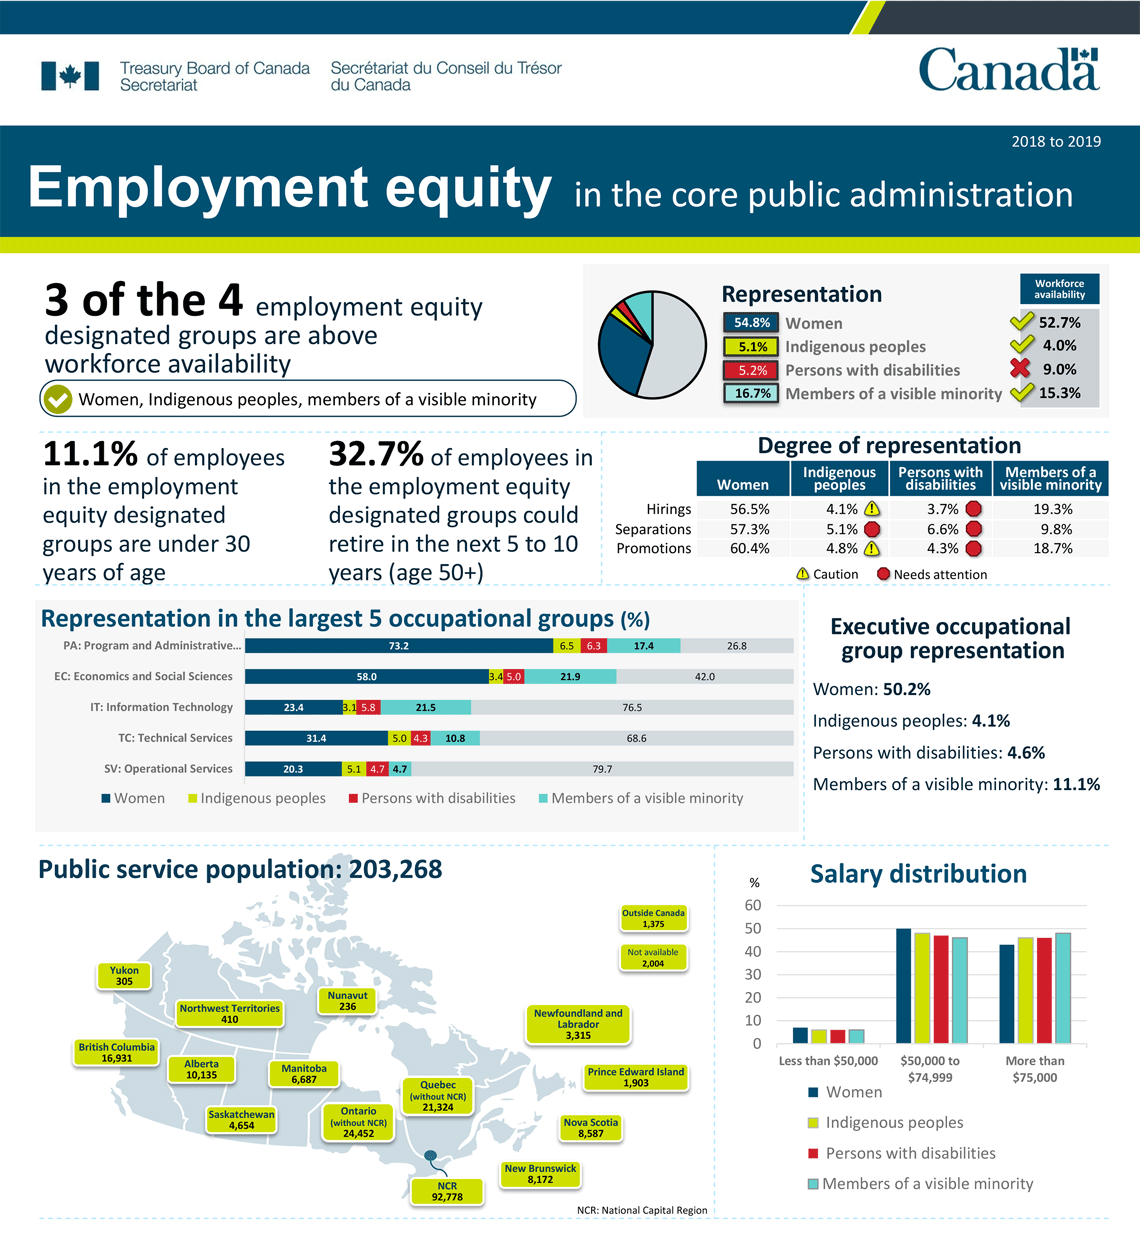
3 of the 4 employment equity designated groups are above workforce availability: women, Indigenous peoples and members of a visible minority.
Core public administration representation:
- 54.8% are women, which is higher than their workforce availability of 52.7%
- 5.1% have identified themselves as Indigenous, which is higher than their workforce availability of 4.0%
- 5.2% have identified themselves as having a disability, which is lower than their workforce availability of 9.0%
- 16.7% have identified themselves as a member of a visible minority, which is higher than their workforce availability of 15.3%
11.1% of employees in the employment equity designated groups are under 30 years of age.
32.7% of employees in the employment equity designated groups could retire in the next 5 to 10 years (50 years of age or older).
Degree of representation for hirings, separations and promotions:
| Human resources action | Women | Indigenous peoples | Persons with disabilities |
Members of a visible minority |
|---|---|---|---|---|
| Hirings | 56.5% | 4.1% | 3.7% | 19.3% |
| Separations | 57.3% | 5.1% | 6.6% | 9.8% |
| Promotions | 60.4% | 4.8% | 4.3% | 18.7% |
In these figures for degree of representation, a note of “caution” is indicated for hirings and promotions for Indigenous peoples. A note of “needs attention” is indicated for the following:
- separations for Indigenous peoples
- hirings, separations and promotions for persons with disabilities
Representation in the top 5 occupational groups:
| Occupational group | Women | Indigenous peoples | Persons with disabilities | Members of a visible minority |
|---|---|---|---|---|
| PA: Programs and Administrative Services | 73.2% | 6.5% | 6.3% | 17.4% |
| EC: Economics and Social Sciences | 58.0% | 3.4% | 5.0% | 21.9% |
| IT: Information Technology | 23.4% | 3.1% | 5.8% | 21.5% |
| TC: Technical Services | 31.4% | 5.0% | 4.3% | 10.8% |
| SV: Operational Services | 20.3% | 5.1% | 4.7% | 4.7% |
Executive occupational group representation:
- Women: 50.2%
- Indigenous peoples: 4.1%
- Persons with disabilities: 4.6%
- Members of a visible minority: 11.1%
Salary distribution:
| Salary | Women | Indigenous peoples | Persons with disabilities | Members of a visible minorities |
|---|---|---|---|---|
| Less than $50,000 | 7% | 6% | 6% | 6% |
| $50,000 to $74,999 | 50% | 48% | 47% | 46% |
| More than $75,000 | 43% | 46% | 46% | 48% |
The population of the public service overall is 203,268, with the following subtotals by province, territory and other categories:
- Newfoundland and Labrador: 3,315
- Prince Edward Island: 1,903
- Nova Scotia: 8,587
- New Brunswick: 8,172
- Quebec (without the National Capital Region): 21,324
- National Capital Region: 92,778
- Ontario (without the National Capital Region): 24,452
- Manitoba: 6,687
- Saskatchewan: 4,654
- Alberta: 10,135
- British Columbia: 16,931
- Yukon: 305
- Northwest Territories: 410
- Nunavut: 236
- outside Canada: 1,375
- not available: 2,004
The source of the representation data is the Treasury Board of Canada Secretariat Employment Equity Data Bank, which is populated with self-identification information provided by employees.
To learn more
- Centre for Wellness, Inclusion and Diversity
- Employment Equity Promotion Rate Study
- Employment equity in federally regulated workplaces
- Canada Gazette, Part I, Volume 153, Number 32: Regulations Amending the Employment Equity Regulations
Infographic 2 - Text version
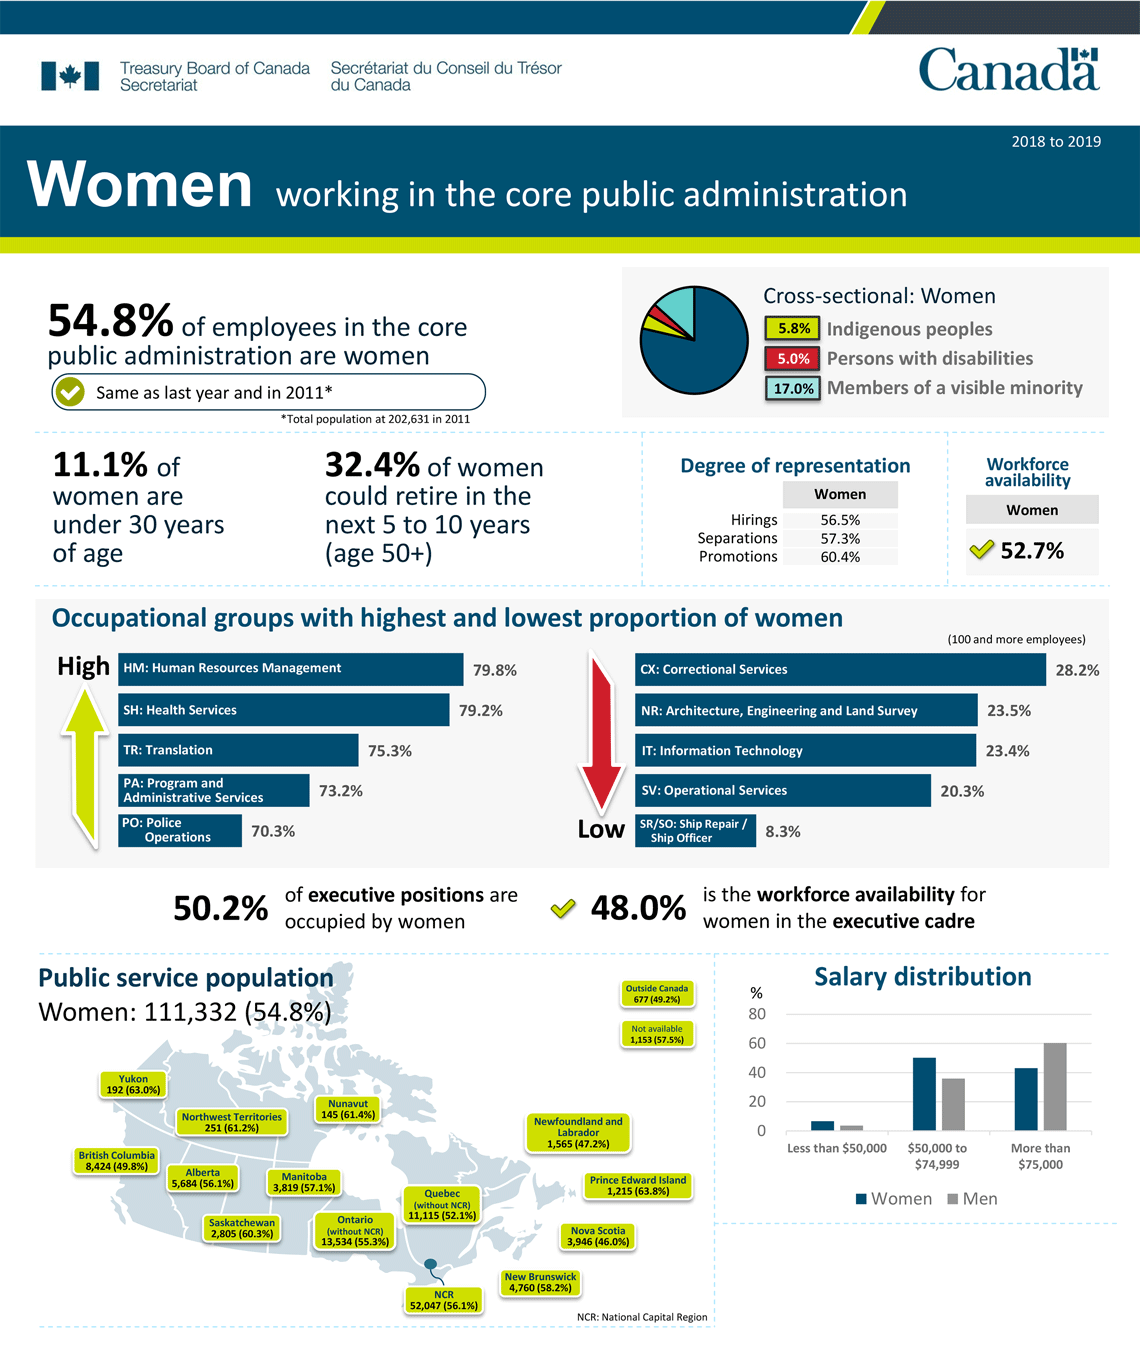
54.8% of employees in the core public administration are women. Same as last year and in 2011. (Total population at 202,631 in 2011)
Cross-sectional analysis for women:
- 5.8% of women have identified themselves as Indigenous
- 5.0% of women have identified themselves as having a disability
- 17.0% of women have identified themselves as a member of a visible minority
11.1% of women are under 30 years of age.
32.4% of women could retire in the next 5 to 10 years (50 years of age or older).
Degree of representation for hirings, separations and promotions for women:
- hirings: 56.5%
- separations: 57.3%
- promotions: 60.4%
The workforce availability of women is 52.7%. The representation of women is higher than their workforce availability.
Occupational groups with highest proportion of women (100 and more employees):
- HM - Human Resources Management: 79.8%
- SH - Health Services: 79.2%
- TR - Translation: 75.3%
- PA - Programs and Administrative Services: 73.2%
- PO - Police Operations: 70.3%
Occupational groups with lowest proportion of women (100 and more employees):
- CX - Correctional Services: 28.2%
- NR - Architecture, Engineering and Land Survey: 23.5%
- IT - Information Technology: 23.4%
- SV - Operational Services: 20.3%
- SR / SO - Ship Repair/ Ship Officer: 8.3%
50.2% of executive positions are occupied by women, which is higher than their workforce availability of 48.0% at the executive level.
Salary distribution:
| Salary | Women | Men |
|---|---|---|
| Less than $50,000 | 6.7% | 3.7% |
| $50,000 to $74,999 | 50.2% | 35.9% |
| More than $75,000 | 43.1% | 60.3% |
The population of women in the public service population is 111,332, or 54.8%, with the following subtotals by province, territory and other categories:
- Newfoundland and Labrador: 1,565 (47.2%)
- Prince Edward Island: 1,215 (63.8%)
- Nova Scotia: 3,946 (46.0%)
- New Brunswick: 4,760 (58.2%)
- Quebec (without the National Capital Region): 11,115 (52.1%)
- National Capital Region: 52,047 (56.1%)
- Ontario (without the National Capital Region): 13,534 (55.3%)
- Manitoba: 3,819 (57.1%)
- Saskatchewan: 2,805 (60.3%)
- Alberta: 5,684 (56.1%)
- British Columbia: 8,424 (49.8%)
- Yukon: 192 (63.0%)
- Northwest Territories: 251 (61.2%)
- Nunavut: 145 (61.4%)
- outside Canada: 677 (49.2%)
- not available: 1,153 (57.5%)
The source of the representation data is the Treasury Board of Canada Secretariat Employment Equity Data Bank, which is populated with self-identification information provided by employees.
To learn more
- Persistence and Representation of Women in STEM Programs
- A Gender Analysis of the Occupational Pathways of STEM Graduates in Canada
Infographic 3 - Text version
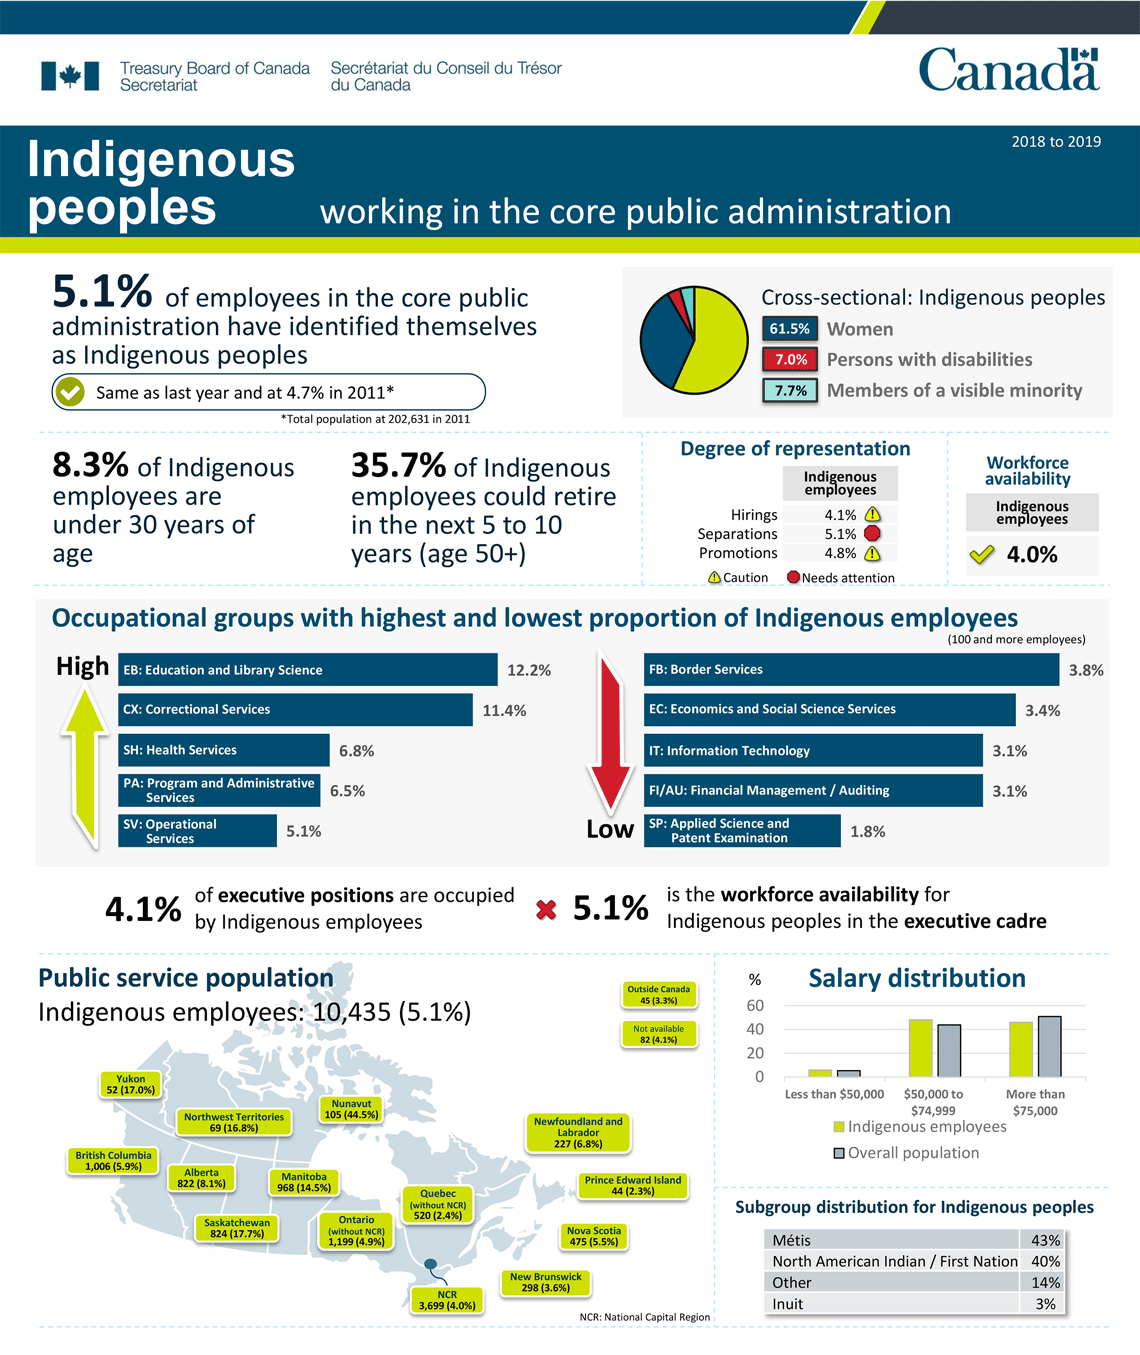
5.1% of employees in the core public administration have identified themselves as Indigenous. Same as last year and at 4.7% in 2011 (Total population at 202,631 in 2011)
Cross-sectional analysis for Indigenous peoples:
- 61.5% are women
- 7.0% have identified themselves as having a disability
- 7.7% have identified themselves as a member of a visible minority
8.3% of Indigenous employees are under 30 years of age.
35.7% of Indigenous employees could retire in the next 5 to 10 years (50 years of age or older).
Degree of representation for hirings, separations and promotions for Indigenous employees:
- hirings: 4.1%
- separations: 5.1%
- promotions: 4.8%
In these figures for degree of representation, a note of “caution” is indicated for hirings and promotions. A note of “needs attention” is indicated for separations.
The workforce availability for Indigenous employees is 4.0%. The representation of Indigenous employees is higher than their workforce availability.
Occupational groups with highest proportion of Indigenous employees (100 and more employees):
- EB - Education and Library Services: 12.2%
- CX - Correctional Services: 11.4%
- SH - Health Services: 6.8%
- PA - Programs and Administrative Services: 6.5%
- SV - Operational Services: 5.1%
Occupational groups with lowest proportion of Indigenous employees (100 and more employees):
- FB - Border Services: 3.8%
- EC - Economics and Social Sciences Services: 3.4%
- IT - Information Technology: 3.1%
- FI/AU - Financial Group / Auditing: 3.1%
- SP - Applied Science and Patent Examination: 1.8%
4.1% of executive positions are occupied by Indigenous employees, which is lower than their workforce availability of 5.1% at the executive level.
Salary distribution:
| Salary | Indigenous employees | Overall population |
|---|---|---|
| Less than $50,000 | 6% | 5% |
| $50,000 to $74,999 | 48% | 44% |
| More than $75,000 | 46% | 51% |
Sub-group distribution for Indigenous peoples:
- Métis: 43%
- North American Indian/First Nation: 40%
- other: 14%
- Inuit: 3%
The population of Indigenous peoples in the public service population is 10,435, or 5.1%, with the following subtotals by province, territory and other categories:
- Newfoundland and Labrador: 227 (6.8%)
- Prince Edward Island: 44 (2.3%)
- Nova Scotia: 475 (5.5%)
- New Brunswick: 298 (3.6%)
- Quebec (without the National Capital Region): 520 (2.4%)
- National Capital Region: 3,699 (4.0%)
- Ontario (without the National Capital Region): 1,199 (4.9%)
- Manitoba: 968 (14.5%)
- Saskatchewan: 824 (17.7%)
- Alberta: 822 (8.1%)
- British Columbia: 1,006 (5.9%)
- Yukon: 52 (17.0%)
- Northwest Territories: 69 (16.8%)
- Nunavut: 105 (44.5%)
- outside Canada: 45 (3.3%)
- not available: 82 (4.1%)
The source of the representation data is the Treasury Board of Canada Secretariat Employment Equity Data Bank, which is populated with self-identification information provided by employees.
To learn more
Infographic 4 - Text version
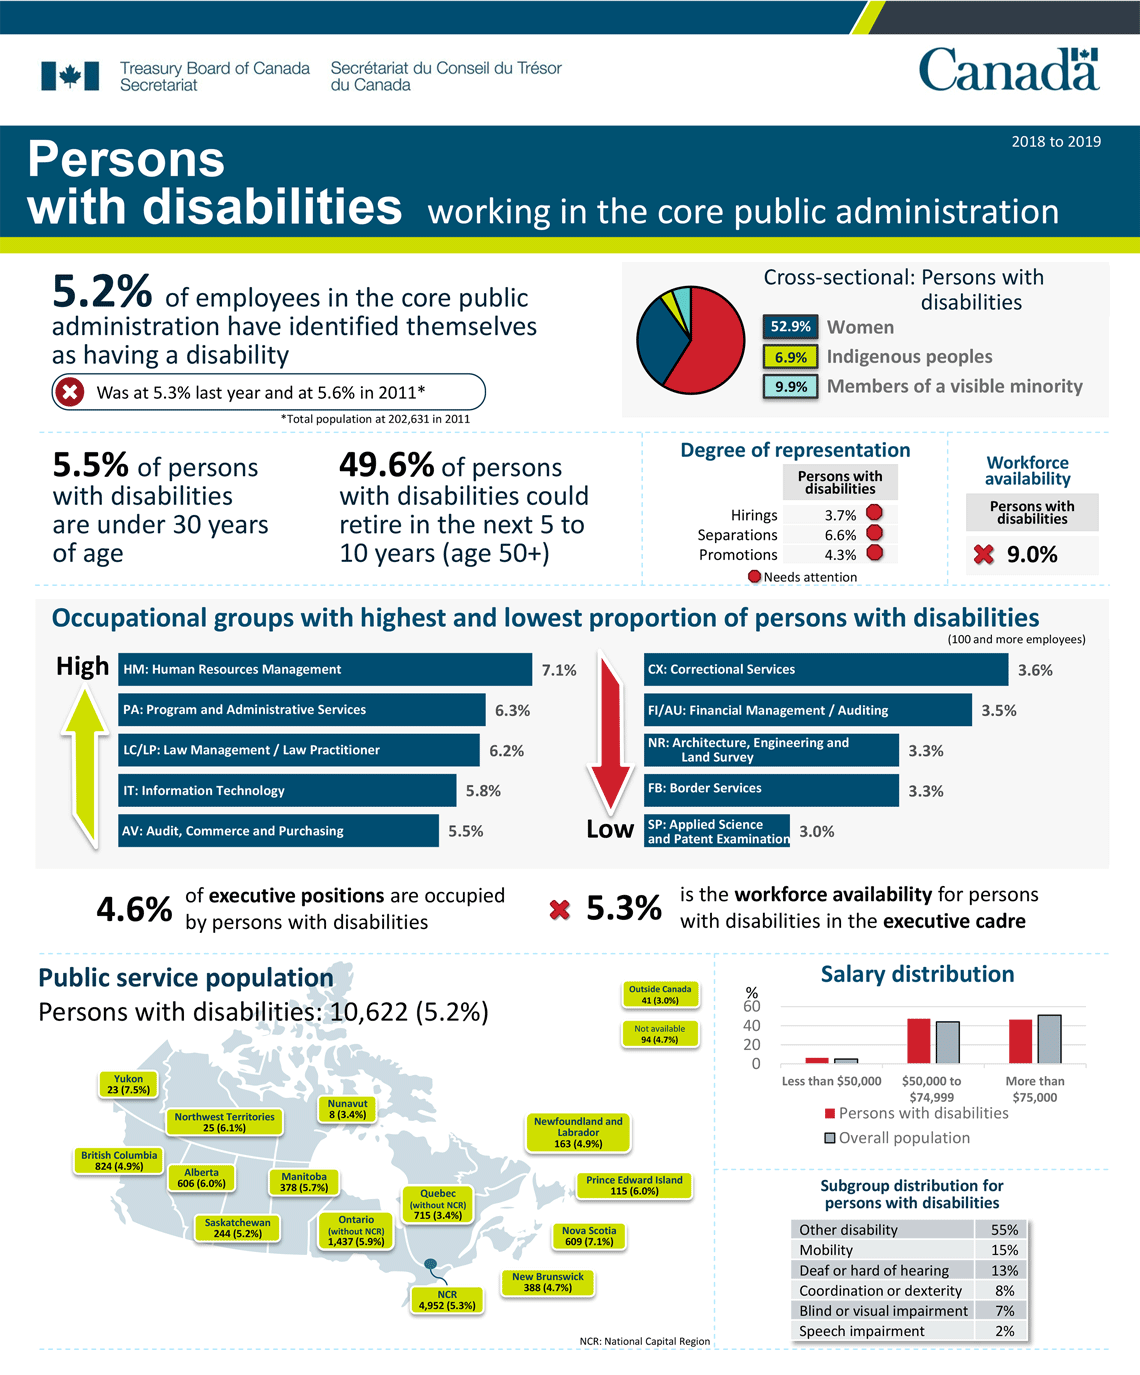
5.2% of employees in the core public administration have identified themselves as having a disability. Was at 5.3% last year and at 5.6% in 2011. (Total population at 202,631 in 2011)
Cross-sectional analysis for persons with disabilities:
- 52.9% are women
- 6.9% have identified themselves as Indigenous
- 9.9% have identified themselves as a member of a visible minority group
5.5% of persons with disabilities are under 30 years of age.
49.6% of persons with disabilities could retire in the next 5 to 10 years (50 years of age or older).
Degree of representation for hirings, separations and promotions for persons with disabilities:
- hirings: 3.7%
- separations: 6.6%
- promotions: 4.3%
In these figures for degree of representation, a note of “needs attention” is indicated for hirings, separations and promotions.
The workforce availability for persons with disabilities is 9.0%. The representation of persons with disabilities is lower than their workforce availability.
Occupational groups with highest proportion of persons with disabilities (100 and more employees):
- HM - Human Resources Management: 7.1%
- PA - Programs and Administrative Services: 6.3%
- LC/LP - Law Management / Law Practitioner: 6.2%
- IT - Information Technology: 5.8%
- AV - Commerce and Purchasing: 5.5%
Occupational groups with lowest proportion of persons with disabilities (100 and more employees):
- CX - Correctional Services: 3.6%
- FI/AU - Financial Group / Auditing: 3.5%
- FB - Border Services: 3.3%
- NR - Architecture, Engineering and Land Survey: 3.3%
- SP - Applied Science and Patent Examination: 3.0%
4.6% of executive positions are occupied by persons with disabilities, which is lower than their workforce availability of 5.3% at the executive level.
Salary distribution:
| Salary | Persons with disabilities | Overall population |
|---|---|---|
| Less than $50,000 | 6% | 5% |
| $50,000 to $74,999 | 47% | 44% |
| More than $75,000 | 46% | 51% |
Sub-group distribution for persons with disabilities:
- other disability: 55%
- mobility: 15%
- deaf of hard of hearing: 13%
- coordination or dexterity: 8%
- blind or visual impairment: 7%
- speech impairment: 2%
The population of persons with disabilities in the public service population is 10,622, or 5.2%, with the following subtotals by province, territory and other categories:
- Newfoundland and Labrador: 163 (4.9%)
- Prince Edward Island: 115 (6.0%)
- Nova Scotia: 609 (7.1%)
- New Brunswick: 388 (4.7%)
- Quebec (without the National Capital Region): 715 (3.4%)
- National Capital Region: 4,952 (5.3%)
- Ontario (without the National Capital Region): 1,437 (5.9%)
- Manitoba: 378 (5.7%)
- Saskatchewan: 244 (5.2%)
- Alberta: 606 (6.0%)
- British Columbia: 824 (4.9%)
- Yukon: 23 (7.5%)
- Northwest Territories: 25 (6.1%)
- Nunavut: 8 (3.4%)
- outside Canada: 41 (3.0%)
- not available: 94 (4.7%)
The source of the representation data is the Treasury Board of Canada Secretariat Employment Equity Data Bank, which is populated with self-identification information provided by employees.
To learn more
- Where Departments Should Start: Accessibility Strategy for the Public Service of Canada
- Opportunities Fund for Persons with Disabilities
Infographic 5 - Text version
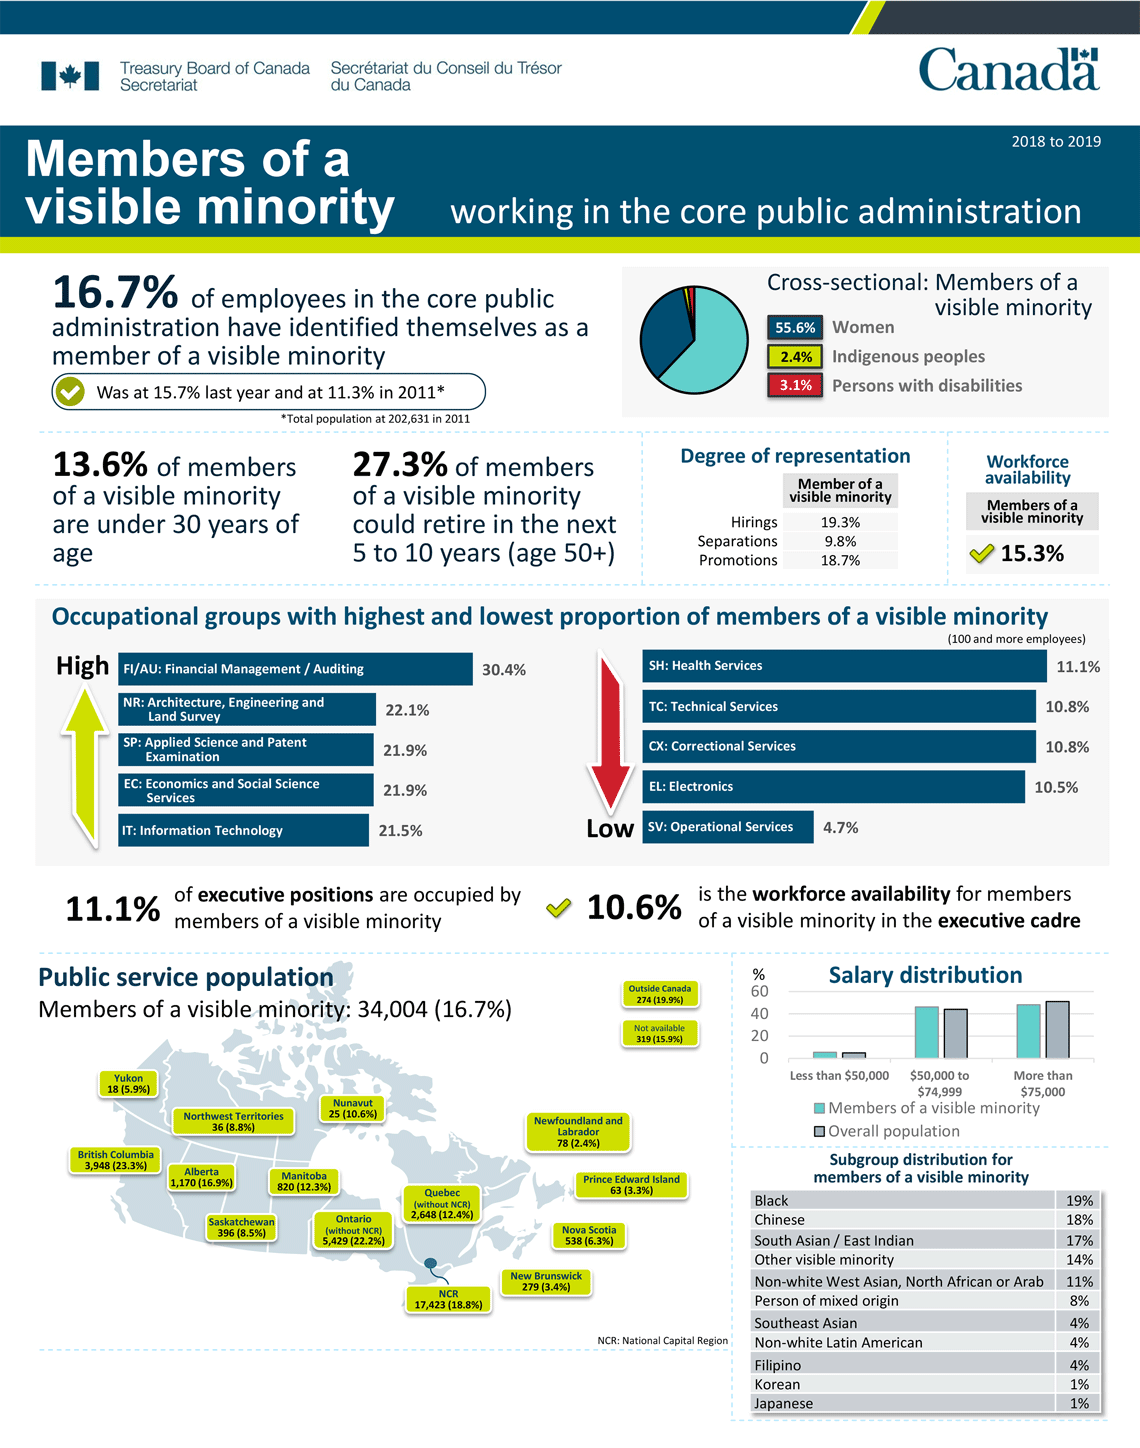
16.7% of employees in the core public administration have identified themselves as a member of a visible minority. Was at 15.7% last year and at 11.3% in 2011 (Total population at 202,631 in 2011)
Cross-sectional analysis for members of a visible minority:
- 55.6% are women
- 2.4% have identified themselves as Indigenous
- 3.1% have identified themselves as having a disability
13.6% of members of a visible minority are under 30 years of age.
27.3% of members of a visible minority could retire in the next 5 to 10 years (50 years of age or older).
Degree of representation for hirings, separations and promotions for members of a visible minority:
- hirings: 19.3%
- separations: 9.8%
- promotions: 18.7%
The workforce availability for members of a visible minority is 15.3%. The representation of members of a visible minority is higher than their workforce availability.
Occupational groups with highest proportion of members of a visible minority (100 and more employees):
- FI/AU - Financial Management / Auditing: 30.4%
- NR - Architecture, Engineering and Land Survey: 22.1%
- SP - Applied Science and Patent Examination: 21.9%
- EC - Economics and Social Sciences Services: 21.9%
- IT - Information Technology: 21.5%
Occupational groups with lowest proportion of members of a visible minority (100 and more employees):
- SH - Health Services: 11.1%
- TC - Technical Services: 10.8%
- CX - Correctional Services: 10.8%
- EL - Electronics: 10.5%
- SV - Operational Services: 4.7%
11.1% of executive positions are occupied by members of a visible minority, which is higher than their workforce availability of 10.6% at the executive level.
Salary distribution:
| Salary | Members of a visible minority | Overall population |
|---|---|---|
| Less than $50,000 | 6% | 5% |
| 50,000 to $74,999 | 46% | 44% |
| More than $75,000 | 48% | 51% |
Sub-group distribution for members of a visible minority:
- Black: 19%
- Chinese: 18%
- South Asian/East Indian: 17%
- other visible minority: 14%
- non-white West Asian, North African or Arab: 11%
- person of mixed origin: 8%
- Southeast Asian: 4%
- non-white Latin American: 4%
- Filipino: 4%
- Korean: 1%
- Japanese: 1%
The population of members of a visible minority in the public service population is 34,004, or 16.7%, with the following subtotals by province, territory and other categories:
- Newfoundland and Labrador: 78 (2.4%)
- Prince Edward Island: 63 (3.3%)
- Nova Scotia: 538 (6.3%)
- New Brunswick: 279 (3.4%)
- Quebec (without the National Capital Region): 2,648 (12.4%)
- National Capital Region: 17,423 (18.8%)
- Ontario (without the National Capital Region): 5,429 (22.2%)
- Manitoba: 820 (12.3%)
- Saskatchewan: 396 (8.5%)
- Alberta: 1,710 (16.9%)
- British Columbia: 3,948 (23.3%)
- Yukon: 18 (5.9%)
- Northwest Territories: 36 (8.8%)
- Nunavut: 25 (10.6%)
- outside Canada: 274 (19.9%)
- not available: 319 (15.9%)
The source of the representation data is the Treasury Board of Canada Secretariat Employment Equity Data Bank, which is populated with self-identification information provided by employees.
To learn more
Toward a culture of diversity and inclusion in the public service
-
In this section
- Accessibility Strategy for the Public Service
- Centre for Wellness, Inclusion and Diversity
- Centre of Expertise on Mental Health in the Workplace
- Leadership development
- Consultations between the Treasury Board and its employees’ representatives
- Recruitment approaches for employment equity
- Learning initiatives: Indigenous Learning Series
- Learning initiatives: respectful and inclusive workplace
- Harassment and violence prevention
- Knowledge Circle for Indigenous Inclusion
Employment equity is one of several closely related concepts that form the foundation of a diverse and inclusive public service. Other themes such as respect in the workplace, value and ethics, mental health, and wellness both support and are supported by employment equity.
In order to create the shifts in mindsets and culture required to achieve employment equity, numerous initiatives have been undertaken, including government-wide strategies and plans, specific activities for designated groups, and skills development for leaders. Highlights of these initiatives are provided in the following.Accessibility Strategy for the Public Service
In 2018–19, the Treasury Board of Canada Secretariat’s (TBS’s) Office of Public Service Accessibility (OPSA) developed the Accessibility Strategy for the Public Service, which was launched in May 2019. The Strategy is a roadmap to help the Government of Canada lead by example in:
- removing barriers to accessibility and inclusion
- increasing the number of persons with disabilities recruited into the public service
One of the key features of the Strategy is a commitment that the federal public service will hire an additional 5,000 persons with disabilities by 2025.
To support the implementation of the Strategy, OPSA has established a tiered interdepartmental governance model to oversee and coordinate planning and actions, and to report on progress and results. The Centralized Enabling Workplace Fund further advances the federal public service’s workplace accommodation practices.
Centre for Wellness, Inclusion and Diversity
Following the government announcement through Budget 2018, TBS established and launched the Centre for Wellness, Inclusion and Diversity (CWInD) in June 2019 to provide leaders at all levels with tangible solutions to support the wellness, inclusion and diversity agenda.
CWInD has two main functions:
- support wellness, inclusion and diversity commitments throughout the public service
- identify innovative ways to create safer, healthier, and more inclusive and diverse workplaces
CWInD provides single-window access to resources to departmental leaders on wellness, inclusion, diversity, and the prevention of harassment and violence. It also uses a qualitative research approach, referred to as the Smart Dive, to explore ways to bridge the gap between the intent of the Policy on People Management in the public service and the way that people behave, work and experience the workplace.
Centre of Expertise on Mental Health in the Workplace
Established in 2017, the Centre of Expertise on Mental Health in the Workplace, a collaboration between departmental officials and bargaining agents, provides support, expertise, guidance and leadership to address psychological health and safety in Canada’s federal public service.
As part of its mandate, the Centre supports federal organizations to deliver on the objectives of the Federal Public Service Workplace Mental Health Strategy and align with the National Standard of Canada for Psychological Health and Safety in the Workplace. In January 2019, the Centre published the Steering Committee on Mental Health in the Public Service’s third report, entitled Building Success: A Guide to Establishing and Maintaining a Psychological Health and Safety Management System in the Federal Public Service.
In addition, the Centre:
- manages a best practices repository for managers, employees and organizations
- convenes quarterly meetings of the Mental Health and Wellness Champions’ Committee
- facilitates the Mental Health Office of Primary Interest Network
- supports the Federal Speakers’ Bureau on Healthy Workplaces
Leadership development
The Office of the Chief Human Resources Officer of TBS (OCHRO-TBS) leads an Executive Leadership Development Program (ELDP), which is a government-wide program to enrich leadership competencies and build capacity in the executive community. The ELDP targets its approach to address gaps in skills and diversity among the executive group. In 2018–19, 86 employees participated in the program. Of this group, more than 50% of the participants represent at least one of the four employment equity designated groups.
In 2018–19, Crown-Indigenous Relations and Northern Affairs Canada continued to support the public service–wide Aboriginal Leadership Development Initiative (ALDI). ALDI works to prepare Indigenous employees to assume greater leadership roles and positively impact decision-making in their respective departments and across the federal public service.
Consultations between the Treasury Board and its employees’ representatives
TBS consults and collaborates with bargaining agents through the Joint Employment Equity Committee, a national forum through which employment equity, wellness, diversity and inclusion are discussed with employees’ representatives, departments, the Public Service Commission of Canada (PSC) and TBS. During 2018–19, the committee discussed or held consultations on:
- the mandate and planned activities of CWInD, including the establishment of a senior executive advisory committee to focus on diversity and inclusion
- feedback on Treasury Board policies for managing people, including the new Directive on Employment Equity, Diversity and Inclusion (April 1, 2020)
Recruitment approaches for employment equity
The government continues to pursue a strategic approach to recruitment that directly engages certain designated groups, including through the Indigenous Student Employment Opportunity and the Employment Opportunity for Students with Disabilities, both administered by PSC.
Through these programs, in 2018–19, the government hired 226 Indigenous students and 113 students with disabilities.
In April 2018, TBS and the PSC jointly challenged federal government organizations to hire 100 persons with intellectual disabilities in 2018–19. As a result, 95 persons with intellectual disabilities have been hired to date, but only four were hired indeterminately. However, the employment equity data do not reflect the increased integration of persons with intellectual disabilities, since casual and part-time employees, as well as employees whose term is less than three months, are not statistically considered. This experience provided valuable lessons and led to the development of tools to hire, on-board and develop employees with intellectual disabilities.
Learning initiatives: Indigenous Learning Series
In 2018, the Canada School of Public Service (CSPS) declared Indigenous learning as one of its five distinct business lines. This business line incorporates the Indigenous Learning Series, which was established in 2016 in response to Call to Action 57 of Truth and Reconciliation Commission of Canada: Calls to Action.
The goals of the CSPS in establishing this distinct business line are to:
- promote effective working relationships with diverse Indigenous populations and public servants
- support the development of federal policies and programs that meet the unique needs and realities of Indigenous peoples across Canada
The CSPS’s Indigenous learning business line provides the public service with access to resources and learning that are designed to:
- help public servants develop a deeper understanding of Indigenous cultures, history and modern-day issues that they will incorporate in their day-to-day work
- provide the knowledge, skills and competencies needed to contribute to the Government of Canada’s reconciliation agenda
- support executives to foster changes in behaviours and practices in the public service to be inclusive of Indigenous employees and Indigenous perspectives
Learning initiatives: respectful and inclusive workplace
In late 2019, CSPS launched its respectful and inclusive workplace business line in support of the Government of Canada’s ongoing commitment to providing an environment where employees are treated with respect, dignity and fairness. The overarching expected result is to create healthy and respectful workplaces across the public service.
The goal of this business line is to develop knowledge, skills and competencies in the following areas:
- harassment prevention
- accessibility
- occupational health and safety
- unconscious bias
- mental health
- positive space for lesbian, gay, bisexual, trans(gender), queer, two-spirit people and other people of gender identities or expressions and sexual orientations (LGBTQ2+) individuals
- gender-based analysis
Advances in these areas will help organizations and employees create and sustain a culture that promotes and preserves psychological health, safety and well-being in all aspects of the workplace through collaboration, inclusivity and respect. Developing such a culture will help the public service become more agile, inclusive and equipped, in line with the Government of Canada’s public service renewal efforts outlined in Beyond 2020.
Harassment and violence prevention
A deputy minister task team on harassment reviewed the public service harassment prevention policy framework and identified actions that will better support employees in the context of Bill C-65, An Act to Amend the Canada Labour Code (Harassment and Violence), the Parliamentary Employment and Staff Relations Act and the Budget Implementation Act, 2017, No. 1.
The products of that review included a report entitled Safe Workspaces: Starting a Dialogue and Taking Action on Harassment in the Public Service, which included the following proposed actions that the government continues to undertake:
- prevent harassment from occurring
- respond to situations in which harassment has occurred
- support victims of harassment
Knowledge Circle for Indigenous Inclusion
In June 2019, the Knowledge Circle for Indigenous Inclusion (KCII) was established as a result of the Many Voices One Mind: A Pathway to Reconciliation report recommendation. The goal of KCII is to act as:
- a culturally competent focal point for liaison
- a safe space for conversations
- a source of expertise for guidance, support and advice for Indigenous employees, managers and executives in the public service
To support the transformation needed within the public service Indigenous inclusion, the KCII will also conduct research and analysis to build an inventory of good practices in terms of recruitment, retention, talent management, career mobility, training and development.
Employee networks
Employee engagement is essential in shaping the future of equity, diversity and inclusion in the Government of Canada. The government continues to support positive approaches and practices led by employees. The following sections highlight the goals of three of these networks and some of the activities they carried out this year.
The Indigenous Federal Employee Network
The Indigenous Federal Employee Network (IFEN) brings together public servants from across Canada to ensure that Indigenous public servants have access to an interdepartmental community that is healthy, inclusive and supportive, and that addresses the needs and aspirations of all Indigenous employees.
The IFEN aims to:
- build a welcoming and collaborative interdepartmental community
- contribute to an inclusive workplace, free of lateral violence and discriminationFootnote 1
- contribute to the personal and professional growth and retention of Indigenous public servants at all levels
- offer an advisory function and social support to Indigenous public servants
- help Indigenous employees “walk in two worlds” by balancing their indigeneity with being a public servant
The IFEN also endeavours to bring together individuals within the federal public service, both in the National Headquarters and in the Regions, to provide a forum and carry out activities in the following areas:
- provide professional networking and information-sharing
- support professional development and personal growth
- explore career advancement, recruitment and retention practices
- make recommendations to senior management in areas that affect First Nations, Inuit and Métis employees
- promote a fair, equitable and respectful work environment through cross-cultural understanding by supporting learning and teaching activities and events related to First Nations, Inuit and Métis peoples
The Indigenous Federal Executive Network
In April 2018, the Indigenous Executive Network (IEXN) was launched in response to a recommendation in Many Voices One Mind: A Pathway to Reconciliation to support, engage and communicate with Indigenous employees and partners.
The IEXN meets quarterly, with additional special meetings convened on an as-needed basis. At least one meeting a year is dedicated to a specific learning and development priority identified by the IEXN community.
Federal Black Employee Caucus
The Federal Black Employee Caucus (FBEC) was established in January 2018 and supports efforts nationally, regionally and locally to address issues faced by Black federal public servants.
The two main objectives of the FBEC are to:
- collect disaggregated employment equity data to better understand the challenges faced by Black federal public service employees within the federal public service
- support the mental health of Black employees by focusing on government initiatives to reduce harassment and discrimination in the workplace
Over the last year, the FBEC raised awareness on issues of concern among Black public servants and, in January 2019, hosted a national symposium to engage Black federal public servants and allies in examining the reality of Black employees in the federal public service. Topics of discussion included data and representation, Black women and intersectionality, mental health, and discrimination. The FBEC also contributed to the preparation of the Senior Leaders Learning Session on anti-Black racism in February 2019.
The way forward: progress in adopting an inclusive mindset
Approach to collecting data on gender-diverse employees
The term “gender equality” has a meaning that is broader than that of the traditional binary male and female definitions. The federal public service is studying various aspects of gender, including gender diversity, to support the conditions for greater equality in the core public administration.
TBS is participating in a government-wide approach to examine how federal programs and services collect, use and display sex and gender information. The vision is to promote respect for and inclusion of gender-diverse people living in Canada, including federal public servants. At the same time, these efforts will support the collection of accurate disaggregated data on sex and gender for program operations, policy and planning, analysis, and evidence-based decision‑making.
Amendments to people management policies
TBS is pleased to announce an update of the Treasury Board Policy on People Management and Policy on the Management of Executives, as of April 1, 2020. These policy suites include the modernized and broadened Directive on Employment Equity, Diversity and Inclusion and Directive on the Duty to Accommodate. For example, the new Directive on the Duty to Accommodate applies to all employees instead of persons with disabilities only. TBS is working with core public administration organizations to support the implementation of these new policy suites, with a view to focus on changing mindsets and behaviours across the enterprise and maximizing the new flexibilities provided by these instruments in support of building an agile, inclusive and equipped public service.
Approach to data collection
TBS is working to modernize self-identification processes and forms to better capture subgroup data that would allow the public service to design tailored strategies and programs.
UN International Decade for People of African Descent
In 2018, the Government of Canada officially recognized the UN International Decade for People of African Descent (UNDPAD) 2015–2024, which:
- recognizes people of African descent as a distinct group whose human rights must be promoted and protected
- highlights the important contributions of people of African descent
- provides a framework under the pillars of “recognition, justice, and development” that encourages countries to address anti-Black racism and discrimination
TBS committed to collect subgroup data to better understand the challenges faced by Black Canadians in the federal public service.
Final word
As we look to the next year, the government will continue to strengthen its efforts to advance diversity and inclusion in recognizing the benefits of having a diverse talent pool that reflects the composition of the Canadian population that it serves.
Overall, while three of the four employment equity designated groups exceeded WFA in 2018–19, a number of areas require our sustained attention, including for Indigenous peoples and persons with disabilities.
Given these challenges, TBS encourages departments and agencies to:
- ensure that employment equity considerations are built into their integrated human resources and business planning
- promote employee self-identification, especially at the subgroup levels
- continue to identify and remove barriers for the four designated groups
- undertake operational and strategic human resources employment equity planning
- include diversity and inclusion in strategic recruitment plans
- review learning, development, and education and awareness initiatives with a diversity and inclusion lens
TBS and its partners at OPSA, PSC and CSPS, offer several internal tools and support to assist departments in meeting their roles and responsibilities.
About this report
The Employment Equity Act came into force in 1986 with the goal of achieving equality in the workplace. It seeks to correct the conditions of disadvantage experienced by four designated groups by giving effect to the principles that employment equity requires special measures and the accommodation of differences. The four employment equity groups are:
- women
- Indigenous peoples
- persons with disabilities
- members of visible minorities
In 1996, Canada’s federal public service became subject to the Act and the Employment Equity Regulations.
Each fiscal year, the President of the Treasury Board must table a report in Parliament on the state of employment equity of the four designated groups within the core public administration,Footnote 2 as well as similar reports produced by separate operating agencies with 100 or more employees.Footnote 3
About the data
The data in this report focuses on employees to whom the Regulations apply, namely:
- indeterminate employees
- employees on a term of three months or more
- seasonal employees
These three categories comprise 92.3% of the overall population of the core public administration.
The data in this report on representation of employees in the four designated groups is based on a mandatory self-identification form (paper or electronic) provided to all new employees. Employees may voluntarily self-identify as belonging to more than one of the designated groups.
On average, 88.3% of core public service employees complete the self-identification questionnaire. This high rate of self-identification allows for a high degree of confidence in the analysis.Appendix: statistical tables of employment equity data specific to compliance requirements of section 21 of the Employment Equity Act
Table 1: distribution of public service of Canada employees by designated group according to department or agency
The following table includes information (as of March 31, 2019) regarding indeterminates, terms of three months or more, and seasonal employees of organizations captured under the Financial Administration Act, Schedules I and IV
| Department or agency | All employees | Women | Indigenous peoples | Persons with disabilities | Members of visible minorities | ||||
|---|---|---|---|---|---|---|---|---|---|
| Overall WFA | 52.7% | 4.0% | 9.0% | 15.3% | |||||
| Number | Number | % | Number | % | Number | % | Number | % | |
| Employment and Social Development Canada | 24,142 | 16,378 | 67.8 | 1,091 | 4.5 | 1,502 | 6.2 | 5,553 | 23.0 |
| National Defencetable A1 note † | 23,996 | 9,685 | 40.4 | 845 | 3.5 | 1,418 | 5.9 | 2,306 | 9.6 |
| Correctional Service Canada | 17,071 | 8,313 | 48.7 | 1,775 | 10.4 | 1,015 | 5.9 | 1,827 | 10.7 |
| Public Services and Procurement Canada | 14,549 | 8,678 | 59.6 | 506 | 3.5 | 747 | 5.1 | 2,257 | 15.5 |
| Canada Border Services Agency | 13,246 | 6,176 | 46.6 | 464 | 3.5 | 468 | 3.5 | 2,274 | 17.2 |
| Fisheries and Oceans Canadatable A1 note ‡ | 11,211 | 4,497 | 40.1 | 529 | 4.7 | 465 | 4.1 | 741 | 6.6 |
| Health Canada | 10,122 | 6,767 | 66.9 | 825 | 8.2 | 544 | 5.4 | 2,421 | 23.9 |
| Royal Canadian Mounted Police (Civilian Staff) | 7,271 | 5,527 | 76.0 | 425 | 5.8 | 285 | 3.9 | 982 | 13.5 |
| Immigration, Refugees and Citizenship Canada | 6,896 | 4,476 | 64.9 | 230 | 3.3 | 310 | 4.5 | 2,090 | 30.3 |
| Environment and Climate Change Canada | 6,436 | 3,224 | 50.1 | 192 | 3.0 | 308 | 4.8 | 1,112 | 17.3 |
| Shared Services Canada | 6,071 | 1,933 | 31.8 | 202 | 3.3 | 364 | 6.0 | 1,120 | 18.4 |
| Global Affairs Canada | 5,873 | 3,259 | 55.5 | 336 | 5.7 | 220 | 3.7 | 1,345 | 22.9 |
| Transport Canada | 5,299 | 2,353 | 44.4 | 199 | 3.8 | 224 | 4.2 | 905 | 17.1 |
| Statistics Canada | 5,008 | 2,493 | 49.8 | 127 | 2.5 | 293 | 5.9 | 1,216 | 24.3 |
| Innovation, Science and Economic Development Canada | 4,986 | 2,536 | 50.9 | 144 | 2.9 | 220 | 4.4 | 1,031 | 20.7 |
| Agriculture and Agri-Food Canada | 4,636 | 2,399 | 51.7 | 151 | 3.3 | 197 | 4.2 | 754 | 16.3 |
| Crown-Indigenous Relations and Northern Affairs | 4,551 | 2,959 | 65.0 | 1,209 | 26.6 | 240 | 5.3 | 687 | 15.1 |
| Department of Justice Canada | 4,433 | 3,054 | 68.9 | 178 | 4.0 | 278 | 6.3 | 880 | 19.9 |
| Natural Resources Canada | 4,095 | 1,904 | 46.5 | 108 | 2.6 | 186 | 4.5 | 643 | 15.7 |
| Veterans Affairs Canada | 2,883 | 2,106 | 73.0 | 117 | 4.1 | 222 | 7.7 | 263 | 9.1 |
| Public Health Agency of Canada | 2,112 | 1,443 | 68.3 | 65 | 3.1 | 116 | 5.5 | 452 | 21.4 |
| Treasury Board of Canada Secretariat | 1,941 | 1,165 | 60.0 | 55 | 2.8 | 123 | 6.3 | 383 | 19.7 |
| Canadian Heritage | 1,700 | 1,137 | 66.9 | 78 | 4.6 | 89 | 5.2 | 241 | 14.2 |
| Public Safety Canada | 1,150 | 678 | 59.0 | 54 | 4.7 | 76 | 6.6 | 180 | 15.7 |
| Immigration and Refugee Board of Canada | 1,083 | 679 | 62.7 | 43 | 4.0 | 50 | 4.6 | 362 | 33.4 |
| Public Prosecution Service of Canada | 970 | 642 | 66.2 | 63 | 6.5 | 62 | 6.4 | 137 | 14.1 |
| Privy Council Office | 962 | 546 | 56.8 | 37 | 3.8 | 35 | 3.6 | 161 | 16.7 |
| Library and Archives Canada | 897 | 557 | 62.1 | 37 | 4.1 | 40 | 4.5 | 77 | 8.6 |
| Public Service Commission of Canada | 799 | 530 | 66.3 | 36 | 4.5 | 55 | 6.9 | 164 | 20.5 |
| Department of Finance Canada | 764 | 349 | 45.7 | 16 | 2.1 | 26 | 3.4 | 142 | 18.6 |
| Courts Administration Service | 638 | 414 | 64.9 | 15 | 2.4 | 40 | 6.3 | 130 | 20.4 |
| Canadian Space Agency | 605 | 269 | 44.5 | 7 | 1.2 | 33 | 5.5 | 106 | 17.5 |
| Elections Canada | 598 | 317 | 53.0 | 18 | 3.0 | 37 | 6.2 | 106 | 17.7 |
| Atlantic Canada Opportunities Agency | 551 | 357 | 64.8 | 14 | 2.5 | 31 | 5.6 | 26 | 4.7 |
| Canada School of Public Service | 530 | 356 | 67.2 | 20 | 3.8 | 31 | 5.8 | 102 | 19.2 |
| Canadian Radio-television and Telecommunications Commission | 446 | 245 | 54.9 | 24 | 5.4 | 15 | 3.4 | 72 | 16.1 |
| Infrastructure Canada | 442 | 282 | 63.8 | 14 | 3.2 | 22 | 5.0 | 84 | 19.0 |
| Administrative Tribunals Support Service of Canada | 435 | 281 | 64.6 | 11 | 2.5 | 27 | 6.2 | 62 | 14.3 |
| Canadian Grain Commission | 418 | 202 | 48.3 | 25 | 6.0 | 18 | 4.3 | 101 | 24.2 |
| Parole Board of Canada | 388 | 312 | 80.4 | 26 | 6.7 | 22 | 5.7 | 58 | 14.9 |
| Canadian Environmental Assessment Agencytable A1 note § | 295 | 191 | 64.7 | 16 | 5.4 | 7 | 2.4 | 31 | 10.5 |
| Economic Development Agency of Canada for the Regions of Quebec | 293 | 163 | 55.6 | table A2 note * | table A2 note * | 11 | 3.8 | 40 | 13.7 |
| Western Economic Diversification Canada | 281 | 167 | 59.4 | 19 | 6.8 | 11 | 3.9 | 56 | 19.9 |
| Canadian Transportation Agency | 243 | 139 | 57.2 | table A1 note * | table A1 note * | 13 | 5.3 | 46 | 18.9 |
| Offices of the Information and Privacy Commissioners of Canada | 223 | 137 | 61.4 | 10 | 4.5 | 7 | 3.1 | 28 | 12.6 |
| Federal Economic Development Agency for Southern Ontario | 208 | 137 | 65.9 | 5 | 2.4 | 18 | 8.7 | 51 | 24.5 |
| Transportation Safety Board of Canada | 199 | 73 | 36.7 | table A1 note * | table A1 note * | 8 | 4.0 | 25 | 12.6 |
| Registrar of the Supreme Court of Canada | 189 | 114 | 60.3 | 12 | 6.3 | 12 | 6.3 | 11 | 5.8 |
| Canadian Human Rights Commission | 184 | 129 | 70.1 | 8 | 4.3 | 32 | 17.4 | 33 | 17.9 |
| Office of the Commissioner of Official Languages | 153 | 102 | 66.7 | 5 | 3.3 | 7 | 4.6 | 16 | 10.5 |
| Office of the Governor General’s Secretary | 123 | 80 | 65.0 | table A1 note * | table A1 note * | 11 | 8.9 | 17 | 13.8 |
| Status of Women Canada | 117 | 103 | 88.0 | table A1 note * | table A1 note * | table A1 note * | table A1 note * | 25 | 21.4 |
| Canadian Northern Economic Development Agency | 68 | 43 | 63.2 | 20 | 29.4 | table A1 note * | table A1 note * | 13 | 19.1 |
| Patented Medicine Prices Review Board Canada | 68 | 35 | 51.5 | table A1 note * | table A1 note * | table A1 note * | table A1 note * | 10 | 14.7 |
| Veterans Review and Appeal Board | 65 | 49 | 75.4 | table A1 note * | table A1 note * | 7 | 10.8 | 0 | 0.0 |
| Civilian Review and Complaints Commission for the RCMP | 65 | 33 | 50.8 | table A1 note * | table A1 note * | table A1 note * | table A1 note * | 12 | 18.5 |
| Canadian Dairy Commission | 63 | 35 | 55.6 | table A1 note * | table A1 note * | table A1 note * | table A1 note * | 12 | 19.0 |
| Office of the Commissioner for Federal Judicial Affairs Canada | 54 | 36 | 66.7 | table A1 note * | table A1 note * | table A1 note * | table A1 note * | 7 | 13.0 |
| Military Grievances External Review Committee | 32 | 18 | 56.3 | table A1 note * | table A1 note * | table A1 note * | table A1 note * | table A1 note * | table A1 note * |
| International Joint Commission | 27 | 13 | 48.1 | 0 | 0.0 | table A1 note * | table A1 note * | table A1 note * | table A1 note * |
| Office of the Public Sector Integrity Commissioner of Canada | 23 | 11 | 47.8 | table A1 note * | table A1 note * | table A1 note * | table A1 note * | table A1 note * | table A1 note * |
| Office of the Commissioner of Lobbying of Canada | 23 | 9 | 39.1 | 0 | 0.0 | table A1 note * | table A1 note * | table A1 note * | table A1 note * |
| Military Police Complaints Commission of Canada | 22 | 14 | 63.6 | table A1 note * | table A1 note * | table A1 note * | table A1 note * | 5 | 22.7 |
| Canadian Intergovernmental Conference Secretariat | 20 | 13 | 65.0 | table A1 note * | table A1 note * | table A1 note * | table A1 note * | table A1 note * | table A1 note * |
| Copyright Board Canada | 14 | 6 | 42.9 | 0 | 0.0 | 0 | 0.0 | table A1 note * | table A1 note * |
| RCMP External Review Committee | 7 | table A1 note * | table A1 note * | 0 | 0.0 | 0 | 0.0 | 0 | 0.0 |
| Secretariat of the National Security and Intelligence Committee of Parliamentarians | 5 | table A1 note * | table A1 note * | 0 | 0.0 | 0 | 0.0 | 0 | 0.0 |
| Total | 203,268 | 111,332 | 54.8 | 10,435 | 5.1 | 10,622 | 5.2 | 34,004 | 16.7 |
Table A1 NotesNotes WFA: workforce availability The sum of designated groups does not equal the total (“all employees”) because employees may have chosen to self-identify in more than one designated group, and men are included in the total.
|
|||||||||
Table 2: distribution of public service of Canada employees by designated group and region of work
The following table includes information (as of March 31, 2019) regarding indeterminates, terms of three months or more, and seasonal employees of organizations captured under the Financial Administration Act, Schedules I and IV
| Region of work | All employees | Women | Indigenous peoples | Persons with disabilities | Members of visible minorities | ||||
|---|---|---|---|---|---|---|---|---|---|
| Number | Number | % | Number | % | Number | % | Number | % | |
| Newfoundland and Labrador | 3,315 | 1,565 | 47.2 | 227 | 6.8 | 163 | 4.9 | 78 | 2.4 |
| Prince Edward Island | 1,903 | 1,215 | 63.8 | 44 | 2.3 | 115 | 6.0 | 63 | 3.3 |
| Nova Scotia | 8,587 | 3,946 | 46.0 | 475 | 5.5 | 609 | 7.1 | 538 | 6.3 |
| New Brunswick | 8,172 | 4,760 | 58.2 | 298 | 3.6 | 388 | 4.7 | 279 | 3.4 |
| Quebec (without the NCR)table 2 note † | 21,324 | 11,115 | 52.1 | 520 | 2.4 | 715 | 3.4 | 2,638 | 12.4 |
| NCR (Quebec)table 2 note † | 28,705 | 16,563 | 57.7 | 1,483 | 5.2 | 1,464 | 5.1 | 4,987 | 17.4 |
| NCR (Ontario)table 2 note † | 64,073 | 35,484 | 55.4 | 2,216 | 3.5 | 3,488 | 5.4 | 12,436 | 19.4 |
| NCR† | 92,778 | 52,047 | 56.1 | 3,699 | 4.0 | 4,952 | 5.3 | 17,423 | 18.8 |
| Ontario (without the NCR)table 2 note † | 24,452 | 13,534 | 55.3 | 1,199 | 4.9 | 1,437 | 5.9 | 5,429 | 22.2 |
| Manitoba | 6,687 | 3,819 | 57.1 | 968 | 14.5 | 378 | 5.7 | 820 | 12.3 |
| Saskatchewan | 4,654 | 2,805 | 60.3 | 824 | 17.7 | 244 | 5.2 | 396 | 8.5 |
| Alberta | 10,135 | 5,684 | 56.1 | 822 | 8.1 | 606 | 6.0 | 1,710 | 16.9 |
| British Columbia | 16,931 | 8,424 | 49.8 | 1,006 | 5.9 | 824 | 4.9 | 3,948 | 23.3 |
| Yukon | 305 | 192 | 63.0 | 52 | 17.0 | 23 | 7.5 | 18 | 5.9 |
| Northwest Territories | 410 | 251 | 61.2 | 69 | 16.8 | 25 | 6.1 | 36 | 8.8 |
| Nunavut | 236 | 145 | 61.4 | 105 | 44.5 | 8 | 3.4 | 25 | 10.6 |
| Outside Canada | 1,375 | 677 | 49.2 | 45 | 3.3 | 41 | 3.0 | 274 | 19.9 |
| Not availabletable 2 note * | 2,004 | 1,153 | 57.5 | 82 | 4.1 | 94 | 4.7 | 319 | 15.9 |
| Total | 203,268 | 111,332 | 54.8 | 10,435 | 5.1 | 10,622 | 5.2 | 34,004 | 16.7 |
Table 2 NotesNotes The source of the representation data is the Treasury Board of Canada Secretariat Employment Equity Data Bank, which is populated with self-identification information provided by employees. The sum of designated groups does not equal the total (“all employees”) because employees may have chosen to self-identify in more than one designated groups, and men are included in the total. Representation by region is provided for information to support data reporting although WFA is provided only at the national, aggregate level for the public service of Canada.
|
|||||||||
Table 3.1: distribution of public service of Canada employees by designated group and occupational groups in force
The following table includes information (as of March 31, 2019) regarding indeterminates, terms of three months or more, and seasonal employees of organizations captured under the Financial Administration Act, Schedules I and IV
| Occupational group | All employees | Women | Men | Indigenous peoples | Persons with disabilities | Members of visible minorities | |||||
|---|---|---|---|---|---|---|---|---|---|---|---|
| Number | Number | % | Number | % | Number | % | Number | % | Number | % | |
| AI: Air Traffic Control | 10 | 0 | 0.0 | 10 | 100.0 | 0 | 0.0 | 0 | 0.0 | 0 | 0.0 |
| AO: Aircraft Operations | 389 | 39 | 10.0 | 350 | 90.0 | 10 | 2.6 | 5 | 1.3 | 12 | 3.1 |
| AU: Auditing | 142 | 70 | 49.3 | 72 | 50.7 | * | * | * | * | 38 | 26.8 |
| AV: Commerce and Purchasing | 5,925 | 3,093 | 52.2 | 2,832 | 47.8 | 230 | 3.9 | 326 | 5.5 | 984 | 16.6 |
| CX: Correctional Services | 7,190 | 2,027 | 28.2 | 5,159 | 71.8 | 817 | 11.4 | 262 | 3.6 | 779 | 10.8 |
| EB: Education and Library Science | 1,060 | 744 | 70.2 | 316 | 29.8 | 129 | 12.2 | 47 | 4.4 | 125 | 11.8 |
| EC: Economics and Social Science Services | 16,503 | 9,568 | 58.0 | 6,932 | 42.0 | 568 | 3.4 | 818 | 5.0 | 3,608 | 21.9 |
| EL: Electronics | 1,074 | 67 | 6.2 | 1,005 | 93.6 | 35 | 3.3 | 48 | 4.5 | 113 | 10.5 |
| EX: Executive | 5,594 | 2,772 | 49.6 | 2,822 | 50.4 | 230 | 4.1 | 253 | 4.5 | 628 | 11.2 |
| FB: Border Services | 9,628 | 3,964 | 41.2 | 5,664 | 58.8 | 364 | 3.8 | 314 | 3.3 | 1,445 | 15.0 |
| FI: Financial Management | 4,984 | 2,855 | 57.3 | 2,126 | 42.7 | 156 | 3.1 | 176 | 3.5 | 1,518 | 30.5 |
| FS: Foreign Service | 1,558 | 801 | 51.4 | 757 | 48.6 | 56 | 3.6 | 54 | 3.5 | 318 | 20.4 |
| HM: Human Resources Management | 4,112 | 3,283 | 79.8 | 829 | 20.2 | 192 | 4.7 | 290 | 7.1 | 708 | 17.2 |
| IT: Information Technology | 15,029 | 3,522 | 23.4 | 11,499 | 76.5 | 462 | 3.1 | 878 | 5.8 | 3,238 | 21.5 |
| LC: Law Management | 293 | 184 | 62.8 | 109 | 37.2 | 9 | 3.1 | 15 | 5.1 | 28 | 9.6 |
| LP: Law Practitioner | 2,893 | 1,694 | 58.6 | 1,197 | 41.4 | 122 | 4.2 | 181 | 6.3 | 471 | 16.3 |
| NR: Architecture, Engineering and Land Survey | 3,809 | 894 | 23.5 | 2,914 | 76.5 | 68 | 1.8 | 124 | 3.3 | 840 | 22.1 |
| PA: Program and Administrative Services | 84,027 | 61,479 | 73.2 | 22,510 | 26.8 | 5,431 | 6.5 | 5,326 | 6.3 | 14,621 | 17.4 |
| PM-MCO: Negotiation, Mediation and Conciliation Officer | 41 | 22 | 53.7 | 19 | 46.3 | 0 | 0.0 | * | * | * | * |
| PO: Police Operations Support | 343 | 241 | 70.3 | 100 | 29.2 | 11 | 3.2 | * | * | 29 | 8.5 |
| PR: Non-Supervisory Printing Services | * | * | * | * | * | * | * | 0 | 0.0 | 0 | 0.0 |
| RE: Research | 2,669 | 863 | 32.3 | 1,805 | 67.6 | 31 | 1.2 | 66 | 2.5 | 564 | 21.1 |
| RO: Radio Operations | 266 | 88 | 33.1 | 178 | 66.9 | 20 | 7.5 | 15 | 5.6 | * | * |
| SH: Health Services | 3,151 | 2,496 | 79.2 | 652 | 20.7 | 214 | 6.8 | 133 | 4.2 | 349 | 11.1 |
| SO: Ships’ Officers | 1,214 | 137 | 11.3 | 1,077 | 88.7 | 21 | 1.7 | 25 | 2.1 | 40 | 3.3 |
| SP: Applied Science and Patent Examination | 8,216 | 4,301 | 52.3 | 3,913 | 47.6 | 148 | 1.8 | 248 | 3.0 | 1,803 | 21.9 |
| SR(C): Ship Repair Chargehands and Production Supervisors – East | 53 | * | * | 49 | 92.5 | * | * | 6 | 11.3 | 0 | 0.0 |
| SR(E): Ship Repair East | 608 | 37 | 6.1 | 571 | 93.9 | 23 | 3.8 | 27 | 4.4 | 17 | 2.8 |
| SR(W): Ship Repair West | 671 | 34 | 5.1 | 635 | 94.6 | 21 | 3.1 | 21 | 3.1 | 22 | 3.3 |
| SV: Operational Services | 10,276 | 2,082 | 20.3 | 8,186 | 79.7 | 525 | 5.1 | 478 | 4.7 | 484 | 4.7 |
| TC: Technical Services | 10,477 | 3,285 | 31.4 | 7,189 | 68.6 | 529 | 5.0 | 454 | 4.3 | 1,128 | 10.8 |
| TR: Translation | 837 | 630 | 75.3 | 207 | 24.7 | 6 | 0.7 | 20 | 2.4 | 48 | 5.7 |
| UT: University Teaching | 204 | 47 | 23.0 | 157 | 77.0 | * | * | 6 | 2.9 | 37 | 18.1 |
| Unknown | 18 | 7 | 38.9 | 11 | 61.1 | 0 | 0.0 | 0 | 0.0 | * | * |
| Total | 203,268 | 111,332 | 54.8 | 91,854 | 45.2 | 10,435 | 5.1 | 10,622 | 5.2 | 34,004 | 16.7 |
Table 3.1 NotesNotes The source of the representation data is the Treasury Board of Canada Secretariat Employment Equity Data Bank, which is populated with self-identification information provided by employees. |
|||||||||||
Table 3.2: distribution of public service of Canada employees by designated group and (outdated) occupational category
The following table includes information (as of March 31, 2019) regarding indeterminates, terms of three months or more, and seasonal employees of organizations captured under the Financial Administration Act, Schedules I and IV
| Occupational category (outdated) | All employees | Women | Indigenous peoples | Persons with disabilities | Members of visible minorities | ||||
|---|---|---|---|---|---|---|---|---|---|
| Number | Number | % | Number | % | Number | % | Number | % | |
| Executives | 5,887 | 2,956 | 50.2 | 239 | 4.1 | 268 | 4.6 | 656 | 11.1 |
EX (Executive) |
5,594 | 2,772 | 49.6 | 230 | 4.1 | 253 | 4.5 | 628 | 11.1 |
(Law Management)table 3.2 note † |
293 | 184 | 62.8 | 9 | 3.1 | 15 | 5.1 | 28 | 9.6 |
| Scientific and Professional | 38,612 | 20,644 | 53.5 | 1,260 | 3.3 | 1,625 | 4.2 | 7,832 | 20.3 |
| Administrative and Foreign Service | 96,616 | 60,349 | 62.5 | 5,256 | 5.4 | 5,684 | 5.9 | 17,762 | 18.4 |
| Technical | 13,475 | 3,653 | 27.1 | 637 | 4.7 | 549 | 4.1 | 1,300 | 9.6 |
| Administrative Support | 19,900 | 15,337 | 77.1 | 1,277 | 6.4 | 1,387 | 7.0 | 3,678 | 18.5 |
| Operational | 28,775 | 8,391 | 29.2 | 1,766 | 6.1 | 1,109 | 3.9 | 2,776 | 9.6 |
| Undetermined | * | * | * | 0 | 0.0 | 0 | 0.0 | 0 | 0.0 |
| Total | 203,268 | 111,332 | 54.8 | 10,435 | 5.1 | 10,622 | 5.2 | 34,004 | 16.7 |
Table 3.2 NotesNotes The source of the representation data is the Treasury Board of Canada Secretariat Employment Equity Data Bank, which is populated with self-identification information provided by employees. The sum of designated groups does not equal the total (“all employees”) because employees may have chosen to self-identify in more than one designated group, and men are included in the total.
|
|||||||||
Table 4: distribution of public service of Canada employees by designated group and salary range
The following table includes information (as of March 31, 2019) regarding indeterminates, terms of three months or more, and seasonal employees of organizations captured under the Financial Administration Act, Schedules I and IV
| Salary range ($) | All employees | Women | Indigenous peoples | Persons with disabilities | Members of visible minorities | |||||||||
|---|---|---|---|---|---|---|---|---|---|---|---|---|---|---|
| Number | % of all employees | Number | % of salary range | % of EEtable 4 note † group | Number | % of salary range | % of EEtable 4 note † group | Number | % of salary range | % of EEtable 4 note † group | Number | % of salary range | % of EEtable 4 note † group | |
| Under 5,000 | 70 | 0.0 | 13 | 18.6 | 0.0 | table 4 note * | table 4 note * | 0.0 | 0 | 0.0 | 0.0 | table 4 note * | table 4 note * | 0.0 |
| 5,000 to 9,999 | 142 | 0.1 | 43 | 30.3 | 0.0 | table 4 note * | table 4 note * | 0.0 | 6 | 4.2 | 0.1 | 5 | 3.5 | 0.0 |
| 10,000 to 14,999 | 92 | 0.0 | 45 | 48.9 | 0.0 | table 4 note * | table 4 note * | 0.0 | 11 | 12.0 | 0.1 | 14 | 15.2 | 0.0 |
| 15,000 to 19,999 | 176 | 0.1 | 108 | 61.4 | 0.1 | 9 | 5.1 | 0.1 | 11 | 6.3 | 0.1 | 36 | 20.5 | 0.1 |
| 20,000 to 24,999 | 181 | 0.1 | 121 | 66.9 | 0.1 | 6 | 3.3 | 0.1 | 11 | 6.1 | 0.1 | 35 | 19.3 | 0.1 |
| 25,000 to 34,999 | 585 | 0.3 | 495 | 84.6 | 0.4 | 39 | 6.7 | 0.4 | 39 | 6.7 | 0.4 | 88 | 15 | 0.3 |
| 35,000 to 49,999 | 9,685 | 4.8 | 6,662 | 68.8 | 6.0 | 549 | 5.7 | 5.3 | 580 | 6.0 | 5.5 | 1,708 | 17.6 | 5.0 |
| 50,000 to 74,999 | 88,942 | 43.8 | 55,894 | 62.8 | 50.2 | 5,023 | 5.6 | 48.1 | 5,026 | 5.7 | 47.3 | 15,719 | 17.7 | 46.2 |
| 75,000 to 99,999 | 66,203 | 32.6 | 31,376 | 47.4 | 28.2 | 3,550 | 5.4 | 34.0 | 3,159 | 4.8 | 29.7 | 10,512 | 15.9 | 30.9 |
| 100,000 to 149,999 | 34,824 | 17.1 | 15,444 | 44.3 | 13.9 | 1,193 | 3.4 | 11.4 | 1,651 | 4.7 | 15.5 | 5,624 | 16.1 | 16.5 |
| 150,000 to 199,999 | 2,220 | 1.1 | 1,080 | 48.6 | 1.0 | 59 | 2.7 | 0.6 | 121 | 5.5 | 1.1 | 245 | 11 | 0.7 |
| 200,000 to 249,999 | 145 | 0.1 | 49 | 34.5 | 0.0 | table 4 note * | table 4 note * | 0.0 | 7 | 4.7 | 0.1 | 15 | 11.5 | 0.0 |
| 250,000 and over | table 4 note * | 0.0 | table 4 note * | 0.0 | 0.0 | 0 | 0.0 | 0.0 | 0 | 0.0 | 0.0 | table 4 note * | 0 | 0.0 |
| Total | 203,268 | 100.0 | 111,332 | 54.8 | 100.0 | 10,435 | 5.1 | 100.0 | 10,622 | 5.2 | 100.0 | 34,004 | 16.7 | 100.0 |
Table 4 NotesNotes The source of the representation data is the Treasury Board of Canada Secretariat Employment Equity Data Bank, which is populated with self-identification information provided by employees. The sum of designated groups does not equal the total (“all employees”) because employees may have chosen to self-identify in more than one designated group, and men are included in the total.
|
||||||||||||||
Table 5: hirings into, promotions within and separations from the public service of Canada by designated group
The following table includes information (as of March 31, 2019) regarding indeterminates, terms of three months or more, and seasonal employees of organizations captured under the Financial Administration Act, Schedules I and IV
| Action type | All employees | Women | Indigenous peoples | Persons with disabilities | Members of visible minorities | |||||||||
|---|---|---|---|---|---|---|---|---|---|---|---|---|---|---|
| Number | Number | % | Number | % | Number | % | Number | % | ||||||
| Hirings | 23,334 | 13,181 | 56.5 | 962 | 4.1 | 866 | 3.7 | 4,510 | 19.3 | |||||
| Promotions | 25,489 | 15,390 | 60.4 | 1,217 | 4.8 | 1,097 | 4.3 | 4,770 | 18.7 | |||||
| Separations | 13,030 | 7,470 | 57.3 | 665 | 5.1 | 859 | 6.6 | 1,275 | 9.8 | |||||
Table 5 NotesNotes The source of the representation data is the Treasury Board of Canada Secretariat Employment Equity Data Bank, which is populated with self-identification information provided by employees. The sum of designated groups does not equal the total (“all employees”) because employees may have voluntarily chosen to self-identify in more than one designated group, and men are included in the total. “Hirings” refers to employees who were added to the public service of Canada payroll between April 1, 2018, and March 31, 2019. Data on promotions are obtained from the Public Service Commission of Canada and include information from departments and agencies that fall under both the Financial Administration Act, Schedules I and IV, and the Public Service Employment Act. “Separations” refers to employees who left the public service of Canada payroll between April 1, 2018, and March 31, 2019. Percentages are that designated group’s share of all actions of the given type. See the definitions of “hirings,” “promotions” and “separations” in Appendix C: Definitions of Employment Equity in the Public Service of Canada for Fiscal Year 2016 to 2017. |
||||||||||||||
Table 6: distribution of public service of Canada employees by designated group and age range
The following table includes information (as of March 31, 2019) regarding indeterminates, terms of three months or more, and seasonal employees of organizations captured under the Financial Administration Act, Schedules I and IV
| Age range | All employees | Women | Indigenous peoples | Persons with disabilities | Members of visible minorities | |||||||||
|---|---|---|---|---|---|---|---|---|---|---|---|---|---|---|
| Number | % of all employees | Number | % of age range | % of EEtable A6 note † group | Number | % of age range | % of EEtable A6 note † group | Number | % of age range | % of EEtable A6 note † group | Number | % of age range | % of EEtable A6 note † group | |
| Under 20 | 104 | 0.1 | 39 | 37.5 | 0.0 | table A6 note * | table A6 note * | 0.0 | table A6 note * | 0.0 | 0.0 | 9 | 8.7 | 0.0 |
| 20 to 24 | 4,933 | 2.4 | 2,927 | 59.3 | 2.6 | 205 | 4.2 | 2.0 | 131 | 2.7 | 1.2 | 1,058 | 21.4 | 3.1 |
| 25 to 29 | 15,767 | 7.8 | 9,394 | 59.6 | 8.4 | 657 | 4.2 | 6.3 | 456 | 2.9 | 4.3 | 3,555 | 22.5 | 10.5 |
| 30 to 34 | 20,736 | 10.2 | 11,418 | 55.1 | 10.3 | 956 | 4.6 | 9.2 | 629 | 3.0 | 5.9 | 4,131 | 19.9 | 12.1 |
| 35 to 39 | 28,442 | 14.0 | 16,026 | 56.3 | 14.4 | 1,376 | 4.8 | 13.2 | 1,014 | 3.6 | 9.5 | 5,277 | 18.6 | 15.5 |
| 40 to 44 | 32,235 | 15.9 | 18,429 | 57.2 | 16.6 | 1,682 | 5.2 | 16.1 | 1,447 | 4.5 | 13.6 | 5,731 | 17.8 | 16.9 |
| 45 to 49 | 30,748 | 15.1 | 17,040 | 55.4 | 15.3 | 1,830 | 6.0 | 17.5 | 1,676 | 5.5 | 15.8 | 4,949 | 16.1 | 14.6 |
| 50 to 54 | 30,297 | 14.9 | 16,438 | 54.3 | 14.8 | 1,789 | 5.9 | 17.1 | 1,960 | 6.5 | 18.5 | 4,149 | 13.7 | 12.2 |
| 55 to 59 | 24,807 | 12.2 | 12,598 | 50.8 | 11.3 | 1,262 | 5.1 | 12.1 | 1,970 | 7.9 | 18.5 | 2,974 | 12.0 | 8.7 |
| 60 to 64 | 11,189 | 5.5 | 5,285 | 47.2 | 4.7 | 513 | 4.6 | 4.9 | 972 | 8.7 | 9.2 | 1,513 | 13.5 | 4.4 |
| 65 to 69 | 3,193 | 1.6 | 1,408 | 44.1 | 1.3 | 136 | 4.3 | 1.3 | 297 | 9.3 | 2.8 | 497 | 15.6 | 1.5 |
| 70+ | 815 | 0.4 | 329 | 40.4 | 0.3 | 25 | 3.1 | 0.2 | 70 | 8.6 | 0.7 | 160 | 19.6 | 0.5 |
| Unknown | table A6 note * | 0.0 | table A6 note * | table A6 note * | 0.0 | 0 | 0.0 | 0.0 | 0 | 0.0 | 0.0 | table A6 note * | table A6 note * | 0.0 |
| Total | 203,268 | 100.0 | 111,332 | 54.8 | 100.0 | 10,435 | 5.1 | 100.0 | 10,622 | 5.2 | 100.0 | 34,004 | 16.7 | 100.0 |
Table A6 NotesNotes The source of the representation data is the Treasury Board of Canada Secretariat Employment Equity Data Bank, which is populated with self-identification information provided by employees. The sum of designated groups does not equal the total (“all employees”) because employees may have chosen to self-identify in more than one designated group, and men are included in the total.
|
||||||||||||||
Table 7: representation in the public service of Canada by designated group and fiscal year
The following table includes information (as of March 31, 2019) regarding indeterminates, terms of three months or more, and seasonal employees of organizations captured under the Financial Administration Act, Schedules I and IV
| Public service representation | All employees | Women | Aboriginal peoples | Persons with disabilities | Members of visible minorities | ||||
|---|---|---|---|---|---|---|---|---|---|
| Number | Number | % | Number | % | Number | % | Number | % | |
| As at March 31, 2019 | 203,268 | 111,332 | 54.8 | 10,435 | 5.1 | 10,622 | 5.2 | 34,004 | 16.7 |
| As at March 31, 2018 | 192,467 | 105,465 | 54.8 | 9,876 | 5.1 | 10,181 | 5.3 | 30,273 | 15.7 |
| As at March 31, 2017 | 185,484 | 101,136 | 54.5 | 9,726 | 5.2 | 10,259 | 5.5 | 28,058 | 15.1 |
| As at March 31, 2016 | 181,674 | 98,846 | 54.4 | 9,358 | 5.2 | 10,092 | 5.6 | 26,336 | 14.5 |
| As at March 31, 2015 | 180,681 | 98,051 | 54.3 | 9,232 | 5.1 | 10,204 | 5.6 | 24,849 | 13.8 |
| As at March 31, 2014 | 181,356 | 98,078 | 54.1 | 9,239 | 5.1 | 10,390 | 5.7 | 23,919 | 13.2 |
| As at March 31, 2013 | 188,342 | 102,124 | 54.2 | 9,491 | 5.0 | 10,871 | 5.8 | 23,812 | 12.6 |
| As at March 31, 2012 | 198,793 | 108,620 | 54.6 | 9,785 | 4.9 | 11,418 | 5.7 | 23,978 | 12.1 |
| As at March 31, 2011 | 202,631 | 111,051 | 54.8 | 9,486 | 4.7 | 11,388 | 5.6 | 22,998 | 11.3 |
| As at March 31, 2010 | 202,386 | 110,867 | 54.8 | 9,307 | 4.6 | 11,620 | 5.7 | 21,567 | 10.7 |
| As at March 31, 2009 | 195,667 | 107,089 | 54.7 | 8,892 | 4.5 | 11,468 | 5.9 | 19,264 | 9.8 |
| As at March 31, 2008 | 186,754 | 101,589 | 54.4 | 8,190 | 4.4 | 11,001 | 5.9 | 17,207 | 9.2 |
| As at March 31, 2007 | 179,540 | 96,816 | 53.9 | 7,610 | 4.2 | 10,192 | 5.7 | 15,787 | 8.8 |
| As at March 31, 2006 | 176,630 | 95,013 | 53.8 | 7,381 | 4.2 | 10,169 | 5.8 | 15,112 | 8.6 |
| As at March 31, 2005 | 165,856 | 88,702 | 53.5 | 6,886 | 4.2 | 9,626 | 5.8 | 13,498 | 8.1 |
| As at March 31, 2004 | 165,976 | 88,175 | 53.1 | 6,723 | 4.1 | 9,452 | 5.7 | 13,001 | 7.8 |
| As at March 31, 2003 | 163,314 | 86,162 | 52.8 | 6,426 | 3.9 | 9,155 | 5.6 | 12,058 | 7.4 |
| As at March 31, 2002 | 157,510 | 82,663 | 52.5 | 5,980 | 3.8 | 8,331 | 5.3 | 10,772 | 6.8 |
| As at March 31, 2001 | 149,339 | 77,785 | 52.1 | 5,316 | 3.6 | 7,621 | 5.1 | 9,143 | 6.1 |
| As at March 31, 2000table A7 note * (Revenue Canada excluded) |
141,253 | 72,549 | 51.4 | 4,639 | 3.3 | 6,687 | 4.7 | 7,764 | 5.5 |
| As at March 31, 1999 (Revenue Canada included) |
178,340 | 91,856 | 51.5 | 5,124 | 2.9 | 8,137 | 4.6 | 10,557 | 5.9 |
| As at March 31, 1998 | 179,831 | 90,801 | 50.5 | 4,770 | 2.7 | 6,943 | 3.9 | 9,260 | 5.1 |
| Workforce availability | |||||||||
| 2016 Census and 2017 Canadian Survey on Disability | n/a | n/a | 52.6 | n/a | 4.0 | n/a | 9.0 | n/a | 15.3 |
| 2011 National Household Survey and the 2012 Canadian Survey on Disability | n/a | n/a | 52.5 | n/a | 3.4 | n/a | 4.4 | n/a | 13.0 |
| 2006 Census and Participation and Activity Limitation Survey (PALS) | n/a | n/a | 52.3 | n/a | 3.0 | n/a | 4.0 | n/a | 12.4 |
| 2001 Census and PALS | n/a | n/a | 52.2 | n/a | 2.5 | n/a | 3.6 | n/a | 10.4 |
| 1996 Census and 1996 Health and Activity Limitation Survey (HALS) | n/a | n/a | 48.7 | n/a | 1.7 | n/a | 4.8 | n/a | 8.7 |
| 1991 Census and HALS | n/a | n/a | 47.3 | n/a | 2.6 | n/a | 4.8 | n/a | 9.0 |
Table Notes A7
n/a: not applicable Notes The source of the representation data is the Treasury Board of Canada Secretariat Employment Equity Data Bank, which is populated with self-identification information provided by employees. The data in this and other tables in this report cover employees identified for the purpose of employment equity in the Employment Equity Regulations and the Employment Equity Act. The estimates of workforce availability are based on information from the 2016 Census of Canada and the 2017Canadian Survey on Disability and the post-Census Participation and Activity Limitation Survey (PALS). Estimates include only Canadian citizens in those occupations in the Canadian workforce that correspond to occupations in the federal public service. |
|||||||||
© Her Majesty the Queen in Right of Canada, represented by the President of the Treasury Board, 2020
ISSN: 1926-2485
Page details
- Date modified: