
Overview of the CRA
Introduction and Purpose
- As the Minister of National Revenue, you are accountable to Parliament and the Prime Minister for the operations of the Canada Revenue Agency (CRA).
- The CRA plays a key role in helping the government achieve its objectives, through tax assessment, benefit delivery, revenue collection, audit, and criminal investigations.
- This presentation will provide you with an overview of the CRA and demonstrate the support we will offer you in achieving the government’s priorities.
The role of the Minister of National Revenue
- You are responsible for the Canada Revenue Agency. Along with the Minister of Finance and other Cabinet members, you influence and shape government policy and legislation.
- As Minister of National Revenue, you engage CRA management and key external stakeholders to discuss broad policy issues and direction, and you help guide our activities and shape our future.
- You also appoint members to your ministerial advisory committees and recommend other appointments to the Governor-in-Council.
You are supported by…
- The Commissioner and Chief Executive Officer of the CRA, who is responsible for the day-to-day management and direction of the CRA. The commissioner is supported by a deputy commissioner.
- The Deputy Commissioner of the CRA, who exercises the powers, duties, and functions assigned by the commissioner and also acts as commissioner in the event of absence, incapacitation, or vacancy.
- The CRA’s Board of Management (Board), which oversees the organization and administration of the CRA and the management of its resources, services, property, personnel, and contracts. The Board may advise the minister on matters relating to the general administration and enforcement of program legislation.
- The CRA’s management and employees, to whom many of the CRA’s decisions, including those related to specific taxpayer cases, are delegated.
- The Taxpayers’ Ombudsperson, a special advisor who assists, advises and informs the Minister about any matter relating to services provided to taxpayers by the CRA, in accordance with the Taxpayer Bill of Rights.
What we do
- The CRA administers tax, benefits, and related programs on behalf of all levels of governments across Canada, thereby contributing to the ongoing economic and social well-being of Canadians.
- The CRA administers individual and corporate income tax for nearly all provinces and territories. Alberta is an exception, as it administers its own corporate income tax regime. As is Quebec, which administers its own individual and corporate tax regimes, and the GST in the province on behalf of the CRA. The CRA also administers the HST in Ontario and the four Atlantic provinces, and partners with some Indigenous governments in administering their sales and income taxes.
- The Minister of Finance develops policy and legislation on tax matters, while the ministers responsible for Employment and Social Development Canada develop legislation for benefits such as Employment Insurance (EI) and the Canada Pension Plan (CPP).
- The CRA is also the de facto regulator of charities in Canada, due to the tax benefits registered charities can receive.
- The CRA engages a variety of stakeholder groups, such as industry associations, other regulatory bodies, and professional organizations, to advance our shared interests.
- Internationally, the CRA collaborates with other tax jurisdictions and in multilateral fora, such as the Organisation for Economic Co-operation and Development, to promote and influence international tax standards, improve compliance, and support the strengthening of tax administration capacity globally.
Being an Agency
- We are unique. The CRA’s governance structure is more complex than most departments, given its status as an Agency with unique authorities.
- The Canada Revenue Agency Act gives the Agency authority over all matters relating to:
- General administrative policy
- The organization of the Agency
- Real property and immovables (administered by Public Services and Procurement Canada)
- Human resources management, including collective bargaining and the determination of the terms and conditions of employment of persons employed by the Agency
- Internal audit
- The CRA aligns with Treasury Board policies when it is legislatively required or when it is determined to be beneficial. Generally speaking, Treasury Board policies do not automatically apply to the Agency.
- The CRA has a Board of Management that is responsible for overseeing its organization and administration, and the management of its resources, services, property, personnel and contracts.
- As a separate employer, the CRA is responsible for conducting its own collective bargaining for unionized employees, determining terms and conditions of employment, and compensation levels for non-unionized employees. The Treasury Board, however, maintains its expenditure management role in relation to separate agencies. As such, all unionized separate agencies are required to obtain a mandate for collective bargaining from the President of the Treasury Board.
We are a large, national organization

Source: Includes permanent and term employees as well as students. Includes both active and inactive employees. CRA Monthly Demographic Employee Profile by Region – August 2024
Image description
This graphic, entitled “We are a large, national organization,” is a map of Canada showing the CRA's employee representation across the country, separated by region. Starting on the west coast, the CRA's Western region (including the provinces of British Columbia, Alberta, Saskatchewan, Manitoba, as well as the Yukon and Northwest Territories) makes up 12,402 employees. Moving east, the Ontario region (including Ontario and Nunavut) makes up 12,618 employees. The Headquarters region (located in Ottawa, Ontario) makes up 22,240 employees. Second-last on the east is the Quebec Region, which makes up 6,507 employees. On the furthest east, the Atlantic region (including New Brunswick, Nova Scotia, Prince Edward Island, and Newfoundland and Labrador) makes up 5,278 employees. Above the map, the national total of CRA employees is shown, making up 59,045 employees.
Tax and benefit administration has many functions
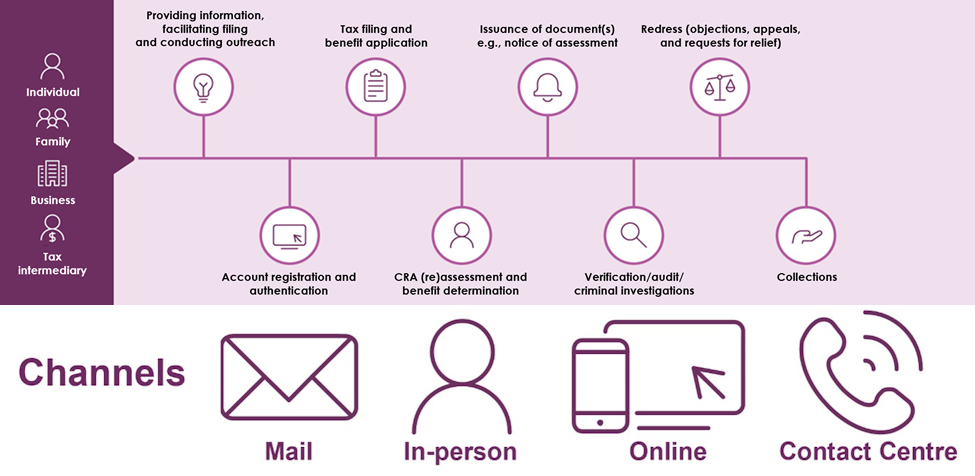
This graphic entitled “Tax and benefit administration has many functions,” depicts a process flow map diagram for CRA operations. In the top-left corner is the heading “Channels” and below are four purple icons placed horizontally depicting the four channels for Canadians to communicate with the CRA. The first icon on the left is an envelope with the text “mail” below. The second icon is a silhouette of a person with the text “in-person” below. The third icon is a computer monitor and smartphone with the text “online” below. The fourth icon is a phone with the text “contact centre” below.
A process flow map diagram appears below the four channels. Along the left side of the process flow map, there are four icons placed vertically to represent the four types of CRA clients:
- The icon at the top is the silhouette of a person; beneath the icon is the text "individual"
- The second icon is the silhouette of two adults and a child; beneath the icon is the text "family"
- The third icon is the outline of three buildings; beneath the icon is the text "business"
- The fourth icon is the silhouette of a person with a dollar-sign below; beneath the icon is the text "tax intermediary“
A purple line starts from the four client icons and leads across to the right of the graphic, connecting to images representing the different functions of tax and benefits administration:
- The first image is a lightbulb labeled "providing information, facilitating filing, and conducting outreach"
- The next image is a computer screen labeled "account registration and authentication"
- The next image is a clipboard labeled "tax filing and benefit application"
- The next image is a silhouette of a person labeled "CRA (re)assessment and benefit determination"
- The next image is a notification bell labeled "issuance of document(s) e.g., notice of assessment"
- The next image is a magnifying glass labeled "verification/audit/criminal investigations"
- The next image is of the scales of justice labeled "redress (objections, appeals, and requests for relief)"
- The last image at the end of the purple line on the right side of the graphic is an open hand labeled "collections"
The CRA engages with external experts and partners
- The following external advisory committees provide advice on CRA operations and policies in their focus areas:
- Advisory Committee on the Charitable Sector
- Disability Advisory Committee
- Independent Advisory Board on Eligibility for Journalism Tax Measures
- Note: See Appendix for committee mandates.
- The CRA engages with international organizations including other tax jurisdictions.
- Key federal, provincial and territorial partners including:
- Provincial and territorial governments
- Revenu Québec (RQ)
- Department of Finance
- Department of Justice
- Employment and Social Development Canada
- Indigenous Services Canada
- Service Canada
- Treasury Board of Canada Secretariat
- Shared Services Canada
- Public Services and Procurement Canada
- Women and Gender Equality Canada
- Public Prosecution Service of Canada
- Financial Transactions and Reports Analysis Centre of Canada
- Royal Canadian Mounted Police
- Natural Resources Canada
…and other key stakeholders
- The CRA also engages with industry associations and civil society organizations to obtain a better understanding of their perspective on key strategic issues which may have an impact on their organizations as well as on the CRA clients they serve.
- Examples of organizations with which the CRA engages:
- National Payroll Institute
- Chartered Professional Accountants of Canada
- Canadian Federation of Independent Business
- Tax-Filer Empowerment Canada
- Canadian Bankers Association
- Canadian Tax Foundation
- Canadian Chamber of Commerce
- Canadian Bar Association
- Tax Executives Institute
- Efile Association of Canada
- International Fiscal Association Canada
- Association de planification fiscale et financière
For many Canadians, the main interaction with the government is their tax filing experience
- The CRA offers a variety of tools and services to support tax filing:
- Auto-fill my return, is a secure digital service that allows individuals and authorized representatives using certified software, to automatically fill in parts of a tax return with information the CRA has on file at the time of the request.
- SimpleFile by Phone is an automated telephone service that allows eligible individuals to auto-file an income tax and benefit return over the phone, for free. The service is by invitation only and is available to individuals with lower-income, simple tax situations and a recent filing history.
- The CRA secure portals allow individuals and businesses to interact with the CRA online. Users can view their notice of assessment or reassessment, change their return, submit documents, make payments, update account information, receive email notifications, view any uncashed cheques, check the status of their file and more.
- The CRA is digitally transforming with the goal of making it easier for Canadians to access information, apply for benefits, and meet their tax obligations digitally.
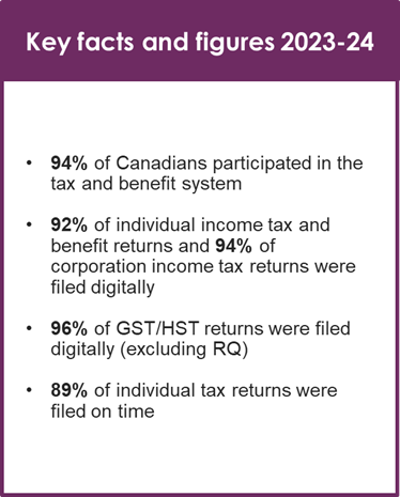
Image description
Key facts and figures for 2023 to 2024.
- 94% of Canadians participated in the tax and benefit system
- 92% of individual income tax and benefit returns and 94% of corporation income tax returns were filed digitally
- 96% of GST/HST returns were filed digitally (excluding RQ)
- 89% of individual tax returns were filed on time
CRA revenue collections
- The CRA collects taxes on behalf of the Government of Canada, most provinces and territories, and some First Nations.
- The CRA also undertakes a variety of activities to collect debts on behalf of other government programs (e.g., social program overpayments, Canada Student Loan).
- The revenues collected by the CRA are critical in supporting government programs, services, and investment priorities.
- The CRA administers the majority of revenues on behalf of the federal government.

Image description
Key facts and figures for 2023 to 2024.
- Administered $662.6 billion in revenue and pension contributions.
- $400.2 billion in on behalf of the federal government.
The economic and social well-being of Canadians is supported by the delivery of benefits and tax credits
- Our overarching goal is to ensure Canadians are aware of and receive the benefits and credits to which they are entitled.
- The CRA undertakes significant efforts to reach people, in particular vulnerable populations, to increase benefit uptake.
- The CRA works with provincial, territorial and federal partners, the private sector, and non-governmental organizations to support our efforts.
- The CRA supported Canadians and Canadian businesses through the COVID-19 pandemic. Millions of Canadians and tens of thousands of businesses received timely benefits and subsidies to help them recover from the unprecedented challenges posed by the pandemic.
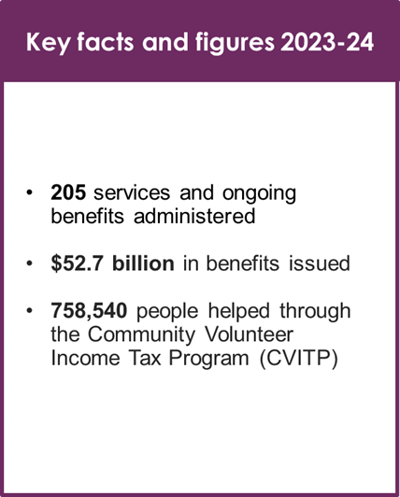
Image description
Key facts and figures for 2023 to 2024.
- 205 services and ongoing benefits administered
- $52.7 billion in benefits issued
- 758,540 people were helped through the Community Volunteer Income Tax Program (CVITP)
Canadians' level of compliance is impacted by the CRA's reputation and perceived fairness
- The CRA uses a people first approach to help Canadians meet their tax obligations by making it easy to access clear, timely and accurate information through the web, social media, written communication and contact centres.
- Non-compliance ranges from accidental error (making honest mistakes) to intentional (willfully seeking to mislead the CRA).
- Our responses are tailored to the type of non-compliance:
- Focus on education and facilitation to help those who want to comply
- Enforcement efforts targeting high-risk individuals and corporations
- Collaborate with our domestic and international partners to combat tax evasion
- The CRA continuously evaluates compliance risks and tailors its compliance priorities accordingly, shifting and evolving its focus as new risks emerge.
- Canadians have the right to a fair and impartial review through the redress process, including the court system, as outlined in the legislation administered by the CRA and confirmed in the Taxpayer Bill of Rights (rights 4 and 12).
Canadians expect their information to be protected
- The CRA has one of the largest holdings of personal information in Canada and Canadians expect us to protect it by:
- Managing information and data
- Ensuring appropriate safeguards are in place
- Governing the use of new and emerging technology
- Adhering to privacy and confidentiality obligations set out in the Privacy Act and other laws (e.g., section 241 of the Income Tax Act)
- Any impact on our reputation could reduce trust in the CRA, and ultimately compliance.
- The CRA has rigorous controls to protect personal information and regularly monitors and enhances these controls.
- The CRA is addressing an increase in the frequency and sophistication of security threats and raising the profile of security and privacy.
Canadians expect seamless service
- We are creating opportunities to accelerate digitalization across the CRA’s programs and services to meet the evolving needs of Canadians.
- The CRA is undertaking an enterprise–wide digital transformation to create a digital tax and benefit administration where:
- People are equipped and empowered to successfully adapt to the new ways of working and thinking
- Processes are reimagined, modernized and shared across all relevant programs
- Technology is designed and adapted through modern, agile, secure and user‐centred approaches
Communications is key to achieving results
- A high national public interest in certain CRA stories creates challenges:
- Being open and transparent while protecting the confidentiality of taxpayer information
- Perception that the CRA is cracking down on the average Canadian more than wealthy Canadians and businesses
- The CRA is addressing these challenges by taking a proactive approach to media relations, providing accurate and timely information about our programs, services, and service improvements.
- Our helpful, user-centric approach on social media has made CRA one of the most followed government agencies.
- Canada.ca is one of our primary communication channels and the CRA relies on user experience research to make sure Canadians can quickly get the information they need.
- Internal communications and engagement is crucial to ensure that employees have the information they need to do their job and feel supported by senior management.
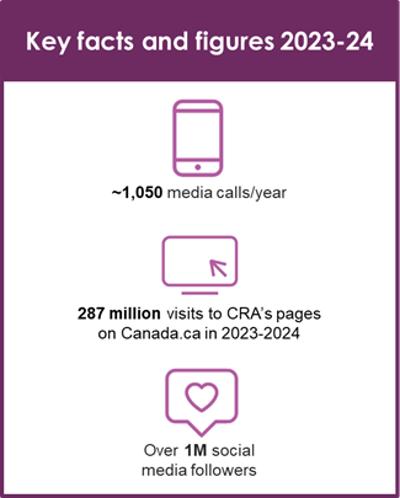
Image description
This graphic, entitled “Key facts and figures” features three small purple icons. Each icon has text associated with it and provides information related to the CRA's communications and media presence.
- The first icon is a cell phone. Beneath it is text that reads that the CRA responds to approximately 1,050 media calls a year.
- Under the first icon, there is a second icon of a computer. Below it is text that reads that there were 287 million visits to the CRA’s pages on Canada.ca in 2023 to 2024.
- Under the second icon, there is a third icon which depicts a “like” on social media. The text below it reads that the CRA has over 1 million social media followers.
We are guided by our Strategic Planning Framework
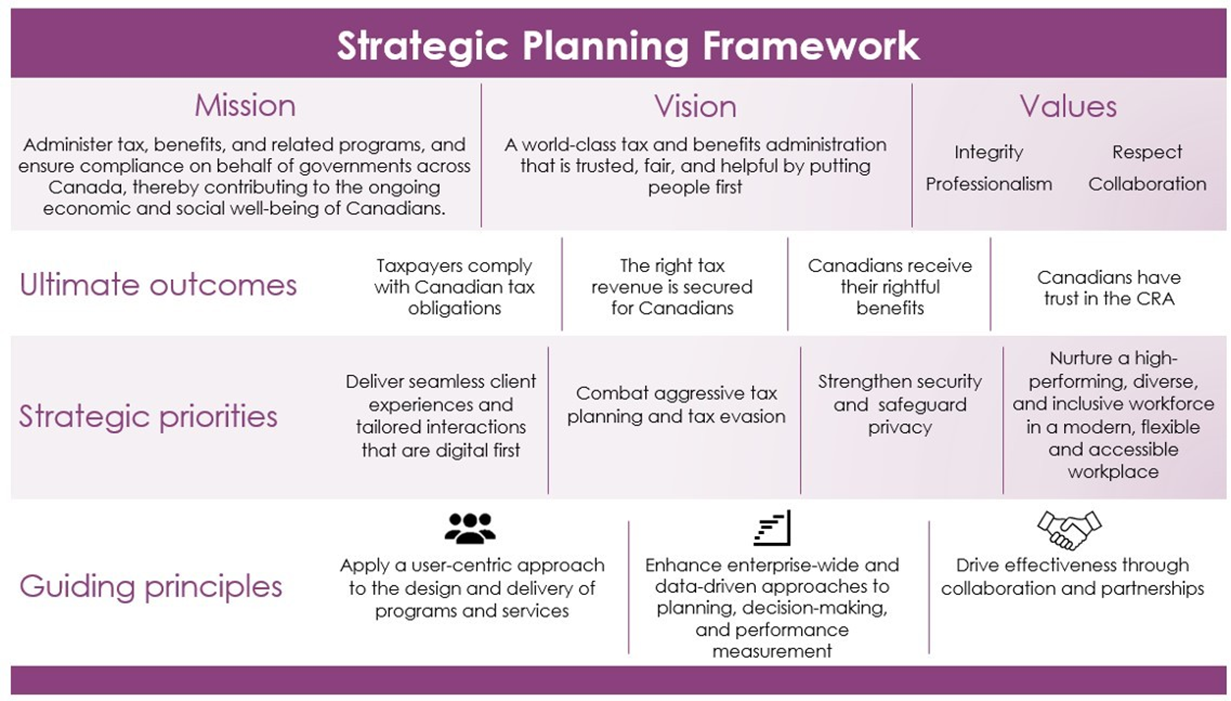
Image description
The CRA’s Strategic Planning Framework links its strategic priorities and guiding principles to its mission, vision, values, and ultimate outcomes. The CRA’s mission is to: Administer tax, benefits, and related programs, and ensure compliance on behalf of governments across Canada, thereby contributing to the ongoing economic and social well-being of Canadians. The CRA’s vision is: world-class tax and benefits administration that is trusted, fair, and helpful by putting people first. The strategic priorities state what the organization will do over the planning period:
- Deliver seamless client experiences and tailored interactions that are digital first;
- Combat aggressive tax planning and tax evasion;
- Strengthen security and safeguard privacy; and
- Nurture a high-performing, divers and inclusive workforce in a modern, flexible and accessible workplace.
- The overall outcomes of the Strategic Planning Framework are:
- Taxpayers comply with Canadian tax obligations;
- The right tax revenue is secured for Canadians;
- Canadians receive their rightful benefits; and
- Canadians have trust in the CRA.
- The guiding principles articulate how the CRA will achieve its strategic priorities:
- Apply a user-centric approach to the design and delivery of programs and services;
- Enhance enterprise-wide and data-driven approaches to planning, decision-making, and performance measurement; and
- Drive effectiveness through collaboration and partnerships.
The future of the CRA
- The CRA is developing a future state vision for a modern tax and benefit organization, guided by the work of the Organisation for Economic Co-operation and Development (OECD).
- In a digital world with rapidly evolving industries and client expectations, we are improving services and compliance by meeting people where they are to make tax and benefits just happen.
- Transformation will require long-term planning and intentionality that will be realized by our skilled and modern workforce, delivered in collaboration with Canadian and international partners.
- Protecting CRA integrity is a shared and ongoing responsibility that requires the combined efforts of all employees, managers, and executives. We have renewed our focus on values and ethics, that will help strengthen integrity and foster the public’s trust in our operations.
Appendix: External Advisory Committee mandates
- Advisory Committee on the Charitable Sector: The Advisory Committee on the Charitable Sector (ACCS) is a consultative forum for the Government of Canada to engage in meaningful dialogue with the charitable sector, to advance emerging issues relating to charities, and to ensure the regulatory environment supports the important work that charities do. The ACCS is co-chaired by the charitable sector and the Canada Revenue Agency (CRA). It provides recommendations to the Minister of National Revenue and the Commissioner of the CRA on important and emerging issues facing registered charities and other qualified donees on an ongoing basis.
- Disability Advisory Committee: The Disability Advisory Committee advises the Minister of National Revenue and the Canada Revenue Agency (CRA) on how the Agency can improve the way it administers and interprets tax measures for Canadians with disabilities.
- Independent Advisory Board on Eligibility for Journalism Tax Measures: The Advisory Board’s mandate is to provide an independent assessment and make written, non-binding recommendations as to whether an organization meets certain criteria to be designated as a qualified Canadian journalism organization (QCJO). Specifically, whether an organization produces original news content, and regularly employs two or more journalists who deal at arm’s length with the organization in the production of its content