
Reporting fees for service: Online questionnaire - What we learned report
March 2025
Prepared by the Canada Revenue Agency
Overview, purpose and results
Overview and purpose
- Through an online questionnaire, the Canada Revenue Agency (CRA) invited Canadian businesses and organizations of all sizes to share feedback on reporting fees for service (RFS).
- The purpose was to help the CRA identify ways to clarify reporting requirements, streamline processes and proactively support Canadian businesses and organizations in understanding and meeting their tax requirements.
- The findings report from this questionnaire is intended to be used as a foundation for ongoing two-way conversations with Canadian businesses and organizations, ensuring that feedback is actively discussed and integrated into the CRA's efforts to improve reporting processes and support for Canadian businesses.
Results
- This report summarizes what the CRA learned from this questionnaire. While the questionnaire was available to all Canadians, the results do not necessarily reflect the views of the broader Canadian population. There is no margin of error as the sampling is non-probabilistic.
- The CRA will carefully review the findings from this questionnaire, along with other stakeholder engagement activities, to help inform decision-making related to RFS.
Methodology – Scope, period and submission details
Scope
- Identify ways to simplify the RFS requirement and streamline processes to minimize the potential reporting burden.
- Identify challenges to compliance and learn more about what information businesses and organizations need to meet the RFS requirement.
Period and submission details
- The questionnaire ran from May 22 to July 22, 2024.
- 1,460 completed submissions were received.
- Respondents took an average of 9 minutes to complete.
Methodology – Questionnaire design and target audience
Design
- The CRA developed and hosted the questionnaire internally. The questions were created in consultation with the RFS external stakeholder working group, which was established by the CRA to seek insights on the challenges Canadian businesses and organizations are facing with RFS.
Respondents
- Individuals responsible for managing the accounts of their business or organization, such as those working in accounts payable, accounts receivable, or payroll were encouraged to complete the survey. As a result, there may be more than one respondent per business or organization.
- Sectors with fewer than thirty-five (35) respondents were not included in the sector analysis, due to sample size. Results with between thirty-five (35) and fifty (50) respondents should be interpreted with caution for this same reason.
Response management
- The questionnaire was designed to allow only one submission by device to help prevent multiple submissions from a single respondent.
- Response percentages are calculated to 2 decimals but displayed as rounded numbers in this report. This may cause added percentages to appear +/- 1% of the total. In some cases, totals may appear not to add up to 100% due to this rounding.
Key findings
Awareness and preparedness
- Most respondents said they are aware of the RFS requirement.
- Roughly half of all respondents said they feel at least somewhat prepared to comply with the RFS requirement.
Reporting vehicle and administrative burden
- Roughly half of respondents do not think the T4A is the appropriate reporting method for RFS.
- Respondents selected an average of three challenges with preparing and issuing T4A information slips for RFS, with the top three being the need to:
- issue too many T4A slips
- hire additional staff to file T4A slips
- purchase/upgrade software to prepare a T4A slip
- Nearly half of the respondents reported that goods and services were separated on the invoices they receive.
Reporting threshold
- A clear majority of respondents did not feel the current reporting threshold of $500 for RFS is appropriate.
- Of those respondents, the vast majority said higher threshold amounts would minimize administrative burden.
What we learned – Awareness and preparedness
Note: Please refer to Appendix for detailed breakdown of results by business and organization size, as well as economic sector.
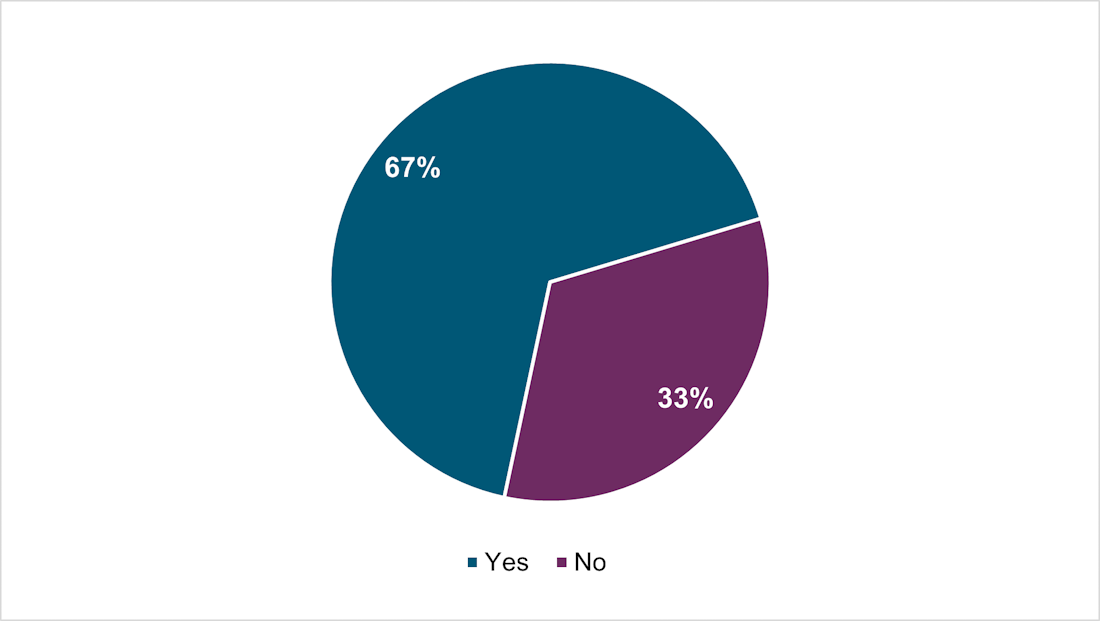
Were you already aware of the RFS requirement?
Two thirds (67%) of respondents say they are already aware of the RFS requirement.
Figure 1 – Awareness of the RFS requirement
Text version
| Were you already aware of the RFS requirement? | Percentage |
|---|---|
Yes |
67% |
No |
33% |
Base all (n = 1,460)
Note: Business and organization size by number of employees – micro (1-5), small (6-99), medium (100-499), large (500+).
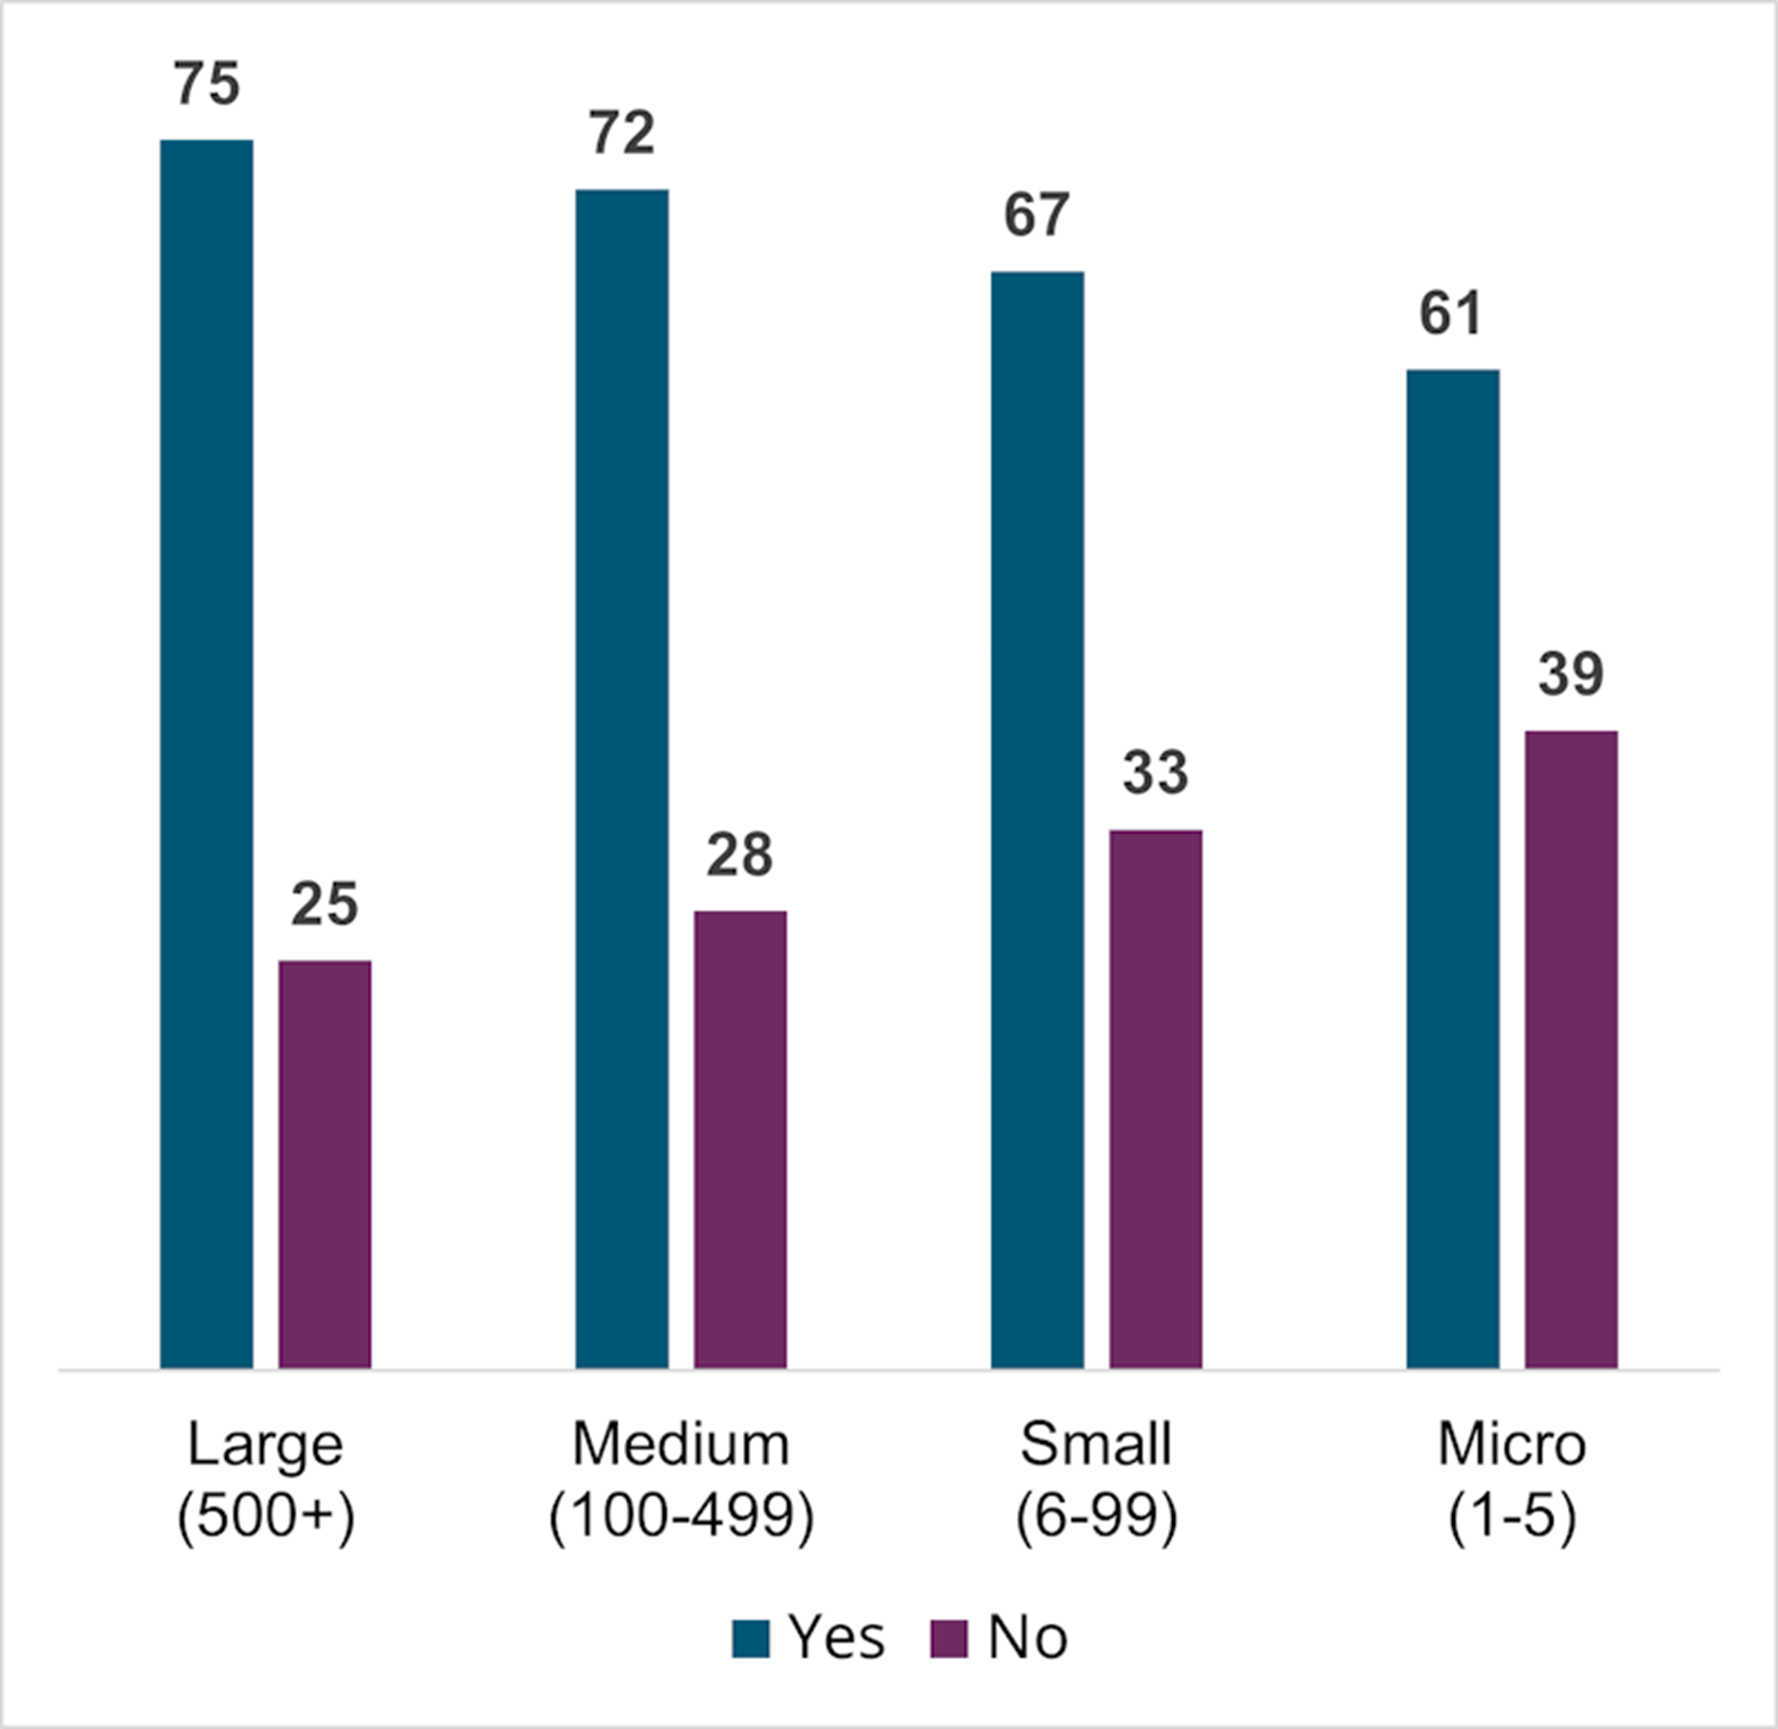
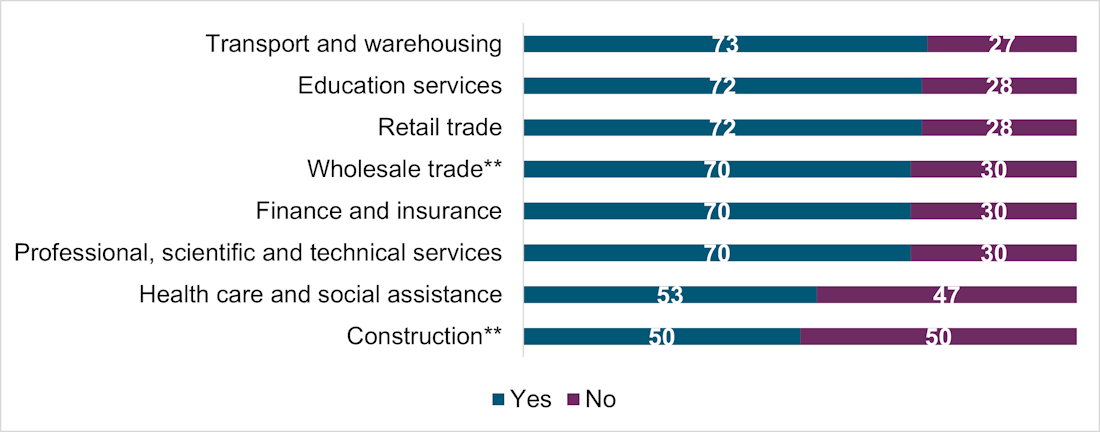
- Respondent awareness was generally high across businesses and organizations of all sizes and reported sectors of the economy.
- Awareness was notably lower for respondents in the construction (50%), and health care and social assistance (53%) sectors.
- Respondents from small (67%) and micro (61%) sized businesses and organizations reported less awareness than large (75%) and medium (72%) businesses.
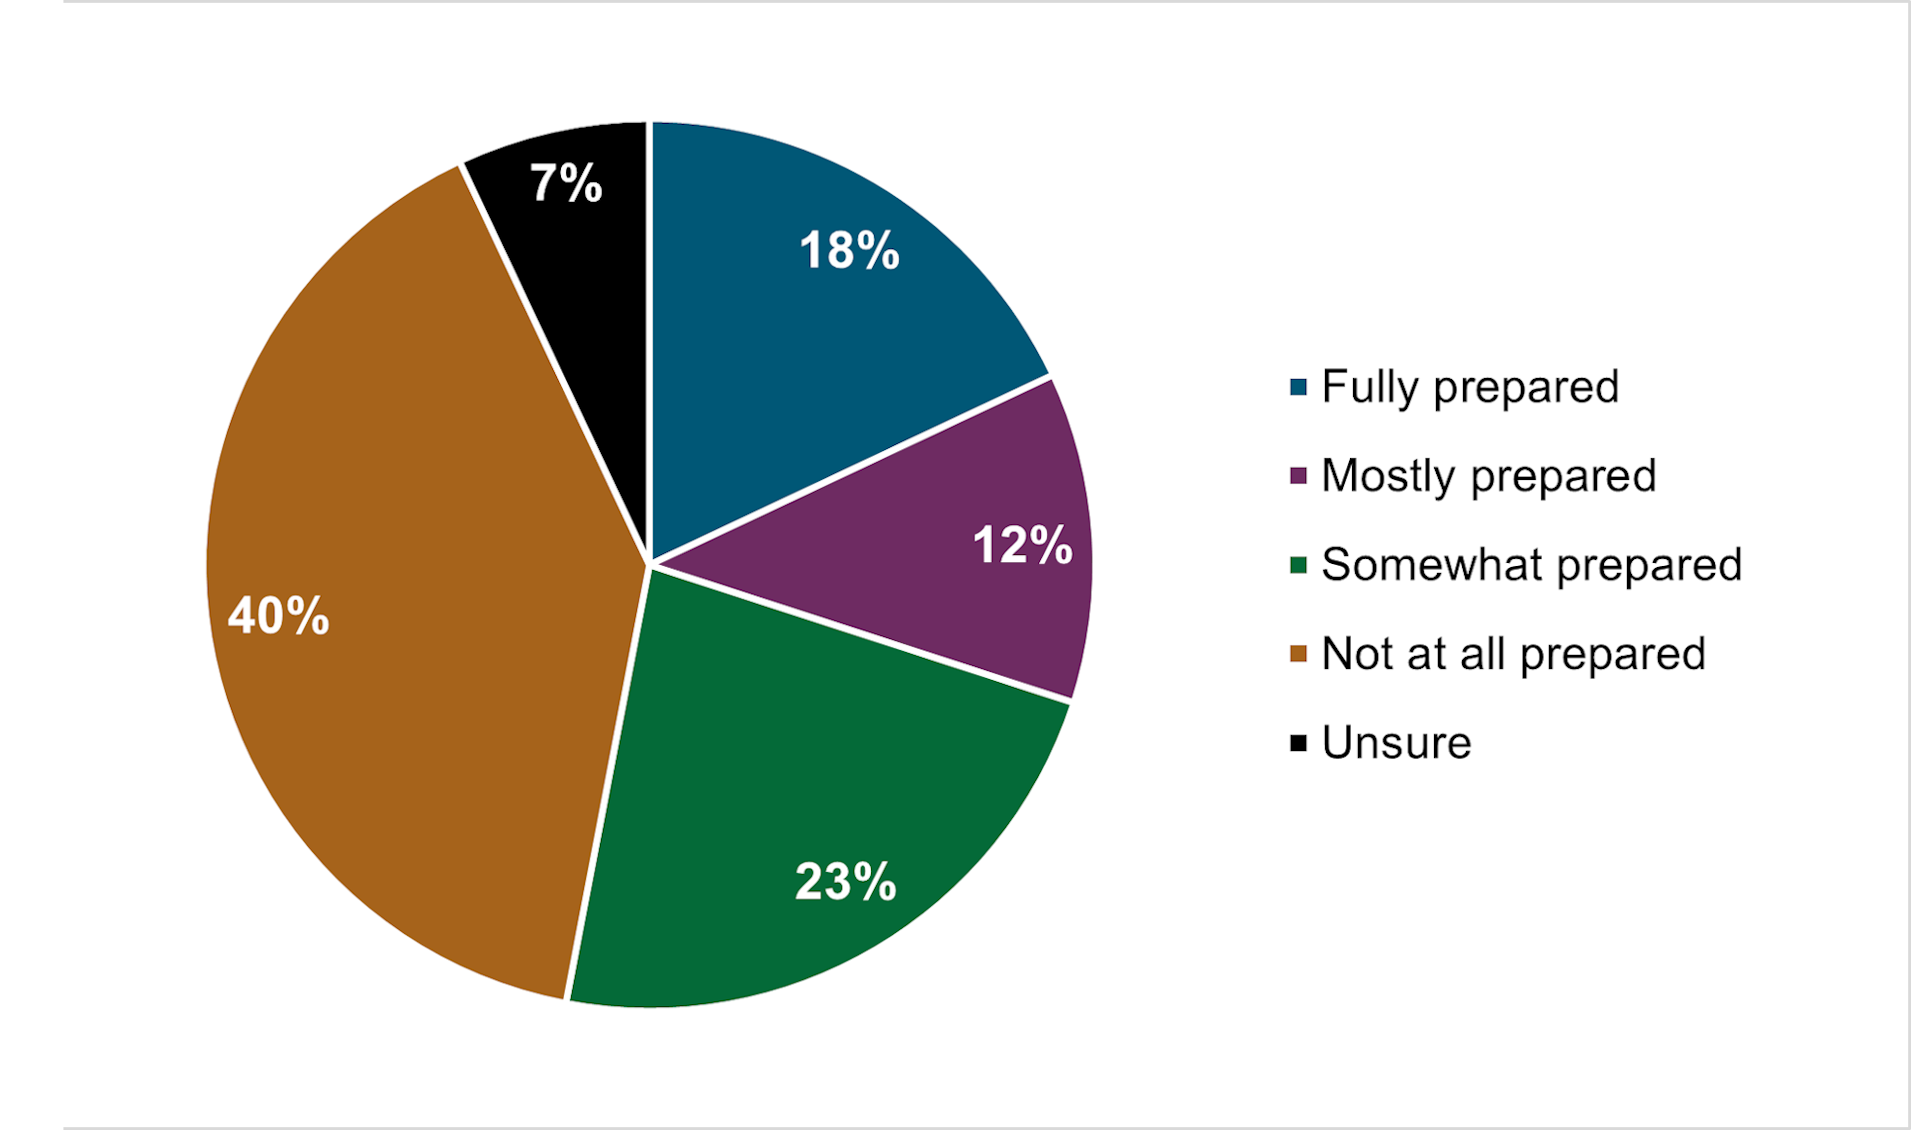
Based on the current requirements for RFS as provided on Canada.ca, how prepared is your business to comply?
Roughly half (53%) of all respondents say they feel at least somewhat prepared to comply with the RFS requirement.
Figure 2 – Level of preparedness
Text version
| How prepared is your business to comply? | Percentage |
|---|---|
Fully prepared |
18% |
Mostly prepared |
12% |
Somewhat prepared |
23% |
Not at all prepared |
40% |
Unsure |
7% |
Base all (n = 1,460)
- 2 in 5 (40%) respondents said they felt their business or organization is not at all prepared to comply and nearly 1 in 10 (7%) said they are unsure.
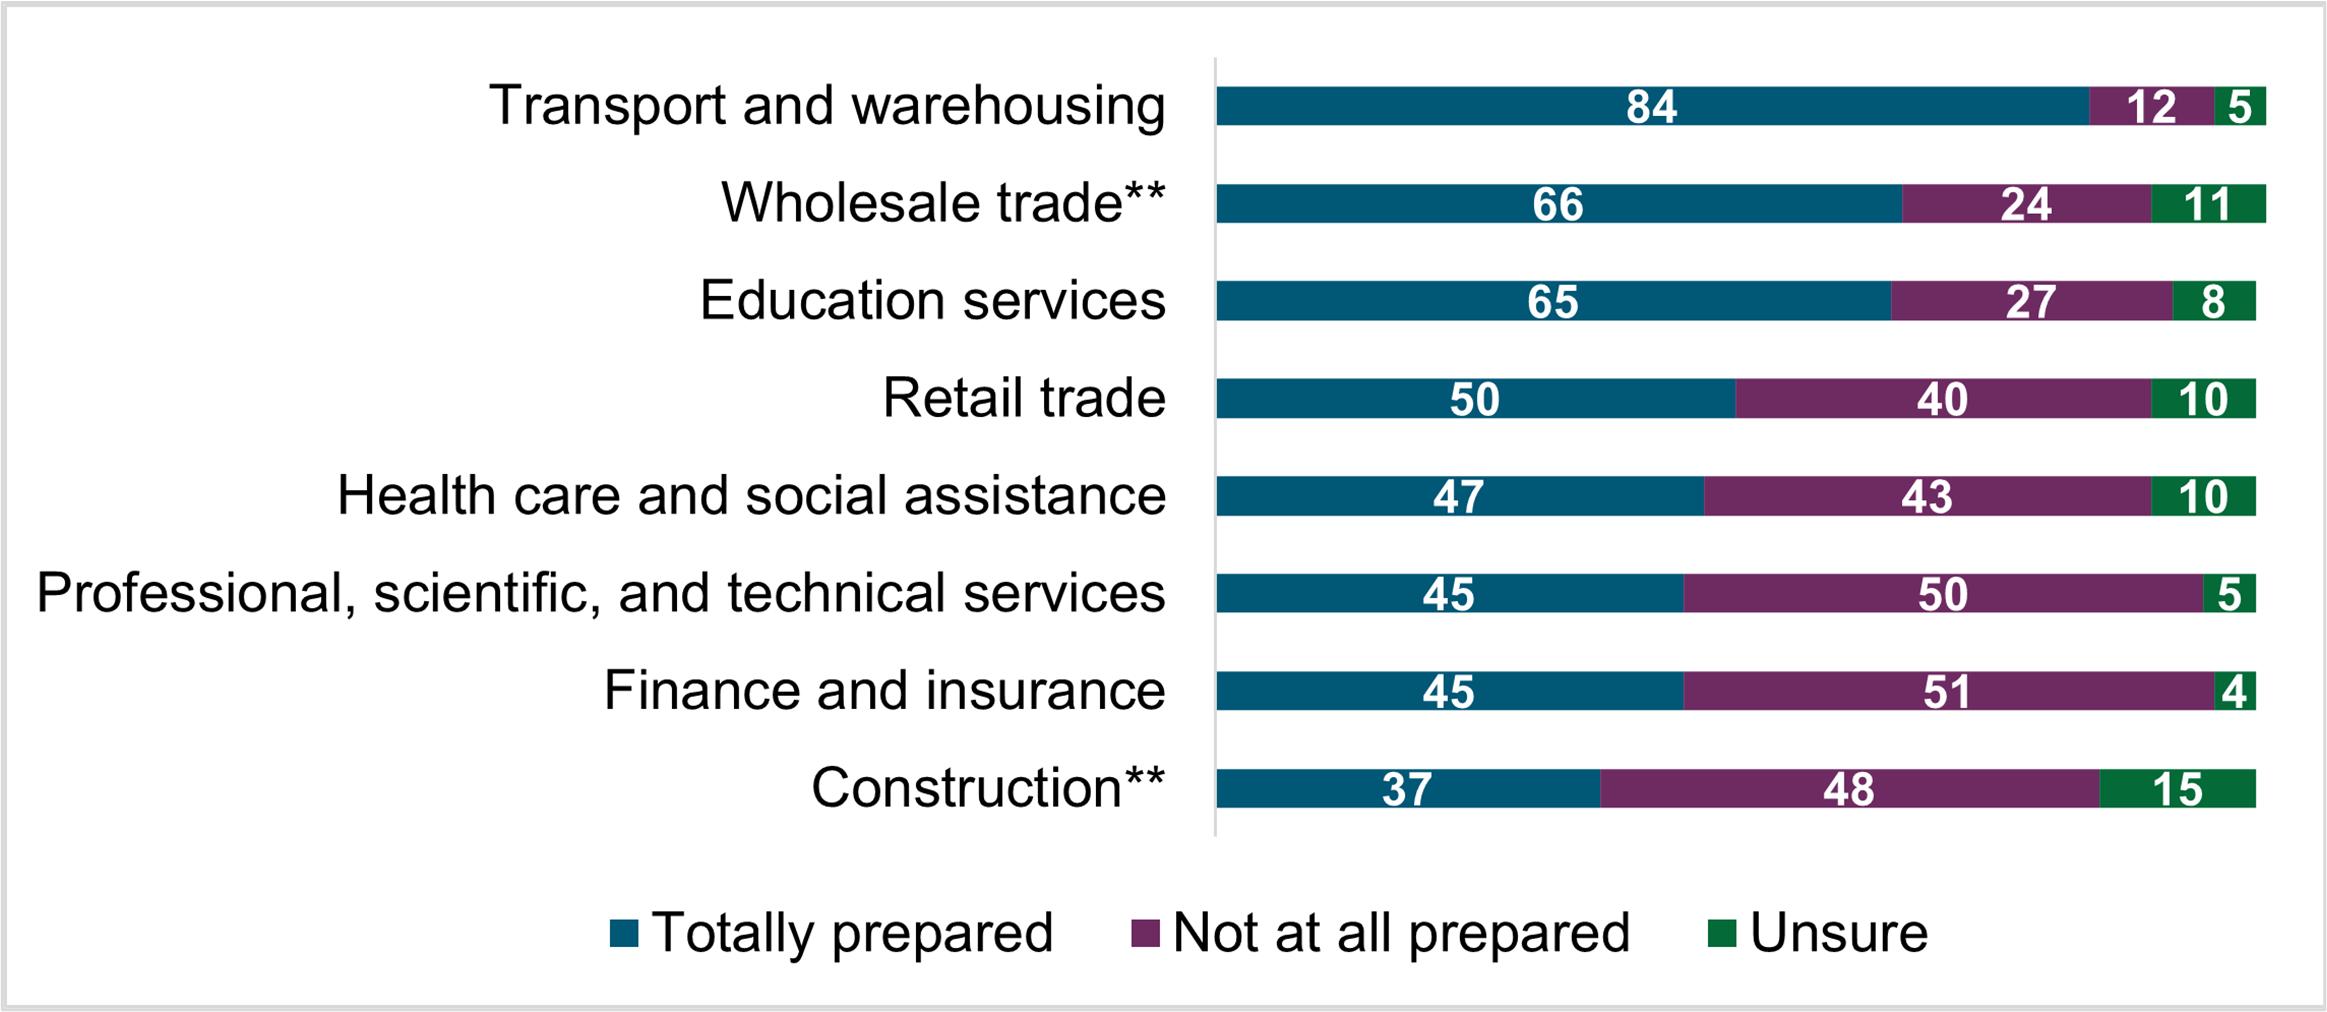
- Respondents from the transport and warehousing sector (84%) expressed a notably high degree of preparedness.
- Respondents from education services (65%) and wholesale trade (66%) also showed a high degree of preparedness compared to other sectors.
- More respondents from professional, scientific, and technical services (50%), construction (48%) and finance and insurance (51%) expressed being not at all prepared.
What we learned – Reporting vehicle
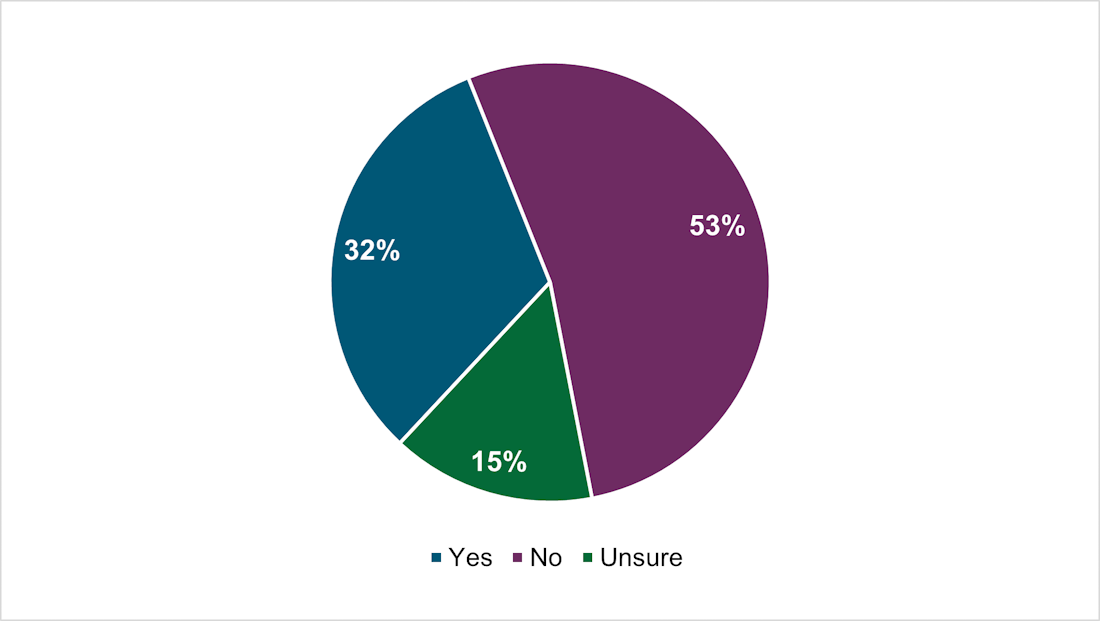
Do you think the T4A is the appropriate method for RFS?
About half (53%) of respondents do not think the T4A is the appropriate reporting method for RFS.
Figure 3 – T4A as the appropriate reporting vehicle for RFS
Text version
| Is the T4A the appropriate method for RFS? | Percentage |
|---|---|
Yes |
32% |
No |
53% |
Unsure |
15% |
Base all (n = 1,460)
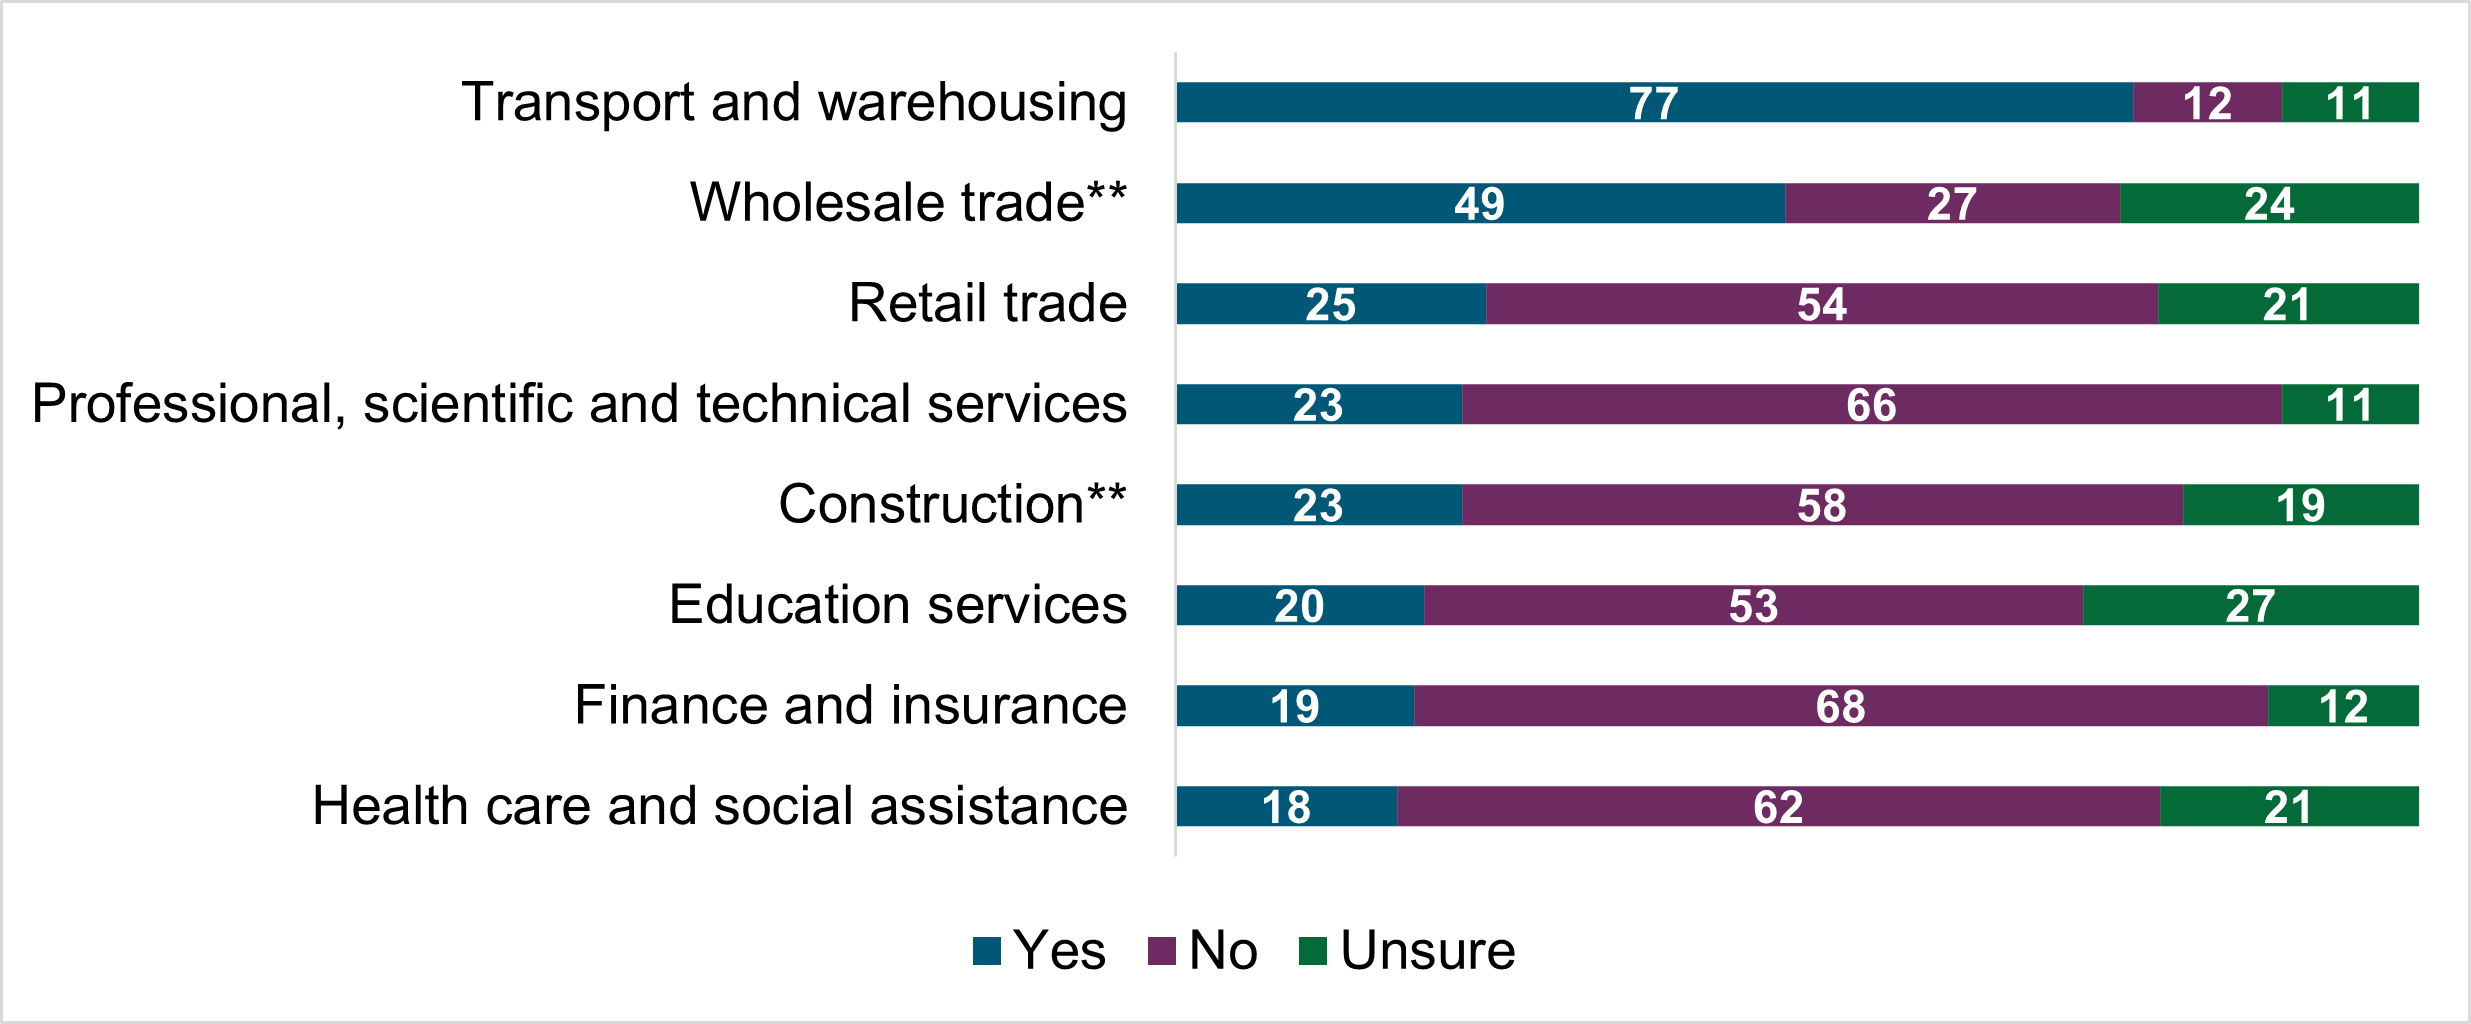
- A slight majority of respondents across most economic sectors do not think that the T4A is the appropriate method for RFS, while just under one third agreed with using the T4A. The remaining were unsure.
- Conversely, roughly 4 in 5 respondents from the transport and warehousing sector (77%), and almost half from the wholesale trade (49%) sector believed the T4A is appropriate.
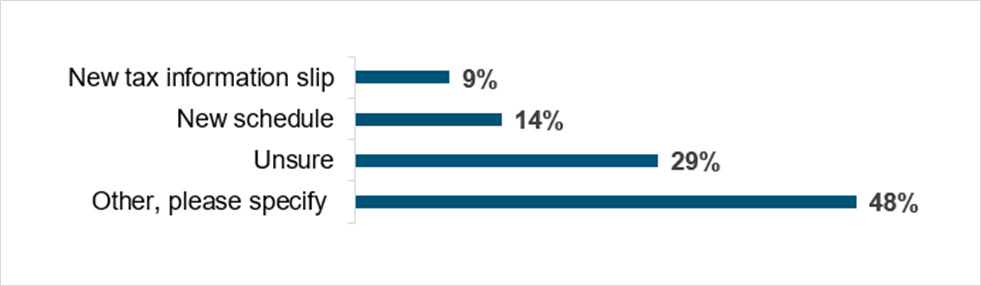
If the T4A is not appropriate, what reporting vehicle would you recommend for RFS?
Figure 4 – Alternative reporting vehicles for RFS
Text version
| If the T4A is not appropriate, what reporting vehicle would you recommend for RFS? | Percentage |
|---|---|
New tax information slip |
9% |
New schedule |
14% |
Unsure |
29% |
Other, please specify: |
48% |
Base all (n = 768)
- Of those who said it is not appropriate, roughly 1 in 10 recommend a new schedule (14%) or new tax information slip (9%) as an alternate method.
- Nearly 3 in 10 (29%) said they are unsure of what method to recommend and nearly half (48%) propose an alternate method or provided a comment.
- Of the 48% who proposed an alternative method or provided a comment, many strongly oppose the RFS requirement or view it as unnecessary, redundant and burdensome.
- The majority suggested that the responsibility of RFS should remain with service providers, and that higher thresholds be established to target non-compliant sectors.
- Some believed that current invoicing and self-reporting should be sufficient, while others believe the CRA should obtain this information through existing audit processes.
What challenges might you have with preparing and issuing T4A information slips for RFS?
Issuing too many information slips (62%), hiring additional staff (48%), and purchasing/upgrading software (37%) are among the top challenges anticipated.
Base all (n = 1,460)
- Respondents could select multiple challenges that applied in their response. The average number of challenges per response was 3.
- Roughly 1 in 6 (16%) respondents said they do not have any challenges.
- 28% provided challenges not listed, including complexity of the process, privacy issues relating to obtaining social insurance numbers, as well as undue burden, red tape, and bureaucratic challenges impacting businesses, particularly small (6-99 employees) businesses.
- The belief that current invoicing and self-reporting should be sufficient was echoed.
Figure 5 – Challenges with the T4A for RFS

Text version
| What challenges might you have with preparing and issuing T4A information slips for RFS? | Percentage |
|---|---|
I will have to issue too many T4A information slips |
62% |
I will need to hire additional staff to file T4A information slips |
48% |
I may need to purchase additional software or upgrade my current software to prepare a T4A information slip |
37% |
I don’t know who to issue a T4A information slip to |
26% |
I don’t know how to track incoming/outgoing T4A information slips |
24% |
I am unsure where to get the information required for filling out the T4A information slip |
23% |
The invoices my company receives do not have a goods and services component |
17% |
I am unsure how to prepare T4A information slip electronically |
11% |
I am unsure how to prepare a paper T4A information slip |
10% |
I don’t know where to find the T4A slip |
5% |
I don’t have any challenges issuing T4A information slips |
16% |
Other, please specify (please do not include any personal information) |
28% |
Base all (n = 1,460)
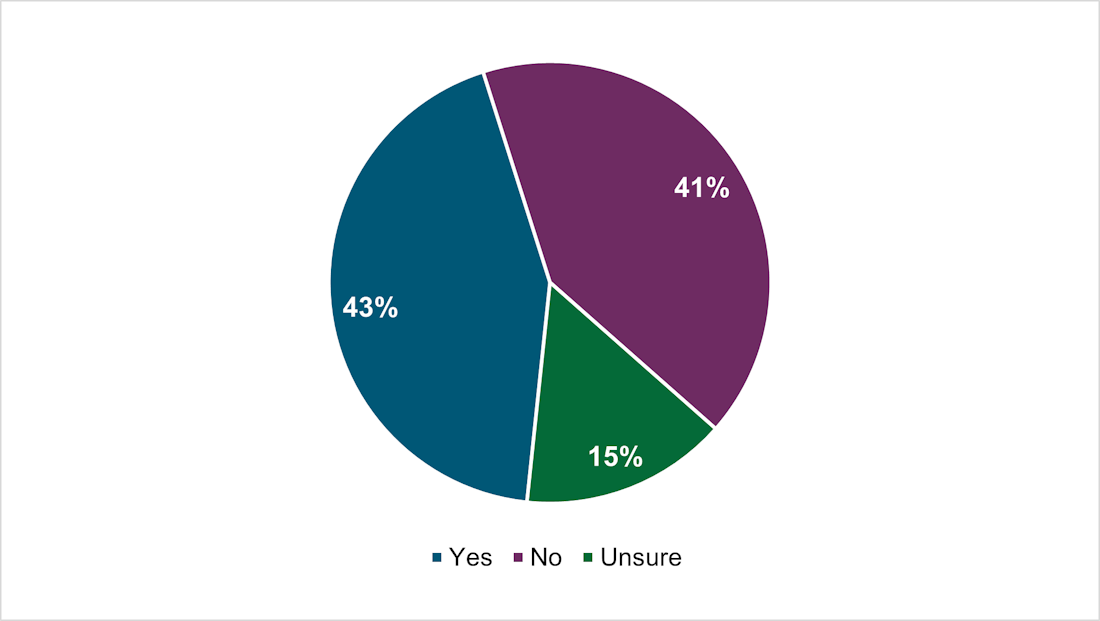
Do the invoices you receive usually have goods and services separated?
Respondents are split as to whether goods and services are separated on the invoices they receive or not, and this varies across business and organization size and economic sector.
Figure 6 – Goods and services separated on invoices
Text version
| Are goods and services separated on invoices? | Percentage |
|---|---|
Yes |
43% |
No |
41% |
Unsure |
15% |
Base all (n = 1,460)
Note: Business and organization size by number of employees – micro (1-5), small (6-99), medium (100-499), large (500+).
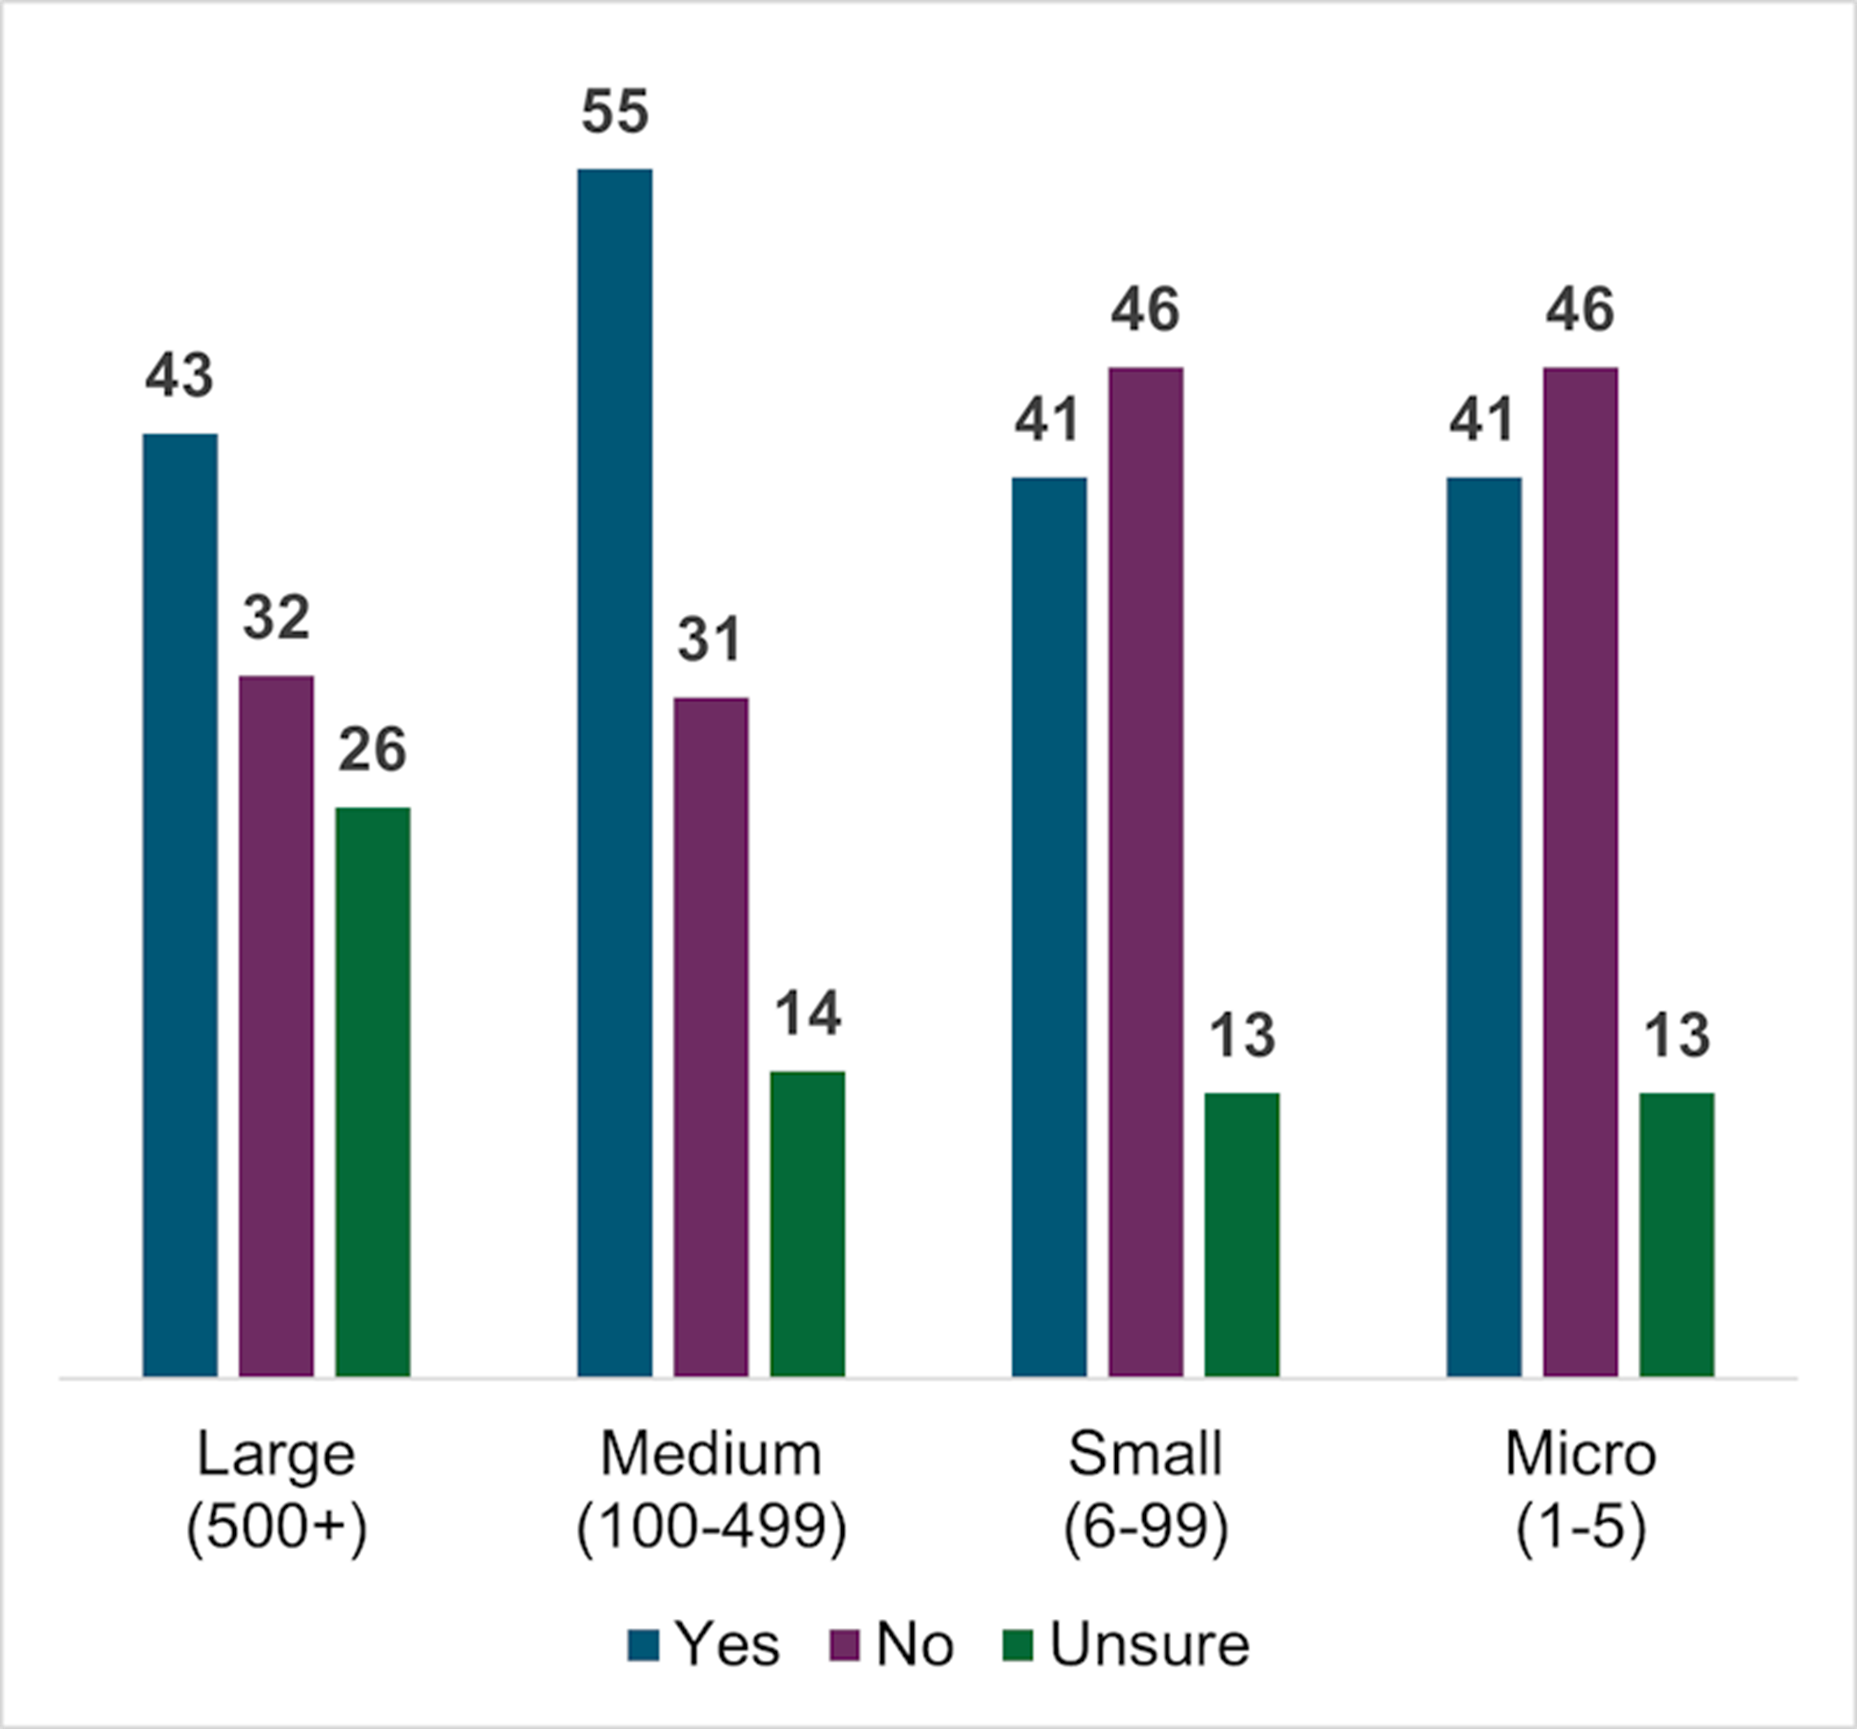
- 43% said they receive invoices with these items separated. A similar amount (41%) said they do not, and roughly 15% said they are unsure.
- Nearly half of respondents from small (46%) and micro (46%) businesses and organizations said the invoices they receive do not have goods and services separated.
- In large (43%) and medium (55%) sized organizations, respondents were more likely to say the invoices they receive separate these items.
- Responses from the construction sector were split, where roughly 42% said they either do or do not receive goods and services separated, respectively.
- A clear majority of respondents from the transport and warehousing (71%) sector said they usually receive invoices with goods and services separated.
What we learned – Reporting threshold
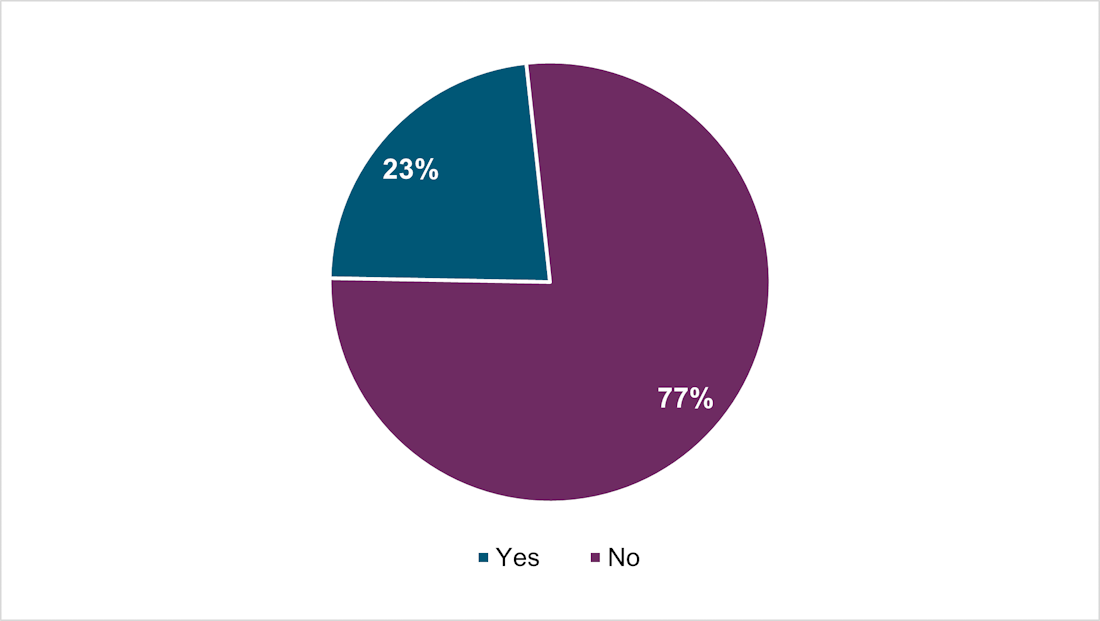
Is the $500 reporting threshold appropriate?
Over three quarters (77%) of respondents do not feel the current threshold is appropriate.
Figure 7 – $500 as the appropriate reporting threshold for RFS
Text version
| Is the $500 threshold appropriate? | Percentage |
|---|---|
No |
77% |
Yes |
23% |
Base all (n = 1,460)
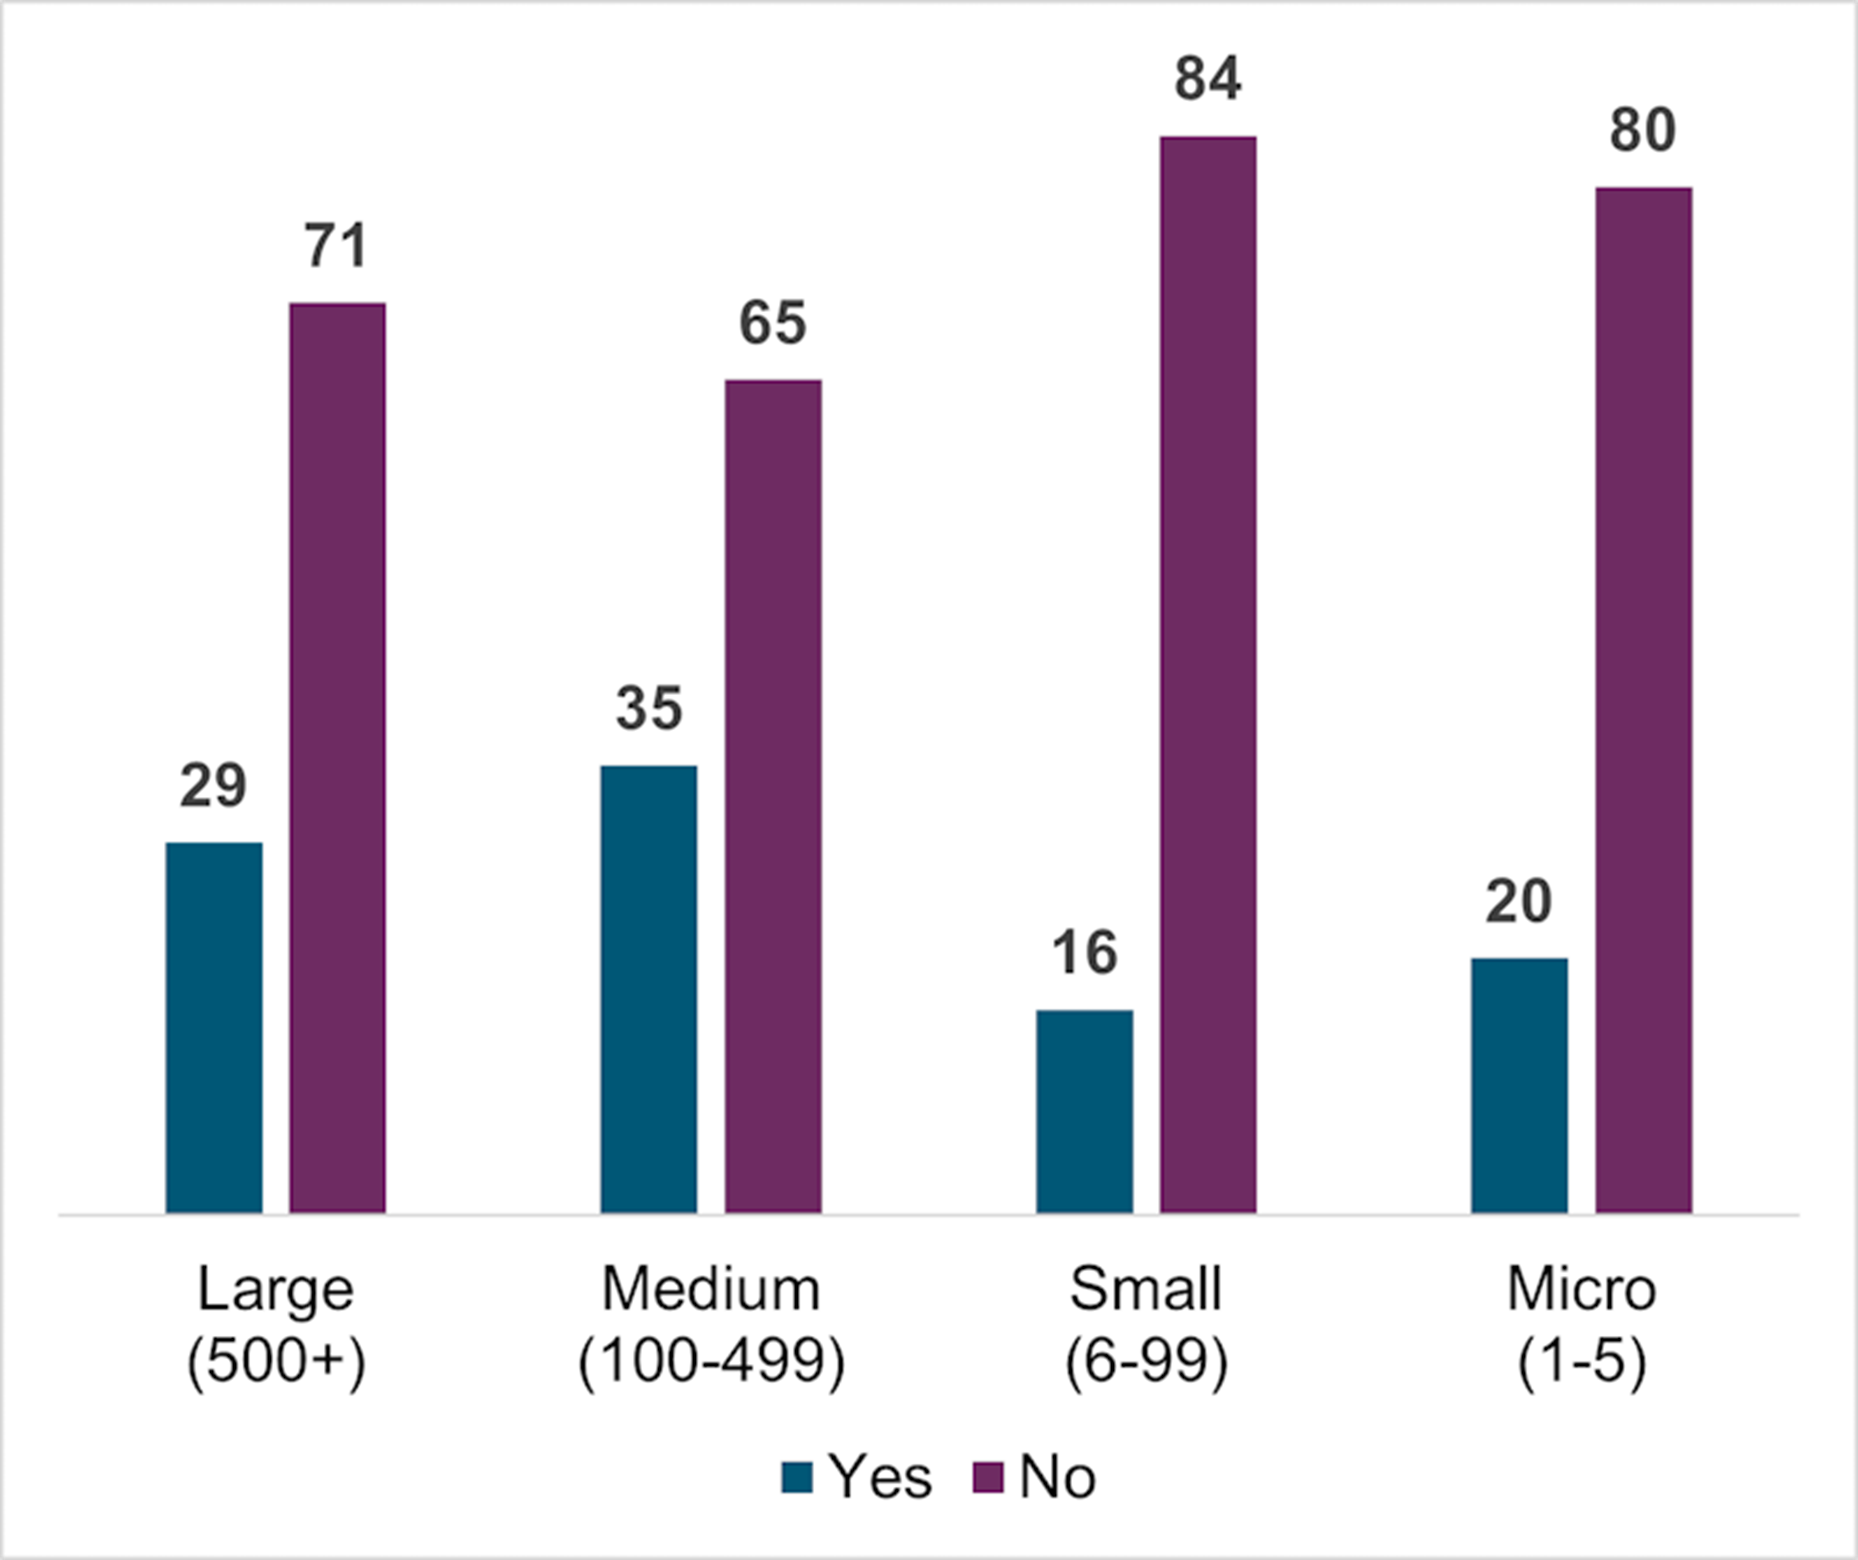
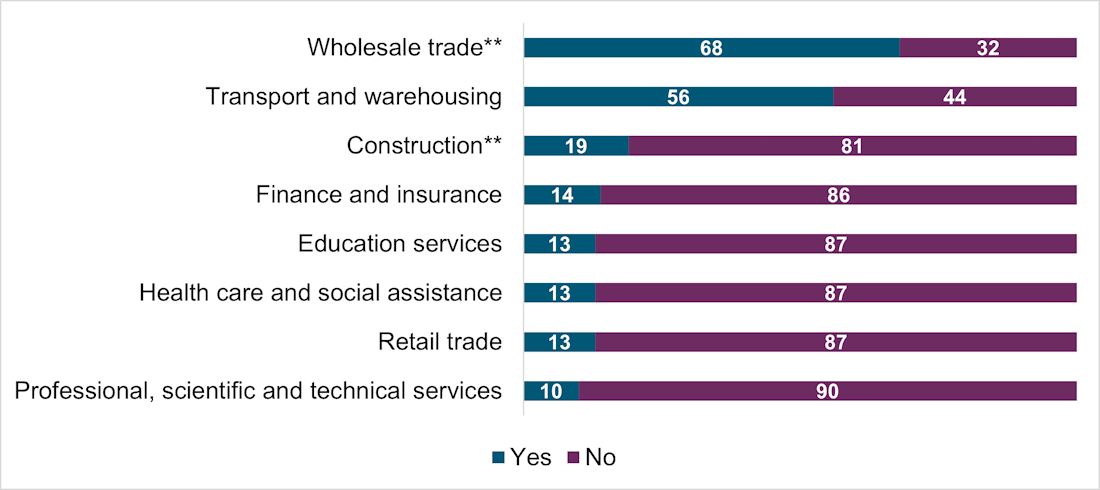
- Only 23% of respondents think the $500 threshold is appropriate.
- Most respondents across business or organization sizes and economic sectors feel the $500 threshold is not appropriate.
- Most respondents from the wholesale trade (68%) and transport and warehousing (56%) sectors think the current threshold is appropriate.
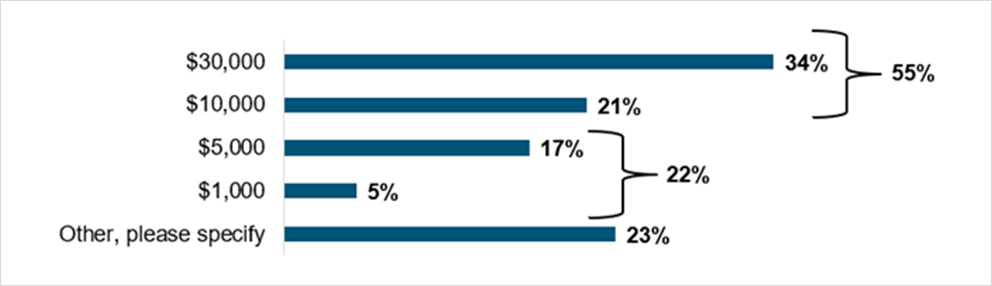
If $500 is not appropriate, what reporting threshold would minimize the administrative burden related to RFS?
Of respondents who said the current threshold is not appropriate, most (55%) felt higher threshold amounts will minimize administrative burden.
- Some expressed dissatisfaction with reporting small amounts for services, while others pointed out that larger amounts for goods do not require similar reporting.
- There was broad support from respondents for higher threshold amounts across all business and organization sizes, and economy sectors.
Figure 8 – Alternative reporting thresholds for RFS
Text version
| If $500 is not appropriate, what reporting threshold would minimize the administrative burden related to RFS? | Percentage |
|---|---|
$30,000 |
34% |
$10,000 |
21% |
$5,000 |
17% |
$1,000 |
5% |
Other, please specify: |
23% |
Base all (n = 1,127)
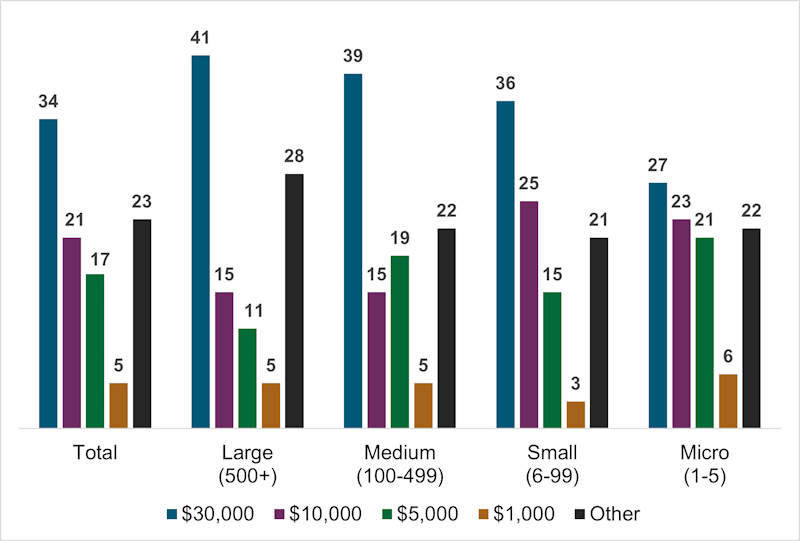
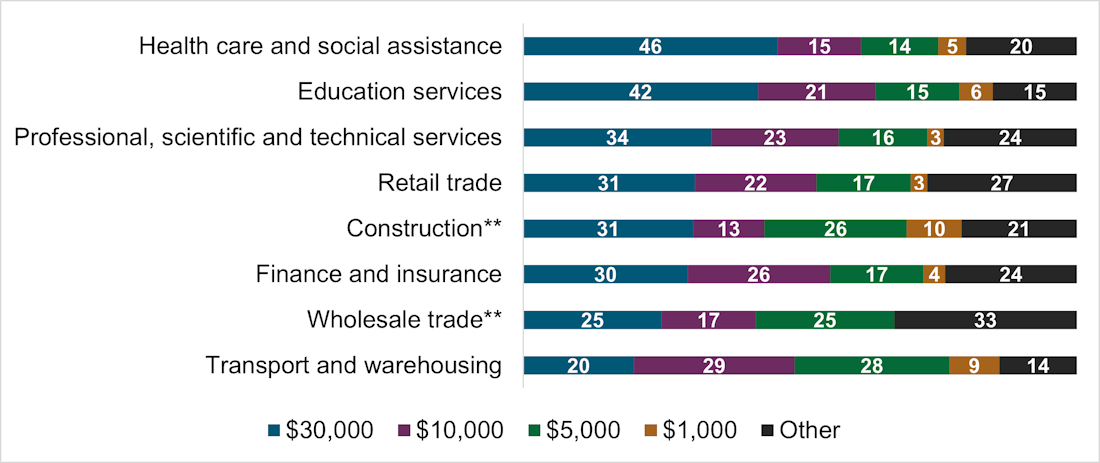
- 55% felt a threshold of at least $10,000 would be more appropriate, with 34% selecting $30,000 and 21% selecting $10,000.
- Fewer thought the threshold should be $5,000 (17%) or $1,000 (5%).
- 23% selected “other”, emphasizing that the threshold should be significantly higher than the options listed to avoid unnecessary administrative burden on small businesses. Many suggested a threshold between $50,000 and $100,000.
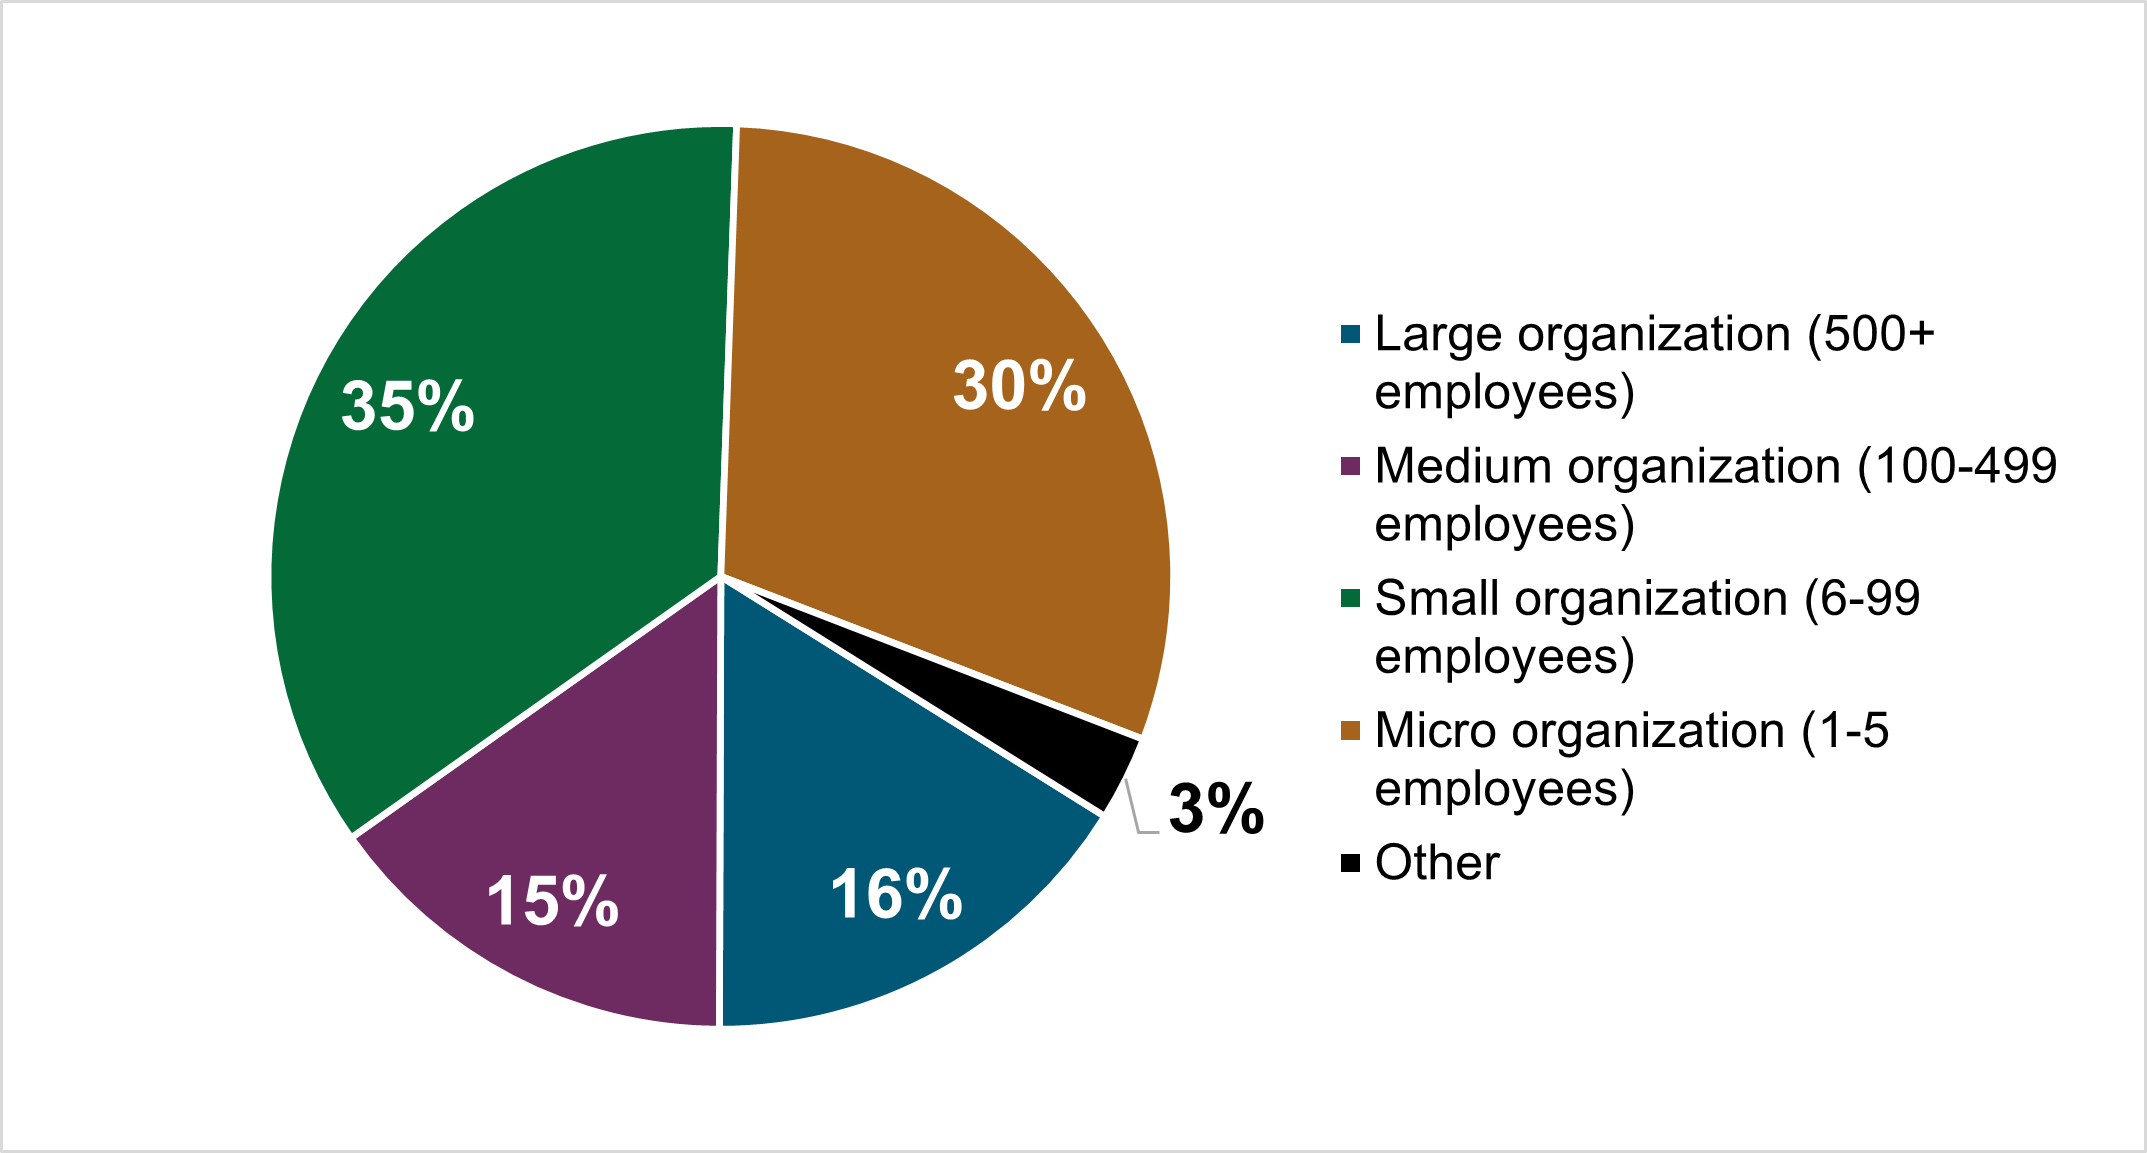
Demographics
Note: Where there were 10 or fewer respondents, data is removed for privacy reasons (represented by *).
Figure 9 - Organization size
Text version
| Organization size | Percentage |
|---|---|
Large organization (500+ employees) |
16% |
Medium organization (100-499 employees) |
15% |
Small organization (6-99 employees) |
35% |
Micro organization (1-5 employees) |
30% |
Other |
3% |
Base all (n = 1,460)
Economic sector
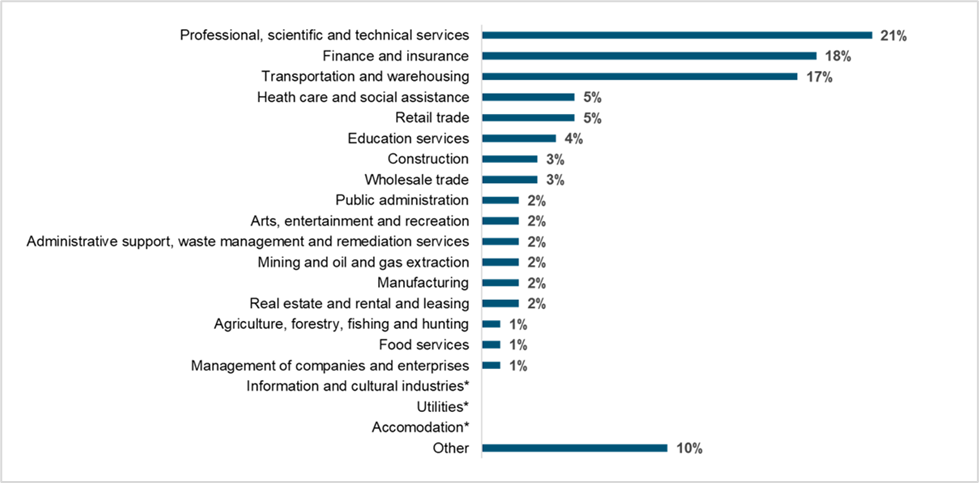
Figure 10 – Economic sector
Text version
| What sector of the economy do you work in? | Percentage |
|---|---|
Professional, scientific and technical services |
21% |
Finance and insurance |
18% |
Transportation and warehousing |
17% |
Health care and social assistance |
5% |
Retail trade |
5% |
Education services |
4% |
Construction |
3% |
Wholesale trade |
3% |
Public administration |
2% |
Arts, entertainment and recreation |
2% |
Administration and support, waste management and remediation services |
2% |
Mining and oil and gas extraction |
2% |
Manufacturing |
2% |
Real estate and rental and leasing |
2% |
Agriculture, forestry, fishing and hunting |
1% |
Food services |
1% |
Management of companies and enterprises |
1% |
Information and cultural industries* |
- |
Utilities* |
- |
Accommodation* |
- |
Other |
10% |
Base all (n = 1,460)
Provinces and territorial representation
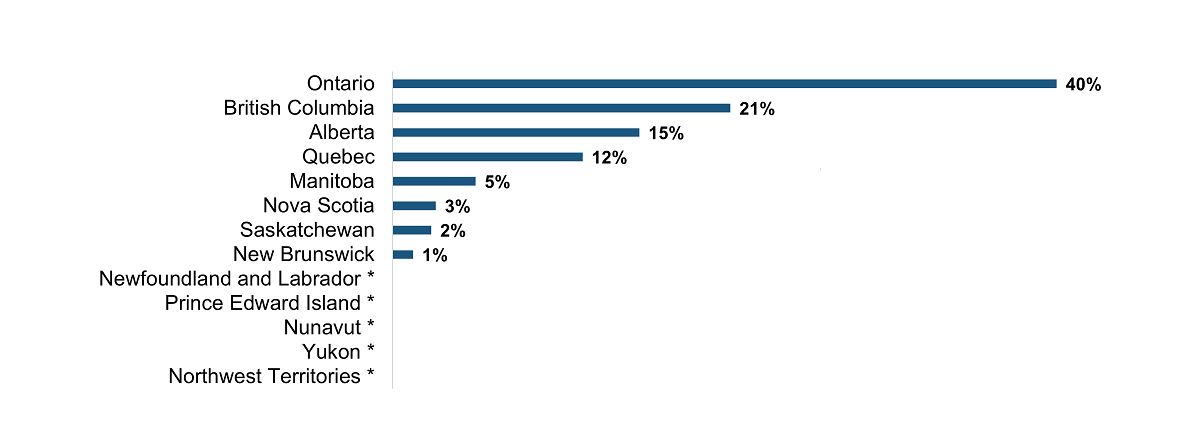
Figure 11 – Provinces and territorial representation
Text version
| Which province or territory is your organization located in? | Percentage |
|---|---|
Ontario |
40% |
British Columbia |
21% |
Alberta |
15% |
Quebec |
12% |
Manitoba |
5% |
Nova Scotia |
3% |
Saskatchewan |
2% |
New Brunswick |
1% |
Newfoundland and Labrador* |
- |
Nunavut* |
- |
Prince Edward Island* |
- |
Northwest Territories* |
- |
Base all (n = 1,442)
Official languages representation
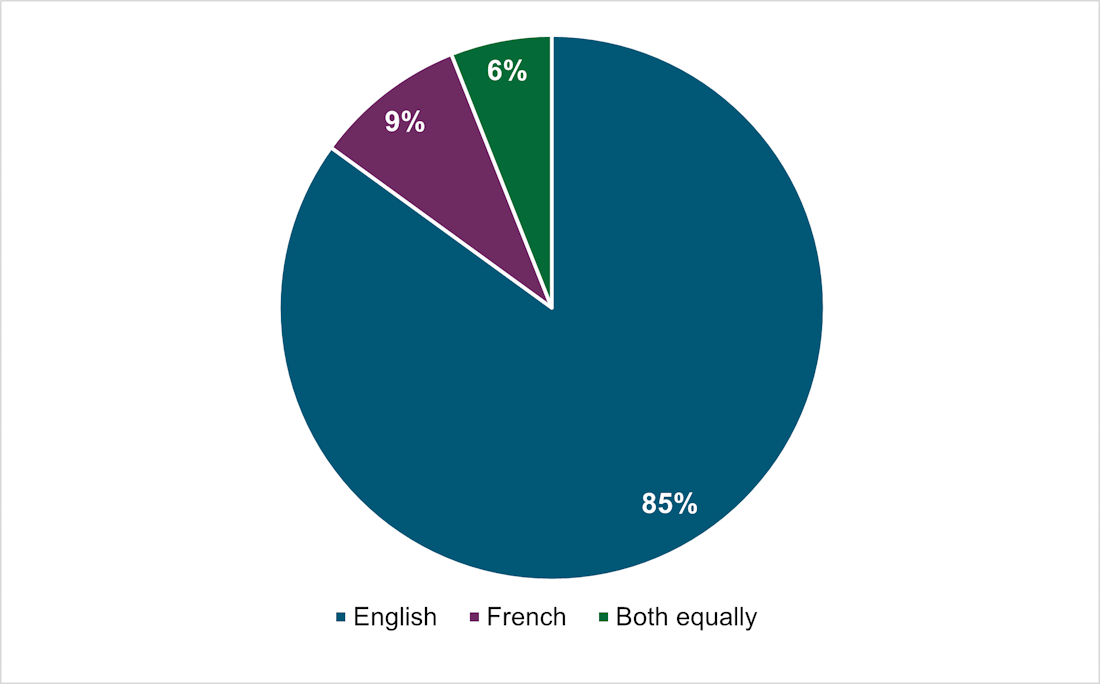
Figure 12 – Primary official language of operation
Text version
| Does your organization operate mainly in French or English? | Percentage |
|---|---|
English |
85% |
French |
9% |
Both equally |
6% |
Base all (n = 1,442)
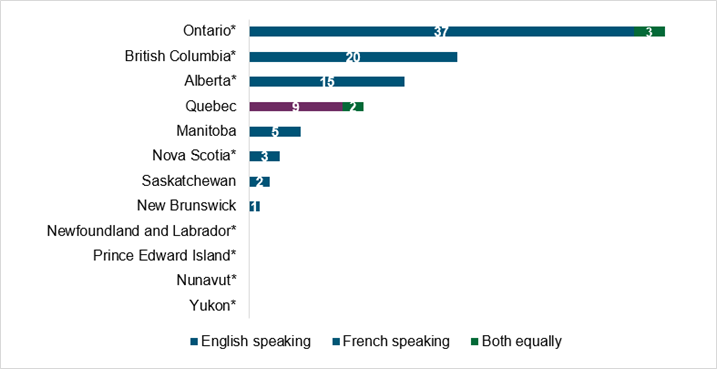
Figure 13 – Responses by province or territory
Text version
| Province or territory | English speaking | French speaking | Both equally |
|---|---|---|---|
Ontario* |
37% |
- |
3% |
British Columbia* |
20% |
- |
- |
Alberta |
15% |
- |
- |
Quebec |
- |
9% |
2% |
Manitoba* |
5% |
- |
- |
Nova Scotia* |
3% |
- |
- |
Saskatchewan |
2% |
- |
- |
New Brunswick |
1% |
- |
- |
Newfoundland and Labrador* |
- |
- |
- |
Prince Edward Island* |
- |
- |
- |
Northwest Territories* |
- |
- |
- |
Nunavut* |
- |
- |
- |
Yukon* |
- |
- |
- |
Base all (n = 1,442)
Takeaways and next steps
Reporting vehicle
A majority of respondents from most sectors of the economy indicated that the T4A is not the appropriate reporting vehicle for RFS.
Reporting threshold
Most respondents indicated that the current $500 threshold is too low and needs to be significantly increased.
Administrative burden
Most respondents indicated there are concerns with the compliance cost and administrative burden that RFS will impose, especially on small businesses (6-99 employees).
Educational needs
Results suggest a need to improve guidance on the RFS requirement, including which services need to be reported, and to clarify the obligations of payers and payees.
The CRA will carefully review the findings from this questionnaire, along with other stakeholder engagement activities, to help inform decision-making related to RFS.
Appendix – Breakdown of responses by business size, organization size and economic sector
Note: Sample sizes across demographics may not add up to total due to categories not presented in these tables.
*Results are limited to sectors of the economy with at least 35 respondents.
Results with “**” are to be interpreted with extra caution due to small sample size.
Were you already aware of the RFS reporting requirements?
Figure 14 – Business and organization size (%)
Text version
| Business and organization size | Yes | No |
|---|---|---|
Large (500+) |
75% |
25% |
Medium (100 – 499) |
72% |
28% |
Small (6 – 99) |
67% |
33% |
Micro (1 – 5) |
61% |
39% |
Base all (n = 1,460)
Figure 15 – Sectors of the economy (%)*
Text version
| Sectors of the economy* | Yes | No |
|---|---|---|
Transport and warehousing |
73% |
27% |
Education services |
72% |
28% |
Retail trade |
72% |
28% |
Wholesale trade** |
70% |
30% |
Finance and insurance |
70% |
30% |
Professional, scientific and technical services |
70% |
30% |
Health care and social assistance |
53% |
47% |
Construction** |
50% |
50% |
Base all (n = 1,460)
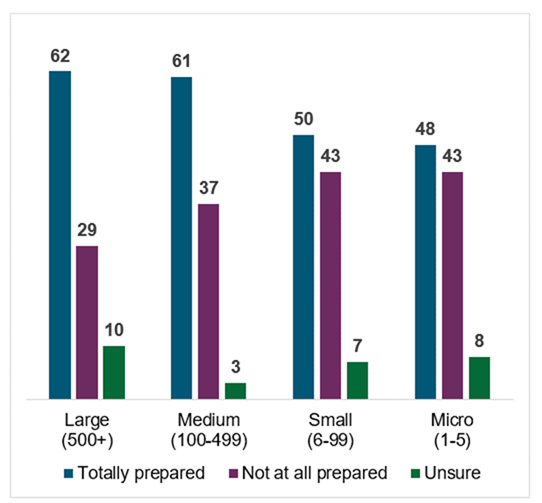
Based on the current requirements for RFS as provided on Canada.ca, how prepared is your business to comply?
Figure 16 – Business and organization size (%)
Text version
| Business and organization size | Totally prepared | Not at all prepared | Unsure |
|---|---|---|---|
Large |
62% |
29% |
10% |
Medium |
61% |
37% |
3% |
Small |
50% |
43% |
7% |
Micro |
48% |
43% |
8% |
Base all (n = 1,460)
Figure 17 – Sector of the economy (%)*
Text version
| Business and organization size | Totally prepared | Not at all prepared | Unsure |
|---|---|---|---|
Transport and warehousing |
84% |
12% |
5% |
Wholesale trade** |
66% |
24% |
11% |
Education services |
65% |
27% |
8% |
Retail trade |
50% |
40% |
10% |
Health care and social assistance |
47% |
43% |
10% |
Professional, scientific and technical services |
45% |
50% |
5% |
Finance and insurance |
45% |
51% |
4% |
Construction** |
37% |
48% |
15% |
Base all (n = 1,460)
Do you think the T4A is the appropriate method for RFS?
Figure 18 – Business and organization size (%)

Text version
| Business and organization size | Yes | No | Unsure |
|---|---|---|---|
Large |
38% |
44% |
18% |
Medium |
45% |
48% |
8% |
Small |
31% |
57% |
11% |
Micro |
25% |
55% |
20% |
Base all (n = 1,460)
Figure 19 – Sectors of the economy (%)*
Text version
| Sectors of the economy | Yes | No | Unsure |
|---|---|---|---|
Transport and warehousing |
77% |
12% |
11% |
Wholesale trade** |
49% |
27% |
24% |
Education services |
25% |
54% |
21% |
Retail trade |
23% |
66% |
11% |
Health care and social assistance |
23% |
58% |
19% |
Professional, scientific and technical services |
20% |
53% |
27% |
Finance and insurance |
19% |
68% |
12% |
Construction** |
18% |
62% |
21% |
Base all (n = 1,460)
Do the invoices you receive usually have goods and services separated?
Figure 20 – Business and organization size (%)
Text version
| Business and organization size | Yes | No | Unsure |
|---|---|---|---|
Large |
43% |
32% |
26% |
Medium |
55% |
31% |
14% |
Small |
41% |
46% |
13% |
Micro |
41% |
46% |
13% |
Base all (n = 1,460)
Figure 21 – Sectors of the economy (%)*
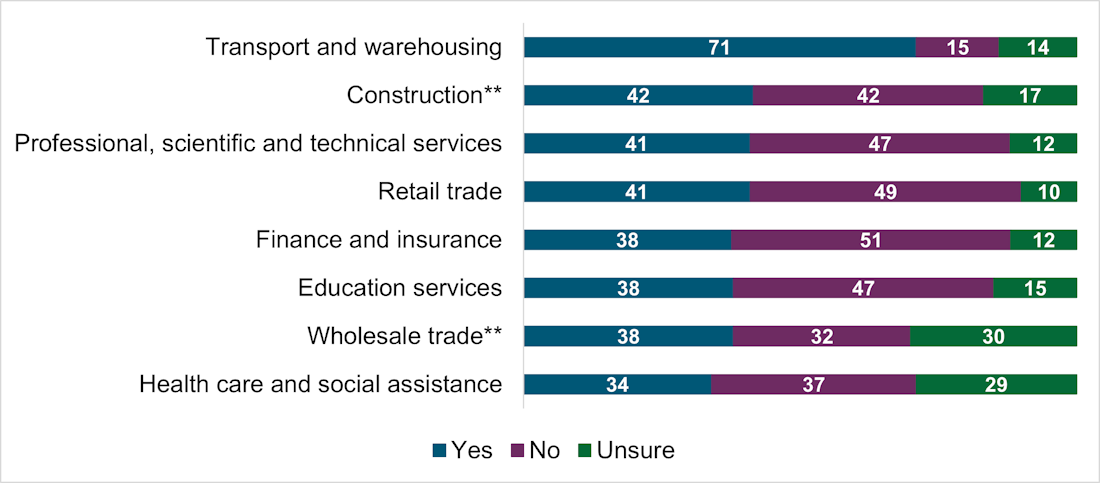
Text version
| Sectors of the economy | Yes | No | Unsure |
|---|---|---|---|
Transport and warehousing |
71% |
15% |
14% |
Construction** |
42% |
42% |
17% |
Professional, scientific and technical services |
41% |
47% |
12% |
Retail trade |
41% |
49% |
10% |
Finance and insurance |
38% |
51% |
12% |
Education services |
38% |
47% |
15% |
Wholesale trade** |
38% |
32% |
30% |
Health care and social assistance |
34% |
37% |
29% |
Base all (n = 1,460)
Is the $500 reporting threshold appropriate?
Figure 22 – Business and organization size (%)
Text version
| Business and organization size | Yes | No |
|---|---|---|
Large |
29% |
71% |
Medium |
35% |
65% |
Small |
16% |
84% |
Micro |
20% |
80% |
Base all (n = 1,460)
Figure 23 – Sectors of the economy (%)*
Text version
| Sectors of the economy | Yes | No |
|---|---|---|
Wholesale trade** |
68% |
32% |
Transport and warehousing |
56% |
44% |
Construction** |
19% |
81% |
Finance and insurance |
14% |
86% |
Education services |
13% |
87% |
Health care and social assistance |
13% |
87% |
Retail trade |
13% |
87% |
Professional, scientific and technical services |
10% |
90% |
Base all (n = 1,460)
If $500 is not appropriate, what reporting threshold would minimize the administrative burden related to RFS?
Figure 24 – Business and organization size (%)
Text version
| Business and organization size | $30,000 | $10,000 | $5,000 | $1,000 | Other |
|---|---|---|---|---|---|
Total |
34% |
21% |
17% |
5% |
23% |
Large |
41% |
15% |
11% |
5% |
28% |
Medium |
39% |
15% |
19% |
5% |
22% |
Small |
36% |
25% |
15 |
3% |
21% |
Micro |
27% |
23% |
21% |
6% |
22% |
Base all (n = 1,127)
Figure 25 – Sectors of the economy (%)*
Text version
| Sectors of the economy* | $30,000 | $10,000 | $5,000 | $1,000 | Other |
|---|---|---|---|---|---|
Health care and social assistance |
46% |
15% |
14% |
5% |
20% |
Education services |
42% |
21% |
15% |
6% |
15% |
Professional, scientific and technical services |
34% |
23% |
16% |
3% |
24% |
Retail trade |
31% |
22% |
17% |
3% |
27% |
Construction** |
31% |
13% |
26% |
10% |
21% |
Finance and insurance |
30% |
26% |
17% |
4% |
24% |
Wholesale trade** |
25% |
17% |
25% |
- |
33% |
Transport and warehousing |
20% |
29% |
28% |
9% |
14% |
Base all (n = 1,127)