
Construction, renovation and demolition waste
The Government of Canada is reducing the amount of construction, renovation and demolition (CRD) waste going to landfill. CRD waste results from materials disposed of throughout the course of a construction, renovation or demolition project. Reporting is mandatory for projects that have a total value over $5 million and in areas where commercial waste services are available.
An example of such a project would be major renovations to building envelopes (including roofs, walls, windows and doors) to improve energy efficiency, reduce operating costs, or increase safety and security. It could also include interior renovations to modernize workspaces, maximize occupancy and release surplus public real property for development as new homes.
The types of materials generated from CRD projects include comingled materials, metals, plastics, gypsum, masonry, concrete, asphalt and wood. Reporting excludes hazardous CRD materials such as paint cans, asbestos, coal tar and treated wood, which are to be disposed of in accordance with federal, provincial or territorial, or municipal regulations and through established programs.
The following figures provide an overview of progress toward the target of diverting at least 90% by weight of all CRD waste from landfills. By 2030, departments will strive to achieve 100% diversion for all CRD waste from landfills.
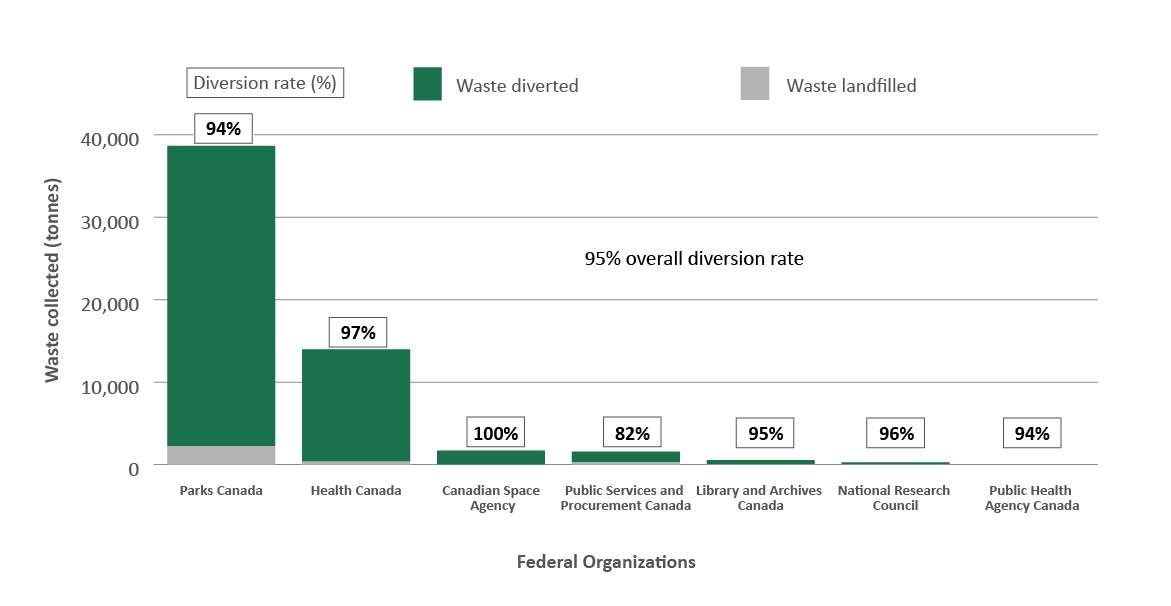
Figure 11 - Text version
The bar graph shows the weight of construction, renovation and demolition waste diverted and landfilled in fiscal year 2023–24 by federal organizations. Above each bar is each organization’s percentage diversion rate.
| Federal organization | Waste diverted (t) | Waste landfilled (t) | Diversion rate |
|---|---|---|---|
| Parks Canada | 36,455 | 2,202 | 94% |
| Health Canada | 13,602 | 368 | 97% |
| Canadian Space Agency | 1,692 | 0 | 100% |
| Public Services and Procurement Canada | 1,282 | 289 | 82% |
| Library and Archives Canada | 528 | 26 | 95% |
| National Research Council | 249 | 12 | 96% |
| Public Health Agency Canada | 0.6 | 0.04 | 94% |
| Total | 53,808 | 2,897 | 95% |
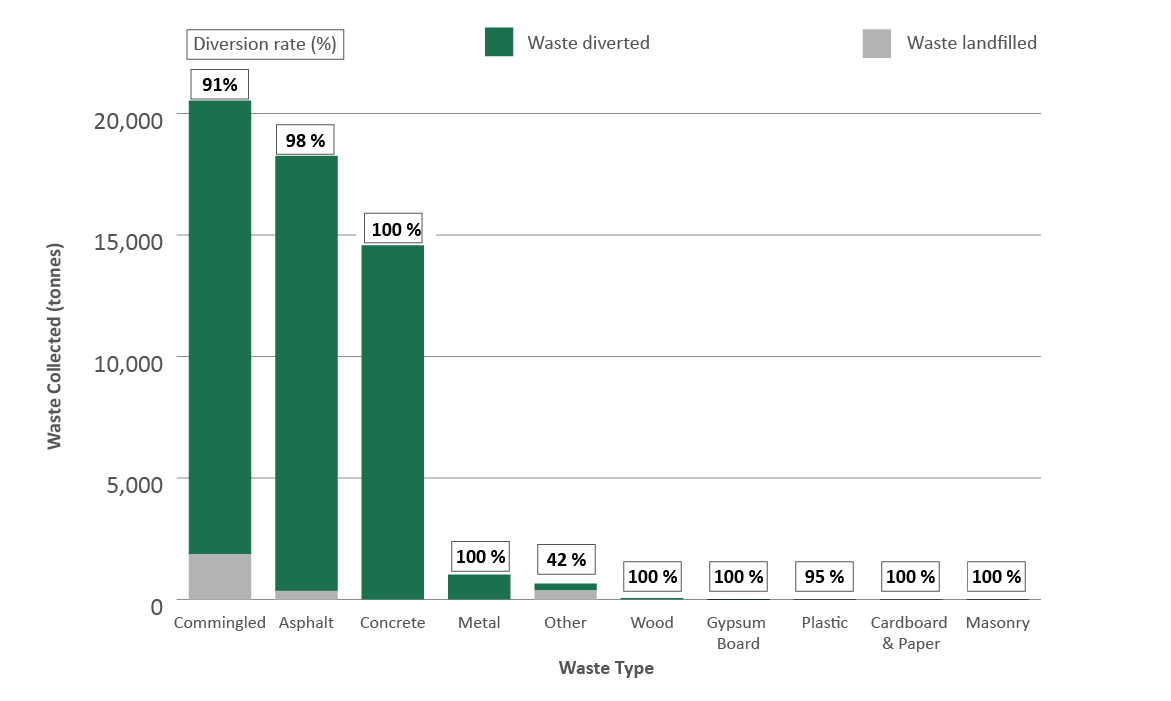
Figure 12 - Text version
The bar graph shows the amount of construction, renovation and demolition waste diverted and landfilled in fiscal year 2023–24 by waste category. Above each bar is the percentage diversion rate for each waste category.
| Waste category | Waste diverted (t) | Waste landfilled (t) | Diversion rate |
|---|---|---|---|
| Commingled | 18,661 | 1,868 | 91% |
| Asphalt | 17,899 | 360 | 98% |
| Concrete | 14,571 | 0 | 100% |
| Metal | 1,027 | 0 | 100% |
| Other | 275 | 380 | 42% |
| Wood | 63 | 0 | 100% |
| Gypsum board | 13 | 0 | 100% |
| Plastic | 9 | 0 | 95% |
| Cardboard and paper | 6 | 0 | 100% |
| Masonry | 3 | 0 | 100% |
| Jurisdiction | Waste diverted (t) | Waste landfilled (t) | Percentage diversion |
|---|---|---|---|
| Alberta | 23,991 | 1,152 | 95% |
| Ontario | 22,444 | 670 | 97% |
| Quebec | 5,596 | 182 | 97% |
| Nova Scotia | 454 | 446 | 50% |
| Prince Edward Island | 32 | 68 | 32% |
| Yukon | 4.3 | 40 | 8% |
| Newfoundland and Labrador | 3.5 | 40 | 8% |
| Manitoba | 0.61 | 0.04 | 94% |
| Canada | 52,526 | 2,608 | 95% |
Key results
- Federal organizations have largely exceeded or are close to achieving the annual 90% target diversion rates for construction, renovation and demolition waste. They are also on track to achieve the aspirational target of 100% diversion by 2030.
- Almost 97% of waste generated by construction, renovation and demolition projects by weight is commingled, asphalt or concrete. As a result, they dominate the overall diversion rate of 95%, given that their individual diversion rates are all over 90%. Nearly all other material diversion rates are at or close to 100%, contributing to overall success.
- Although the “other” category has a low diversion rate, the amount of waste generated is small relative to the other categories. This category represents materials that are not easily classified into the other categories and may have fewer diversion options at the local level.
- At the provincial and territorial level, diversion rates are highest among the largest provinces where construction, renovation and demolition projects were completed in 2023–24. Diversion rates are lower in the North and Atlantic regions, where waste diversion options may be more limited for the categories of waste generated in these jurisdictions.
- Diversion rates will vary from year to year, depending on the number and location of projects completed, the type of project, and the types of waste generated, coupled with the local diversion options available for each waste type.