
Water use
As outlined in the Greening Government Strategy, the Government of Canada is reducing its water consumption and its load on municipal systems by:
- tracking and disclosing its potable water consumption from major facilities
- using best-in-class water-use practices in new construction and major renovations
- designing all new Crown-owned buildings to effectively manage stormwater
The following figures provide an overview of the progress on water consumption, including from municipal water systems.

Figure 14 - Text version
The bar chart shows water consumption by federal organization and water source for fiscal year 2023–24.
| Federal organization | Ground water (m3, thousands) | Municipal (m3, thousands) | Other (m3, thousands) | Rainwater (m3, thousands) | Recycled (m3, thousands) | Surface (m3, thousands) | Total (m3, thousands) |
|---|---|---|---|---|---|---|---|
| National Defence | 1,460 | 7,486 | 0 | 0 | 1,496 | 1,786 | 12,228 |
| Correctional Service Canada | 492 | 2,227 | 0 | 0 | 0 | 239 | 2,959 |
| Public Services and Procurement Canada | 0 | 1,422 | 0 | 0 | 0 | 0 | 1,422 |
| Fisheries and Oceans Canada | 0 | 497 | 0 | 0 | 0 | 0 | 498 |
| National Research Council Canada | 0 | 471 | 0 | 0 | 0 | 0 | 471 |
| Agriculture and Agri-Food Canada | 0 | 188 | 0 | 0 | 0 | 0 | 188 |
| Royal Canadian Mounted Police | 0 | 163 | 0 | 0 | 0 | 0 | 163 |
| Canadian Food Inspection Agency | 42 | 107 | 0 | 0 | 0 | 0 | 150 |
| Natural Resources Canada | 0 | 125 | 3 | 0 | 0 | 0 | 128 |
| Communications Security Establishment Canada | 0 | 109 | 0 | 1 | 0 | 0 | 110 |
| All other organizations | 40 | 709 | 0 | 1 | 0 | 0 | 750 |
Canada Border Services Agency |
0 | 106 | 0 | 0 | 0 | 0 | 106 |
Environment and Climate Change Canada |
4 | 95 | 0 | 0 | 0 | 0 | 99 |
Transport Canada |
36 | 61 | 0 | 0 | 0 | 0 | 97 |
Indigenous Services Canada |
0 | 80 | 0 | 0 | 0 | 0 | 80 |
Public Health Agency of Canada |
0 | 78 | 0 | 0 | 0 | 0 | 78 |
Public Safety Canada |
0 | 56 | 0 | 0 | 0 | 0 | 56 |
Health Canada |
0 | 46 | 0 | 0 | 0 | 0 | 46 |
Library and Archives Canada |
0 | 42 | 0 | 0 | 0 | 0 | 42 |
Canadian Space Agency |
0 | 15 | 0 | 0 | 0 | 0 | 15 |
Canadian Forces Morale and Welfare Services |
0 | 8 | 0 | 0 | 0 | 0 | 8 |
Shared Services Canada |
0 | 8 | 0 | 0 | 0 | 0 | 8 |
Innovation, Science and Economic Development Canada |
0 | 3 | 0 | 0 | 0 | 0 | 3 |
Polar Knowledge Canada |
0 | 2 | 0 | 0 | 0 | 0 | 2 |
Crown-Indigenous Relations and Northern Affairs Canada |
0 | 1 | 0 | 0 | 0 | 0 | 1 |
| Total | 2,035 | 13,397 | 3 | 1 | 1,496 | 2,026 | 18,957 |
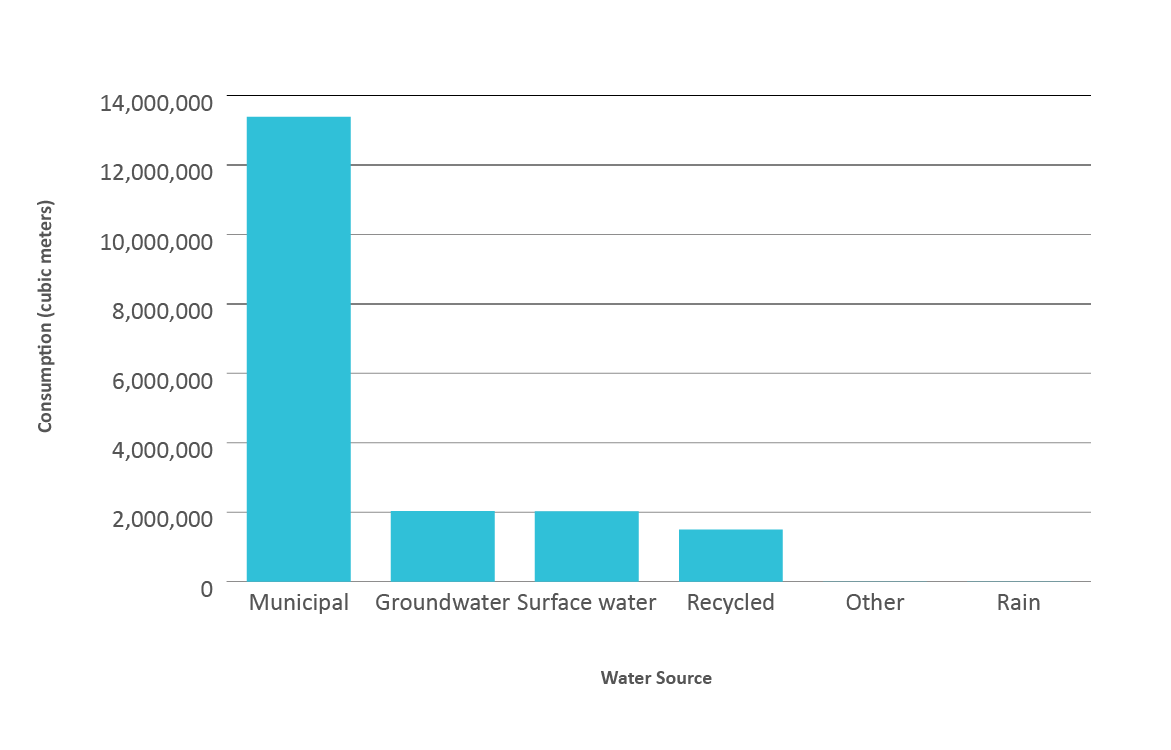
Figure 15 - Text version
The bar chart shows water consumption by water source for fiscal year 2023–24.
| Water source | Consumption (m3, thousands) | Percentage of total |
|---|---|---|
| Municipal | 13,397 | 71% |
| Groundwater | 2,035 | 11% |
| Surface water | 2,026 | 11% |
| Recycled | 1,496 | 8% |
| Other | 2.9 | Less than 1% |
| Rain | 1.0 | Less than 1% |

Figure 16 - Text version
The map of Canada shows the regional distribution of water consumption as a percentage of total consumption by jurisdiction in fiscal year 2023–24.
| Jurisdiction | Consumption (m3, thousands) | Percentage of total |
|---|---|---|
| Ontario | 7,923 | 42% |
| Quebec | 2,707 | 14% |
| Alberta | 2,352 | 12% |
| Nova Scotia | 1,742 | 9% |
| British Columbia | 1,283 | 7% |
| Manitoba | 814 | 4% |
| New Brunswick | 813 | 4% |
| Newfoundland and Labrador | 482 | 3% |
| Saskatchewan | 407 | 2% |
| Nunavut | 361 | 2% |
| Prince Edward Island | 39 | Less than 1% |
| Northwest Territories | 28 | Less than 1% |
| Yukon | 6 | Less than 1% |
| Canada | 18,957 | 100% |
Key results
- National Defence, Correctional Service Canada, and Public Services and Procurement Canada were the top three consumers of water, accounting for 88% of total consumption.
- Municipal water systems are the dominant source of water, providing 71% of the load.
- Ground and surface water are the next two largest sources, each providing 11% of the load. National Defence and the Correctional Service Canada are top consumers of water from these sources.
- 56% of consumption occurs in Ontario and Quebec, where most of the federal real property portfolio is located.
- The number of facilities reporting may increase as more buildings are metered for water consumption.