
Diversity and inclusion statistics
Static and interactive statistics on employment equity populations in Canada’s public service (core public administration) and information related to diversity as part of the Public Service Employee Survey can be found on this page.
To provide a better understanding of the unique workplace issues and experiences of employees, we are going beyond publishing overall representation to also publishing disaggregated data for three of the four employment equity designated groups. This will provide a more holistic picture of the people who comprise the public service. Exploring our data at a more granular level is the foundation to working towards a more representative, diverse, and inclusive public service.
Overall employment equity designated group representation
The table provides representation data for the four main employment equity designated groups (women, Indigenous Peoples, members of visible minorities and persons with disabilities), as well as the overall workforce availability estimates as a benchmark for each of the corresponding groups.
Representation by particular demographics
These tables provide the representation of each employment equity group (women, Indigenous Peoples, members of visible minorities, persons with disabilities) by particular demographics as a number and percentage.
Representation by department or agency
These tables provide representation of one specific employment equity group by department and agency along with the workforce availability estimates and the gap between the actual number of employees and the expected number of employees based on the benchmark.
Representation further disaggregated by disability type, indigenous or ethnic origins and particular demographics
These tables provide the representation of Indigenous Peoples, persons with disabilities and members of visible minorities in more detail (referred to as employment equity subgroups) based on how public servants self-identify beyond the main employment equity groups. The representation data is provided as a number and percentage.
Indigenous Peoples
- Department or agency
- Province or territory of work
- Occupational group
- Occupational category
- Salary range
- Age range
- Tenure
Note: Indigenous employees had a greater tendency to identify their subgroup as “other” rather than one of the specific subgroup categories. As a result, the disaggregated analysis for this designated group is more limited.
Persons with disabilities
- Department or agency
- Province or territory of work
- Occupational group
- Occupational category
- Salary range
- Age range
- Tenure
Note: Persons with disabilities had a greater tendency to identify their subgroup as “other” rather than one of the specific subgroup categories. As a result, the disaggregated analysis for this designated group is more limited.
Members of visible minorities
Employment Equity Demographic Snapshots New
These snapshots provide key employment equity demographics for Canada’s core public administration and supplements the annual reports on Employment Equity in the Public Service of Canada.
Core public administration statistics – interactive data visualization
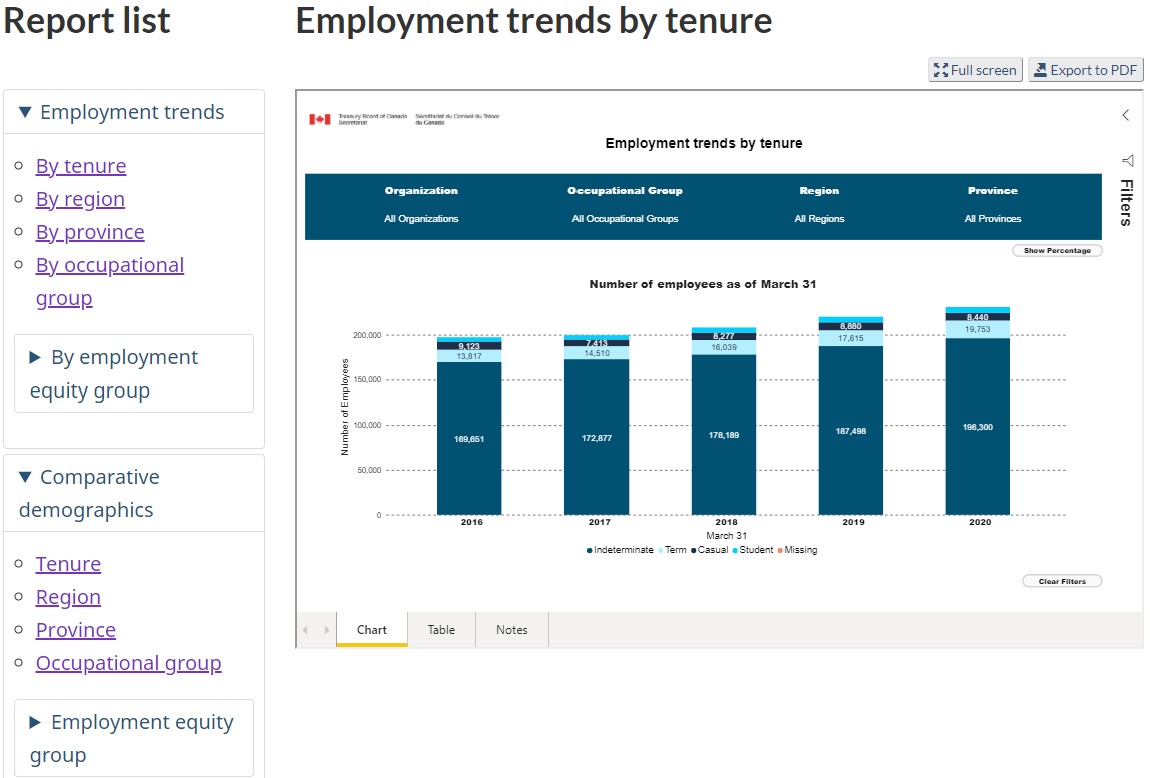
Explore and visualize core public service statistics through an interactive data visualization tool.
Find employment trends and comparative demographics by tenure, region, province, classification group and employment equity group.
Data on the public service excludes separate agencies.
Public Service Employee Survey
The Public Service Employee Survey (PSES) also provides data related to diversity and inclusion. The data tables contain a comparison of the PSES results between certain demographic groups and the rest of the public service.