
Employment Equity Demographic Snapshot 2023–2024
Preamble
This snapshot provides key employment equity demographics for Canada’s core public administration and supplements the Employment Equity in the Public Service of Canada for Fiscal Year 2023 to 2024 report.
The Office of the Chief Human Resources Officer (OCHRO) works in partnership with departments and agencies to collect, analyze, and share core public administration employment equity workforce data to identify current trends and gaps, with a focus on ensuring that the public service is diverse and inclusive and reflects the population it serves.
On this page
- About the data
- Employment equity representation in the core public administration
- Representation of executives
- Representation of women
- Representation of Indigenous Peoples
- Representation of persons with disabilities
- Representation of members of visible minorities
- Representation of Black employees
- Official languages of the core public administration and employment equity designated groups
- Hires into, promotions within and separations from the core public administration
- Annex 1: Statistical tables of employment equity data covered under section 21 of the Employment Equity Act
- Annex 2: Resources
About the data
Representation data
- Source: Treasury Board Secretariat (TBS) – Office of the Chief Human Resources Officer (OCHRO). Employment Equity Data Bank (EEDB) and Pay system as of March 31st, 2024, or as of March 31st of other specified years.
- Internal representation for Indigenous Peoples, persons with disabilities and members of visible minorities is based on those who have voluntarily chosen to self-identify in one of the respective employment equity designated groups, while sex information is taken from the Pay system.
- The data covers employees identified for the purpose of employment equity in the Regulations to the Employment Equity Act.
- The information includes indeterminates, terms of three months or more, and seasonal employees of organizations captured under the Financial Administration Act, Schedules I and IV (core public administration).
- Excluded from this information are: employees on leave without pay, terms less than three months, students and casual workers, Governor in Council appointees, Ministers’ exempt staff, federal judges and deputy ministers.
- The Law Management (LC) group has been included as part of the executive workforce.
- The sum of designated groups does not equal the total ("all employees") because employees may have chosen to self-identify in more than one designated group.
- Black employees are a subset of the members of visible minorities group.
- Official language information (language requirements of the position and linguistic status of incumbents) is from the Position and classification information system. Please note that because the Pay system is the source for the base population, the data shown here will not match that shown in the Official Languages Annual Report.
- "Hires" refer to employees who were added to the public service of Canada payroll between April 1 and March 31 of each given fiscal year.
- Data on "promotions" are obtained from the Public Service Commission of Canada and include information from departments and agencies that fall under both the Financial Administration Act, Schedules I and IV, and the Public Service Employment Act.
- "Separations" refer to employees who left the public service of Canada payroll between April 1 and March 31 of each given fiscal year. Please note that the data on "separations" includes employees who separated while on leave without pay.
Workforce availability (WFA)
- Workforce availability (WFA) estimates are used as a benchmark to assess the representativeness of employment equity designated groups within the core public administration in accordance with the Employment Equity Act.
- WFA estimates are based on information from the Census of Canada and the Canadian Survey on Disability.
- WFA estimates have been updated and since March 2022 include Canadian citizens and permanent residents in occupations in the Canadian workforce that correspond to occupations in the core public administration. Estimates prior to March 2022 only included Canadian citizens.
- The latest estimates of workforce availability are based on information from the 2021 Census of Canada and the 2022 Canadian Survey on Disability and include both Canadian citizens and permanent residents.
- The WFA estimate for executives for persons with disabilities is based on all Canadians due to the small sample size.
National labour market availability (LMA)
- The labour market availability (LMA) estimates are based on information from the 2021 Census of Canada and the 2022 Canadian Survey on Disability.
- LMA estimates include Canadian citizens and permanent residents.
- LMA estimates for executives for persons with disabilities are based on all Canadians due to the small sample size.
- Executive LMA is based on the combination of "senior managers" and "middle and other managers".
Note: Figures in square brackets represent the change since March 2023.
Employment equity representation in the core public administration
The Canadian public service aims to reflect the population it serves, from entry levels to senior leadership and across the various classification groups.
In the public service, four filters (citizenship/residency, classification, education and geography) are applied to the labour market availability (LMA) data to arrive at workforce availability (WFA), the employment equity benchmark used for the core public administration.
Table 1: Employment equity representation in the core public administration for all employees and executives – with workforce availability (WFA) and labour market availability (LMA)
| Employment equity designated group | Overall - representation | Overall - WFA | Overall - national LMA | Executives - representation | Executives - WFA | Executives – national LMA |
|---|---|---|---|---|---|---|
| Women | 56.9% | 55.3% | 48.3% | 55.1% | 42.2% | 39.2% |
| Indigenous Peoples | 5.3% | 4.1% | 4.3% | 5.5% | 3.9% | 3.0% |
| Persons with disabilities | 7.9% | 12.0% | 12.6% | 9.7% | 5.3% | 6.7% |
| Members of visible minorities | 22.9% | 22.7% | 24.9% | 16.4% | 15.8% | 20.6% |
|
Note: The latest estimates of workforce availability and labour market availability are based on information from the 2021 Census of Canada and the 2022 Canadian Survey on Disability. |
||||||
3 of the 4 employment equity designated groups are above the WFA: women, Indigenous Peoples and members of visible minorities.
At the executive level, all four employment equity designated groups are above the WFA.
Representation of women, Indigenous Peoples and persons with disabilities exceed the national LMA while representation of members of visible minorities is lower than the national LMA at both the overall and executive level.
Overall, employment equity representation of women, Indigenous Peoples, persons with disabilities and members of visible minorities across the public service has been improving, but there is much more work to be done.
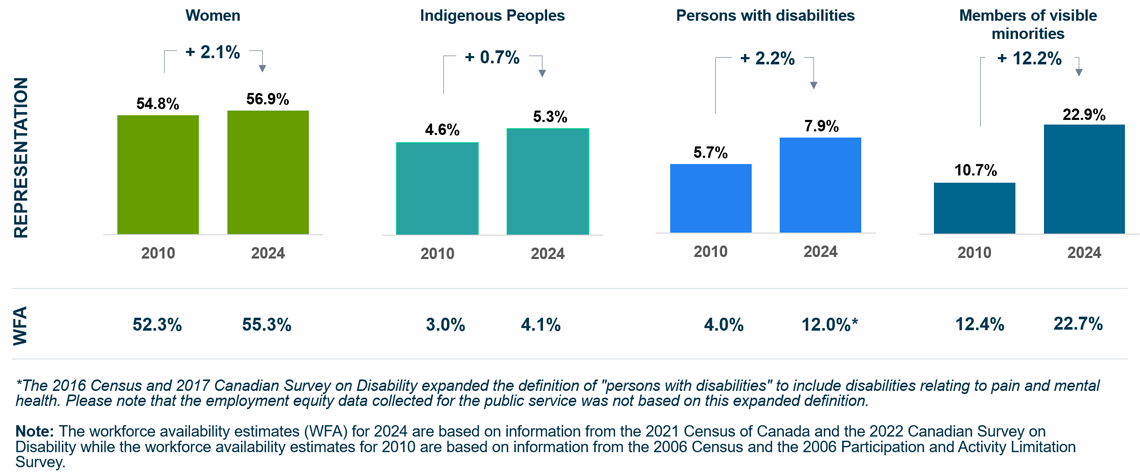
Figure 1 - Text version
| Employment equity designated group | Representation - 2010 | WFA - 2010 | Representation - 2024 | WFA - 2024 | Representation - change between 2010 and 2014 |
|---|---|---|---|---|---|
| Women | 54.8% | 52.3% | 56.9% | 55.3% | +2.1% |
| Indigenous Peoples | 4.6% | 3.0% | 5.3% | 4.1% | +0.7% |
| Persons with disabilities | 5.7% | 4.0% | 7.9% | 12.0%table 2 note * | +2.2% |
| Members of visible minorities | 10.7% | 12.4% | 22.9% | 22.7% | +12.2% |
Table 2 Notes
Note: The workforce availability estimates (WFA) for 2024 are based on information from the 2021 Census of Canada and the 2022 Canadian Survey on Disability while the workforce availability estimates for 2010 are based on information from the 2006 Census and the 2006 Participation and Activity Limitation Survey. |
|||||
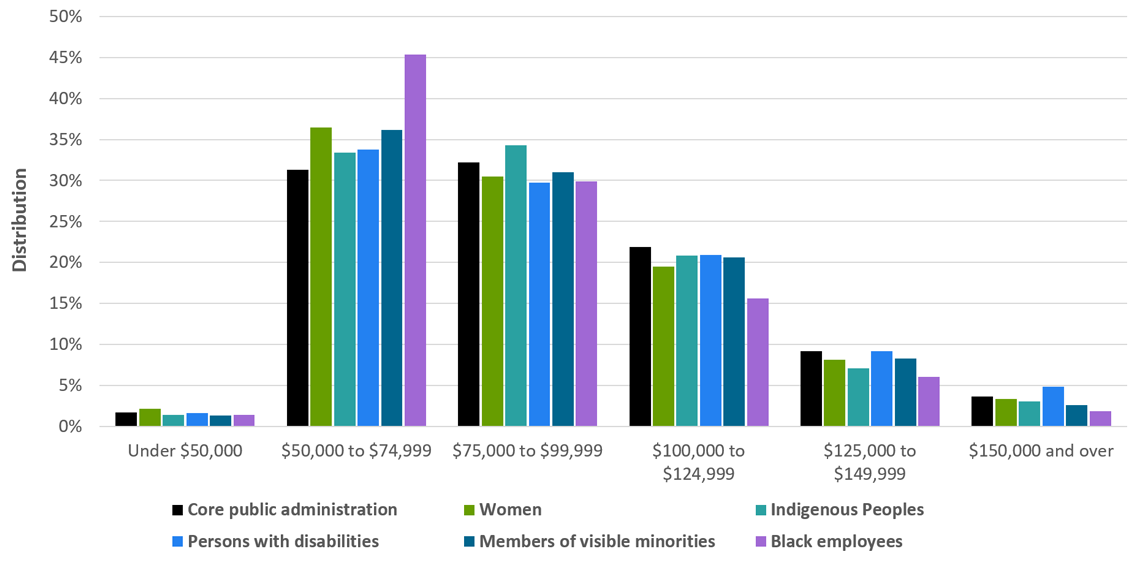
Figure 2 - Text version
| Salary range | Core public administration | Women | Indigenous Peoples | Persons with disabilities | Members of visible minorities | Black employees |
|---|---|---|---|---|---|---|
| Under $50,000 | 1.7% | 2.1% | 1.4% | 1.6% | 1.3% | 1.4% |
| $50,000 to $74,999 | 31.3% | 36.5% | 33.4% | 33.8% | 36.2% | 45.4% |
| $75,000 to $99,999 | 32.2% | 30.5% | 34.3% | 29.7% | 31.0% | 29.9% |
| $100,000 to $124,999 | 21.9% | 19.5% | 20.8% | 20.9% | 20.6% | 15.6% |
| $125,000 to $149,999 | 9.2% | 8.1% | 7.1% | 9.2% | 8.3% | 6.0% |
| $150,000 and over | 3.6% | 3.3% | 3.0% | 4.8% | 2.6% | 1.8% |
Representation of executives
Representation declines at the more senior ranks.
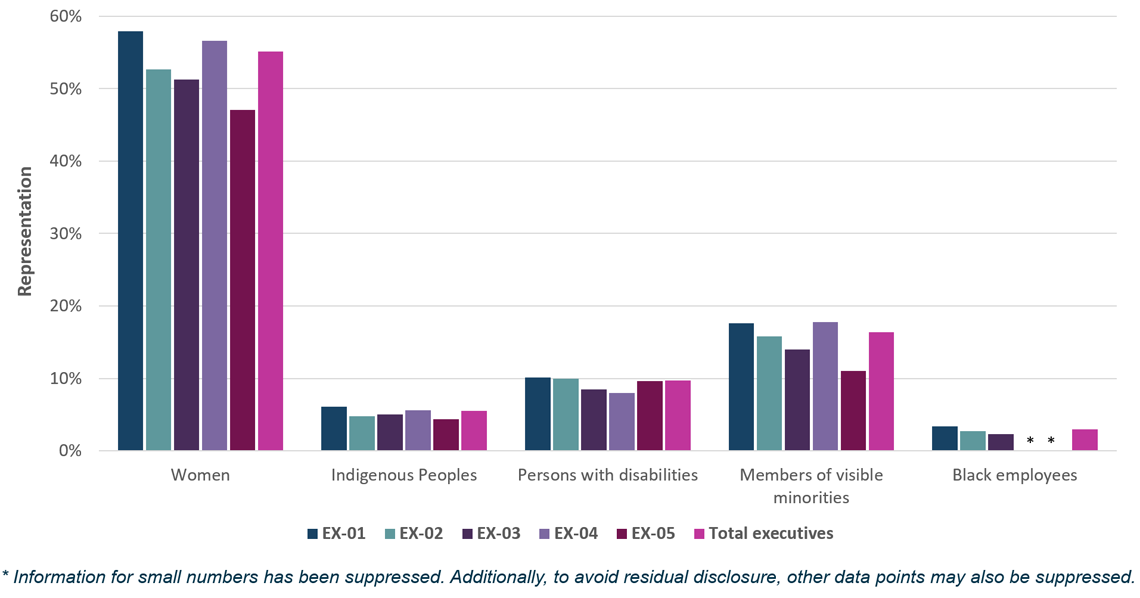
Figure 3 - Text version
| Employment equity designated group | EX-01 | EX-02 | EX-03 | EX-04 | EX-05 | Total executives |
|---|---|---|---|---|---|---|
| Women | 57.9% | 52.7% | 51.3% | 56.6% | 47.1% | 55.1% |
| Indigenous Peoples | 6.1% | 4.8% | 5.0% | 5.6% | 4.4% | 5.5% |
| Persons with disabilities | 10.1% | 10.0% | 8.5% | 8.0% | 9.6% | 9.7% |
| Members of visible minorities | 17.6% | 15.8% | 14.0% | 17.8% | 11.0% | 16.4% |
| Black employees | 3.4% | 2.7% | 2.3% | table 4 note * | table 4 note * | 3.0% |
Table 4 Notes
|
||||||
Representation of women
- 56.9% of employees in the core public administration are women, which is above the workforce availability estimate of 55.3%.
- 55.1% of executives are women (above the WFA of 42.2%).
- 13.7% of women are 20 to 29 years of age.
- 28.7% of women are 50 to 69 years of age.
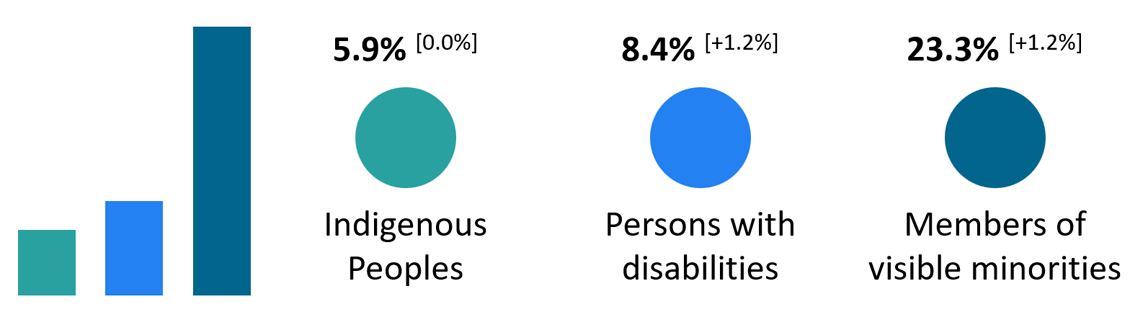
Figure 4 - Text version
Of the employees who are women:
- 5.9% self-identified as Indigenous Peoples [unchanged]
- 8.4% self-identified as persons with disabilities [increase of 1.2 percentage points]
- 23.3% self-identified as members of visible minorities [increase of 1.2 percentage points]
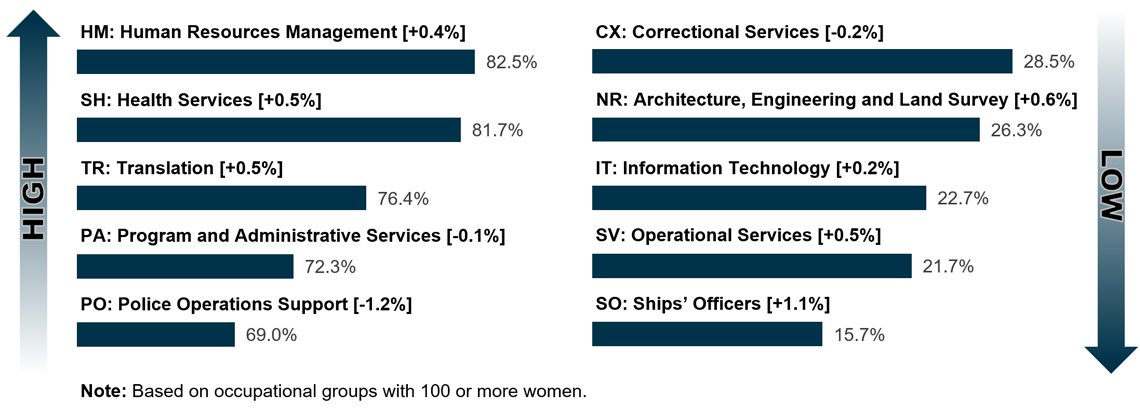
Figure 5 - Text version
Highest proportion of women
- HM: Human Resources Management: 82.5% [increase of 0.4 percentage points]
- SH: Health Services: 81.7% [increase of 0.5 percentage points]
- TR: Translation: 76.4% [increase of 0.5 percentage points]
- PA: Program and Administrative Services: 72.3% [decrease of 0.1 percentage points]
- PO: Police Operations Support: 69.0% [decrease of 1.2 percentage points]
Lowest proportion of women
- CX: Correctional Services: 28.5% [decrease of 0.2 percentage points]
- NR: Architecture, Engineering and Land Survey: 26.3% [increase of 0.6 percentage points]
- IT: Information Technology: 22.7% [increase of 0.2 percentage points]
- SV: Operational Services: 21.7% [increase of 0.5 percentage points]
- SO: Ships’ Officers: 15.7% [increase of 1.1 percentage points]
Note: Based on occupational groups with 100 or more women.
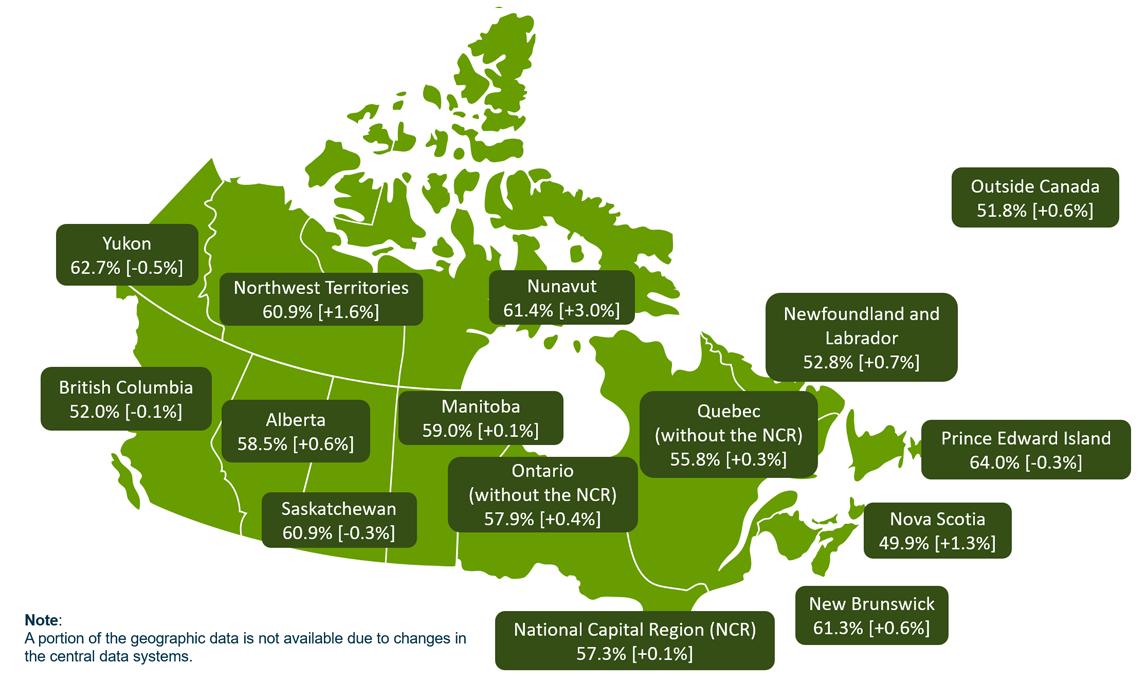
Figure 6 - Text version
- Newfoundland and Labrador: 52.8% [increase of 0.7 percentage points]
- Prince Edward Island: 64.0% [decrease of 0.3 percentage points]
- Nova Scotia: 49.9% [increase of 1.3 percentage points]
- New Brunswick: 61.3% [increase of 0.6 percentage points]
- Quebec (without the NCR): 55.8% [increase of 0.3 percentage points]
- National Capital Region (NCR): 57.3% [increase of 0.1 percentage points]
- Ontario (without the NCR): 57.9% [increase of 0.4 percentage points]
- Manitoba: 59.0% [increase of 0.1 percentage points]
- Saskatchewan: 60.9% [decrease of 0.3 percentage points]
- Alberta: 58.5% [increase of 0.6 percentage points]
- British Columbia: 52.0% [decrease of 0.1 percentage points]
- Yukon: 62.7% [decrease of 0.5 percentage points]
- Northwest Territories: 60.9% [increase of 1.6 percentage points]
- Nunavut: 61.4% [increase of 3.0 percentage points]
- Outside Canada: 51.8% [increase of 0.6 percentage points]
Note: A portion of the geographic data is not available due to changes in the central data systems.
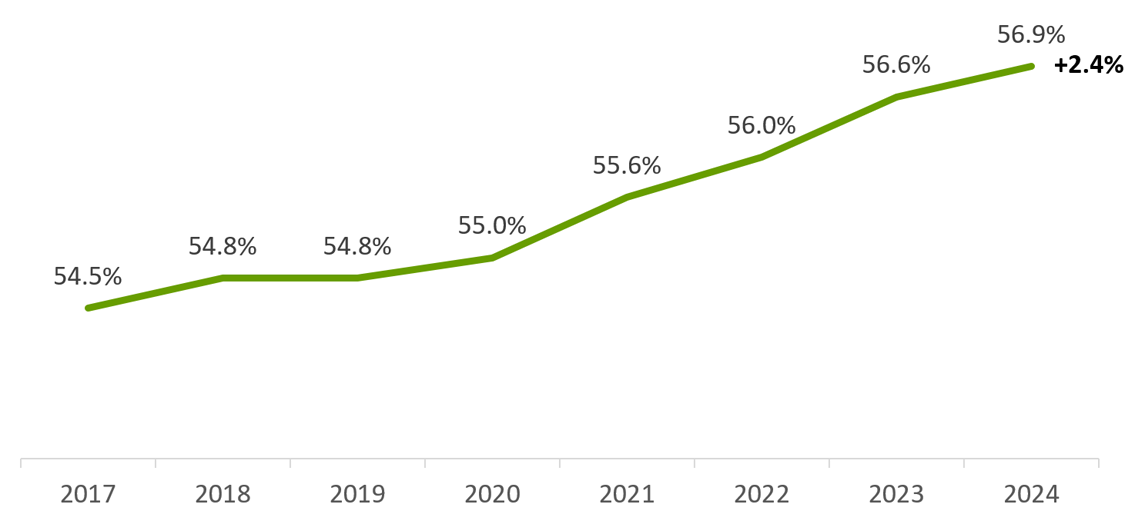
Figure 7 - Text version
| Year | Percentage |
|---|---|
| 2017 | 54.5% |
| 2018 | 54.8% |
| 2019 | 54.8% |
| 2020 | 55.0% |
| 2021 | 55.6% |
| 2022 | 56.0% |
| 2023 | 56.6% |
| 2024 | 56.9% |
The representation of women increased by 2.4 percentage points between March 2017 and March 2024.
Table 2: Representation trends for women – number
| Year | Number |
|---|---|
| 2017 | 101,136 |
| 2018 | 105,465 |
| 2019 | 111,332 |
| 2020 | 117,760 |
| 2021 | 127,043 |
| 2022 | 132,299 |
| 2023 | 143,406 |
| 2024 | 151,607 |

Figure 8 - Text version
| Group | Under $50,000 | $50,000 to $74,999 | $75,000 to $99,999 | $100,000 to $124,999 | $125,000 to $149,999 | $150,000 and over |
|---|---|---|---|---|---|---|
| Core public administration | 1.7% | 31.3% | 32.2% | 21.9% | 9.2% | 3.6% |
| Women | 2.1% | 36.5% | 30.5% | 19.5% | 8.1% | 3.3% |
Representation of Indigenous Peoples
- 5.3% of employees in the core public administration have self-identified as Indigenous Peoples, which is above the workforce availability estimate of 4.1%.
- 5.5% of executives are Indigenous Peoples (above the WFA of 3.9%).
- 11.3% of Indigenous Peoples are 20 to 29 years of age.
- 34.4% of Indigenous Peoples are 50 to 69 years of age.
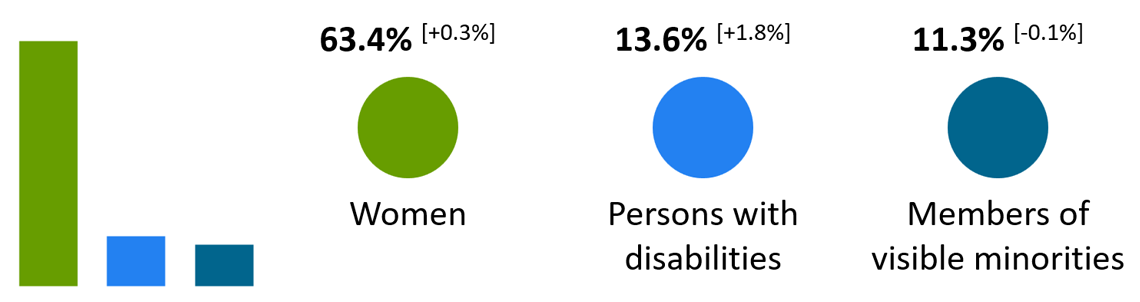
Figure 9 - Text version
Of the employees who self-identified as Indigenous:
- 63.4% are women [increase of 0.3 percentage points]
- 13.6% self-identified as persons with disabilities [increase of 1.8 percentage points]
- 11.3% self-identified as members of visible minorities [decrease of 0.1 percentage points]
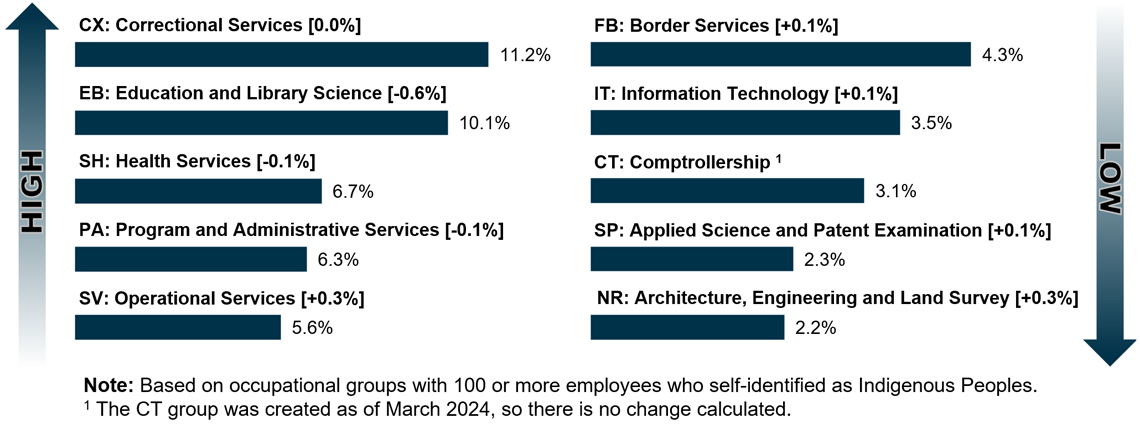
Figure 10 - Text version
Highest proportion of Indigenous Peoples
- CX: Correctional Services: 11.2% [unchanged]
- EB: Education and Library Science: 10.1% [decrease of 0.6 percentage points]
- SH: Health Services: 6.7% [decrease of 0.1 percentage points]
- PA: Program and Administrative Services: 6.3% [decrease of 0.1 percentage points]
- SV: Operational Services: 5.6% [increase of 0.3 percentage points]
Lowest proportion of Indigenous Peoples
- FB: Border Services: 4.3% [increase of 0.1 percentage points]
- IT: Information Technology: 3.5% [increase of 0.1 percentage points]
- CT: Comptrollership: 3.1%Figure 10 Footnote 1
- SP: Applied Science and Patent Examination: 2.3% [increase of 0.1 percentage points]
- NR: Architecture, Engineering and Land Survey: 2.2% [increase of 0.3 percentage points]
Note: Based on occupational groups with 100 or more employees who self-identified as Indigenous Peoples.
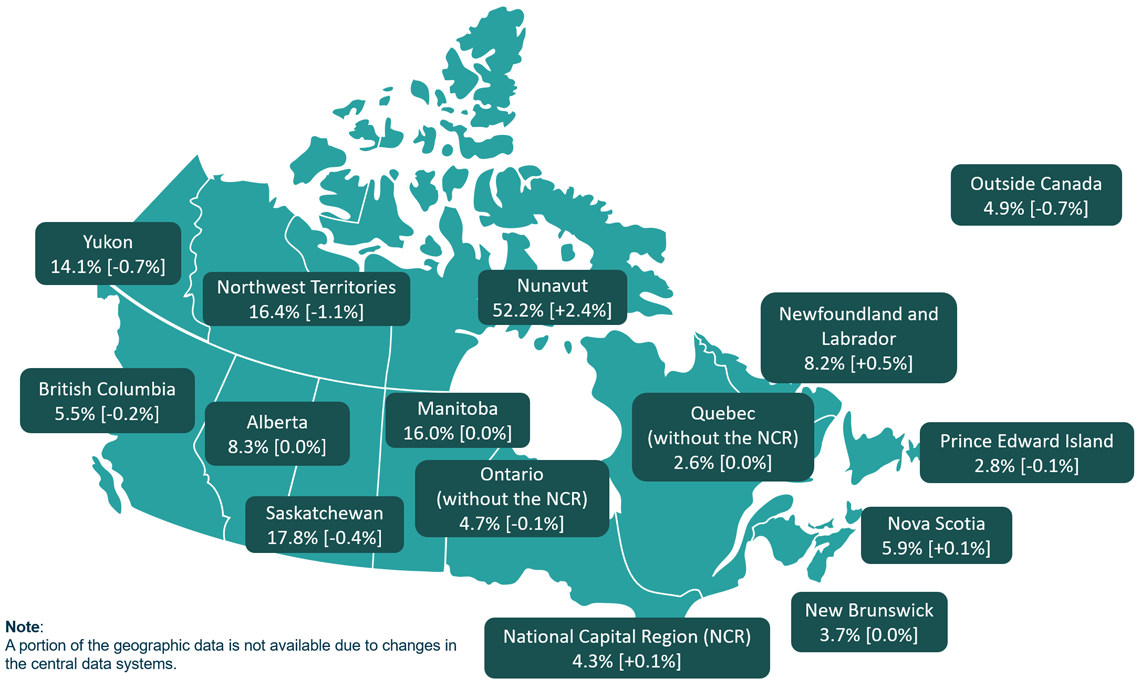
Figure 11 - Text version
- Newfoundland and Labrador: 8.2% [increase of 0.5 percentage points]
- Prince Edward Island: 2.8% [decrease of 0.1 percentage points]
- Nova Scotia: 5.9% [increase of 0.1 percentage points]
- New Brunswick: 3.7% [unchanged]
- Quebec (without the NCR): 2.6% [unchanged]
- National Capital Region (NCR): 4.3% [increase of 0.1 percentage points]
- Ontario (without the NCR): 4.7% [decrease of 0.1 percentage points]
- Manitoba: 16.0% [unchanged]
- Saskatchewan: 17.8% [decrease of 0.4 percentage points]
- Alberta: 8.3% [unchanged]
- British Columbia: 5.5% [decrease of 0.2 percentage points]
- Yukon: 14.1% [decrease of 0.7 percentage points]
- Northwest Territories: 16.4% [decrease of 1.1 percentage points]
- Nunavut: 52.2% [increase of 2.4 percentage points]
- Outside Canada: 4.9% [decrease of 0.7 percentage points]
Note: A portion of the geographic data is not available due to changes in the central data systems.
Table 3: Representation of Indigenous Peoples by subgroup – overall and executives
| Subgroup | Overall - number | Overall - percentage | Executives - number | Executives - percentage |
|---|---|---|---|---|
| Inuit | 441 | 0.2% | 8 | 0.1% |
| Métis | 6,083 | 2.3% | 177 | 2.3% |
| First Nations | 5,947 | 2.2% | 197 | 2.5% |
| Other | 1,681 | 0.6% | 46 | 0.6% |
| Total | 14,152 | 5.3% | 428 | 5.5% |
|
Note: The Self-ID form provided to departments by TBS did not ask about Indigenous subgroups until 2002. Some departments still do not collect this data and submit only a yes/no count for Indigenous identity as they have no obligation to do more than this under the Employment Equity Act. These responses are coded “Indigenous – Other”. |
||||

Figure 12 - Text version
| Subgroup | Overall | Executives |
|---|---|---|
| Inuit | 3.1% | 1.9% |
| Métis | 43.0% | 41.4% |
| First Nations | 42.0% | 46.0% |
| Other | 11.9% | 10.7% |
|
Note: The Self-ID form provided to departments by TBS did not ask about Indigenous subgroups until 2002. Some departments still do not collect this data and submit only a yes/no count for Indigenous identity as they have no obligation to do more than this under the Employment Equity Act. These responses are coded “Indigenous – Other”. |
||
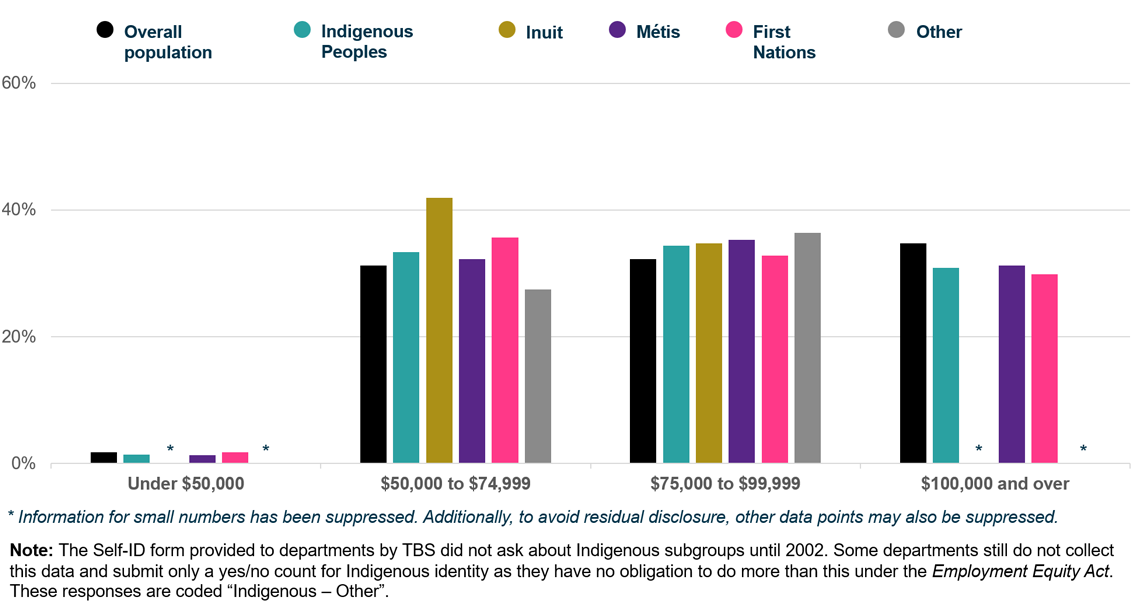
Figure 13 - Text version
| Group | Under $50,000 | $50,000 to $74,999 | $75,000 to $99,999 | $100,000 and over |
|---|---|---|---|---|
| Overall population | 1.7% | 31.3% | 32.2% | 34.8% |
| Indigenous Peoples | 1.4% | 33.4% | 34.3% | 30.9% |
| Inuit | table 10 note * | 42.0% | 34.7% | table 10 note * |
| Métis | 1.3% | 32.2% | 35.2% | 31.2% |
| First Nations | 1.7% | 35.6% | 32.8% | 29.8% |
| Other | table 10 note * | 27.5% | 36.3% | table 10 note * |
Table 10 Notes
Note: The Self-ID form provided to departments by TBS did not ask about Indigenous subgroups until 2002. Some departments still do not collect this data and submit only a yes/no count for Indigenous identity as they have no obligation to do more than this under the Employment Equity Act. These responses are coded “Indigenous – Other”. |
||||
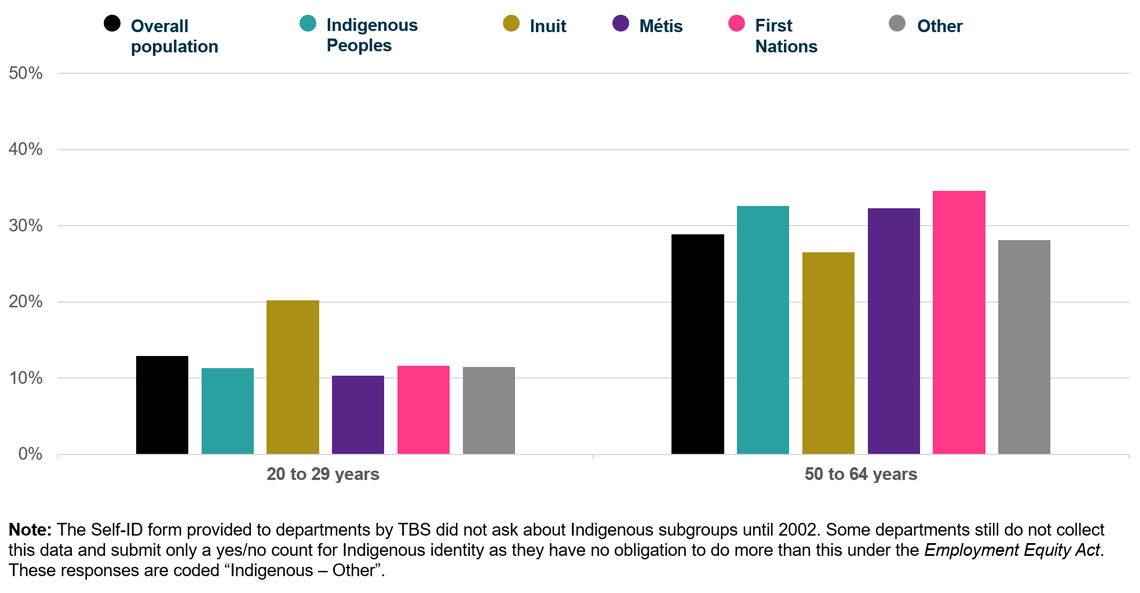
Figure 14 - Text version
| Group | 20 to 29 years | 50 to 64 years | ||
|---|---|---|---|---|
| Overall population | 12.9% | 28.9% | ||
| Indigenous Peoples | 11.3% | 32.6% | ||
| Inuit | 20.2% | 26.5% | ||
| Métis | 10.3% | 32.3% | ||
| First Nations | 11.6% | 34.6% | ||
| Other | 11.5% | 28.1% | ||
|
Note: The Self-ID form provided to departments by TBS did not ask about Indigenous subgroups until 2002. Some departments still do not collect this data and submit only a yes/no count for Indigenous identity as they have no obligation to do more than this under the Employment Equity Act. These responses are coded “Indigenous – Other”. |
||||
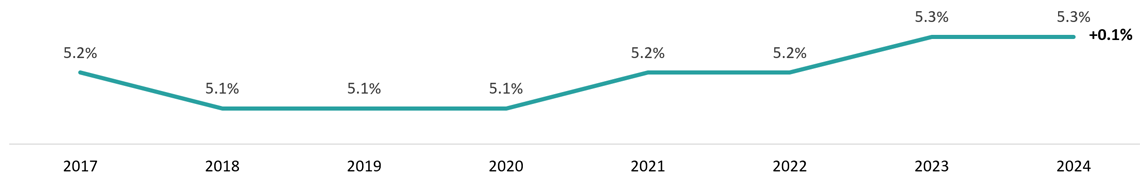
Figure 15 - Text version
| Year | Percentage |
|---|---|
| 2017 | 5.2% |
| 2018 | 5.1% |
| 2019 | 5.1% |
| 2020 | 5.1% |
| 2021 | 5.2% |
| 2022 | 5.2% |
| 2023 | 5.3% |
| 2024 | 5.3% |
The representation of Indigenous Peoples increased by 0.1 percentage points between March 2017 and March 2024.
Table 4: Representation trends for Indigenous Peoples by subgroup – number
| Subgroup | 2017 | 2018 | 2019 | 2020 | 2021 | 2022 | 2023 | 2024 |
|---|---|---|---|---|---|---|---|---|
| Inuit | 236 | 247 | 279 | 298 | 357 | 361 | 404 | 441 |
| Métis | 4,166 | 4,253 | 4,491 | 4,585 | 5,026 | 5,260 | 5,735 | 6,083 |
| First Nations | 4,160 | 4,008 | 4,164 | 4,399 | 4,984 | 5,128 | 5,566 | 5,947 |
| Other | 1,164 | 1,368 | 1,501 | 1,606 | 1,610 | 1,587 | 1,658 | 1,681 |
| Total | 9,726 | 9,876 | 10,435 | 10,888 | 11,977 | 12,336 | 13,363 | 14,152 |
|
Note: The Self-ID form provided to departments by TBS did not ask about Indigenous subgroups until 2002. Some departments still do not collect this data and submit only a yes/no count for Indigenous identity as they have no obligation to do more than this under the Employment Equity Act. These responses are coded “Indigenous – Other”. |
||||||||
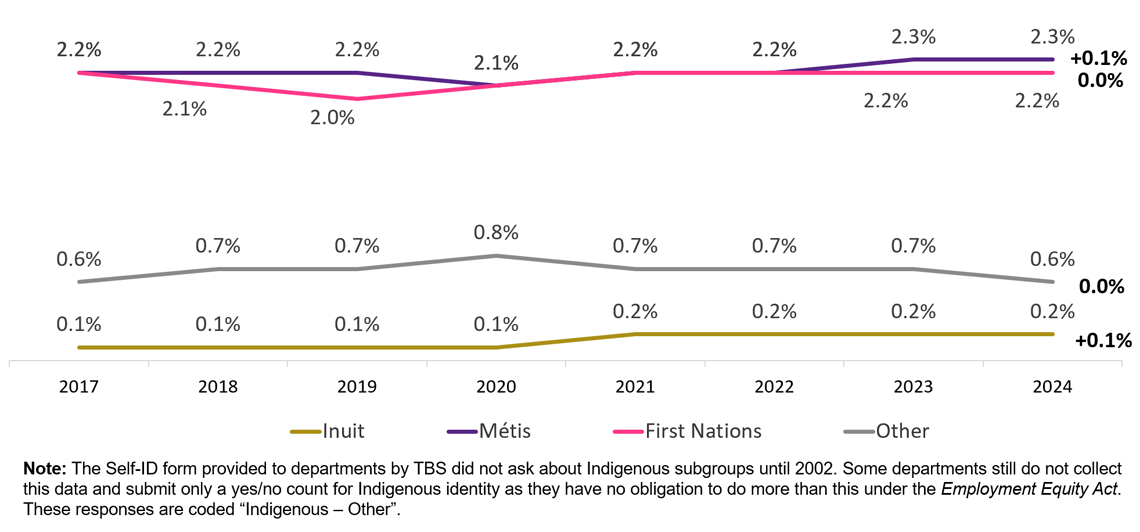
Figure 16 - Text version
| Subgroup | 2017 | 2018 | 2019 | 2020 | 2021 | 2022 | 2023 | 2024 | Change between 2017 and 2024 |
|---|---|---|---|---|---|---|---|---|---|
| Inuit | 0.1% | 0.1% | 0.1% | 0.1% | 0.2% | 0.2% | 0.2% | 0.2% | +0.1% |
| Métis | 2.2% | 2.2% | 2.2% | 2.1% | 2.2% | 2.2% | 2.3% | 2.3% | +0.1% |
| First Nations | 2.2% | 2.1% | 2.0% | 2.1% | 2.2% | 2.2% | 2.2% | 2.2% | 0.0% |
| Other | 0.6% | 0.7% | 0.7% | 0.8% | 0.7% | 0.7% | 0.7% | 0.6% | 0.0% |
|
Note: The Self-ID form provided to departments by TBS did not ask about Indigenous subgroups until 2002. Some departments still do not collect this data and submit only a yes/no count for Indigenous identity as they have no obligation to do more than this under the Employment Equity Act. These responses are coded “Indigenous – Other”. |
|||||||||
Representation of persons with disabilities
- 7.9% of employees in the core public administration have self-identified as persons with disabilities, which is below the workforce availability estimate of 12.0%.
- 9.7 % of executives are persons with disabilities (above the WFA of 5.3%).
- 12.6% of persons with disabilities are 20 to 29 years of age.
- 35.1% of persons with disabilities are 50 to 69 years of age.
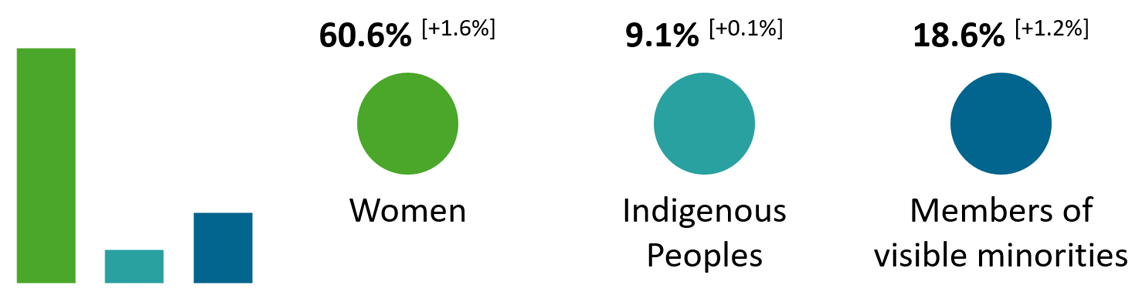
Figure 17 - Text version
Of the employees who self-identified as persons with disabilities:
- 60.6% are women [increase of 1.6 percentage points]
- 9.1% self-identified as Indigenous Peoples [increase of 0.1 percentage points]
- 18.6% self-identified as members of visible minorities [increase of 1.2 percentage points]
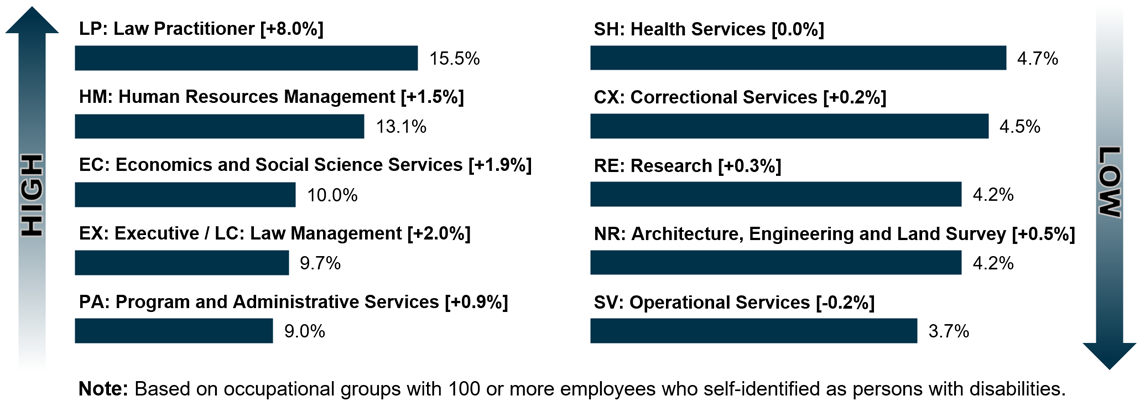
Figure 18 - Text version
Highest proportion of persons with disabilities
- LP: Law Practitioner: 15.5% [increase of 8.0 percentage points]
- HM: Human Resources Management:13.1% [increase of 1.5 percentage points]
- EC: Economics and Social Science Services: 10.0% [increase of 1.9 percentage points]
- EX: Executive / LC: Law Management: 9.7% [increase of 2.0 percentage points]
- PA: Program and Administrative Services: 9.0% [increase of 0.9 percentage points]
Lowest proportion of persons with disabilities
- SH: Health Services: 4.7% [unchanged]
- CX: Correctional Services: 4.5% [increase of 0.2 percentage points]
- RE: Research: 4.2% [increase of 0.3 percentage points]
- NR: Architecture, Engineering and Land Survey: 4.2% [increase of 0.5 percentage points]
- SV: Operational Services: 3.7% [decrease of 0.2 percentage points]
Note: Based on occupational groups with 100 or more employees who self-identified as persons with disabilities.

Figure 19 - Text version
- Newfoundland and Labrador: 8.4% [increase of 1.6 percentage points]
- Prince Edward Island: 9.4% [increase of 1.4 percentage points]
- Nova Scotia: 9.3% [increase of 1.0 percentage points]
- New Brunswick: 7.2% [increase of 1.1 percentage points]
- Quebec (without the NCR): 5.6% [increase of 0.7 percentage points]
- National Capital Region (NCR): 8.8% [increase of 1.3 percentage points]
- Ontario (without the NCR): 7.4% [increase of 0.6 percentage points]
- Manitoba: 8.2% [increase of 1.2 percentage points]
- Saskatchewan: 7.2% [increase of 0.6 percentage points]
- Alberta: 8.0% [increase of 0.7 percentage points]
- British Columbia: 6.5% [increase of 0.8 percentage points]
- Yukon: 5.9% [decrease of 1.4 percentage points]
- Northwest Territories: 5.7% [increase of 1.2 percentage points]
- Nunavut: 4.1% [decrease of 0.7 percentage points]
- Outside Canada: 3.7% [increase of 0.5 percentage points]
Note: A portion of the geographic data is not available due to changes in the central data systems.
Table 5: Representation of persons with disabilities by subgroup – overall and executives
| Subgroup | Overall – number | Overall – percentage | Executives – number | Executives - percentage |
|---|---|---|---|---|
| Coordination and dexterity | 1,388 | 0.5% | 55 | 0.7% |
| Mobility | 2,912 | 1.1% | 80 | 1.0% |
| Speech impairment | 412 | 0.2% | 20 | 0.3% |
| Blind or visual impairment | 1,341 | 0.5% | 79 | 1.0% |
| Deaf or hard of hearing | 2,303 | 0.9% | 114 | 1.5% |
| Other disability | 15,642 | 5.9% | 491 | 6.3% |
| Total | 21,089 | 7.9% | 751 | 9.7% |
|
Note: The sum of disability subgroups does not match the disability total as one person can have multiple disabilities. |
||||
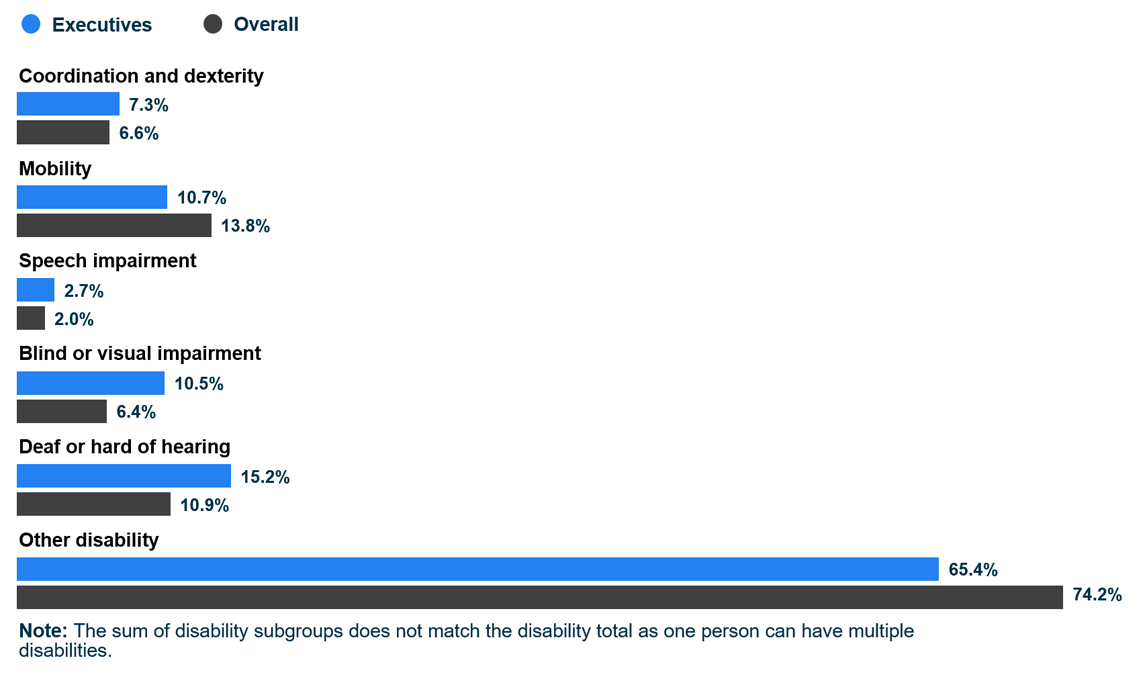
Figure 20 - Text version
| Subgroup | Overall | Executives |
|---|---|---|
| Coordination and dexterity | 6.6% | 7.3% |
| Mobility | 13.8% | 10.7% |
| Speech impairment | 2.0% | 2.7% |
| Blind or visual impairment | 6.4% | 10.5% |
| Deaf or hard of hearing | 10.9% | 15.2% |
| Other disability | 74.2% | 65.4% |
|
Note: The sum of disability subgroups does not match the disability total as one person can have multiple disabilities. |
||
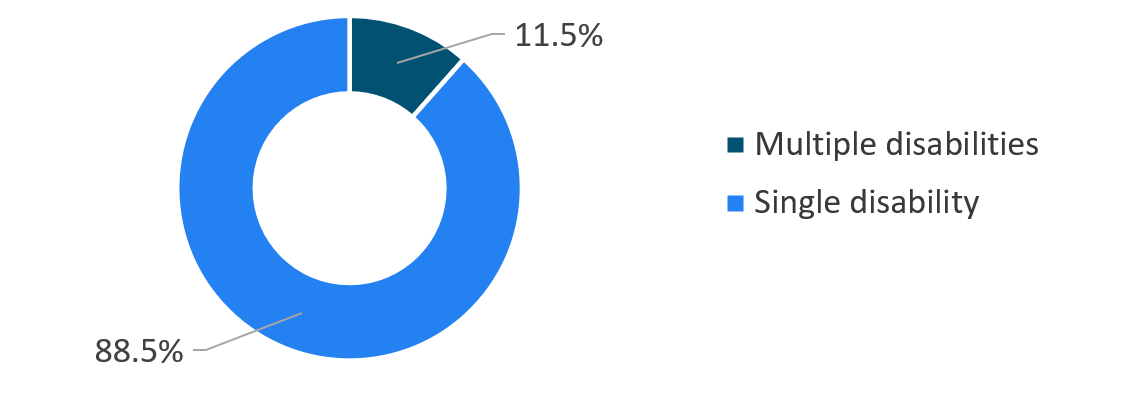
Figure 21 - Text version
| Single or multiple disabilities | Percentage |
|---|---|
| Multiple disabilities | 11.5% |
| Single disability | 88.5% |
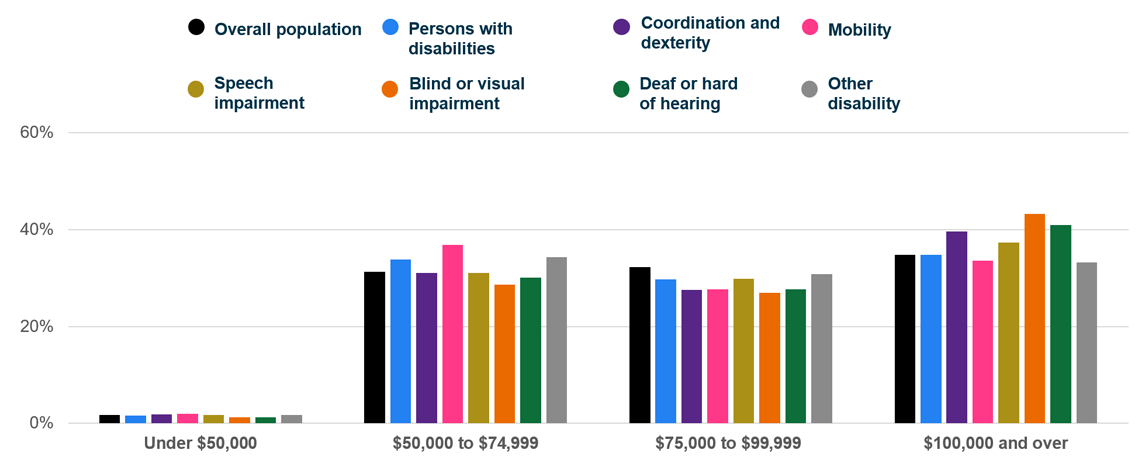
Figure 22 - Text version
| Group | Under $50,000 | $50,000 to $74,999 | $75,000 to $99,999 | $100,000 and over |
|---|---|---|---|---|
| Overall population | 1.7% | 31.3% | 32.2% | 34.8% |
| Persons with disabilities | 1.6% | 33.8% | 29.7% | 34.8% |
| Coordination and dexterity | 1.9% | 31.1% | 27.5% | 39.6% |
| Mobility | 1.9% | 36.8% | 27.7% | 33.6% |
| Speech impairment | 1.7% | 31.1% | 29.9% | 37.4% |
| Blind or visual impairment | 1.3% | 28.6% | 26.9% | 43.2% |
| Deaf or hard of hearing | 1.3% | 30.1% | 27.7% | 40.9% |
| Other disability | 1.8% | 34.3% | 30.8% | 33.2% |
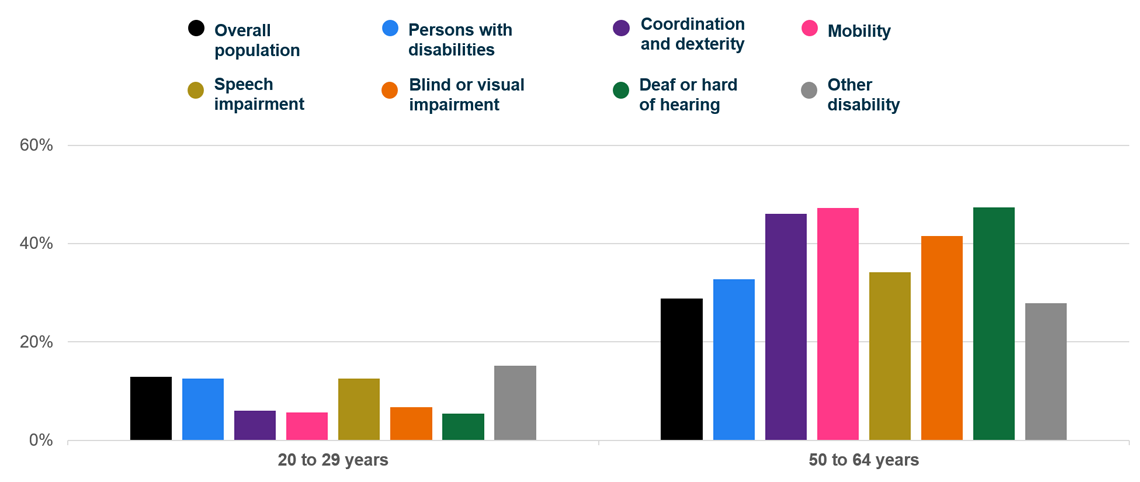
Figure 23 - Text version
| Group | 20 to 29 years | 50 to 64 years |
|---|---|---|
| Overall population | 12.9% | 28.9% |
| Persons with disabilities | 12.6% | 32.8% |
| Coordination and dexterity | 6.0% | 46.0% |
| Mobility | 5.7% | 47.3% |
| Speech impairment | 12.6% | 34.2% |
| Blind or visual impairment | 6.8% | 41.5% |
| Deaf or hard of hearing | 5.5% | 47.5% |
| Other disability | 15.1% | 27.9% |
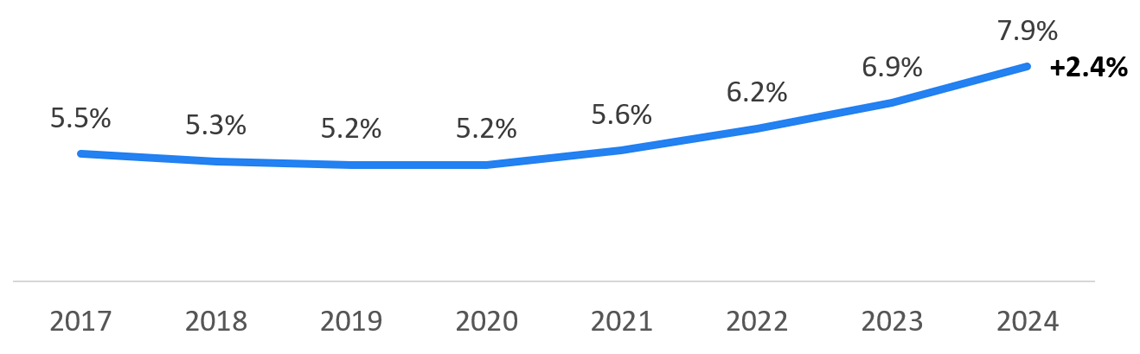
Figure 24 - Text version
| Year | Percentage |
|---|---|
| 2017 | 5.5% |
| 2018 | 5.3% |
| 2019 | 5.2% |
| 2020 | 5.2% |
| 2021 | 5.6% |
| 2022 | 6.2% |
| 2023 | 6.9% |
| 2024 | 7.9% |
The representation of persons with disabilities increased by 2.4 percentage points between March 2017 and March 2024.
Table 6: Representation trends for persons with disabilities by subgroup – number
| Subgroup | 2017 | 2018 | 2019 | 2020 | 2021 | 2022 | 2023 | 2024 |
|---|---|---|---|---|---|---|---|---|
| Coordination and dexterity | 1,008 | 934 | 930 | 926 | 1,094 | 1,164 | 1,257 | 1,388 |
| Mobility | 1,840 | 1,746 | 1,737 | 1,741 | 2,186 | 2,307 | 2,588 | 2,912 |
| Speech impairment | 224 | 215 | 224 | 235 | 276 | 323 | 349 | 412 |
| Blind or visual impairment | 824 | 770 | 767 | 783 | 951 | 1,042 | 1,160 | 1,341 |
| Deaf or hard of hearing | 1,616 | 1,548 | 1,549 | 1,563 | 1,786 | 1,912 | 2,098 | 2,303 |
| Other disability | 5,656 | 5,778 | 6,245 | 6,715 | 8,339 | 9,874 | 12,370 | 15,642 |
| Total | 10,259 | 10,181 | 10,622 | 11,087 | 12,893 | 14,573 | 17,410 | 21,089 |
|
Note: The sum of disability subgroups does not match the disability total as one person can have multiple disabilities. |
||||||||
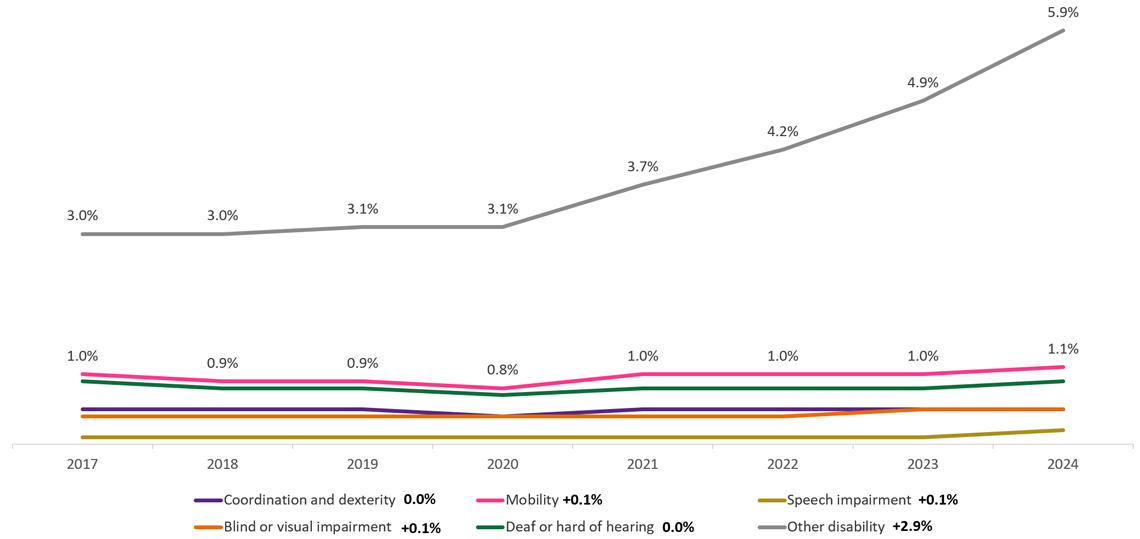
Figure 25 - Text version
| Subgroup | 2017 | 2018 | 2019 | 2020 | 2021 | 2022 | 2023 | 2024 | Change between 2017 and 2024 |
|---|---|---|---|---|---|---|---|---|---|
| Coordination and dexterity | 0.5% | 0.5% | 0.5% | 0.4% | 0.5% | 0.5% | 0.5% | 0.5% | 0.0% |
| Mobility | 1.0% | 0.9% | 0.9% | 0.8% | 1.0% | 1.0% | 1.0% | 1.1% | +0.1% |
| Speech impairment | 0.1% | 0.1% | 0.1% | 0.1% | 0.1% | 0.1% | 0.1% | 0.2% | +0.1% |
| Blind or visual impairment | 0.4% | 0.4% | 0.4% | 0.4% | 0.4% | 0.4% | 0.5% | 0.5% | +0.1% |
| Deaf or hard of hearing | 0.9% | 0.8% | 0.8% | 0.7% | 0.8% | 0.8% | 0.8% | 0.9% | 0.0% |
| Other disability | 3.0% | 3.0% | 3.1% | 3.1% | 3.7% | 4.2% | 4.9% | 5.9% | +2.9% |
Representation of members of visible minorities
- 22.9% of employees in the core public administration have self-identified as members of visible minorities, which is above the workforce availability estimate of 22.7%.
- 16.4% of executives are members of visible minorities (above the WFA of 15.8%).
- 16.9% of members of visible minorities are 20 to 29 years of age.
- 24.4% of members of visible minorities are 50 to 69 years of age.

Figure 26 - Text version
Of the employees who self-identified as members of visible minorities:
- 57.8% are women [increase of 0.2 percentage points]
- 2.6% self-identified as Indigenous Peoples [decrease of 0.2 percentage points]
- 6.4% self-identified as persons with disabilities [increase of 0.9 percentage points]
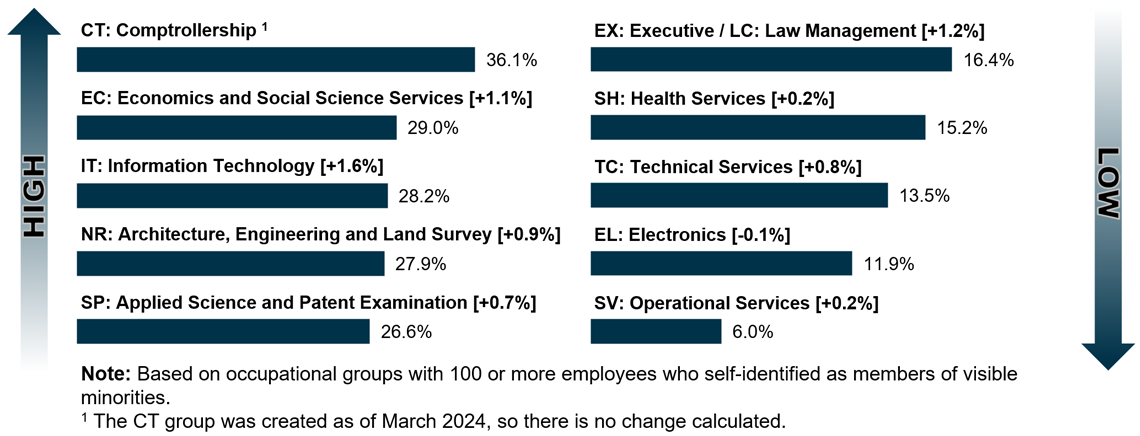
Figure 27 - Text version
Highest proportion of members of visible minorities
- CT: Comptrollership: 36.1%figure 27 note 1
- EC: Economics and Social Science Services: 29.0% [increase of 1.1 percentage points]
- IT: Information Technology: 28.2% [increase of 1.6 percentage points]
- NR: Architecture, Engineering and Land Survey: 27.9% [increase of 0.9 percentage points]
- SP: Applied Science and Patent Examination: 26.6% [increase of 0.7 percentage points]
Lowest proportion of members of visible minorities
- EX: Executive / LC: Law Management: 16.4% [increase of 1.2 percentage points]
- SH: Health Services: 15.2% [increase of 0.2 percentage points]
- TC: Technical Services: 13.5% [increase of 0.8 percentage points]
- EL: Electronics: 11.9% [decrease of 0.1 percentage points]
- SV: Operational Services: 6.0% [increase of 0.2 percentage points]
Note: Based on occupational groups with 100 or more employees who self-identified as members of visible minorities.
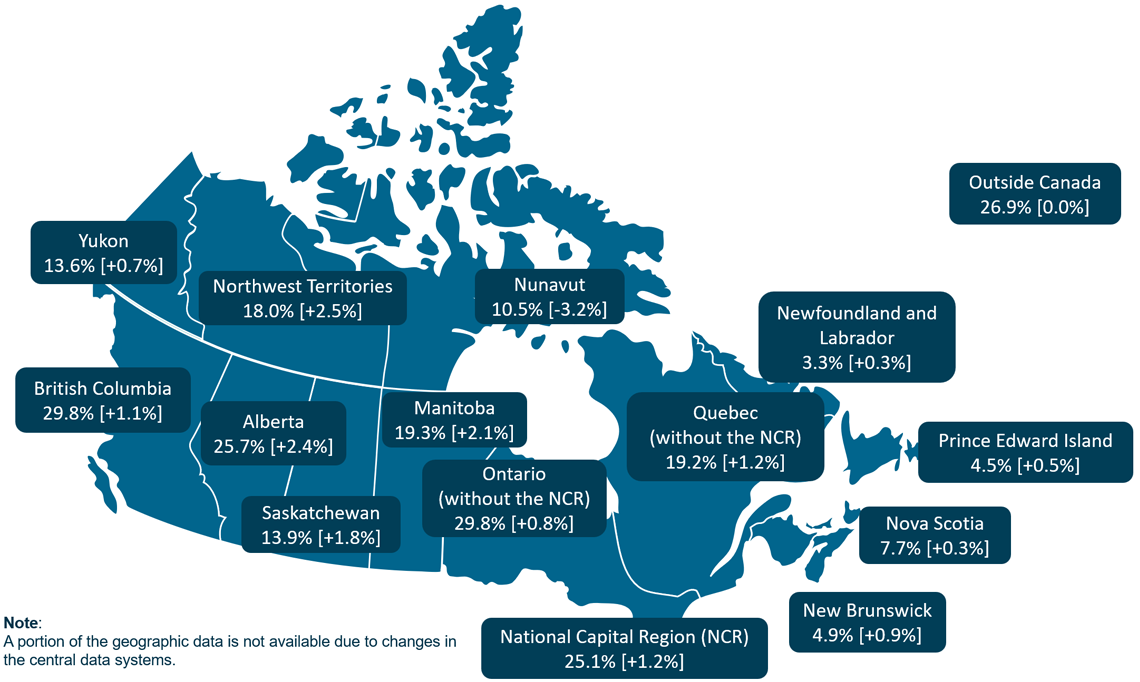
Figure 28 - Text version
- Newfoundland and Labrador: 3.3% [increase of 0.3 percentage points]
- Prince Edward Island: 4.5% [increase of 0.5 percentage points]
- Nova Scotia: 7.7% [increase of 0.3 percentage points]
- New Brunswick: 4.9% [increase of 0.9 percentage points]
- Quebec (without the NCR): 19.2% [increase of 1.2 percentage points]
- National Capital Region (NCR): 25.1% [increase of 1.2 percentage points]
- Ontario (without the NCR): 29.8% [increase of 0.8 percentage points]
- Manitoba: 19.3% [increase of 2.1 percentage points]
- Saskatchewan: 13.9% [increase of 1.8 percentage points]
- Alberta: 25.7% [increase of 2.4 percentage points]
- British Columbia: 29.8% [increase of 1.1 percentage points]
- Yukon: 13.6% [increase of 0.7 percentage points]
- Northwest Territories: 18.0% [increase of 2.5 percentage points]
- Nunavut: 10.5% [decrease of 3.2 percentage points]
- Outside Canada: 26.9% [unchanged]
Note: A portion of the geographic data is not available due to changes in the central data systems.
Table 7: Representation of members of visible minorities by subgroup – overall and executives
| Subgroup | Overall – number | Overall - percentage | Executives – number | Executives - percentage |
|---|---|---|---|---|
| Black | 13,270 | 5.0% | 233 | 3.0% |
| Non-White Latin American | 2,947 | 1.1% | 42 | 0.5% |
| Person of mixed origin | 4,657 | 1.7% | 163 | 2.1% |
| Chinese | 8,803 | 3.3% | 130 | 1.7% |
| Japanese | 311 | 0.1% | 10 | 0.1% |
| Korean | 885 | 0.3% | 17 | 0.2% |
| Filipino | 2,440 | 0.9% | 18 | 0.2% |
| South Asian / East Indian | 11,334 | 4.3% | 250 | 3.2% |
| Non-White West Asian, North African or Arab | 7,355 | 2.8% | 212 | 2.7% |
| Southeast Asian | 3,038 | 1.1% | 63 | 0.8% |
| Other visible minority groups | 5,975 | 2.2% | 135 | 1.7% |
| Total | 61,015 | 22.9% | 1,273 | 16.4% |
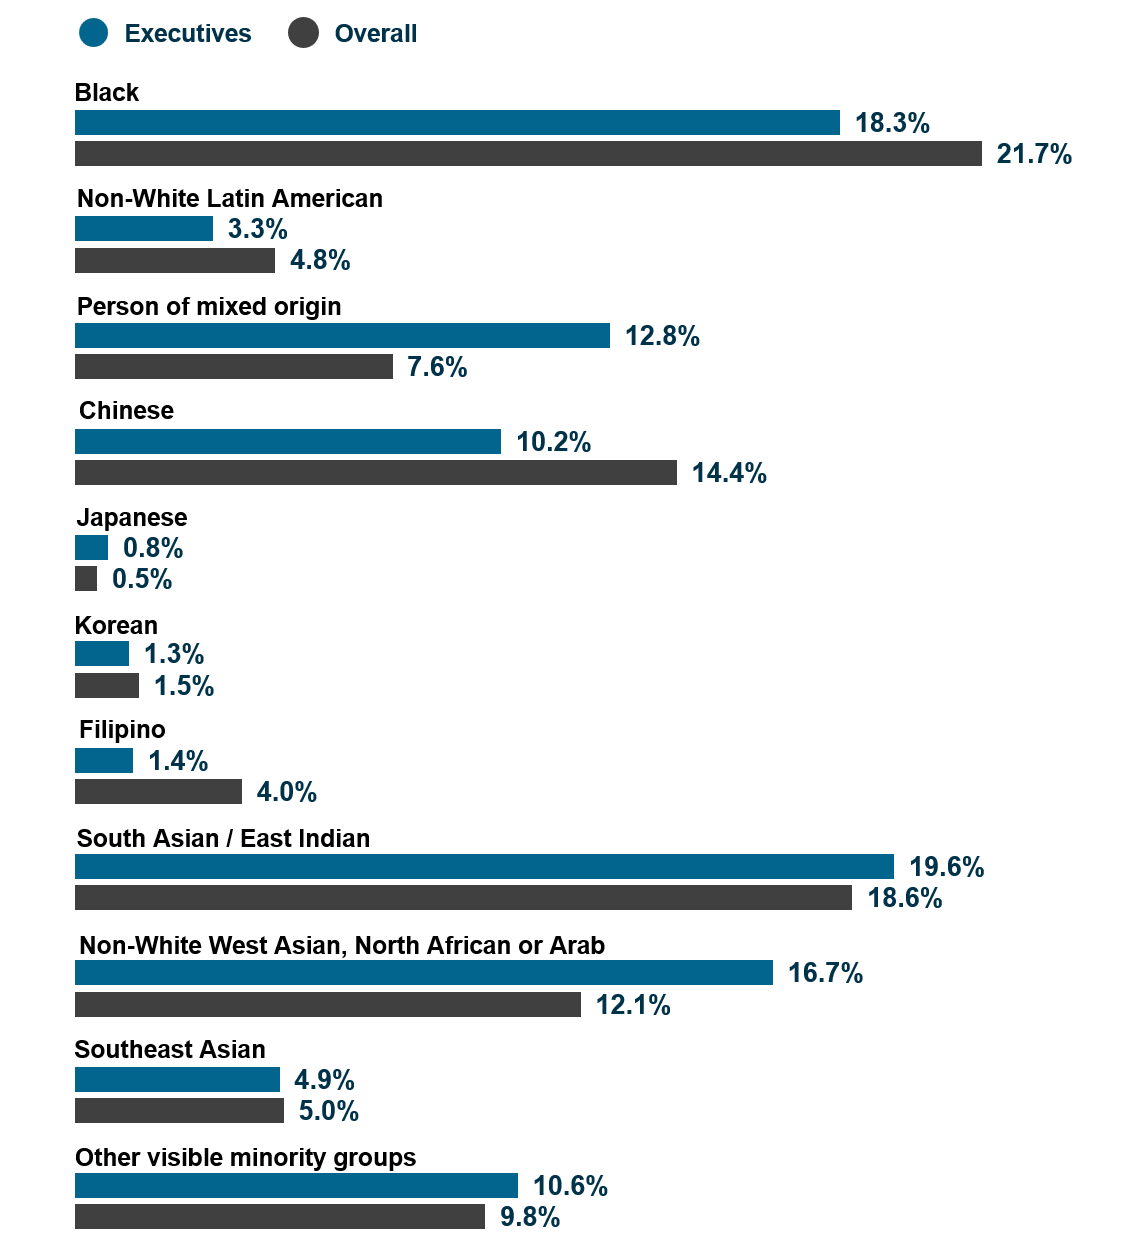
Figure 29 - Text version
| Subgroup | Overall | Executives |
|---|---|---|
| Black | 21.7% | 18.3% |
| Non-White Latin American | 4.8% | 3.3% |
| Person of mixed origin | 7.6% | 12.8% |
| Chinese | 14.4% | 10.2% |
| Japanese | 0.5% | 0.8% |
| Korean | 1.5% | 1.3% |
| Filipino | 4.0% | 1.4% |
| South Asian / East Indian | 18.6% | 19.6% |
| Non-White West Asian, North African or Arab | 12.1% | 16.7% |
| Southeast Asian | 5.0% | 4.9% |
| Other visible minority groups | 9.8% | 10.6% |
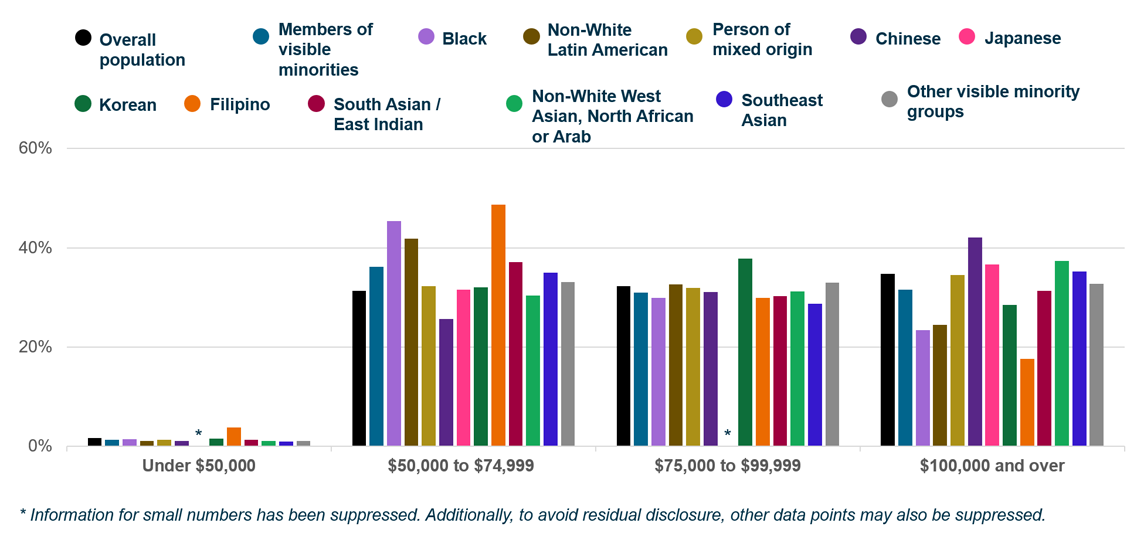
Figure 30 - Text version
| Group | Under $50,000 | $50,000 to $74,999 | $75,000 to $99,999 | $100,000 and over |
|---|---|---|---|---|
| Overall population | 1.7% | 31.3% | 32.2% | 34.8% |
| Members of visible minorities | 1.3% | 36.2% | 31.0% | 31.6% |
| Black | 1.4% | 45.4% | 29.9% | 23.4% |
| Non-White Latin American | 1.1% | 41.8% | 32.7% | 24.4% |
| Person of mixed origin | 1.4% | 32.2% | 31.9% | 34.5% |
| Chinese | 1.1% | 25.7% | 31.1% | 42.1% |
| Japanese | table 25 note * | 31.5% | table 25 note * | 36.7% |
| Korean | 1.6% | 32.1% | 37.9% | 28.5% |
| Filipino | 3.8% | 48.7% | 30.0% | 17.6% |
| South Asian / East Indian | 1.3% | 37.1% | 30.3% | 31.3% |
| Non-White West Asian, North African or Arab | 1.0% | 30.4% | 31.2% | 37.3% |
| Southeast Asian | 1.0% | 35.0% | 28.7% | 35.3% |
| Other visible minority groups | 1.1% | 33.1% | 33.0% | 32.8% |
Table 25 Notes
|
||||

Figure 31 - Text version
| Group | 20 to 29 years | 50 to 64 years |
|---|---|---|
| Overall population | 12.9% | 28.9% |
| Members of visible minorities | 16.9% | 22.8% |
| Black | 14.4% | 22.7% |
| Non-White Latin American | 11.8% | 22.8% |
| Person of mixed origin | 22.8% | 18.0% |
| Chinese | 16.2% | 29.5% |
| Japanese | 12.9% | 36.3% |
| Korean | 17.7% | 17.6% |
| Filipino | 20.2% | 22.1% |
| South Asian / East Indian | 19.3% | 19.9% |
| Non-White West Asian, North African or Arab | 18.5% | 21.9% |
| Southeast Asian | 18.1% | 21.0% |
| Other visible minority groups | 12.5% | 25.2% |
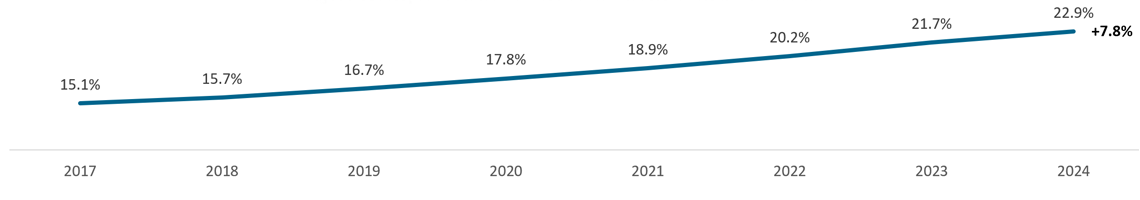
Figure 32 - Text version
| Year | Percentage |
|---|---|
| 2017 | 15.1% |
| 2018 | 15.7% |
| 2019 | 16.7% |
| 2020 | 17.8% |
| 2021 | 18.9% |
| 2022 | 20.2% |
| 2023 | 21.7% |
| 2024 | 22.9% |
The representation of members of visible minorities increased by 7.8 percentage points between March 2017 and March 2024.
Table 8: Representation trends for members of visible minorities by subgroup – number
| Subgroup | 2017 | 2018 | 2019 | 2020 | 2021 | 2022 | 2023 | 2024 |
|---|---|---|---|---|---|---|---|---|
| Black | 5,218 | 5,538 | 6,468 | 7,427 | 8,754 | 9,809 | 11,771 | 13,270 |
| Non-White Latin American | 1,074 | 1,170 | 1,387 | 1,585 | 1,869 | 2,148 | 2,567 | 2,947 |
| Person of mixed origin | 2,153 | 2,227 | 2,568 | 2,999 | 3,490 | 3,851 | 4,409 | 4,657 |
| Chinese | 5,365 | 5,592 | 6,042 | 6,505 | 7,241 | 7,785 | 8,505 | 8,803 |
| Japanese | 234 | 229 | 235 | 249 | 271 | 277 | 296 | 311 |
| Korean | 342 | 383 | 448 | 535 | 642 | 717 | 847 | 885 |
| Filipino | 1,027 | 1,095 | 1,231 | 1,410 | 1,641 | 1,855 | 2,176 | 2,440 |
| South Asian / East Indian | 4,949 | 5,222 | 5,799 | 6,500 | 7,646 | 8,699 | 10,125 | 11,334 |
| Non-White West Asian, North African or Arab | 2,984 | 3,184 | 3,689 | 4,318 | 4,839 | 5,459 | 6,555 | 7,355 |
| Southeast Asian | 1,220 | 1,293 | 1,432 | 1,637 | 1,877 | 2,087 | 2,381 | 3,038 |
| Other visible minority groups | 3,492 | 4,340 | 4,705 | 4,980 | 4,852 | 5,041 | 5,402 | 5,975 |
| Total | 28,058 | 30,273 | 34,004 | 38,145 | 43,122 | 47,728 | 55,034 | 61,015 |
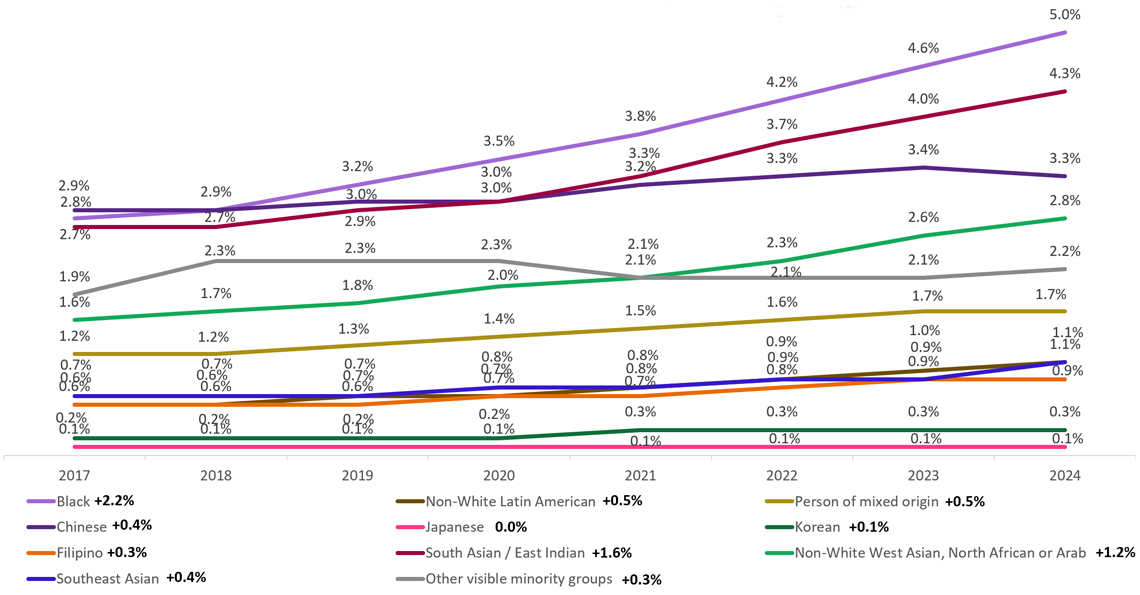
Figure 33 - Text version
| Subgroup | 2017 | 2018 | 2019 | 2020 | 2021 | 2022 | 2023 | 2024 | Change between 2017 and 2024 |
|---|---|---|---|---|---|---|---|---|---|
| Black | 2.8% | 2.9% | 3.2% | 3.5% | 3.8% | 4.2% | 4.6% | 5.0% | +2.2% |
| Non-White Latin American | 0.6% | 0.6% | 0.7% | 0.7% | 0.8% | 0.9% | 1.0% | 1.1% | +0.5% |
| Person of mixed origin | 1.2% | 1.2% | 1.3% | 1.4% | 1.5% | 1.6% | 1.7% | 1.7% | +0.5% |
| Chinese | 2.9% | 2.9% | 3.0% | 3.0% | 3.2% | 3.3% | 3.4% | 3.3% | +0.4% |
| Japanese | 0.1% | 0.1% | 0.1% | 0.1% | 0.1% | 0.1% | 0.1% | 0.1% | 0.0% |
| Korean | 0.2% | 0.2% | 0.2% | 0.2% | 0.3% | 0.3% | 0.3% | 0.3% | +0.1% |
| Filipino | 0.6% | 0.6% | 0.6% | 0.7% | 0.7% | 0.8% | 0.9% | 0.9% | +0.3% |
| South Asian / East Indian | 2.7% | 2.7% | 2.9% | 3.0% | 3.3% | 3.7% | 4.0% | 4.3% | +1.6% |
| Non-White West Asian, North African or Arab | 1.6% | 1.7% | 1.8% | 2.0% | 2.1% | 2.3% | 2.6% | 2.8% | +1.2% |
| Southeast Asian | 0.7% | 0.7% | 0.7% | 0.8% | 0.8% | 0.9% | 0.9% | 1.1% | +0.4% |
| Other visible minority groups | 1.9% | 2.3% | 2.3% | 2.3% | 2.1% | 2.1% | 2.1% | 2.2% | +0.3% |
Representation of Black employees
- 5.0% of employees in the core public administration have self-identified as Black employees.
- 3.0% of executives have self-identified as Black employees.
- 14.4% of Black employees are 20 to 29 years of age.
- 24.5% of Black employees are 50 to 69 years of age.

Figure 34 - Text version
Of the employees who self-identified as Black employees:
- 57.7% are women [increase of 0.4 percentage points]
- 1.5% self-identified as Indigenous Peoples [unchanged]
- 5.3% self-identified as persons with disabilities [increase of 0.7 percentage points]
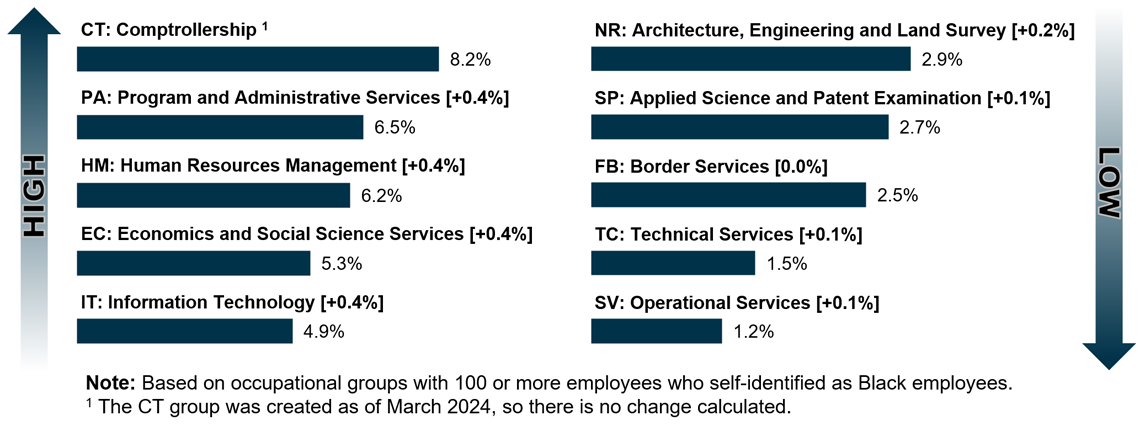
Figure 35 - Text version
Highest proportion of Black employees
- CT: Comptrollership: 8.2%figure 35 note 1
- PA: Program and Administrative Services: 6.5% [increase of 0.4 percentage points]
- HM: Human Resources Management: 6.2% [increase of 0.4 percentage points]
- EC: Economics and Social Science Services: 5.3% [increase of 0.4 percentage points]
- IT: Information Technology: 4.9% [increase of 0.4 percentage points]
Lowest proportion of Black employees
- NR: Architecture, Engineering and Land Survey: 2.9% [increase of 0.2 percentage points]
- SP: Applied Science and Patent Examination: 2.7% [increase of 0.1 percentage points]
- FB: Border Services: 2.5% [unchanged]
- TC: Technical Services: 1.5% [increase of 0.1 percentage points]
- SV: Operational Services: 1.2% [increase of 0.1 percentage points]
Note: Based on occupational groups with 100 or more employees who self-identified as Black employees.
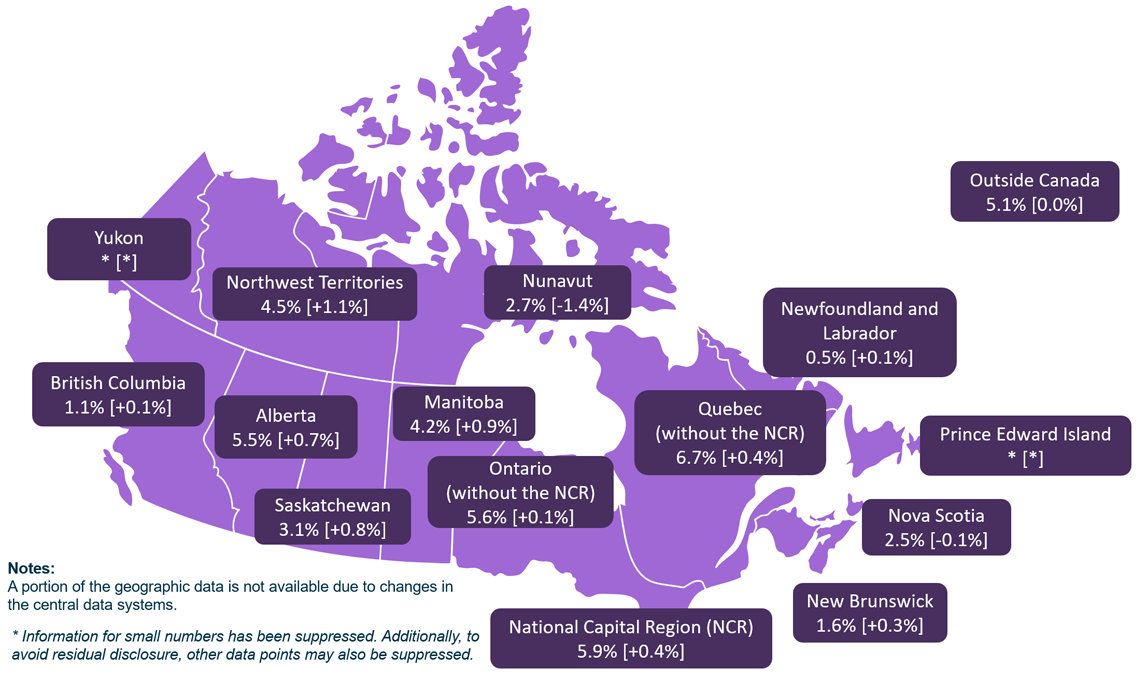
Figure 36 - Text version
- Newfoundland and Labrador: 0.5% [increase of 0.1 percentage points]
- Prince Edward Island: figure 36 note * [*]
- Nova Scotia: 2.5% [decrease of 0.1 percentage points]
- New Brunswick: 1.6% [increase of 0.3 percentage points]
- Quebec (without the NCR): 6.7% [increase of 0.4 percentage points]
- National Capital Region (NCR): 5.9% [increase of 0.4 percentage points]
- Ontario (without the NCR): 5.6% [increase of 0.1 percentage points]
- Manitoba: 4.2% [increase of 0.9 percentage points]
- Saskatchewan: 3.1% [increase of 0.8 percentage points]
- Alberta: 5.5% [increase of 0.7 percentage points]
- British Columbia: 1.1% [increase of 0.1 percentage points]
- Yukon: figure 36 note * [*]
- Northwest Territories: 4.5% [increase of 1.1 percentage points]
- Nunavut: 2.7% [decrease of 1.4 percentage points]
- Outside Canada: 5.1% [unchanged]
Note: A portion of the geographic data is not available due to changes in the central data systems.
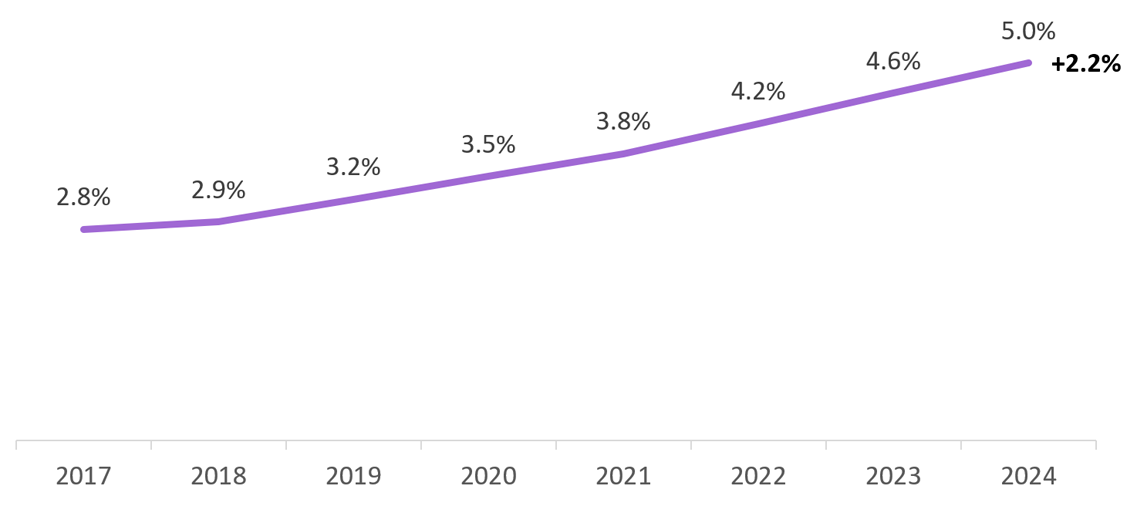
Figure 37 - Text version
| Year | Percentage |
|---|---|
| 2017 | 2.8% |
| 2018 | 2.9% |
| 2019 | 3.2% |
| 2020 | 3.5% |
| 2021 | 3.8% |
| 2022 | 4.2% |
| 2023 | 4.6% |
| 2024 | 5.0% |
The representation of Black employees increased by 2.2 percentage points between March 2017 and March 2024.
Table 9: Representation trends for Black employees – number
| Year | Number |
|---|---|
| 2017 | 5,218 |
| 2018 | 5,538 |
| 2019 | 6,468 |
| 2020 | 7,427 |
| 2021 | 8,754 |
| 2022 | 9,809 |
| 2023 | 11,771 |
| 2024 | 13,270 |
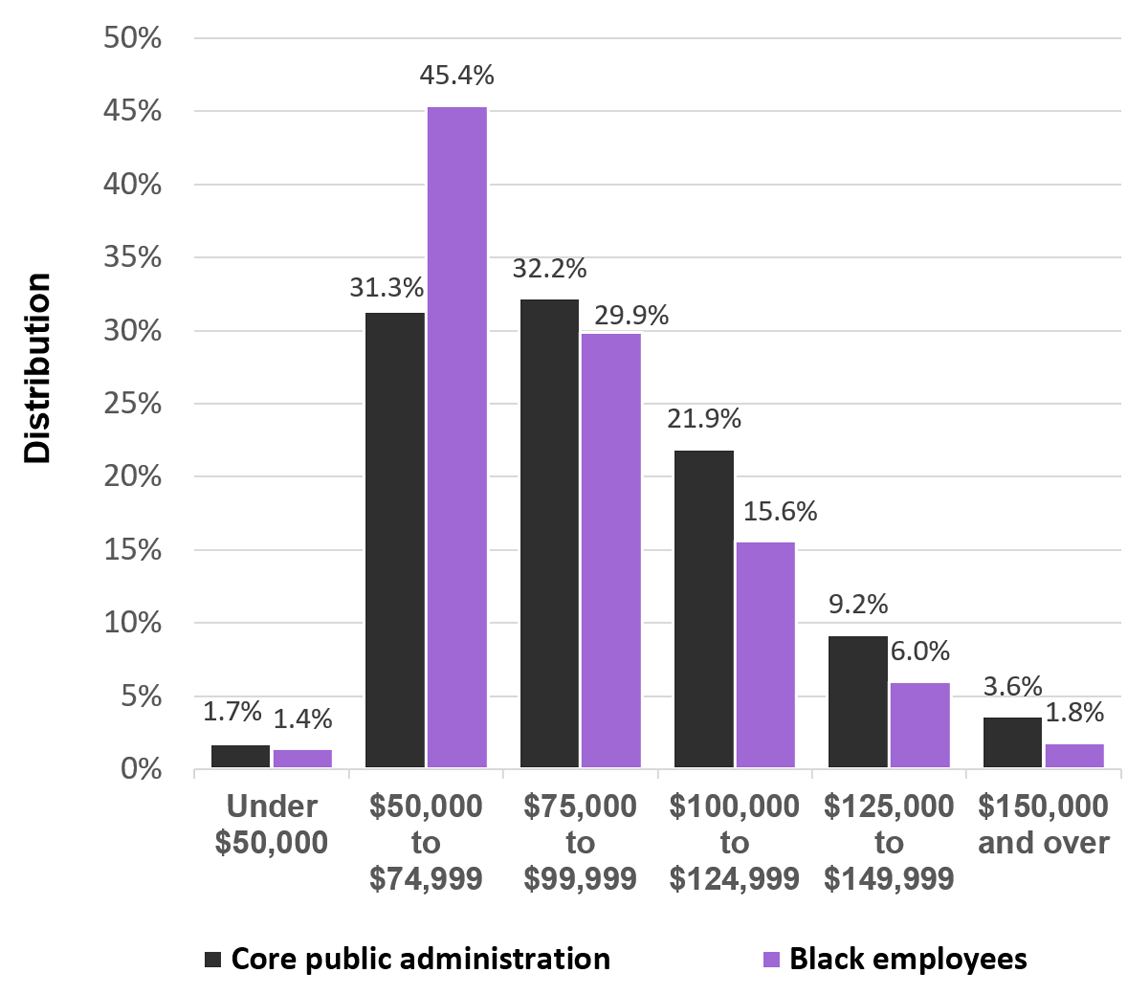
Figure 38 - Text version
| Group | Under $50,000 | $50,000 to $74,999 | $75,000 to $99,999 | $100,000 to $124,999 | $125,000 to $149,999 | $150,000 and over |
|---|---|---|---|---|---|---|
| Core public administration | 1.7% | 31.3% | 32.2% | 21.9% | 9.2% | 3.6% |
| Black employees | 1.4% | 45.4% | 29.9% | 15.6% | 6.0% | 1.8% |
Official languages of the core public administration and employment equity designated groups
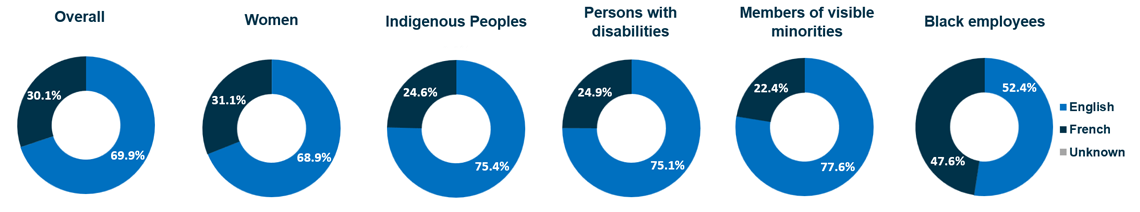
Figure 39 - Text version
| Group | English | French | Unknown |
|---|---|---|---|
| Overall | 69.9% | 30.1% | 0.0% |
| Women | 68.9% | 31.1% | 0.0% |
| Indigenous Peoples | 75.4% | 24.6% | 0.0% |
| Persons with disabilities | 75.1% | 24.9% | 0.0% |
| Members of visible minorities | 77.6% | 22.4% | 0.0% |
| Black employees | 52.4% | 47.6% | 0.0% |
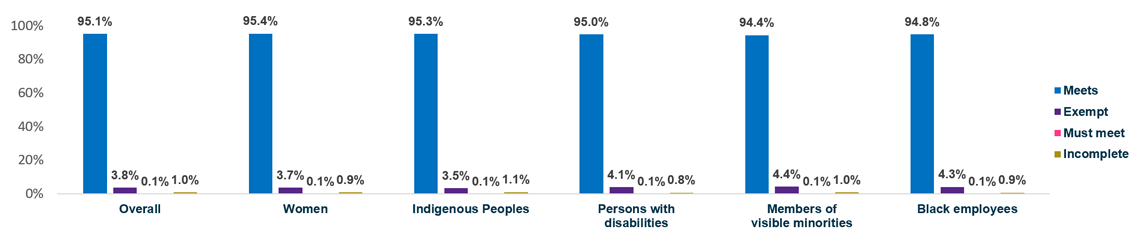
Figure 40 - Text version
| Group | Meets | Exempt | Must meet | Incomplete |
|---|---|---|---|---|
| Overall | 95.1% | 3.8% | 0.1% | 1.0% |
| Women | 95.4% | 3.7% | 0.1% | 0.9% |
| Indigenous Peoples | 95.3% | 3.5% | 0.1% | 1.1% |
| Persons with disabilities | 95.0% | 4.1% | 0.1% | 0.8% |
| Members of visible minorities | 94.4% | 4.4% | 0.1% | 1.0% |
| Black employees | 94.8% | 4.3% | 0.1% | 0.9% |
Hires into, promotions within and separations from the core public administration
Table 10: Hires, promotions and separations by group – number and share
| Action type | All employees – number | Women - number | Women – percentage | Indigenous Peoples – number | Indigenous Peoples - percentage | Persons with disabilities – number | Persons with disabilities – percentage | Members of visible minorities – number | Members of visible minorities - percentage | Black employees – number | Black employees - percentage |
|---|---|---|---|---|---|---|---|---|---|---|---|
| Hires | 29,033 | 17,530 | 60.4% | 1,243 | 4.3% | 2,372 | 8.2% | 7,790 | 26.8% | 2,002 | 6.9% |
| Promotions | 31,025 | 19,578 | 63.1% | 1,642 | 5.3% | 2,517 | 8.1% | 8,115 | 26.2% | 1,788 | 5.8% |
| Separations | 15,222 | 8,667 | 56.9% | 906 | 6.0% | 1,210 | 7.9% | 2,394 | 15.7% | 576 | 3.8% |
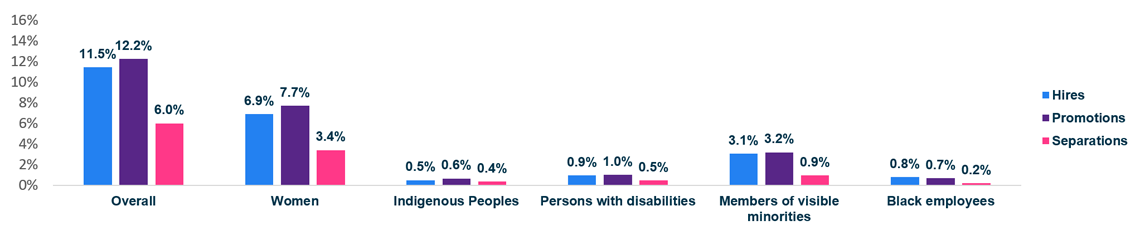
Figure 41 - Text version
| Group | Hires | Promotions | Separations |
|---|---|---|---|
| Overall | 11.5% | 12.2% | 6.0% |
| Women | 6.9% | 7.7% | 3.4% |
| Indigenous Peoples | 0.5% | 0.6% | 0.4% |
| Persons with disabilities | 0.9% | 1.0% | 0.5% |
| Members of visible minorities | 3.1% | 3.2% | 0.9% |
| Black employees | 0.8% | 0.7% | 0.2% |
Table 11: Hires, promotions and separations of executives by group – number and share
| Action type | Executives - number | Women - number | Women – percentage | Indigenous Peoples – number | Indigenous Peoples - percentage | Persons with disabilities – number | Persons with disabilities – percentage | Members of visible minorities – number | Members of visible minorities - percentage | Black employees – number | Black employees - percentage |
|---|---|---|---|---|---|---|---|---|---|---|---|
| Hires | 108 | 53 | 49.1% | table 11 note * | table 11 note * | 14 | 13.0% | 13 | 12.0% | table 11 note * | table 11 note * |
| Promotions | 1,158 | 662 | 57.2% | 92 | 7.9% | 129 | 11.1% | 241 | 20.8% | 57 | 4.9% |
| Separations | 380 | 196 | 51.6% | 18 | 4.7% | 29 | 7.6% | 28 | 7.4% | table 11 note * | table 11 note * |
Table 11 Notes
|
|||||||||||
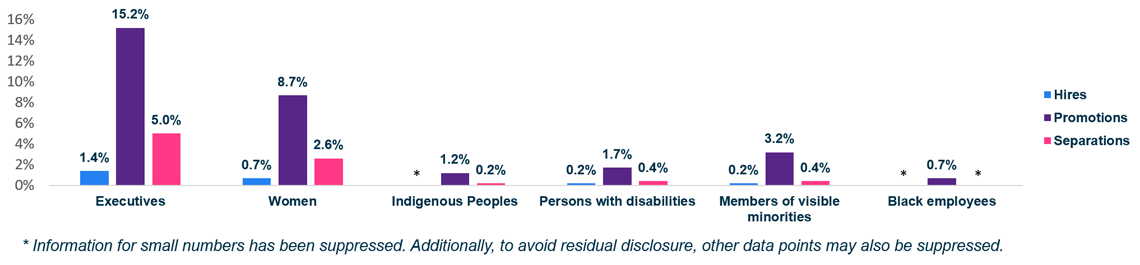
Figure 42 - Text version
| Group | Hires | Promotions | Separations |
|---|---|---|---|
| Executives | 1.4% | 15.2% | 5.0% |
| Women | 0.7% | 8.7% | 2.6% |
| Indigenous Peoples | figure 42 note * | 1.2% | 0.2% |
| Persons with disabilities | 0.2% | 1.7% | 0.4% |
| Members of visible minorities | 0.2% | 3.2% | 0.4% |
| Black employees | figure 42 note * | 0.7% | figure 42 note * |
Figure 42 Notes
|
|||
Annex 1: Statistical tables of employment equity data covered under section 21 of the Employment Equity Act
Table 1: Distribution of public service of Canada employees by designated group according to department or agency
The following table includes information (as of March 31, 2024) regarding indeterminate employees, terms of three months or more, and seasonal employees of organizations captured under the Financial Administration Act, Schedules I and IV (core public administration).
| Department or agency | All employees | Women (Overall WFA 55.3%) | Indigenous Peoples (Overall WFA 4.1%) | Persons with disabilities (Overall WFA 12.0%) | Members of visible minorities (Overall WFA 22.7%) | ||||
|---|---|---|---|---|---|---|---|---|---|
| Number | Number | % | Number | % | Number | % | Number | % | |
| Employment and Social Development Canada | 38,144 | 25,695 | 67.4 | 1,690 | 4.4 | 3,364 | 8.8 | 11,658 | 30.6 |
| National DefenceAnnex 1 table 1 note 1 | 27,707 | 11,893 | 42.9 | 956 | 3.5 | 1,618 | 5.8 | 3,336 | 12.0 |
| Correctional Service Canada | 18,596 | 9,504 | 51.1 | 1,998 | 10.7 | 1,325 | 7.1 | 2,691 | 14.5 |
| Public Services and Procurement Canada | 18,204 | 11,044 | 60.7 | 683 | 3.8 | 1,347 | 7.4 | 3,692 | 20.3 |
| Canada Border Services Agency | 15,951 | 7,581 | 47.5 | 606 | 3.8 | 1,162 | 7.3 | 3,423 | 21.5 |
| Fisheries and Oceans CanadaAnnex 1 table 1 note 2 | 14,123 | 6,320 | 44.7 | 773 | 5.5 | 966 | 6.8 | 1,383 | 9.8 |
| Immigration, Refugees and Citizenship Canada | 12,141 | 7,882 | 64.9 | 338 | 2.8 | 913 | 7.5 | 5,026 | 41.4 |
| Royal Canadian Mounted PoliceAnnex 1 table 1 note 3 | 9,884 | 6,979 | 70.6 | 535 | 5.4 | 482 | 4.9 | 1,811 | 18.3 |
| Health CanadaAnnex 1 table 1 note 4 | 9,591 | 6,230 | 65.0 | 292 | 3.0 | 902 | 9.4 | 3,228 | 33.7 |
| Shared Services Canada | 8,971 | 3,191 | 35.6 | 344 | 3.8 | 730 | 8.1 | 2,187 | 24.4 |
| Indigenous Services CanadaAnnex 1 table 1 note 4 | 8,148 | 5,705 | 70.0 | 2,232 | 27.4 | 657 | 8.1 | 1,635 | 20.1 |
| Environment and Climate Change Canada | 7,993 | 4,368 | 54.6 | 272 | 3.4 | 605 | 7.6 | 1,722 | 21.5 |
| Statistics Canada | 7,077 | 3,778 | 53.4 | 224 | 3.2 | 651 | 9.2 | 2,047 | 28.9 |
| Global Affairs Canada | 6,960 | 3,951 | 56.8 | 410 | 5.9 | 381 | 5.5 | 2,043 | 29.4 |
| Transport Canada | 6,355 | 2,951 | 46.4 | 279 | 4.4 | 453 | 7.1 | 1,372 | 21.6 |
| Innovation, Science and Economic Development Canada | 6,006 | 3,110 | 51.8 | 160 | 2.7 | 465 | 7.7 | 1,751 | 29.2 |
| Department of Justice Canada | 5,478 | 3,758 | 68.6 | 274 | 5.0 | 1,039 | 19.0 | 1,565 | 28.6 |
| Natural Resources Canada | 5,325 | 2,648 | 49.7 | 209 | 3.9 | 553 | 10.4 | 1,253 | 23.5 |
| Agriculture and Agri-Food Canada | 5,134 | 2,751 | 53.6 | 223 | 4.3 | 396 | 7.7 | 1,070 | 20.8 |
| Public Health Agency of Canada | 3,831 | 2,670 | 69.7 | 131 | 3.4 | 306 | 8.0 | 1,187 | 31.0 |
| Veterans Affairs Canada | 3,637 | 2,653 | 72.9 | 157 | 4.3 | 345 | 9.5 | 392 | 10.8 |
| Treasury Board of Canada Secretariat | 2,381 | 1,505 | 63.2 | 83 | 3.5 | 253 | 10.6 | 635 | 26.7 |
| Immigration and Refugee Board of Canada | 2,298 | 1,496 | 65.1 | 51 | 2.2 | 143 | 6.2 | 1,025 | 44.6 |
| Crown-Indigenous Relations and Northern Affairs CanadaAnnex 1 table 1 note 4 | 1,925 | 1,290 | 67.0 | 339 | 17.6 | 134 | 7.0 | 360 | 18.7 |
| Canadian Heritage | 1,788 | 1,225 | 68.5 | 98 | 5.5 | 165 | 9.2 | 353 | 19.7 |
| Public Safety Canada | 1,521 | 932 | 61.3 | 86 | 5.7 | 173 | 11.4 | 331 | 21.8 |
| Infrastructure Canada | 1,361 | 846 | 62.2 | 45 | 3.3 | 141 | 10.4 | 387 | 28.4 |
| Privy Council Office | 1,193 | 698 | 58.5 | 49 | 4.1 | 89 | 7.5 | 313 | 26.2 |
| Public Prosecution Service of Canada | 1,159 | 764 | 65.9 | 84 | 7.2 | 93 | 8.0 | 257 | 22.2 |
| Library and Archives Canada | 1,079 | 685 | 63.5 | 49 | 4.5 | 66 | 6.1 | 113 | 10.5 |
| Elections Canada | 1,045 | 554 | 53.0 | 35 | 3.3 | 72 | 6.9 | 230 | 22.0 |
| Department of Finance Canada | 922 | 434 | 47.1 | 24 | 2.6 | 56 | 6.1 | 211 | 22.9 |
| Public Service Commission of Canada | 868 | 583 | 67.2 | 37 | 4.3 | 131 | 15.1 | 205 | 23.6 |
| Canadian Space Agency | 850 | 406 | 47.8 | 16 | 1.9 | 97 | 11.4 | 193 | 22.7 |
| Courts Administration Service | 795 | 507 | 63.8 | 21 | 2.6 | 53 | 6.7 | 227 | 28.6 |
| Canada School of Public Service | 668 | 450 | 67.4 | 34 | 5.1 | 70 | 10.5 | 161 | 24.1 |
| Administrative Tribunals Support Service of Canada | 597 | 399 | 66.8 | 16 | 2.7 | 44 | 7.4 | 131 | 21.9 |
| Canadian Radio-television and Telecommunications Commission | 596 | 327 | 54.9 | 30 | 5.0 | 53 | 8.9 | 135 | 22.7 |
| Atlantic Canada Opportunities Agency | 578 | 376 | 65.1 | 28 | 4.8 | 77 | 13.3 | 53 | 9.2 |
| lmpact Assessment Agency of CanadaAnnex 1 table 1 note 5 | 490 | 332 | 67.8 | 27 | 5.5 | 42 | 8.6 | 112 | 22.9 |
| Parole Board of Canada | 482 | 364 | 75.5 | 22 | 4.6 | 42 | 8.7 | 87 | 18.0 |
| Western Economic Diversification CanadaAnnex 1 table 1 note 6 | 479 | 282 | 58.9 | 27 | 5.6 | 37 | 7.7 | 142 | 29.6 |
| Canadian Grain Commission | 454 | 209 | 46.0 | 23 | 5.1 | 25 | 5.5 | 140 | 30.8 |
| Women and Gender Equality Canada | 416 | 350 | 84.1 | 22 | 5.3 | 51 | 12.3 | 106 | 25.5 |
| Canada Economic Development for Quebec Regions | 357 | 199 | 55.7 | 7 | 2.0 | 29 | 8.1 | 81 | 22.7 |
| Canadian Transportation Agency | 346 | 188 | 54.3 | 9 | 2.6 | 37 | 10.7 | 79 | 22.8 |
| Offices of the Information and Privacy Commissioners of Canada | 303 | 190 | 62.7 | 14 | 4.6 | 17 | 5.6 | 54 | 17.8 |
| Federal Economic Development Agency for Southern Ontario | 287 | 167 | 58.2 | 11 | 3.8 | 37 | 12.9 | 93 | 32.4 |
| Canadian Human Rights Commission | 272 | 201 | 73.9 | 7 | 2.6 | 47 | 17.3 | 77 | 28.3 |
| Registrar of the Supreme Court of Canada | 226 | 134 | 59.3 | 9 | 4.0 | 23 | 10.2 | 33 | 14.6 |
| Transportation Safety Board of Canada | 209 | 84 | 40.2 | Annex 1 table 1 note * | Annex 1 table 1 note * | 11 | 5.3 | 25 | 12.0 |
| Office of the Commissioner of Official Languages | 161 | 107 | 66.5 | Annex 1 table 1 note * | Annex 1 table 1 note * | 8 | 5.0 | 17 | 10.6 |
| Office of the Governor General’s Secretary | 156 | 97 | 62.2 | Annex 1 table 1 note * | Annex 1 table 1 note * | 16 | 10.3 | 28 | 17.9 |
| Veterans Review and Appeal Board | 123 | 83 | 67.5 | Annex 1 table 1 note * | Annex 1 table 1 note * | 6 | 4.9 | 0 | 0.0 |
| Canadian Northern Economic Development Agency | 109 | 70 | 64.2 | 26 | 23.9 | 10 | 9.2 | 24 | 22.0 |
| Civilian Review and Complaints Commission for the RCMP | 89 | 62 | 69.7 | Annex 1 table 1 note * | Annex 1 table 1 note * | 9 | 10.1 | 17 | 19.1 |
| Federal Economic Development Agency for Northern Ontario | 83 | 55 | 66.3 | 7 | 8.4 | 9 | 10.8 | Annex 1 table 1 note * | Annex 1 table 1 note * |
| Patented Medicine Prices Review Board Canada | 79 | 42 | 53.2 | Annex 1 table 1 note * | Annex 1 table 1 note * | Annex 1 table 1 note * | Annex 1 table 1 note * | 19 | 24.1 |
| Canadian Dairy Commission | 72 | 39 | 54.2 | Annex 1 table 1 note * | Annex 1 table 1 note * | 6 | 8.3 | 13 | 18.1 |
| Office of the Commissioner for Federal Judicial Affairs Canada | 55 | 37 | 67.3 | 0 | 0.0 | Annex 1 table 1 note * | Annex 1 table 1 note * | Annex 1 table 1 note * | Annex 1 table 1 note * |
| Accessibility Standards Canada | 54 | 32 | 59.3 | Annex 1 table 1 note * | Annex 1 table 1 note * | 16 | 29.6 | 14 | 25.9 |
| Military Grievances External Review Committee | 47 | 30 | 63.8 | Annex 1 table 1 note * | Annex 1 table 1 note * | 8 | 17.0 | 11 | 23.4 |
| Canadian Intergovernmental Conference Secretariat | 34 | 18 | 52.9 | Annex 1 table 1 note * | Annex 1 table 1 note * | Annex 1 table 1 note * | Annex 1 table 1 note * | 10 | 29.4 |
| Office of the Public Sector Integrity Commissioner of Canada | 33 | 19 | 57.6 | Annex 1 table 1 note * | Annex 1 table 1 note * | Annex 1 table 1 note * | Annex 1 table 1 note * | Annex 1 table 1 note * | Annex 1 table 1 note * |
| Military Police Complaints Commission of Canada | 31 | 21 | 67.7 | Annex 1 table 1 note * | Annex 1 table 1 note * | Annex 1 table 1 note * | Annex 1 table 1 note * | 10 | 32.3 |
| International Joint Commission | 31 | 16 | 51.6 | Annex 1 table 1 note * | Annex 1 table 1 note * | 6 | 19.4 | Annex 1 table 1 note * | Annex 1 table 1 note * |
| Office of the Commissioner of Lobbying of Canada | 28 | 13 | 46.4 | Annex 1 table 1 note * | Annex 1 table 1 note * | Annex 1 table 1 note * | Annex 1 table 1 note * | 6 | 21.4 |
| RCMP External Review Committee | 23 | 15 | 65.2 | Annex 1 table 1 note * | Annex 1 table 1 note * | Annex 1 table 1 note * | Annex 1 table 1 note * | Annex 1 table 1 note * | Annex 1 table 1 note * |
| Copyright Board Canada | 16 | 10 | 62.5 | 0 | 0.0 | Annex 1 table 1 note * | Annex 1 table 1 note * | Annex 1 table 1 note * | Annex 1 table 1 note * |
| Secretariat of the National Security and Intelligence Committee of Parliamentarians | 6 | Annex 1 table 1 note * | Annex 1 table 1 note * | 0 | 0.0 | 0 | 0.0 | 0 | 0.0 |
| Law Commission of Canada | 2 | Annex 1 table 1 note * | Annex 1 table 1 note * | 0 | 0.0 | 0 | 0.0 | Annex 1 table 1 note * | Annex 1 table 1 note * |
| TotalAnnex 1 table 1 note 7 | 266,433 | 151,607 | 56.9 | 14,152 | 5.3 | 21,089 | 7.9 | 61,015 | 22.9 |
Table 1 Notes
Source: The source of the representation data is the Treasury Board of Canada Secretariat Employment Equity Data Bank, which is populated with self-identification information provided by employees. |
|||||||||
Table 2: Distribution of public service of Canada employees by designated group and region of work
The following table includes information (as of March 31, 2024) regarding indeterminate employees, terms of three months or more, and seasonal employees of organizations captured under the Financial Administration Act, Schedules I and IV (core public administration).
| Region of work | All employees | Women | Indigenous Peoples | Persons with disabilities | Members of visible minorities | ||||
|---|---|---|---|---|---|---|---|---|---|
| Number | Number | % | Number | % | Number | % | Number | % | |
| Newfoundland and Labrador | 4,367 | 2,304 | 52.8 | 357 | 8.2 | 365 | 8.4 | 146 | 3.3 |
| Prince Edward Island | 2,490 | 1,594 | 64.0 | 70 | 2.8 | 235 | 9.4 | 112 | 4.5 |
| Nova Scotia | 11,192 | 5,585 | 49.9 | 658 | 5.9 | 1,043 | 9.3 | 861 | 7.7 |
| New Brunswick | 11,338 | 6,955 | 61.3 | 424 | 3.7 | 815 | 7.2 | 552 | 4.9 |
| Quebec (without the NCR)Annex 1 table 2 note 1 | 28,414 | 15,866 | 55.8 | 752 | 2.6 | 1,579 | 5.6 | 5,461 | 19.2 |
| NCR (Quebec)Annex 1 table 2 note 1 | 34,839 | 20,378 | 58.5 | 1,938 | 5.6 | 2,837 | 8.1 | 8,028 | 23.0 |
| NCR (Ontario)Annex 1 table 2 note 1 | 87,055 | 49,499 | 56.9 | 3,280 | 3.8 | 7,899 | 9.1 | 22,588 | 25.9 |
| NCRAnnex 1 table 2 note 1 | 121,894 | 69,877 | 57.3 | 5,218 | 4.3 | 10,736 | 8.8 | 30,616 | 25.1 |
| Ontario (without the NCR)Annex 1 table 2 note 1 | 32,780 | 18,974 | 57.9 | 1,554 | 4.7 | 2,429 | 7.4 | 9,782 | 29.8 |
| Manitoba | 8,641 | 5,099 | 59.0 | 1,383 | 16.0 | 705 | 8.2 | 1,668 | 19.3 |
| Saskatchewan | 5,524 | 3,362 | 60.9 | 984 | 17.8 | 395 | 7.2 | 768 | 13.9 |
| Alberta | 13,286 | 7,772 | 58.5 | 1,097 | 8.3 | 1,059 | 8.0 | 3,409 | 25.7 |
| British Columbia | 21,255 | 11,061 | 52.0 | 1,173 | 5.5 | 1,382 | 6.5 | 6,328 | 29.8 |
| Yukon | 389 | 244 | 62.7 | 55 | 14.1 | 23 | 5.9 | 53 | 13.6 |
| Northwest Territories | 488 | 297 | 60.9 | 80 | 16.4 | 28 | 5.7 | 88 | 18.0 |
| Nunavut | 295 | 181 | 61.4 | 154 | 52.2 | 12 | 4.1 | 31 | 10.5 |
| Outside Canada | 1,536 | 796 | 51.8 | 76 | 4.9 | 57 | 3.7 | 413 | 26.9 |
| Not availableAnnex 1 table 2 note 2 | 2,544 | 1,640 | 64.5 | 117 | 4.6 | 226 | 8.9 | 727 | 28.6 |
| TotalAnnex 1 table 2 note 3 | 266,433 | 151,607 | 56.9 | 14,152 | 5.3 | 21,089 | 7.9 | 61,015 | 22.9 |
Table 2 Notes
Source: The source of the representation data is the Treasury Board of Canada Secretariat Employment Equity Data Bank, which is populated with self-identification information provided by employees. |
|||||||||
Table 3.1: Distribution of public service of Canada employees by designated group and occupational groups in force
The following table includes information (as of March 31, 2024) regarding indeterminate employees, terms of three months or more, and seasonal employees of organizations captured under the Financial Administration Act, Schedules I and IV (core public administration). Classification is based on the effective classification which includes acting assignments.
| Occupational group in force | All employees | Women | Men | Indigenous Peoples | Persons with disabilities | Members of visible minorities | |||||
|---|---|---|---|---|---|---|---|---|---|---|---|
| Number | Number | % | Number | % | Number | % | Number | % | Number | % | |
| AI: Air Traffic Control | 11 | Annex 1 Table 3.1 note * | Annex 1 Table 3.1 note * | Annex 1 Table 3.1 note * | Annex 1 Table 3.1 note * | 0 | 0.0 | 0 | 0.0 | 0 | 0.0 |
| AO: Aircraft Operations | 385 | 41 | 10.6 | 344 | 89.4 | 17 | 4.4 | Annex 1 Table 3.1 note * | Annex 1 Table 3.1 note * | 14 | 3.6 |
| AV: Commerce and Purchasing | 7,663 | 4,095 | 53.4 | 3,567 | 46.5 | 332 | 4.3 | 573 | 7.5 | 1,721 | 22.5 |
| CT: ComptrollershipAnnex 1 Table 3.1 note 1 | 6,966 | 3,979 | 57.1 | 2,985 | 42.9 | 214 | 3.1 | 341 | 4.9 | 2,516 | 36.1 |
| CX: Correctional Services | 7,150 | 2,039 | 28.5 | 5,108 | 71.4 | 802 | 11.2 | 324 | 4.5 | 1,218 | 17.0 |
| EB: Education and Library Science | 1,368 | 924 | 67.5 | 444 | 32.5 | 138 | 10.1 | 79 | 5.8 | 263 | 19.2 |
| EC: Economics and Social Science Services | 26,200 | 15,825 | 60.4 | 10,371 | 39.6 | 1,128 | 4.3 | 2,611 | 10.0 | 7,611 | 29.0 |
| EL: Electronics | 1,141 | 78 | 6.8 | 1,062 | 93.1 | 44 | 3.9 | 61 | 5.3 | 136 | 11.9 |
| EX: Executive | 7,380 | 4,028 | 54.6 | 3,351 | 45.4 | 408 | 5.5 | 693 | 9.4 | 1,192 | 16.2 |
| FB: Border Services | 10,415 | 4,230 | 40.6 | 6,185 | 59.4 | 445 | 4.3 | 652 | 6.3 | 1,934 | 18.6 |
| FS: Foreign Service | 1,937 | 1,096 | 56.6 | 841 | 43.4 | 93 | 4.8 | 92 | 4.7 | 503 | 26.0 |
| HM: Human Resources Management | 5,190 | 4,282 | 82.5 | 908 | 17.5 | 254 | 4.9 | 681 | 13.1 | 1,169 | 22.5 |
| IT: Information Technology | 20,696 | 4,691 | 22.7 | 15,995 | 77.3 | 734 | 3.5 | 1,573 | 7.6 | 5,832 | 28.2 |
| LC: Law Management | 380 | 251 | 66.1 | 129 | 33.9 | 20 | 5.3 | 58 | 15.3 | 81 | 21.3 |
| LP: Law Practitioner | 3,650 | 2,183 | 59.8 | 1,464 | 40.1 | 157 | 4.3 | 565 | 15.5 | 868 | 23.8 |
| NR: Architecture, Engineering and Land Survey | 4,749 | 1,248 | 26.3 | 3,500 | 73.7 | 103 | 2.2 | 200 | 4.2 | 1,325 | 27.9 |
| PA: Program and Administrative Services | 117,493 | 84,916 | 72.3 | 32,526 | 27.7 | 7,424 | 6.3 | 10,545 | 9.0 | 28,136 | 23.9 |
| PM-MCO: Negotiation, Mediation and Conciliation Officer | 56 | 35 | 62.5 | 21 | 37.5 | Annex 1 Table 3.1 note * | Annex 1 Table 3.1 note * | Annex 1 Table 3.1 note * | Annex 1 Table 3.1 note * | Annex 1 Table 3.1 note * | Annex 1 Table 3.1 note * |
| PO: Police Operations Support | 552 | 381 | 69.0 | 168 | 30.4 | 26 | 4.7 | 13 | 2.4 | 67 | 12.1 |
| PR: Non-Supervisory Printing Services | 2 | Annex 1 Table 3.1 note * | Annex 1 Table 3.1 note * | Annex 1 Table 3.1 note * | Annex 1 Table 3.1 note * | 0 | 0.0 | 0 | 0.0 | 0 | 0.0 |
| RE: Research | 2,657 | 929 | 35.0 | 1,727 | 65.0 | 37 | 1.4 | 112 | 4.2 | 637 | 24.0 |
| RO: Radio Operations | 289 | 92 | 31.8 | 197 | 68.2 | 28 | 9.7 | 16 | 5.5 | 8 | 2.8 |
| SH: Health Services | 3,974 | 3,247 | 81.7 | 718 | 18.1 | 268 | 6.7 | 188 | 4.7 | 605 | 15.2 |
| SO: Ships’ Officers | 1,361 | 213 | 15.7 | 1,148 | 84.3 | 26 | 1.9 | 27 | 2.0 | 48 | 3.5 |
| SP: Applied Science and Patent Examination | 10,552 | 5,901 | 55.9 | 4,650 | 44.1 | 243 | 2.3 | 620 | 5.9 | 2,807 | 26.6 |
| SR(C): Ship Repair Chargehands and Production Supervisors - East | 68 | Annex 1 Table 3.1 note * | Annex 1 Table 3.1 note * | Annex 1 Table 3.1 note * | Annex 1 Table 3.1 note * | Annex 1 Table 3.1 note * | Annex 1 Table 3.1 note * | 9 | 13.2 | Annex 1 Table 3.1 note * | Annex 1 Table 3.1 note * |
| SR(E): Ship Repair - East | 610 | 55 | 9.0 | 555 | 91.0 | 21 | 3.4 | 27 | 4.4 | 16 | 2.6 |
| SR(W): Ship Repair - West | 709 | 41 | 5.8 | 666 | 93.9 | 23 | 3.2 | 17 | 2.4 | 19 | 2.7 |
| SV: Operational Services | 10,286 | 2,235 | 21.7 | 8,039 | 78.2 | 578 | 5.6 | 381 | 3.7 | 622 | 6.0 |
| TC: Technical Services | 11,438 | 3,838 | 33.6 | 7,594 | 66.4 | 574 | 5.0 | 589 | 5.1 | 1,546 | 13.5 |
| TR: Translation | 863 | 659 | 76.4 | 204 | 23.6 | 7 | 0.8 | 26 | 3.0 | 65 | 7.5 |
| UT: University Teaching | 234 | 65 | 27.8 | 168 | 71.8 | Annex 1 Table 3.1 note * | Annex 1 Table 3.1 note * | 7 | 3.0 | 49 | 20.9 |
| Unknown | 8 | 3 | 37.5 | 5 | 62.5 | 0 | 0.0 | 0 | 0.0 | 1 | 12.5 |
| TotalAnnex 1 Table 3.1 note 2Annex 1 Table 3.1 note 3 | 266,433 | 151,607 | 56.9 | 114,714 | 43.1 | 14,152 | 5.3 | 21,089 | 7.9 | 61,015 | 22.9 |
Table 3.1 Notes
Source: The source of the representation data is the Treasury Board of Canada Secretariat Employment Equity Data Bank, which is populated with self-identification information provided by employees. |
|||||||||||
Table 3.2: Distribution of public service of Canada employees by designated group and (outdated) occupational category
The following table includes information (as of March 31, 2024) regarding indeterminate employees, terms of three months or more, and seasonal employees of organizations captured under the Financial Administration Act, Schedules I and IV (core public administration). Classification is based on the effective classification which includes acting assignments.
| Occupational category (outdated) | All employees | Women | Indigenous Peoples | Persons with disabilities | Members of visible minorities | ||||
|---|---|---|---|---|---|---|---|---|---|
| Number | Number | % | Number | % | Number | % | Number | % | |
| Executives | 7,760 | 4,279 | 55.1 | 428 | 5.5 | 751 | 9.7 | 1,273 | 16.4 |
EX (Executive) |
7,380 | 4,028 | 54.6 | 408 | 5.5 | 693 | 9.4 | 1,192 | 16.2 |
LC (Law Management)Annex 1 Table 3.2 note 1 |
380 | 251 | 66.1 | 20 | 5.3 | 58 | 15.3 | 81 | 21.3 |
| Scientific and Professional | 53,346 | 30,288 | 56.8 | 2,054 | 3.9 | 4,382 | 8.2 | 14,160 | 26.5 |
| Administrative and Foreign Service | 140,451 | 88,571 | 63.1 | 7,787 | 5.5 | 12,026 | 8.6 | 34,901 | 24.8 |
| Technical | 14,663 | 4,298 | 29.3 | 711 | 4.8 | 700 | 4.8 | 1,757 | 12.0 |
| Administrative Support | 20,412 | 15,181 | 74.4 | 1,272 | 6.2 | 1,807 | 8.9 | 5,045 | 24.7 |
| Operational | 29,793 | 8,987 | 30.2 | 1,900 | 6.4 | 1,423 | 4.8 | 3,878 | 13.0 |
| Undetermined | 8 | 3 | 37.5 | 0 | 0.0 | 0 | 0.0 | 1 | 12.5 |
| TotalAnnex 1 Table 3.2 note 2 | 266,433 | 151,607 | 56.9 | 14,152 | 5.3 | 21,089 | 7.9 | 61,015 | 22.9 |
Table 3.2 Notes
Source: The source of the representation data is the Treasury Board of Canada Secretariat Employment Equity Data Bank, which is populated with self-identification information provided by employees. |
|||||||||
Table 4: Distribution of public service of Canada employees by designated group and salary range
The following table includes information (as of March 31, 2024) regarding indeterminate employees, terms of three months or more, and seasonal employees of organizations captured under the Financial Administration Act, Schedules I and IV (core public administration).
| Salary range ($) | All employees | Women | Indigenous Peoples | Persons with disabilities | Members of visible minorities | |||||||||
|---|---|---|---|---|---|---|---|---|---|---|---|---|---|---|
| Number | % of all employees | Number | % of salary range | % of EEAnnex 1 Table 4 note 1 group | Number | % of salary range | % of EEAnnex 1 Table 4 note 1 group | Number | % of salary range | % of EEAnnex 1 Table 4 note 1 group | Number | % of salary range | % of EEAnnex 1 Table 4 note 1 group | |
| Under 50,000 | 4,617 | 1.7 | 3,183 | 68.9 | 2.1 | 201 | 4.4 | 1.4 | 345 | 7.5 | 1.6 | 815 | 17.7 | 1.3 |
| 50,000 to 54,999 | 2,526 | 0.9 | 1,621 | 64.2 | 1.1 | 154 | 6.1 | 1.1 | 253 | 10.0 | 1.2 | 672 | 26.6 | 1.1 |
| 55,000 to 59,999 | 7,227 | 2.7 | 5,038 | 69.7 | 3.3 | 420 | 5.8 | 3.0 | 565 | 7.8 | 2.7 | 1,987 | 27.5 | 3.3 |
| 60,000 to 64,999 | 24,922 | 9.4 | 17,195 | 69.0 | 11.3 | 1,338 | 5.4 | 9.5 | 2,206 | 8.9 | 10.5 | 7,312 | 29.3 | 12.0 |
| 65,000 to 69,999 | 24,299 | 9.1 | 15,744 | 64.8 | 10.4 | 1,396 | 5.7 | 9.9 | 2,080 | 8.6 | 9.9 | 5,849 | 24.1 | 9.6 |
| 70,000 to 74,999 | 24,361 | 9.1 | 15,784 | 64.8 | 10.4 | 1,417 | 5.8 | 10.0 | 2,024 | 8.3 | 9.6 | 6,242 | 25.6 | 10.2 |
| 75,000 to 79,999 | 20,275 | 7.6 | 12,867 | 63.5 | 8.5 | 1,199 | 5.9 | 8.5 | 1,556 | 7.7 | 7.4 | 4,548 | 22.4 | 7.5 |
| 80,000 to 84,999 | 22,858 | 8.6 | 12,455 | 54.5 | 8.2 | 1,422 | 6.2 | 10.0 | 1,719 | 7.5 | 8.2 | 5,026 | 22.0 | 8.2 |
| 85,000 to 89,999 | 16,989 | 6.4 | 6,988 | 41.1 | 4.6 | 963 | 5.7 | 6.8 | 1,037 | 6.1 | 4.9 | 3,536 | 20.8 | 5.8 |
| 90,000 to 94,999 | 12,132 | 4.6 | 6,871 | 56.6 | 4.5 | 598 | 4.9 | 4.2 | 923 | 7.6 | 4.4 | 2,644 | 21.8 | 4.3 |
| 95,000 to 99,999 | 13,604 | 5.1 | 7,109 | 52.3 | 4.7 | 678 | 5.0 | 4.8 | 1,034 | 7.6 | 4.9 | 3,133 | 23.0 | 5.1 |
| 100,000 to 104,999 | 20,277 | 7.6 | 10,988 | 54.2 | 7.2 | 1,241 | 6.1 | 8.8 | 1,654 | 8.2 | 7.8 | 4,169 | 20.6 | 6.8 |
| 105,000 to 109,999 | 10,468 | 3.9 | 5,269 | 50.3 | 3.5 | 556 | 5.3 | 3.9 | 750 | 7.2 | 3.6 | 2,327 | 22.2 | 3.8 |
| 110,000 to 114,999 | 11,870 | 4.5 | 6,633 | 55.9 | 4.4 | 568 | 4.8 | 4.0 | 974 | 8.2 | 4.6 | 2,506 | 21.1 | 4.1 |
| 115,000 to 119,999 | 6,325 | 2.4 | 2,784 | 44.0 | 1.8 | 237 | 3.7 | 1.7 | 386 | 6.1 | 1.8 | 1,435 | 22.7 | 2.4 |
| 120,000 to 124,999 | 9,528 | 3.6 | 3,862 | 40.5 | 2.5 | 338 | 3.5 | 2.4 | 644 | 6.8 | 3.1 | 2,123 | 22.3 | 3.5 |
| 125,000 to 149,999 | 24,432 | 9.2 | 12,250 | 50.1 | 8.1 | 1,008 | 4.1 | 7.1 | 1,937 | 7.9 | 9.2 | 5,088 | 20.8 | 8.3 |
| 150,000 and over | 9,723 | 3.6 | 4,966 | 51.1 | 3.3 | 418 | 4.3 | 3.0 | 1,002 | 10.3 | 4.8 | 1,603 | 16.5 | 2.6 |
| TotalAnnex 1 Table 4 note 2 | 266,433 | 100.0 | 151,607 | 56.9 | 100.0 | 14,152 | 5.3 | 100.0 | 21,089 | 7.9 | 100.0 | 61,015 | 22.9 | 100.0 |
Table 4 Notes
Source:The source of the representation data is the Treasury Board of Canada Secretariat Employment Equity Data Bank, which is populated with self-identification information provided by employees. |
||||||||||||||
Table 5: Hires into, promotions within and separations from the public service of Canada by designated group
The following table includes information (as of fiscal year 2023-24) regarding indeterminate employees, terms of three months or more, and seasonal employees of organizations captured under the Financial Administration Act, Schedules I and IV (core public administration).
| Action type | All employees | Women | Indigenous Peoples | Persons with disabilities | Members of visible minorities | ||||
|---|---|---|---|---|---|---|---|---|---|
| Number | Number | % | Number | % | Number | % | Number | % | |
| Hires | 29,033 | 17,530 | 60.4 | 1,243 | 4.3 | 2,372 | 8.2 | 7,790 | 26.8 |
| Promotions | 31,025 | 19,578 | 63.1 | 1,642 | 5.3 | 2,517 | 8.1 | 8,115 | 26.2 |
| Separations | 15,222 | 8,667 | 56.9 | 906 | 6.0 | 1,210 | 7.9 | 2,394 | 15.7 |
Source: The source of the representation data is the Treasury Board of Canada Secretariat Employment Equity Data Bank, which is populated with self-identification information provided by employees. |
|||||||||
Table 6: Distribution of public service of Canada employees by designated group and age range
The following table includes information (as of March 31, 2024) regarding indeterminate employees, terms of three months or more, and seasonal employees of organizations captured under the Financial Administration Act, Schedules I and IV (core public administration).
| Age range (years) | All employees | Women | Indigenous Peoples | Persons with disabilities | Members of visible minorities | |||||||||
|---|---|---|---|---|---|---|---|---|---|---|---|---|---|---|
| Number | % of all employees | Number | % of age range | % of EEAnnex 1 Table 6 note 1 group | Number | % of age range | % of EEAnnex 1 Table 6 note 1 group | Number | % of age range | % of EEAnnex 1 Table 6 note 1 group | Number | % of age range | % of EEAnnex 1 Table 6 note 1 group | |
| Under 20 | 158 | 0.1 | 82 | 51.9 | 0.1 | Annex 1 Table 6 note * | Annex 1 Table 6 note * | Annex 1 Table 6 note * | 6 | 3.8 | 0.0 | 8 | 5.1 | 0.0 |
| 20-24 | 6,757 | 2.5 | 4,075 | 60.3 | 2.7 | 340 | 5.0 | 2.4 | 521 | 7.7 | 2.5 | 1,785 | 26.4 | 2.9 |
| 25-29 | 27,579 | 10.4 | 16,716 | 60.6 | 11.0 | 1,260 | 4.6 | 8.9 | 2,133 | 7.7 | 10.1 | 8,499 | 30.8 | 13.9 |
| 30-34 | 32,818 | 12.3 | 19,151 | 58.4 | 12.6 | 1,586 | 4.8 | 11.2 | 2,317 | 7.1 | 11.0 | 8,897 | 27.1 | 14.6 |
| 35-39 | 34,793 | 13.1 | 20,025 | 57.6 | 13.2 | 1,702 | 4.9 | 12.0 | 2,426 | 7.0 | 11.5 | 8,615 | 24.8 | 14.1 |
| 40-44 | 40,528 | 15.2 | 23,800 | 58.7 | 15.7 | 2,108 | 5.2 | 14.9 | 2,935 | 7.2 | 13.9 | 9,405 | 23.2 | 15.4 |
| 45-49 | 40,413 | 15.2 | 23,614 | 58.4 | 15.6 | 2,238 | 5.5 | 15.8 | 3,197 | 7.9 | 15.2 | 8,605 | 21.3 | 14.1 |
| 50-54 | 35,283 | 13.2 | 19,710 | 55.9 | 13.0 | 2,159 | 6.1 | 15.3 | 3,105 | 8.8 | 14.7 | 6,672 | 18.9 | 10.9 |
| 55-59 | 26,588 | 10.0 | 14,093 | 53.0 | 9.3 | 1,632 | 6.1 | 11.5 | 2,370 | 8.9 | 11.2 | 4,694 | 17.7 | 7.7 |
| 60-64 | 15,043 | 5.6 | 7,416 | 49.3 | 4.9 | 821 | 5.5 | 5.8 | 1,440 | 9.6 | 6.8 | 2,567 | 17.1 | 4.2 |
| 65-69 | 4,960 | 1.9 | 2,255 | 45.5 | 1.5 | 255 | 5.1 | 1.8 | 493 | 9.9 | 2.3 | 978 | 19.7 | 1.6 |
| 70+ | 1,513 | 0.6 | 670 | 44.3 | 0.4 | Annex 1 Table 6 note * | Annex 1 Table 6 note * | Annex 1 Table 6 note * | 146 | 9.6 | 0.7 | 290 | 19.2 | 0.5 |
| TotalAnnex 1 Table 6 note 2 | 266,433 | 100.0 | 151,607 | 56.9 | 100.0 | 14,152 | 5.3 | 100.0 | 21,089 | 7.9 | 100.0 | 61,015 | 22.9 | 100.0 |
Table 6 Notes
Source: The source of the representation data is the Treasury Board of Canada Secretariat Employment Equity Data Bank, which is populated with self-identification information provided by employees. |
||||||||||||||
Table 7: Representation in the public service of Canada by designated group and fiscal year
The following table includes information (as of March 31, 2024) regarding indeterminate employees, terms of three months or more, and seasonal employees of organizations captured under the Financial Administration Act, Schedules I and IV (core public administration).
| Public service representation | All employees | Women | Indigenous Peoples | Persons with disabilities | Members of visible minorities | ||||
|---|---|---|---|---|---|---|---|---|---|
| Number | Number | % | Number | % | Number | % | Number | % | |
| As of March 31, 2024 | 266,433 | 151,607 | 56.9 | 14,152 | 5.3 | 21,089 | 7.9 | 61,015 | 22.9 |
| As of March 31, 2023 | 253,411 | 143,406 | 56.6 | 13,363 | 5.3 | 17,410 | 6.9 | 55,034 | 21.7 |
| As of March 31, 2022 | 236,133 | 132,299 | 56.0 | 12,336 | 5.2 | 14,573 | 6.2 | 47,728 | 20.2 |
| As of March 31, 2021 | 228,345 | 127,043 | 55.6 | 11,977 | 5.2 | 12,893 | 5.6 | 43,122 | 18.9 |
| As of March 31, 2020 | 214,120 | 117,760 | 55.0 | 10,888 | 5.1 | 11,087 | 5.2 | 38,145 | 17.8 |
| As of March 31, 2019 | 203,268 | 111,332 | 54.8 | 10,435 | 5.1 | 10,622 | 5.2 | 34,004 | 16.7 |
| As of March 31, 2018 | 192,467 | 105,465 | 54.8 | 9,876 | 5.1 | 10,181 | 5.3 | 30,273 | 15.7 |
| As of March 31, 2017 | 185,484 | 101,136 | 54.5 | 9,726 | 5.2 | 10,259 | 5.5 | 28,058 | 15.1 |
| As of March 31, 2016 | 181,674 | 98,846 | 54.4 | 9,358 | 5.2 | 10,092 | 5.6 | 26,336 | 14.5 |
| As of March 31, 2015 | 180,681 | 98,051 | 54.3 | 9,232 | 5.1 | 10,204 | 5.6 | 24,849 | 13.8 |
| As of March 31, 2014 | 181,356 | 98,078 | 54.1 | 9,239 | 5.1 | 10,390 | 5.7 | 23,919 | 13.2 |
| As of March 31, 2013 | 188,342 | 102,124 | 54.2 | 9,491 | 5.0 | 10,871 | 5.8 | 23,812 | 12.6 |
| As of March 31, 2012 | 198,793 | 108,620 | 54.6 | 9,785 | 4.9 | 11,418 | 5.7 | 23,978 | 12.1 |
| As of March 31, 2011 | 202,631 | 111,051 | 54.8 | 9,486 | 4.7 | 11,388 | 5.6 | 22,998 | 11.3 |
| As of March 31, 2010 | 202,386 | 110,867 | 54.8 | 9,307 | 4.6 | 11,620 | 5.7 | 21,567 | 10.7 |
| As of March 31, 2009 | 195,667 | 107,089 | 54.7 | 8,892 | 4.5 | 11,468 | 5.9 | 19,264 | 9.8 |
| As of March 31, 2008 | 186,754 | 101,589 | 54.4 | 8,190 | 4.4 | 11,001 | 5.9 | 17,207 | 9.2 |
| As of March 31, 2007 | 179,540 | 96,816 | 53.9 | 7,610 | 4.2 | 10,192 | 5.7 | 15,787 | 8.8 |
| As of March 31, 2006 | 176,630 | 95,013 | 53.8 | 7,381 | 4.2 | 10,169 | 5.8 | 15,112 | 8.6 |
| As of March 31, 2005 | 165,856 | 88,702 | 53.5 | 6,886 | 4.2 | 9,626 | 5.8 | 13,498 | 8.1 |
| As of March 31, 2004 | 165,976 | 88,175 | 53.1 | 6,723 | 4.1 | 9,452 | 5.7 | 13,001 | 7.8 |
| As of March 31, 2003 | 163,314 | 86,162 | 52.8 | 6,426 | 3.9 | 9,155 | 5.6 | 12,058 | 7.4 |
| As of March 31, 2002 | 157,510 | 82,663 | 52.5 | 5,980 | 3.8 | 8,331 | 5.3 | 10,772 | 6.8 |
| As of March 31, 2001 | 149,339 | 77,785 | 52.1 | 5,316 | 3.6 | 7,621 | 5.1 | 9,143 | 6.1 |
| As of March 31, 2000Annex 1 Table 7 note * (Revenue Canada excluded) |
141,253 | 72,549 | 51.4 | 4,639 | 3.3 | 6,687 | 4.7 | 7,764 | 5.5 |
| As of March 31, 1999 (Revenue Canada included) |
178,340 | 91,856 | 51.5 | 5,124 | 2.9 | 8,137 | 4.6 | 10,557 | 5.9 |
| As of March 31, 1998 | 179,831 | 90,801 | 50.5 | 4,770 | 2.7 | 6,943 | 3.9 | 9,260 | 5.1 |
Table 7 Notes
|
|||||||||
| Workforce availability | All employees | Women | Indigenous Peoples | Persons with disabilities | Members of visible minorities | ||||
|---|---|---|---|---|---|---|---|---|---|
| Number | Number | % | Number | % | Number | % | Number | % | |
| 2021 Census and 2022 Canadian Survey on Disability (based on Canadian citizens and permanent residents) - based on population data as of March 31, 2024 | n/a | n/a | 55.3 | n/a | 4.1 | n/a | 12.0 | n/a | 22.7 |
| 2016 Census and 2017 Canadian Survey on Disability (based on Canadian citizens and permanent residents) - based on population data as of March 31, 2023 | n/a | n/a | 53.7 | n/a | 3.8 | n/a | 9.2 | n/a | 17.3 |
| 2016 Census and 2017 Canadian Survey on Disability (based on Canadian citizens and permanent residents) - based on population data as of March 31, 2022 | n/a | n/a | 53.3 | n/a | 3.8 | n/a | 9.1 | n/a | 17.2 |
| 2016 Census and 2017 Canadian Survey on Disability (based on Canadian citizens only) | n/a | n/a | 52.7 | n/a | 4.0 | n/a | 9.0 | n/a | 15.3 |
| 2011 National Household Survey and 2012 Canadian Survey on Disability | n/a | n/a | 52.5 | n/a | 3.4 | n/a | 4.4 | n/a | 13.0 |
| 2006 Census and Participation and Activity Limitation Survey (PALS) | n/a | n/a | 52.3 | n/a | 3.0 | n/a | 4.0 | n/a | 12.4 |
| 2001 Census and PALS | n/a | n/a | 52.2 | n/a | 2.5 | n/a | 3.6 | n/a | 10.4 |
| 1996 Census and 1991 Health and Activity Limitation Survey (HALS) | n/a | n/a | 48.7 | n/a | 1.7 | n/a | 4.8 | n/a | 8.7 |
| 1991 Census and HALS | n/a | n/a | 47.3 | n/a | 2.6 | n/a | 4.8 | n/a | 9.0 |
|
n/a: not applicable
Source: The source of the representation data is the Treasury Board of Canada Secretariat Employment Equity Data Bank, which is populated with self-identification information provided by employees. |
|||||||||
Annex 2: Resources
© His Majesty the King in Right of Canada, as represented by the President of the Treasury Board, 2025
ISSN: 1926-2485