
Annual Report on Official Languages 2019–20
The Official Languages Act (the act) requires that the President of the Treasury Board report to Parliament on the status of official languages programs in federal institutions subject to Parts IV, V and VI of the act.
On this page
- Message from the President of the Treasury Board
- Introduction
- Modernization of the Official Languages Act
- Amendments to the Official Languages Regulations
- Communications with and services to the public
- Language of work
- 2019 Public Service Employee Survey
- Follow up to the Report on Language of Work
- Participation of English-speaking and French-speaking Canadians
- Human resources management
- Governance of official languages
- Monitoring
- Institutional priorities
- TBS activities
- Conclusion and trends
- Appendix A: Methodology for reporting on the status of official languages programs
- Appendix B: Federal institutions required to submit a review for the fiscal year 2019–20
- Appendix C: Definitions
- Appendix D: Statistical tables

Message from the President of the Treasury Board

President of the Treasury Board
As the President of the Treasury Board, I am pleased to present the 32nd annual report on official languages. This report describes the measures taken by the Government of Canada in fiscal year 2019–20 to promote the equal status of English and French in Canada and in the federal government.
Our two official languages are a defining characteristic of who we are as a nation. They are a treasured part of our history that strengthens the diversity and inclusiveness of Canadian society.
In a continent of more than 360 million mainly English-speaking people, we need to continue to protect and promote the use of the French language. In Canada, more than 10 million people speak French and nearly 8 million have French as their first official language. Thousands of Canadian authors, artists and athletes share the same language and bring it to the forefront around the world. The federal government, therefore, has a responsibility to support and champion French across the country, including in Quebec, while promoting the rights of English-speaking communities in that province. That is why, half a century after the adoption of the Official Languages Act, we are committed to its modernization to ensure that all federal institutions take action to enhance the vitality of our English and French minority communities and the substantive equality of our two official languages.
Canada’s new Official Languages (Communications with and Services to the Public) Regulations are a case in point. Starting in 2023, based on data from the most recent census, these regulations will lead to a significant increase in the number of bilingual points of service in federal institutions across the country. In addition, for the first time, federal offices near minority schools will have to offer their services in English and French.
The Government of Canada is also committed to creating and maintaining a workplace that supports the use of both English and French across the public service. The modernization of the Act provides us with an opportunity to make further progress, helping to strengthen the linguistic capacity of public servants while continuing to offer services in both official languages to Canadians with the quality they expect.
Promoting both official languages, and the openness and respect for differences that grows from that, is as much about Canada’s future as it is about our past. I invite you to read this report, which highlights the efforts and leadership of federal institutions to strengthen who we are and what we stand for in the world.
Original signed by:
The Honourable Mona Fortier
President of the Treasury Board
Introduction
The Official Languages Act (the act) states that the Treasury Board is responsible for the general direction and coordination of the policies and programs relating to the implementation of Parts IV, V and VI of the act in federal institutions. The Office of the Chief Human Resources Officer, within the Treasury Board of Canada Secretariat (TBS), is responsible for developing and evaluating those policies and programs.
TBS assists some 200 federal institutions, including institutions in the core public administration, Crown corporations, privatized organizations, separate agencies and public institutions subject to the act, in meeting their linguistic obligations.Footnote 1
Deputy heads and chief executive officers of institutions subject to the act have primary responsibility for human resources management in their organizations. They must ensure that their institutions:
- have the capacity to communicate with the public and with public servants in both official languages
- develop and maintain an organizational culture that is conducive to the use of both official languages
- help maintain a public service workforce that tends to reflect the two official language communities
The act requires the President of the Treasury Board to report to Parliament on the status of official languages programs in federal institutions that are subject to its provisions. This 32nd annual report outlines the activities and accomplishments of federal institutions in meeting their official languages responsibilities for the fiscal year 2019–20.Footnote 2 It is based on reports submitted by institutions to TBS, as well as data extracted from information systems. The methodology for reporting on the status of official languages programs is outlined in Appendix A.
Modernization of the Official Languages Act
In June 2018, the Prime Minister of Canada, the Right Honourable Justin Trudeau, announced that the act would be modernized. Consultations and activities marking the 50th anniversary of the act followed. In March and April 2019, the Minister of Tourism, Official Languages and La Francophonie held 12 round tables and 5 forums in 17 cities across the country on key issues related to official languages, including the sustainability of communities.
These consultations culminated in a symposium on the 50th anniversary of the act, held on May 27 and 28, 2019, by Canadian Heritage, the Department of Justice Canada and TBS. Some 500 stakeholders from official language minority communities, the public sector and political leaders met in Ottawa to examine current challenges and the progress achieved. In total, nearly 1,500 Canadians from across the country had the chance to express their views on the subject.
At the Linguistic Duality Day ceremony on September 12, 2019, Awards of Excellence and Leadership in Official Languages were presented to some 50 recipients to celebrate the 50th anniversary of the act. The awards recognized the efforts of public servants and teams who, in their own way, showed themselves to have been pillars of official languages and who contributed to a culture of bilingualism in the federal public service and for Canadians. The team responsible for the Official Languages (Communications with and Services to the Public) Regulations (the regulations) at the Official Languages Centre of Excellence was among the recipients. Specifically, the award honoured the team’s exceptional work as an ally of official language minority communities in the context of the revision of the regulations.
In addition to those events, TBS continued its close collaboration with its partners, Canadian Heritage and the Department of Justice Canada, in reviewing options for modernizing the act.
The government considered reports from the House of Commons Standing Committee on Official Languages, the Standing Senate Committee on Official Languages and the Commissioner of Official Languages, as well as numerous briefs and proposals from key community and academic stakeholders. The public service analyzed these proposals and considered regulatory and administrative options for modernization.
Modernization must meet three priorities: the compliance of federal institutions with the implementation of the act, the strengthening of Part VII of the act, and the engagement of citizens from the English- and French-speaking linguistic majorities in order to achieve an act that is current and able to meet tomorrow’s challenges and the needs of an increasingly diverse and inclusive society.
Amendments to the Official Languages Regulations
On July 10, 2019, the Honourable Joyce Murray, then President of the Treasury Board and Minister of Digital Government, announced that amendments to the Official Languages (Communications with and Services to the Public) Regulations (the regulations) had been made, providing Canadians with enhanced access to federal services in both official languages.
The regulations define some key provisions of the act that determine which federal offices must provide service in English, in French or in both official languages.
The amendments are the result of extensive consultations with key stakeholders, including official language minority organizations, the Office of the Commissioner of Official Languages, an expert advisory group, parliamentarians and the general public. They better reflect community needs and allow for current and future demographic and technological changes. The regulations, whose renewal was announced in 2016, had not been comprehensively reviewed since their creation in 1991.
The revised regulations:
- adopt a new, more inclusive calculation method for estimating the demand for services in the minority language to better capture the demographic diversity of official language minority communities
- incorporate a qualitative approach to establishing the linguistic designation of federal offices, so that bilingual services are focused on the vitality of official language minority communities
- increase bilingual services for the travelling public
- reflect the availability of new technologies for delivering services in both official languages
“Three years of consultations, collaboration and comments have resulted in the finalization of these amended regulations to better serve Canadians in the official language of their choice. We have listened and worked hard to better reflect today’s technological and demographic realities, especially for official language minority communities.”
The regulatory amendments will result in around 700 newly bilingual offices, increasing the percentage of bilingual federal service locations from 34% to more than 40%.
The amendments will increase bilingual services in a variety of federal institutions that play important roles for linguistic minority communities. For example:
- For the first time, over 145,000 Canadians living outside of major urban centres will have access to a Service Canada office in the official language of their choice, providing them with a wide range of government services and benefits
- More than 60,000 additional people will have access to the RCMP’s public safety and security services in the official language of their choice
- The bilingual designation of offices will be protected, even if the proportion of the local official language minority population (5% threshold) has declined
“Support for official language minority communities and promotion of our two official languages show Canada’s true commitment to diversity and accommodation of minority rights. The new regulations expand bilingual service coverage for Canadians and their families, and reflect extensive feedback from across the country.”
The coming into force of the amendments and their implementation in federal offices will be staggered over four major phases until the winter of 2024. The regulatory amendments are summarized in the Table showing current Regulations vs. proposed amendments, and the anticipated impact of the changes. The table also presents the anticipated impact of the amendments and their effective dates.
Communications with and services to the public
Offices and service locations
The network of public offices and service locations operated by federal institutions spans all provinces and territories, and extends to Canadian offices internationally. The network includes in‑person service, interactive kiosks, toll-free telephone lines, as well as air, ferry and train routes.
TBS has continued to monitor the application of the regulations through the Regulations Management System and provided advice to institutions. As of March 31, 2020, federal institutions had 11,292 offices,Footnote 3 of which 3,854 (34.1%) were required to provide services and communicate with the public in both official languages. This is a decrease of 0.1% from the previous year. While the number of federal offices has decreased since 2010, the proportion of bilingual ones has remained stable.
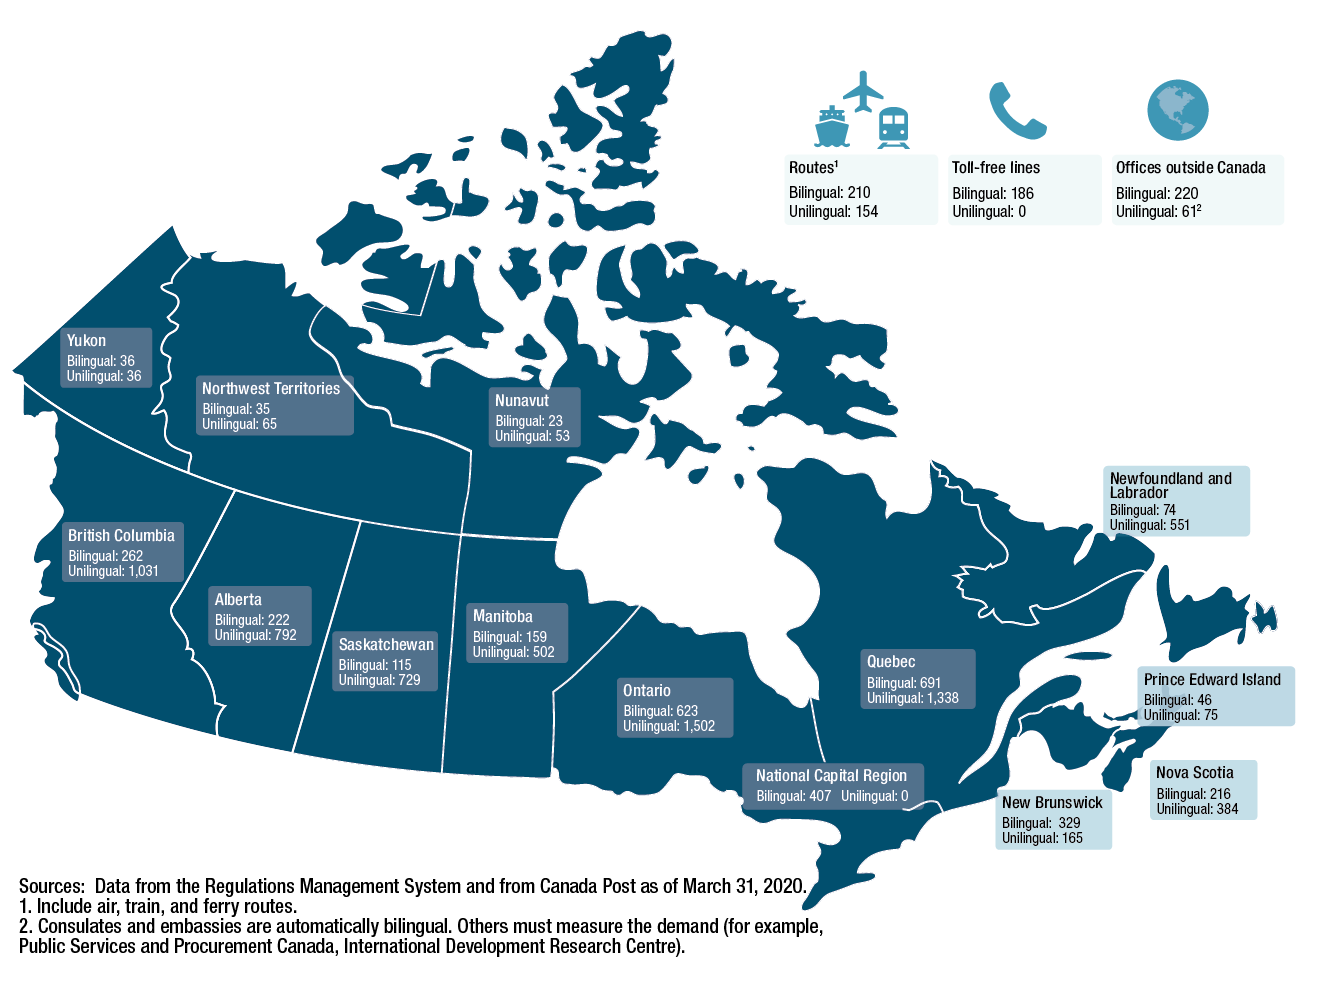
Map 1 - Text version
British Columbia: 262 bilingual offices, 1,031 unilingual; Alberta: 222 bilingual offices, 792 unilingual; Saskatchewan: 115 bilingual offices, 729 unilingual; Manitoba: 159 bilingual offices, 502 unilingual; Ontario: 623 bilingual offices, 1,502 unilingual; National Capital Region: 407 bilingual offices, none unilingual; Quebec: 691 bilingual offices, 1,338 unilingual; New Brunswick: 329 bilingual offices, 165 unilingual; Prince Edward Island: 46 bilingual offices, 75 unilingual; Nova Scotia: 216 bilingual offices, 384 unilingual; Newfoundland and Labrador: 74 bilingual offices, 551 unilingual; Yukon: 36 bilingual offices, 36 unilingual; Northwest Territories: 35 bilingual offices, 65 unilingual; Nunavut: 23 bilingual offices, 53 unilingual; Offices outside Canada: 220 bilingual, 61 unilingual (Consulates and embassies are automatically bilingual. Other offices must measure the demand (for example, Public Services and Procurement Canada, International Development Research Centre)); 186 bilingual toll-free lines, none are unilingual; Routes: 210 bilingual, 154 unilingual (include air, train and ferry routes). Sources: Data from the Regulatory Management System and from Canada Post as of March 31, 2020.
Oral and written communications
For the fiscal year 2019–20, 91% of institutions indicated in their review on official languages that oral communications nearly always occur in the public’s official language of choice (Figure 1a), and 91% said the same for written communications (Figure 1b). The results for large institutions were respectively 90% for both types of communications; for small institutionsFootnote 4 the result was 93% for both oral and written communications.
The combined results (91%) for the oral and written communications indicators for the 56 institutions that submitted a review this year are slightly higher than the target of at least 90% set by TBS in recent years.
By taking into account not only the results from institutions that submitted a review for the fiscal year 2019–20, but also the most recent results available for some 200 institutions subject to the act over the past three fiscal years, the average is 88%.
Figure 1: institutions’ responses to the frequency of oral and written communications in the official language chosen by the public when the office is bilingualFootnote 5
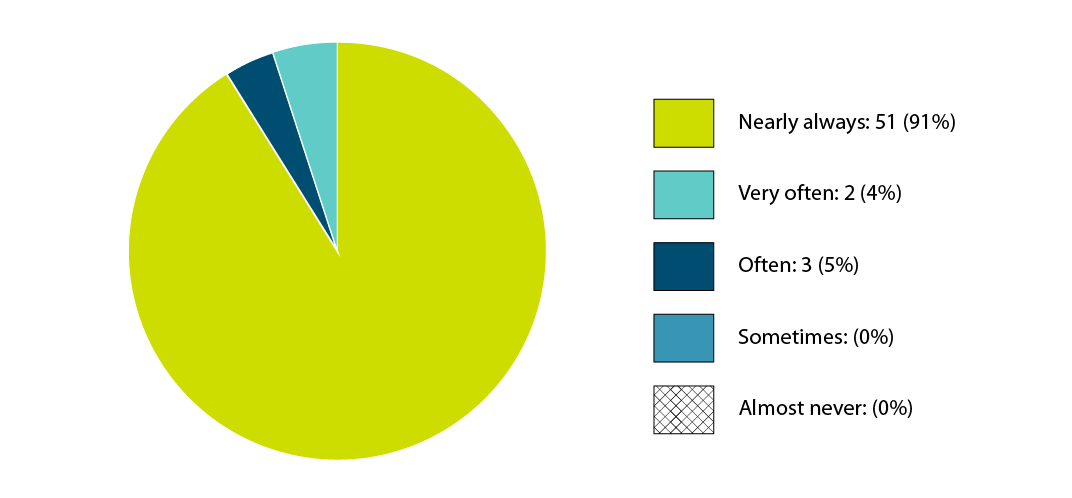
Figure 1a - Text version
| Percentage (%) | Number | |
|---|---|---|
| Nearly always | 91% | 51 |
| Very often | 4% | 2 |
| Often | 5% | 3 |
| Sometimes | 0% | 0 |
| Almost never | 0% | 0 |

Figure 1b - Text version
| Percentage (%) | Number | |
|---|---|---|
| Nearly always | 91% | 51 |
| Very often | 5% | 3 |
| Often | 4% | 2 |
| Sometimes | 0% | 0 |
| Almost never | 0% | 0 |
Active offer
In bilingual offices, federal institutions are required to take measures to ensure active offer when providing services to the public in both official languages. According to the Policy on Official Languages, active offer means that the institution has to “clearly indicate, visually and verbally, that members of the public can communicate with and obtain services from a designated office in either English or French.”
Among all institutions that submitted a review for this fiscal year, 81% indicated that they nearly always take appropriate measures to greet the public in person in both official languages (Figure 2). The percentage is 78% for large institutions and 85% for small institutions.
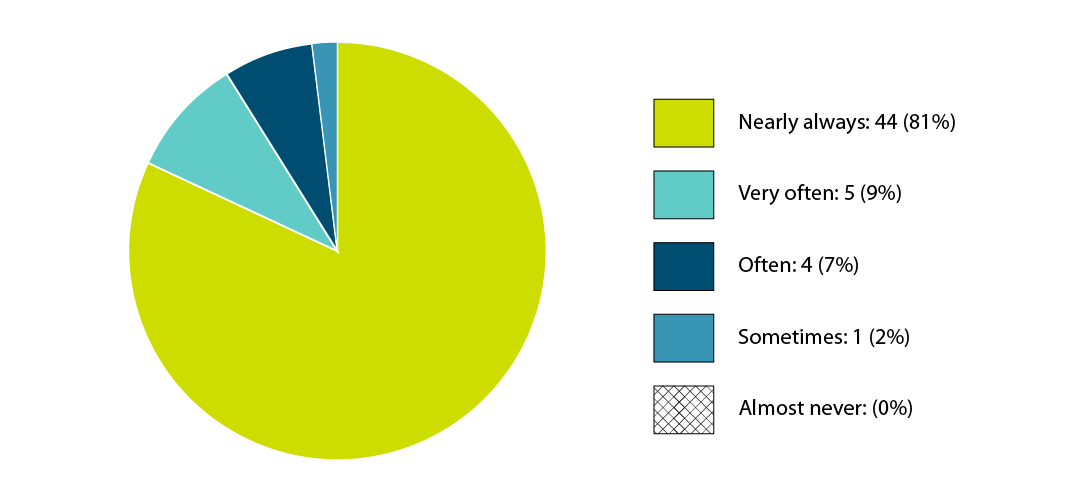
Figure 2 - Text version
| Percentage (%) | Number | |
|---|---|---|
| Nearly always | 81% | 44 |
| Very often | 9% | 5 |
| Often | 7% | 4 |
| Sometimes | 2% | 1 |
| Almost never | 0% | 0 |
According to the Canada Revenue Agency’s annual national monitoring exercise in fiscal year 2019–20, oral communication with the public was available in the official language of the linguistic minority 98% of the time. Written communication with the public was available in both official languages 96% of the time. Visual active offer of bilingual service was compliant 95% of the time, and 82% of the time the bilingual service symbol was easily in view. Active offer of bilingual service by telephone was compliant 83% of the time, 92% of voicemail messages were compliant, and 100% of in-person employee greetings were bilingual. One element of this success is that the Agency has a Taxpayer Bill of Rights, which specifies that taxpayers have the right to receive their service in the official language of their choice.
Outreach
For many members of the public, the main gateway to federal services is Canada.ca, where pages are systematically accessible in both official languages. Ninety-six percent (96%) of institutions indicated that the English and French versions of their websites are nearly always simultaneously posted in full and are of equal quality. This is the case for 97% of large institutions and 96% of small institutions.
In total, 84% of institutions say that offices designated as bilingual nearly always produce and distribute all communications materialFootnote 7 simultaneously and in full in both official languages. Indeed, 86% of large institutions and 81% of small institutions say that this is nearly always the case.
Linguistic clauses
According to the act, federal institutions have the duty to ensure that, where services are provided or made available by another person or organization on its behalf, any member of the public can communicate with and obtain those services from that person or organization in either official language in any case where those services, if provided by the institutions, would be required to be provided in either official language. According to 70% of large institutions, contracts and agreements with third parties acting on behalf of bilingual offices nearly always contain clauses setting out the linguistic obligations that third parties must meet. Fifty-six percent (56%) of these institutions report that these clauses have been complied with.
Substantive equality in communications with and services to the public
Substantive equality is achieved when one takes into account, where necessary, the differences in characteristics and circumstances of minority communities, and provides services with distinct content or using a different method of delivery to ensure that the minority receives services of the same quality as the majority. Federal institutions can apply the principle of substantive equality in communications with and services to the public, for example, by using the analytical grid for federal services and programs in relation to substantive equality. The grid is a tool to help institutions analyze their programs and services to ensure that they meet the principle of substantive equality. Seventy-six percent (76%) of institutions stated that they nearly always respect the principle of substantive equality and 19% said that they often do.
In several examples submitted by institutions, the application of the analytical grid led to the conclusion that it was not necessary to adapt services to the needs of the minority to achieve substantive equality, but rather that it was more appropriate to provide uniform service (such as courts or boards in order to ensure impartiality).
To ensure the principle of substantive equality, a comprehensive data analysis was conducted in 2019 at the Canadian Institutes of Health Research to help identify the needs and areas that require effort to better support Francophone and official language minority community researchers as well as research on those communities. The organization ensured the translation of peer review information for both reviewers and applicants to enhance the peer review process and to ensure that applicant feedback benefits from a diversity of perspectives during the review process.
Summary: communications with and services to the public
| Questions | Nearly always (90% to 100% of cases) | ||
|---|---|---|---|
| Large institutions | Small institutions | All institutions | |
| Oral communications occur in the official language chosen by the public when the office is designated bilingual. |
90% |
93% |
91% |
| Written communications occur in the official language chosen by the public when the office is designated bilingual. |
90% |
93% |
91% |
| All communications material is produced in both official languages and is simultaneously issued in full in both official languages when the material comes from a designated bilingual office. |
86% |
81% |
84% |
| The English and French versions of websites are simultaneously posted in full and are of equal quality. |
97% |
96% |
96% |
| Signs identifying the institution’s offices or facilities are in both official languages at all locations. |
97% |
93% |
95% |
| Appropriate measures are taken to greet the public in person in both official languages. |
78% |
85% |
81% |
| Contracts and agreements with third parties contain clauses setting out the office’s or facility’s linguistic obligations with which the third parties must comply. (question for large institutions only) |
70% |
n/a |
70% |
| The linguistic obligations in the clauses have been met. (question for large institutions only) |
56% |
n/a |
56% |
| Your institution selects and uses advertising media that reach the targeted public in the most efficient way possible in the official language of their choice. (question for large institutions only) |
93% |
n/a |
93% |
| The institution currently provides communications with and services to the public by means of video conferencing. (new question) |
22% |
25% |
24% |
| The institution respects the principle of substantive equality in its communications and services to the public, as well as in the development and assessment of policies and programs. |
79% |
71% |
76% |
Language of work
In this section
Since 1988, the act has set out the language rights of federal employees (Part V). The purpose of the act was to create a federal public service where Anglophones and Francophones have the same opportunities to use the official language of their choice in regions designated as bilingual for language of work purposes.
Despite significant progress over 32 years, challenges remain, particularly with respect to the use of French outside Quebec and English in Quebec as languages of work.
Figure 3 shows that staff at 67% of federal institutions report being nearly always able to prepare documents in the official language of their choice and for 24% of them, it is very often the case.Footnote 9 This is nearly always the case for 64% of large institutions and very often the case for 25% of them. For 71% of small institutions, it is nearly always the case. It is very often the case for 24% of them.
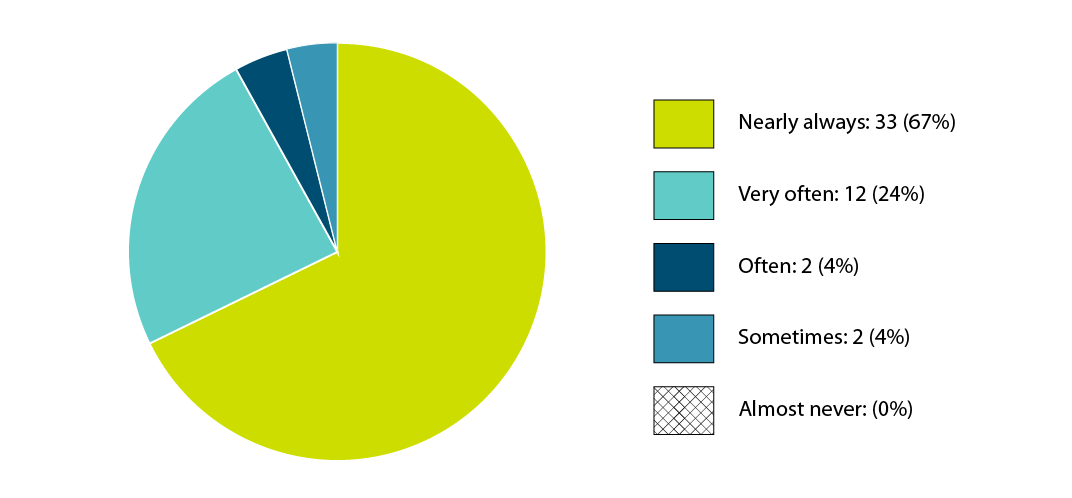
Figure 3 - Text version
| Percentage (%) | Number | |
|---|---|---|
| Nearly always | 67% | 33 |
| Very often | 24% | 12 |
| Often | 4% | 2 |
| Sometimes | 4% | 2 |
| Almost never | 0% | 0 |
Figure 4 shows that, in 54% of institutions, meetings are nearly always conducted in both official languages in regions designated bilingual and it is very often the case for 23% of them. This is nearly always the case for 50% of large institutions and 60% of small institutions. It is very often the case for 25% of large institutions and 20% of small institutions.
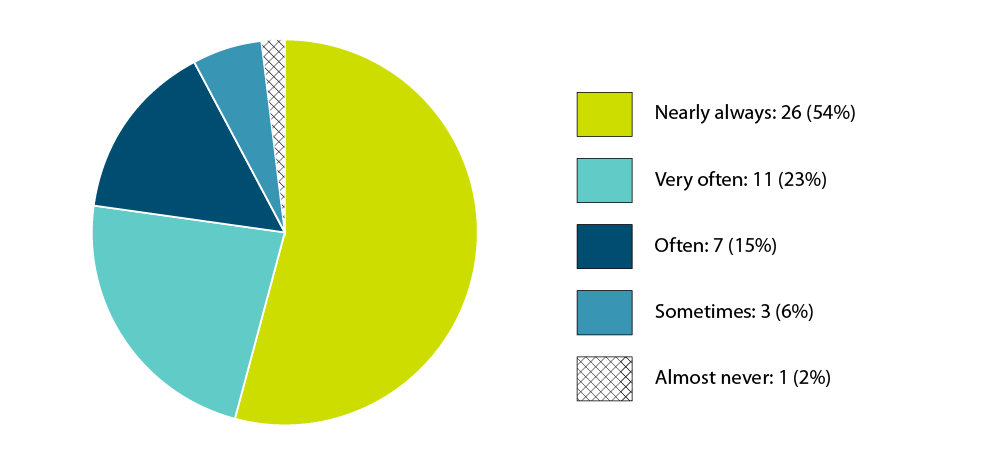
Figure 4 - Text version
| Percentage (%) | Number | |
|---|---|---|
| Nearly always | 54% | 26 |
| Very often | 23% | 11 |
| Often | 15% | 7 |
| Sometimes | 6% | 3 |
| Almost never | 2% | 1 |
Supervision in the employee’s official language
Under the Directive on Official Languages for People Management managers and supervisors “are responsible for supervising employees located in bilingual regions in the official language of the employee’s choice when they occupy bilingual or either/or positions, and in the language of the position when they occupy unilingual positions.”
As shown in Figure 5, 63% of all institutions stated that incumbents in bilingual or either/or positionsFootnote 10 are nearly always supervised in the official language of their choice (61% of large institutions and 65% of small institutions), while 33% of the institutions indicated that it was very often the case (36% of large institutions and 30% of small institutions).
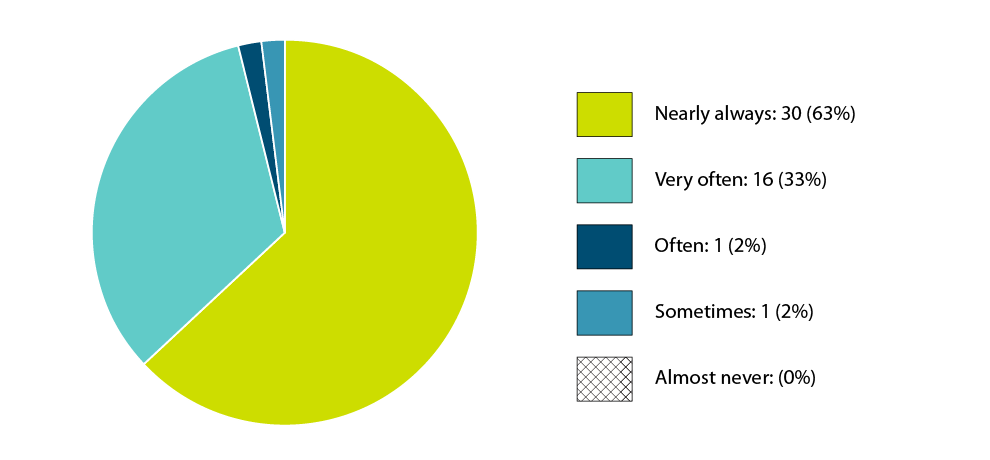
Figure 5 - Text version
| Percentage (%) | Number | |
|---|---|---|
| Nearly always | 63% | 30 |
| Very often | 33% | 16 |
| Often | 2% | 1 |
| Sometimes | 2% | 1 |
| Almost never | 0% | 0 |
Innovation, Science and Economic Development Canada has made substantial efforts to ensure that managerial and supervisory positions are bilingual. Supervisors communicate with employees in the language of their choice during performance appraisals; while providing work objectives, explanations, and guidelines; and when providing access to tools and training. The department is actively promoting tools to its management community and employees to help foster a bilingual workplace that is conducive to the use of both official languages.
Personal and central services
The Directive on Official Languages for People Management indicates that institutions are responsible for “providing personal and central services to employees in bilingual regions in the official language of the employee’s choice.”
According to 94% of institutions that submitted a review, personal and central services are nearly always provided to employees in bilingual regions in the language of their choice, and it is very often the case in the other 6%. A total of 89% of large institutions and 100% of small institutions indicated that this is nearly always the case.
Training and professional development
According to the Directive on Official Languages for People Management, managers and supervisors must ensure that training and professional development services are available to employees in bilingual regions in the official language of their choice. Large institutions reported that their employees nearly always (85%) and very often (12%) obtain training or professional development services in the official language of their choice.Footnote 11 Several institutions said they used the Canada School of Public Service as their source for courses in both official languages.
All training products provided by the Canada Revenue Agency are offered in both official languages, and each employee is required to choose the official language in which they will take a course when they register in the training portal. Outside training over which the Agency has no control is not always available in both official languages, but managers are encouraged to help their employees find options in their preferred official language.
Leadership
The Policy on Official Languages requires that, in regions designated as bilingual, the deputy head ensure that “senior management exercises the leadership required to foster a work environment that is conducive to the effective use of both official languages.”
To increase accountability and recognize leaders who promote and contribute to a bilingual work environment, a question was added to the review last year about executive leadership in order to better understand the current situation in federal institutions. As shown in Figure 6, 60% of all institutions said this year that their executives nearly always communicated in both official languages with their employees on a regular basis. According to 62% of large institutions and 57% of small institutions, executives nearly always did so. Five federal institutions indicated that this was almost never the case, given that all their staff shared the same first official language.
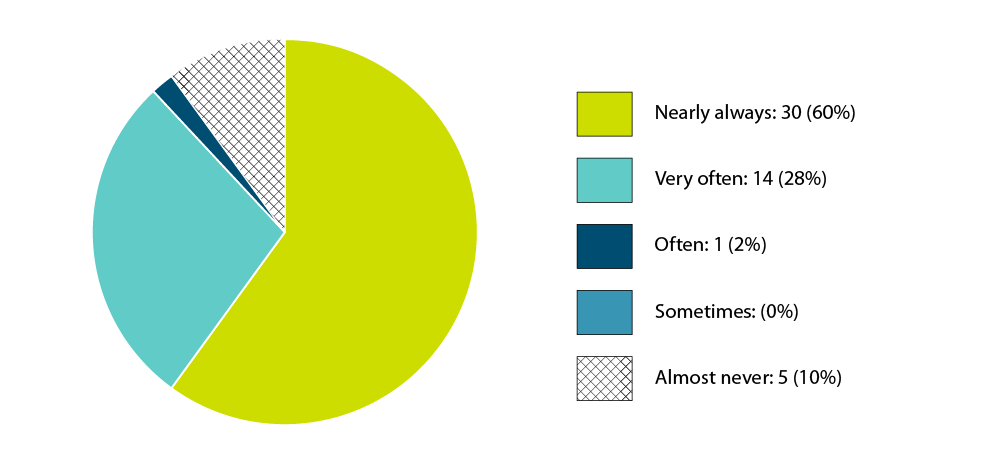
Figure 6 - Text version
| Percentage (%) | Number | |
|---|---|---|
| Nearly always | 60% | 30 |
| Very often | 28% | 14 |
| Often | 2% | 1 |
| Sometimes | 0% | 0 |
| Almost never | 10% | 5 |
At the International Development Research Centre, most senior management communicates regularly in both official languages at town halls, forums, workshops and when posting messages to the Centre’s intranet. The same is true for their communications with employees who report directly to them. In fiscal year 2019–20, the Research Centre’s Leadership charter was implemented. It is an aspirational guide for employees in formal and informal leadership roles, including senior management. Those in formal leadership roles commit to modelling behaviours and fostering an enabling environment, including this one: “I am comfortable in multilingual environments and promote working in the two official languages.”
Summary: language of work
| Questions | Nearly always (90% to 100% of cases) | ||
|---|---|---|---|
| Large institutions | Small institutions | All institutions | |
| In regions designated as bilingual for language of work | |||
| Incumbents of bilingual or either/or positions are supervised in the official language of their choice, regardless of whether the supervisors are located in bilingual or unilingual regions. | 61% | 65% | 63% |
| Personal and central services are provided to employees in bilingual regions in the official language of their choice. | 89% | 100% | 94% |
| The institution offers training to employees in the official language of their choice. (question for large institutions only) | 85% | n/a | 85% |
| Meetings are conducted in both official languages, and employees may use the official language of their choice. | 50% | 60% | 54% |
| Documentation and regularly and widely used work instruments and electronic systems are available to employees in the official language of their choice. (question for large institutions only) | 77% | n/a | 77% |
| Employees can prepare documents in their official language of choice. | 64% | 71% | 67% |
| In unilingual regions | |||
| Regularly and widely used work instruments are available in both official languages for employees who are responsible for providing bilingual services to the public or to employees in bilingual regions. (question for large institutions only) | 88% | n/a | 88% |
| Leadership | |||
| Senior management communicates in both official languages with employees on a regular basis. | 62% | 57% | 60% |
2019 Public Service Employee Survey
The 2019 Public Service Employee Survey, conducted between July 22 and September 6, 2019,Footnote 12 included four questions on the use of official languages. Throughout the public service, the responses to the three recurring questions from 2014 and 2017 remained relatively stable.Footnote 13 However, in regions designated bilingual for language of work purposes, the results for these questions revealed perceived successes and shortcomings where employees had language rights. Specifically, there was both a decrease in negative responses and an increase in “strongly agree” responses among Francophones across all three recurring questions.Footnote 14 Among Anglophones, the responses were stable.
Ninety-three percent (93%) of employees indicated that when they communicate with their immediate supervisor, they feel free to do so in the official language of their choice, which is identical to the 2017 result (93%). In regions designated bilingual, 90% of Francophones stated that when they communicate with their immediate supervisor, they feel free to do so in the official language of their choice, which is the case for 96% of Anglophones. This result for Francophone employees represents a small improvement, compared to 88% in 2017. The figure for Anglophone employees has remained the same since that time. Thirteen percent (13%) of Francophones in Northern Ontario and 7% in the National Capital Region gave negative responses to the question.

Figure 7 - Text version
In New Brunswick, 93% of Francophones provided positive answers; 3%, neutral answers; and 4%, negative answers. In the Montreal region, 96% of Francophones provided positive answers; 2%, neutral answers; and 1%, negative answers. In other Quebec bilingual regions, 97% of Francophones provided positive answers; 2%, neutral answers; and 1%, negative answers. In Northern Ontario, 80% of Francophones provided positive answers; 7%, neutral answers; and 13%, negative answers. In Eastern Ontario, 84% of Francophones provided positive answers; 7%, neutral answers; and 9%, negative answers. In the National Capital Region, 88% of Francophones provided positive answers; 5%, neutral answers; and 7%, negative answers.
In New Brunswick, 96% of Anglophones provided positive answers; 3%, neutral answers; and 1%, negative answers. In the Montreal region, 92% of Anglophones provided positive answers; 3%, neutral answers; and 5%, negative answers. In other Quebec bilingual regions, 82% of Anglophones provided positive answers; 7%, neutral answers; and 11%, negative answers. In Northern Ontario, 94% of Anglophones provided positive answers; 4%, neutral answers; and 2%, negative answers. In Eastern Ontario, 93% of Anglophones provided positive answers; 4%, neutral answers; and 3%, negative answers. In the National Capital Region, 96% of Anglophones provided positive answers; 3%, neutral answers; and 1%, negative answers.
Work unit meetings, however, show opportunities for improvement: only 76% of Francophones say that they feel free to use the official language of their choice during team meetings, while 93% of Anglophones say the same thing. Those results are identical to those of the 2017 Public Service Employee Survey. Twenty-two percent (22%) of Francophones in Northern Ontario and 18% in the National Capital Region gave negative responses to this question, as did 25% of English speakers from the Quebec bilingual regions outside Montréal.

Figure 8 - Text version
In New Brunswick, 83% of Francophones provided positive answers; 7%, neutral answers; and 10%, negative answers. In the Montreal region, 86% of Francophones provided positive answers; 6%, neutral answers; and 8%, negative answers. In other Quebec bilingual regions, 91% of Francophones provided positive answers; 4%, neutral answers; and 5%, negative answers. In Northern Ontario, 65% of Francophones provided positive answers; 13%, neutral answers; and 22%, negative answers. In Eastern Ontario, 76% of Francophones provided positive answers; 9%, neutral answers; and 15%, negative answers. In the National Capital Region, 73% of Francophones provided positive answers; 9%, neutral answers; and 18%, negative answers.
In New Brunswick, 93% of Anglophones provided positive answers; 5%, neutral answers; and 2%, negative answers. In the Montreal region, 83% of Anglophones provided positive answers; 6%, neutral answers; and 11%, negative answers. In other Quebec bilingual regions, 65% of Anglophones provided positive answers; 10%, neutral answers; and 25%, negative answers. In Northern Ontario, 92% of Anglophones provided positive answers; 6%, neutral answers; and 3%, negative answers. In Eastern Ontario, 91% of Anglophones provided positive answers; 5%, neutral answers; and 4%, negative answers. In the National Capital Region, 94% of Anglophones provided positive answers; 4%, neutral answers; and 2%, negative answers.
Public servants were also asked whether, when they draft documents, including emails, they feel free to do so in the official language of their choice. Eighty-seven percent (87%) of employees throughout the public service responded in the affirmative, compared to 86% in 2017. Under the Directive on Official Languages for People Management, managers and supervisors have a responsibility to take all possible steps to create and maintain a work environment that allows employees in bilingual regions to use the official language of their choice for any oral and written communication. Within those regions, it is expected that employees in bilingual positions will work in both official languages.

Figure 9 - Text version
Amongst Anglophones in bilingual positions, 92% provided positive answers and 5%, negative answers. Amongst Anglophones in English unilingual positions, 92% provided positive answers and 2% provided negative answers. Amongst Anglophones in either/or positions, 80% provided positive answers and 2% provided negative answers.
Amongst Francophones in bilingual positions, 72% provided positive answers and 19%, negative answers. Amongst Francophones in French unilingual positions, 87% provided positive answers and 6% provided negative answers. Amongst Francophones in either/or positions, 78% provided positive answers and 14% provided negative answers.
A new question on official language use has been integrated into the survey. Respondents were asked whether senior executives in their department or agency use both official languages in their interactions with employees.Footnote 15 Eighty-three percent (83%) of Anglophone respondents and 75% of Francophone respondents in these regions responded in the affirmative. While 17% of Francophone public servants in Northern Ontario provided negative answers to that question, 19% of Anglophones from the bilingual regions in Quebec, excluding the Greater Montréal, answered negatively.

Figure 10 - Text version
In New Brunswick, 85% of Francophones provided positive answers; 10%, neutral answers; and 5%, negative answers. In the Montreal region, 81% of Francophones provided positive answers; 13%, neutral answers; and 6%, negative answers. In other Quebec bilingual regions, 82% of Francophones provided positive answers; 13%, neutral answers; and 5%, negative answers. In Northern Ontario, 67% of Francophones provided positive answers; 15%, neutral answers; and 17%, negative answers. In Eastern Ontario, 71% of Francophones provided positive answers; 13%, neutral answers; and 15%, negative answers. In the National Capital Region, 73% of Francophones provided positive answers; 16%, neutral answers; and 10%, negative answers.
In New Brunswick, 84% of Anglophones provided positive answers; 10%, neutral answers; and 6%, negative answers. In the Montreal region, 79% of Anglophones provided positive answers; 13%, neutral answers; and 8%, negative answers. In other Quebec bilingual regions, 60% of Anglophones provided positive answers; 21%, neutral answers; and 19%, negative answers. In Northern Ontario, 80% of Anglophones provided positive answers; 11%, neutral answers; and 9%, negative answers. In Eastern Ontario, 76% of Anglophones provided positive answers; 15%, neutral answers; and 9%, negative answers. In the National Capital Region, 83% of Anglophones provided positive answers; 12%, neutral answers; and 4%, negative answers.
According to the Directive on Official Languages for People Management, deputy heads or their delegates are responsible, based on available resources, for providing language training for employees who want to develop their second language skills to advance their careers and possibly hold bilingual positions in the future.
Employees were asked to identify the most significant factors that had adversely affected their career progression in the public service over the past 12 months. They are, in order: the lack of opportunities for advancement in their region (20%), lack of access to professional development programs (16%), lack of access to learning opportunities (12%), and lack of access to language training in their second official language (12%). The lack of access to language training is an issue for 13% of Anglophone public servants and 8% of Francophone public servants.
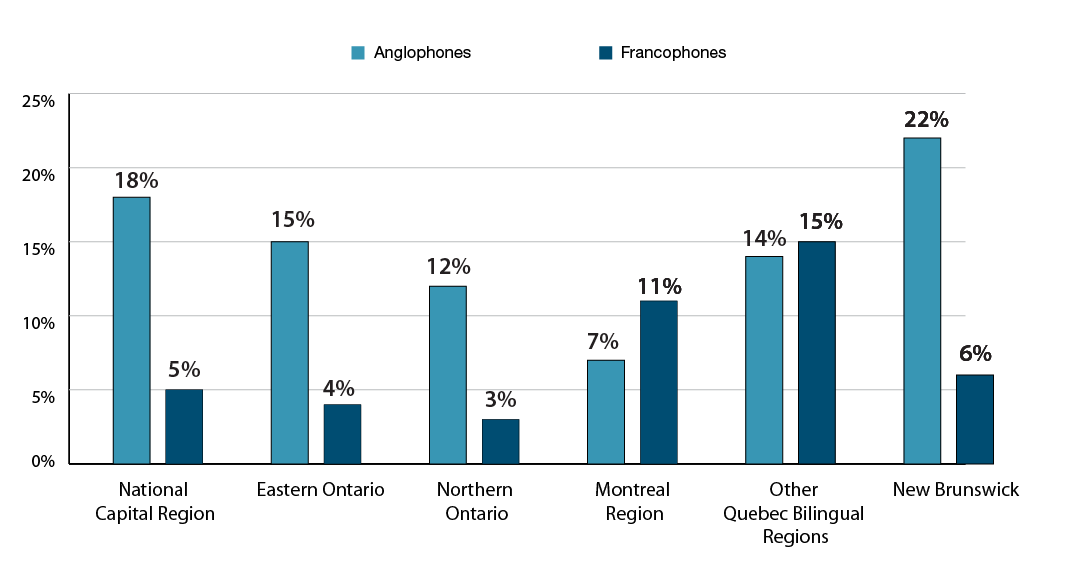
Figure 11 - Text version
In the National Capital Region, it is the case for 18% of Anglophones and 5% of Francophones; in Eastern Ontario, it is the case for 15% of Anglophones and 4% of Francophones; in Northern Ontario, it is the case for 12% of Anglophones and 3% of Francophones; in the Montreal Region, it is the case for 7% of Anglophones and 11% of Francophones; in other Quebec bilingual regions, it is the case for 14% of Anglophones and 15% of Francophones. Finally, it is the case for 22% of Anglophones in New Brunswick, and 6% of Francophones.
Women’s responses to all survey questions on the use of official languages were more positive compared to those of men and even more so when compared with the responses of those who are gender diverse. The gap between Francophone women and Francophone gender diverse people reaches up to 19 percentage points for the question concerning work unit meetings and the one on document drafting. Twenty-three percent (23%) of Anglophone gender diverse people said they had no access to language training in their second language.
In the five questions on the use of official languages, respondents with disabilities said they were less satisfied than those who identified no disabilities, among both Anglophones and Francophones. Lack of access to language training in the second language is seven percentage points higher among Anglophones with disabilities and three percentage points higher among Francophones with disabilities.
The differences in perception between Indigenous and other employees are less than three percentage points with respect to official languages, except for the question on senior executives, where, among Anglophones, the gap is 12 percentage points. The perception of members of visible minorities in this area is better than for the majority, among both Anglophones and Francophones, but as for all employees, the satisfaction indicators are lower for Francophones than Anglophones. The differences are never higher than four percentage points.
The variations between heterosexual and gay or lesbian respondents, bisexual respondents, or those with another sexual orientation are less than five percentage points in the two respective official language groups.
This data will enable TBS to better target its interventions with federal departments and agencies, engage in dialogue and chart courses of action.
Follow up to the Report on Language of Work

Progress has been made in implementing the recommendations of the report to the Clerk of the Privy Council entitled The Next Level: Normalizing a culture of inclusive linguistic duality in the federal public service workplace. When he released it in 2017, the Clerk mandated the Committee of Assistant Deputy Ministers on Official Languages to oversee the implementation of the report’s recommendations.
A dashboard detailing the progress achieved for each of 14 categories of recommendations is updated regularly on the Language Portal of Canada. The following paragraphs highlight recent progress achieved on some initiatives.
- On September 12, 2019 on the occasion of Linguistic Duality Day, the Translation Bureau launched the Official Languages Hub, a single window that coordinates the dissemination and sharing of official languages resources. The project is a collaboration between TBS, Canadian Heritage, the Canada School of Public Service, the Public Service Commission of Canada, the Council of the Network of Official Languages Champions and the Office of the Commissioner of Official Languages. The tool is intended to help public servants and the Canadian public to simultaneously search a multitude of resources from different Government of Canada departments and agencies. It is hosted on the website of the Language Portal of Canada.
- In order for executives to show leadership and increase the use of both official languages in the workplace, since April 1, 2020, the Treasury Board Directive on Performance and Talent Management for Executives has required executives in bilingual positions to have valid second language assessment results before being considered ready for promotion, or ready for lateral transfer into another position at the same level.
- In 2019, around 900 employees of Natural Resources Canada participated in a study led by TBS on the use of both official languages in the workplace, based on two assessment frameworks: the Canadian Language Benchmarks and the Common European Framework of Reference for Languages. The results confirmed the need to assign more importance to oral comprehension as a receptive language skill as this has the potential to both help employees participate fully in bilingual meetings and lower linguistic anxiety.
Participation of English-speaking and French-speaking Canadians
Part VI of the act states that, while respecting the merit principle, the Government of Canada is “committed to ensuring that English‑speaking Canadians and French-speaking Canadians … have equal opportunities to obtain employment and advancement in federal institutions; and [that] the composition of the workforce of federal institutions tends to reflect the presence of both the official language communities of Canada, taking into account the characteristics of individual institutions, including their mandates, the public they serve and their location.”
As of March 31, 2020, the participation rate in the core public administrationFootnote 16 was 69.1% for English speakers and 30.9% for Francophones. In all institutions subject to the act, the participation rate was 74.4% for English speakers and 25.6% for Francophones (see Table 22 in Appendix D).
According to data from the 2016 census of the population, 75.4% of the Canadian population have English as their first official language and 22.8% have French. Based on a comparison between the 2020 participation rates cited above and the most recent data from the 2016 census of the population, representation of employees from both official language communities is broadly proportional in all federal institutions subject to the act, with some regional variations.
The proportion of individuals who belong to official language minority communities and work in federal institutions is equal to or surpasses their proportion in the general population in each province and territory. However, English-speaking Quebecers outside the National Capital Region make up only 11.3% of the core public administration, although they make up 13.7% of the province’s population. See Table 13 in Appendix D for a breakdown of the participation rates of English and French speakers in the core public administration, by province, territory or region.
A question regarding the representativeness of the two linguistic groups was added to the official languages reviews of large institutions. Ninety-three percent (93%) of these institutions report that they took steps during the fiscal year 2019–20 to ensure that their workforce tended to reflect the composition of the two official language communities in Canada, based on their mandate, target audience and the location of their offices.
Federal institutions reported taking part in job fairs at post-secondary institutions frequented by members of official language minority communities. Some institutions ensure that job advertisements appear in minority community media, and others use social media and recruitment platforms in both languages to reach all potential candidates across the country.
Despite being highly decentralized and mostly located on the east and west coasts of Canada, Fisheries and Oceans Canada’s workforce closely reflects the composition of the Canadian population that it serves. The department used minority media to advertise employment opportunities and all postings were published in both official languages on the Government of Canada’s job search site. National recruitment campaigns were advertised in both official languages and candidates were informed of their language rights during the selection process.
Summary: equitable participation
| Question | Yes |
|---|---|
| Large institutions | |
| Measures have been taken in the fiscal year 2019–20 to ensure that the institution’s workforce tends to reflect the composition of the two official language communities in Canada, based on the 2016 Census of Population, taking into account its mandate, the public served and the location of its offices. | 93% |
Human resources management
The Treasury Board Policy on Official Languages sets out people management requirements for institutions. Institutions also regularly reach out to the Official Languages Centre of Excellence for advice on official languages requirements.
Institutions adopt various practices to ensure that they have the bilingual human resources capacity to provide services to the public and employees in both official languages. For the fiscal year 2019–20, 73% of the 26 large institutions that submitted an official languages review stated that they nearly always have the resources they need to meet their linguistic obligations as they relate to service to the public and language of work. It is very often the case for 12% of them.
When asked whether administrative measures are taken to ensure that bilingual duties are carried out and that services are provided to the public and employees in the official language of their choice when required by Treasury Board policies, 87% of institutions reported that such measures are nearly always taken, including 83% of large institutions and 92% of small institutions.
Figure 12 shows how the large institutions, based on their reviews, ensure that they have the capacity to meet their linguistic obligations.
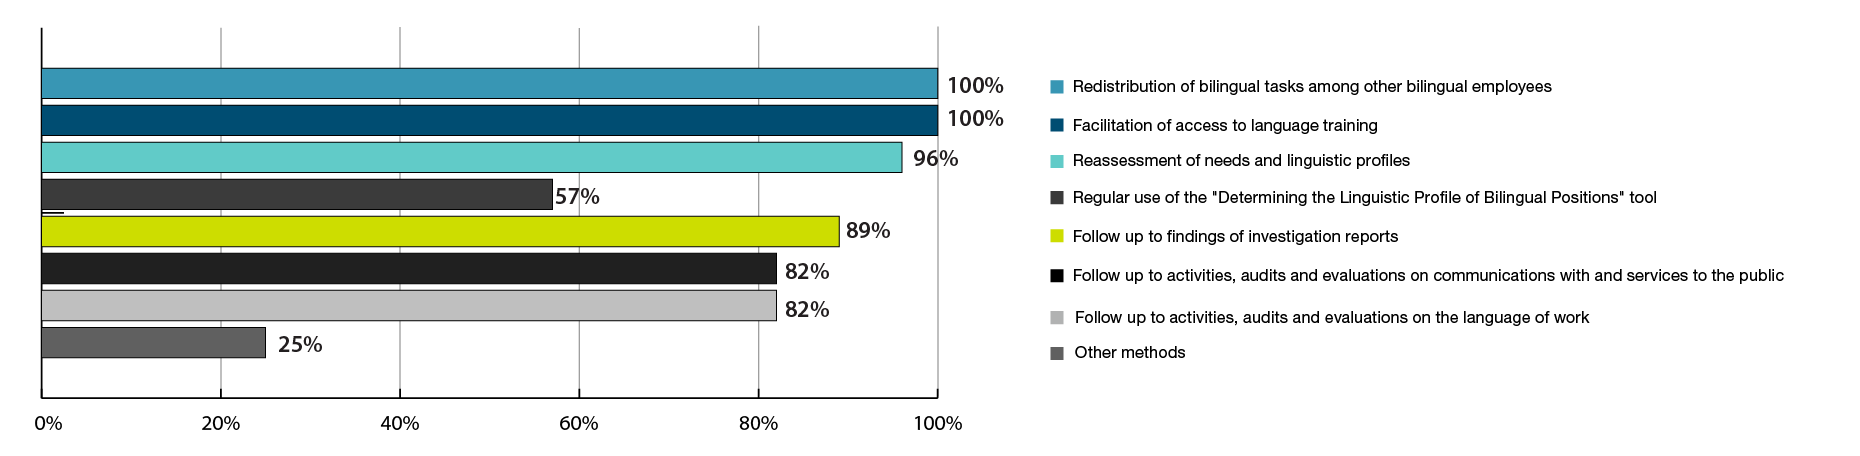
Figure 12 - Text version
| Reassessment of needs and linguistic profiles | 96% |
|---|---|
| Distributing bilingual tasks among other bilingual employees | 100% |
| Facilitating access to language training | 100% |
| Regularly using the “Determining the Linguistic Profile of Bilingual Positions” tool | 57% |
| Follow-up to findings of investigation reports | 89% |
| Follow-up to activities, audits and evaluations on communications with and services to the public | 82% |
| Follow-up to activities, audits and evaluations on the language of work | 82% |
| Other methods | 25% |
According to 85% of institutions, the language requirements of bilingual positions are nearly always established objectively. Linguistic profiles reflect the duties of employees and take into account the linguistic obligations related to services to the public and language of work.
Several institutions say they use or draw on the “Determining the Linguistic Profile of Bilingual Positions” tool developed by TBS.
At the Canadian Dairy Commission, the Human Resources unit always ensured that the language requirements for each new staffing process are discussed with managers prior to posting. This discussion allowed them to determine whether the current language level/profile is still appropriate and meets the appropriate level for the position being staffed. The Linguistic Profile of Bilingual Positions Tool from TBS is used at times to ensure that managers from the organization are determining the correct level for each position. When the Commission completed its most recent reclassification exercise for their audit section, HR reviewed each position to determine whether any changes needed to be made. They also ensured that each division within the organization has a variety of language levels in order to provide quality service to clients in both official languages.
Section 91 of the act specifies that official language requirements during staffing processes must be established objectively. Section 6.2 of the Treasury Board Directive on Official Languages for People Management lists the requirements for the linguistic identification of positions.
Following a series of complaints to the Commissioner of Official Languages, a new question on section 91 was added to in the official languages review for the fiscal year 2019–20 to help TBS identify any problems in this area. Results show that 96% of institutions, including all the large institutions, and 92% of small institutions, stated that they objectively review the linguistic identification of each position during human resources activities.
Also, 96% of institutions indicated that staffing processes triggered a review of the linguistic requirements of positions during the year, 89% indicated that it was a reorganization that triggered it and 68% said that reclassification was the trigger for a review of the linguistic requirements of positions.
To alleviate the number of official languages complaints and to ensure that the language skills required to supervise employees in regions designated bilingual for language-of-work purposes are adequate, during the reporting period, the RCMP’s Official Languages Directorate developed and disseminated guidelines for determining the language requirements of supervisory positions in bilingual regions. These guidelines, intended for managers, human resources professionals and official languages specialists, are designed to guide them in establishing the language requirements of positions in bilingual regions and in ensuring that profiles are established accurately and objectively.
Of all the institutions that submitted a review and that have bilingual positions, 70% nearly always recruit candidates for those positions who are already bilingual at the time of their appointment. This is nearly always the case for 72% of large institutions and 68% of small institutions that have bilingual positions.
As part of the strategy to attract and retain talent, Natural Resources Canada provided managers with the flexibility to make appointments on a non-imperative basis. These appointments are closely monitored and follow up is conducted to ensure that language training is being offered.
Of the 27 large institutions that answered this question in the review, 67% indicated that they nearly always provide their employees with language training for career advancement.
Air Canada offered various language training programs to help employees reach the required language level, maintain their language competencies, or improve the oral and written skills of administrative staff. Various tools were also made available to employees, including an online training module developed by the Linguistic Services team (accessible from various platforms such as tablets or smartphones) consisting of an airline vocabulary, a quick reference card, a booklet with terminology specific to employee tasks, and examples of responses to use.
Since January 2020, all employees at Shared Services Canada who have requested language training have been provided with such training. Subject to available funding, all employees are considered on an equal footing when it comes to language training for career advancement purposes. This decision originated from dialogue sessions on official languages held by Shared Services Canada’s Ombudsman between September and November 2019.
In fiscal year 2019–20, Public Services and Procurement Canada invested approximately $2.6 million in language training, benefitting 1,727 employees. The department has a Second Language Scholarship Program for career advancement. This initiative offers 10 second-language scholarships per year, for up to 250 hours of individual language training, to indeterminate employees across the department, who are members of three designated employment equity groups, specifically Indigenous peoples, visible minorities and persons with disabilities.
Summary: human resources management
| Questions | Nearly always (90% to 100% of cases) | ||
|---|---|---|---|
| Large institutions | Small institutions | All institutions | |
| Overall, the institution has the necessary resources to meet its linguistic obligations relating to services to the public and language of work. (question for large institutions only) | 73% | n/a | 73% |
| The language requirements of bilingual positions are established objectively. Linguistic profiles reflect the duties of employees or their work units and take into account the linguistic obligations with respect to service to the public and language of work. | 76% | 96% | 85% |
| The institution objectively reviews the linguistic identification of positions during human resources activities such as staffing actions, reorganizations or reclassifications. (question for large institutions only) | 100% | 92% | 96% |
| Bilingual positions are staffed by candidates who are bilingual upon appointment. | 72% | 68% | 70% |
| If a person is not bilingual, administrative measures are taken to ensure that the public and employees are offered services in the official language of their choice, as required by Treasury Board policies. | 83% | 92% | 87% |
| Language training is provided for career advancement. (question for large institutions only) | 67% | n/a | 67% |
| The institution provides working conditions conducive to the use and development of the second-language skills of employees returning from language training and, to that end, gives employees all reasonable assistance to do so, particularly by ensuring that they have access to the tools necessary for learning retention. (question for large institutions only) | 59% | n/a | 59% |
Governance of official languages
The Policy on Official Languages requires that each federal institution have an official languages unit, a person responsible for official languages and a champion of official languages. The champion and the person responsible for official languages play key roles in their institution to implement and promote obligations as they relate to official languages.
In 92% of large institutions, the champion or co-champions and the persons responsible for Parts IV, V, VI and VII of the act meet regularly to discuss official languages issues.
An internal official languages committee or network is another mechanism that many institutions use to foster coordinated implementation of their official languages program. Of the 28 large institutions that submitted a review, 23 have established an official languages committee, network, or working group made up of representatives from different sectors or regions, which meets regularly (70%) or occasionally (26%) to deal horizontally with issues related to linguistic obligations.
Under the auspices of the departmental Official Languages Champion and Co-Champions, the Official Languages Discussion Network included representatives from all Innovation, Science and Economic Development Canada sectors and regions. This network frequently met to discuss official languages challenges, initiatives and departmental priorities. The network is used as a catalyst to promote linguistic duality within the department; it also serves as a vehicle for integrating components of the Official Languages Program into departmental processes. In addition, the Official Languages Discussion Network ensured employee awareness, promoted activities and discussed official languages policies.
The role of the official languages champion is to provide leadership on official languages issues, particularly at the senior management committee of their institution. This year, the reviews showed again that official languages issues are discussed by senior management in most institutions. For all large institutions, linguistic obligations are regularly (57%) or sometimes (43%) on the senior management committee’s agenda.
Health Canada has a dynamic network of branch Official Languages Coordinators and Champions and a departmental Champion. Each branch is represented by an Official Languages Coordinator and Champion. All Branch Coordinators and the Departmental Champion meet on a quarterly basis to ensure proper coordination of official languages activities within the department. The Departmental Champion is the official languages ambassador for the department and exercises leadership with members of the Branch Executive Committee so that official languages are incorporated into the regular activities of the organization. Official Languages Coordinators help increase official languages visibility within their respective branch and/or region through awareness activities, such as information sessions, promotion of events and tools, and dissemination of brochures, posters and more.
Finally, 65% of institutions have performance agreements that include objectives related to the implementation of Parts IV, V, VI and VII of the act. Such agreements exist for 90% of large institutions and 36% of small institutions. Performance objectives are often directed at executives only and sometimes at managers and supervisors. Following an amendment to the Directive on Performance and Talent Management for Executives, they are aimed at keeping executives’ second language evaluation results up to date.
For the fiscal year 2019–20, performance agreements for Employment and Social Development Canada’s executives holding bilingual positions in regions designated as bilingual for language of work purposes included the following mandatory commitment: “I will keep my second language evaluation results up to date, demonstrate my language skills using both official languages often, and identify concrete measures to increase the use of both official languages within my team.”
Summary: governance
| Questions | Yes or regularly |
|---|---|
| Taking into consideration the size and mandate of the institution, performance agreements include performance objectives related to the implementation of Parts IV, V, VI, and VII (section 41) of the Official Languages Act, as appropriate. |
65% |
| Obligations arising from Parts IV, V, VI, and VII (section 41) of the Official Languages Act are on the senior management committee’s agenda. (question for large institutions only) |
57% |
| The champion or co-champions and the person or persons responsible for Parts IV, V, VI and VII (section 41) of the Official Languages Act meet to discuss the official languages files (question for large institutions only) |
92% |
| An official languages committee, network or working group made up of representatives from the different sectors or regions of your institution holds meetings to deal horizontally with questions related to Parts IV, V, VI, and VII (section 41) of the Official Languages Act. (question for large institutions only) |
70% |
Monitoring
Providing services to Canadians and to federal employees in the language of their choice and maintaining a work environment that is conducive to the use of both official languages would only be aspirational if institutions did not monitor the implementation of their official languages programs. Monitoring allows institutions to take stock of their progress and report on it to TBS and parliamentarians through official language reviews and relevant supporting evidence.
Of all the institutions that submitted a review, 46 (84%) stated that they regularly take measures to ensure that employees are aware of obligations related to various parts of the act. This is the case for 90% of large institutions and 77% of small institutions.
To celebrate the 50th anniversary of the Official Languages Act and promote Linguistic Duality Day, the Financial Consumer Agency of Canada launched its first, multi-channel official languages awareness campaign. Over the course of three weeks, key messages and supporting tools and resources pointing out requirements with respect to the act were communicated to all employees as a measure to ensure employee awareness across the organization. A second campaign was also planned and partially launched during the Rendez-vous de la Francophonie, but was suspended halfway through due to the response to the COVID-19 pandemic. At the branch level, onboarding of new employees emphasizes the right to work in their language of choice and the importance of providing bilingual services. Information and tools that facilitate bilingual meetings, bilingual greetings, active offer and other official languages topics and resources of interest are promoted to all employees on the intranet.
Institutions have several mechanisms to verify the quality and availability of services in both official languages. During the fiscal year, 71% of all institutions, including 90% of large institutions and 50% of small institutions, conducted activities to measure the availability and quality of services offered to the public in both official languages. Figure 13 shows the methods used by institutions for these activities.
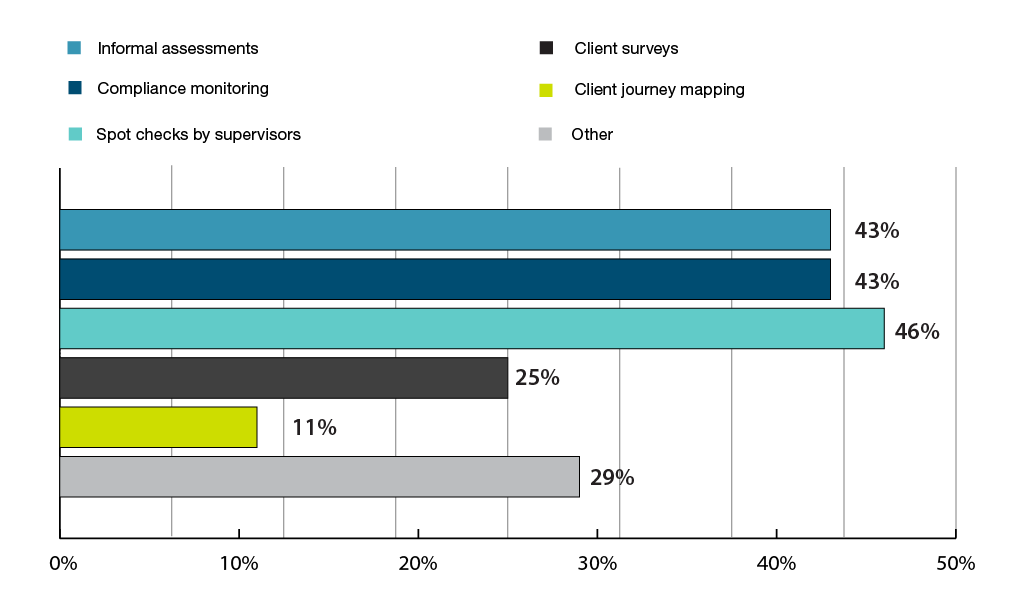
Figure 13 - Text version
| Informal assessments | 43% |
|---|---|
| Compliance monitoring | 43% |
| Spot checks by supervisors | 46% |
| Client surveys | 25% |
| Client journey mapping | 11% |
| Other | 29% |
Canada Post indicated that it is firmly committed to providing quality communications and services to Canadians in both official languages. To this end, Canada Post implements various measures to ensure that oral communications occur in the official language chosen by the public, such as customer satisfaction surveys, quarterly audits and twice-yearly reminders to the bilingual network of post offices. In 2019, a visual aid reminder (Hello/Bonjour and Bonjour/Hello stickers) was produced and sent to every bilingual office to be affixed to all point-of-sale screens.
With respect to language of work, many institutions used the results of the 2019 Public Service Employee Survey to measure the use of official languages in the workplace. However, institutions are not limited to using the Public Service Employee Survey. In fact, 81% of institutions, including 60% of small institutions and 96% of large institutions, have carried out activities periodically to measure whether employees in regions designated as bilingual for language of work purposes can use the official language of their choice in the workplace. Some institutions conduct their own internal surveys or use other mechanisms, as is demonstrated by the following results. Figure 14 shows the activities used by institutions.
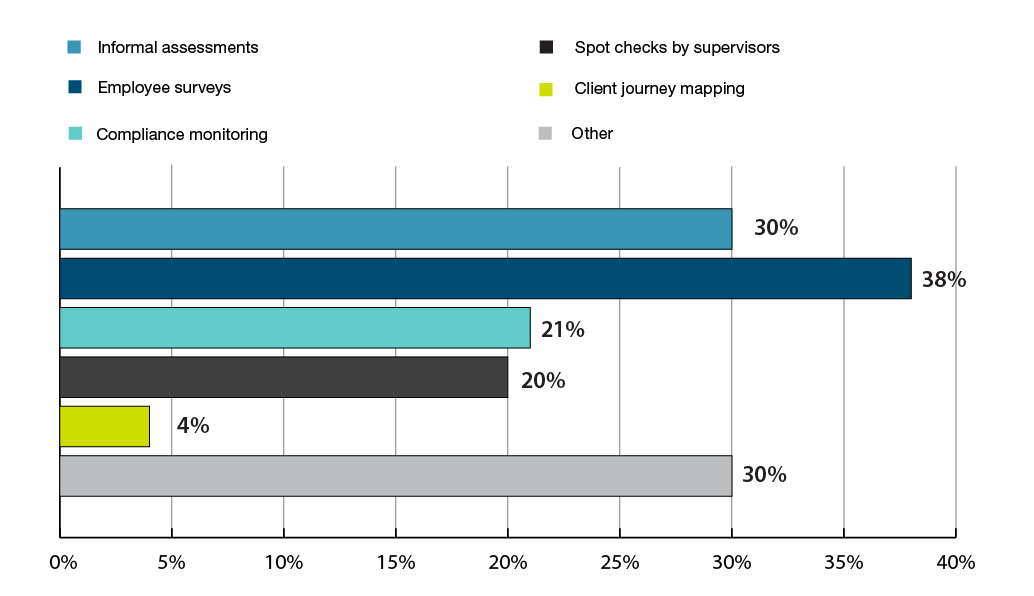
Figure 14 - Text version
| Informal assessments | 30% |
|---|---|
| Employee surveys | 38% |
| Compliance monitoring | 21% |
| Spot checks by supervisors | 20% |
| Client journey mapping | 4% |
| Other | 30% |
Every second year, the RCMP conducted a survey on language of work. The purpose of this survey was to determine how employees perceive the RCMP’s efforts to maintain a bilingual work environment, and the degree to which the RCMP complies with Part V on Language of Work of the Official Languages Act. The results of this survey enabled the RCMP to improve the services it provides to its employees with respect to language of work rights. All employees occupying a position in regions designated as bilingual for language of work purposes were invited to complete the survey. The RCMP language of work survey conducted in January 2020 revealed, among other things, that the vast majority of respondents felt that their workplace encourages the use of both English and French (74%).
Based on the responses, 71% of institution respondents, including 48% of small institutions and 89% of large institutions, have mechanisms in place to determine whether their decisions have an impact on the implementation of the act. Such decisions might be related to adopting or revising a policy, creating or eliminating a program, or establishing or closing an office. Some institutions mentioned the use of the Official Language Requirements and Checklist, a systematic analysis of impacts on official languages that accompanies Treasury Board submissions for these types of initiatives, in consultation with their internal official languages team. When the summary analysis reveals an impact, they perform a more in-depth analysis that they attach to the submission. These analyses are reviewed by analysts at TBS.
At Employment and Social Development Canada, three Centres of Expertise ensured that Parts IV, V, VI, VII and section 91 of the Official Languages Act are implemented and offered advice on the application of the act. They participated, for example, in the first steps when Cabinet documents are developed. This exercise helped to better define the purpose of the project, understand issues and inform stakeholders about the act’s linguistic obligations. The three Centres of Expertise then reviewed the draft memoranda to Cabinet and Treasury Board submissions to ensure compliance with official language obligations when new programs or services are developed or existing ones are changed. If applicable, they recommended adding specific official languages analyses and considerations to ensure compliance with the act and various court judgments (such as the CALDECH case). To determine the impact of decisions made by the department following a change to the bilingual service delivery network, the department held consultations with official language minority communities, pursuant to its own Directive on Official Languages Obligations in Bilingual Service Canada Offices.
Institutions may also use audits and evaluations. For 55% of institutions, including 33% of small institutions and 72% of large institutions, audit or evaluation activities are undertaken by their internal audit unit or by other units to measure the extent to which official languages requirements are being implemented. Some institutions establish evaluation activities according to a risk-based approach; other follow an evaluation cycle. Three small institutions indicated that this does not apply to them.
At Global Affairs Canada, the Mission Inspection Division conducted on site inspections. During the fiscal year 2019–20, the division inspected eight missions. None of them failed any of the criteria, but one mission needed improvement in one area. The missions were advised of the results at the end of the inspection. In the inspection report, recommendations were made to mission management in the areas where improvements were needed. The Mission Inspection Division also conducted 51 inspections online over the course of the year. Most of them (86%) found that mission management was complying with the Official Languages Act and promoting the use of both English and French.
All the institutions stated that steps are taken and documented to improve or rectify shortcomings or deficiencies in monitoring activities or mechanisms in a timely manner, with the exception of five small institutions which indicated that this question did not apply to them.
Since deputy heads are responsible for enforcing departmental official languages policies, they can be expected to have implemented processes to ensure that this is the case.
Ninety-four percent (94%) of institutions stated that their deputy head is informed of the results of monitoring activities, including 88% of small institutions and 100% of large institutions.
Summary: Monitoring
| Questions | Yes | ||
|---|---|---|---|
| Large institutions | Small institutions | All institutions | |
| Measures are regularly taken to ensure that employees are well aware of obligations under Parts IV, V, VI, and VII (section 41) of the Official Languages Act. | 90% | 77% | 84% |
| Activities are conducted throughout the fiscal year to measure the availability and quality of the services offered in both official languages (Part IV). | 90% | 50% | 71% |
| Activities are conducted to periodically measure whether employees in regions designated bilingual for language of work purposes can use their official language of choice in the workplace (Part V). | 96% | 60% | 81% |
| The deputy head is informed of the results of monitoring activities. | 100% | 88% | 94% |
| Mechanisms are in place to determine and document the impact of the institution’s decisions on the implementation of Parts IV, V, VI, and VII (section 41) of the Official Languages Act (such as adopting or revising a policy, creating or abolishing a program, or establishing or closing a service location). | 89% | 48% | 71% |
| Audit or evaluation activities are undertaken, by either the internal audit unit or by other units, to evaluate to what extent official languages requirements are being implemented. | 72% | 33% | 55% |
| When the institution’s monitoring activities or mechanisms reveal shortcomings or deficiencies, steps are taken and documented to quickly improve or rectify the situation. | 100% | 100% | 100% |
Institutional priorities
Federal institutions that submitted a review on official languages in the fiscal year 2019–20 indicated their top priorities for both the current and the coming fiscal year. The key priorities cited are:
- improving access to language training
- maintaining second language proficiency
- increasing employee awareness of official languages obligations
- simultaneity of communications and services provided in both official languages
Some institutions said their priorities included adjusting their plans for language training, implementing initiatives, or the monitoring needed for employees who will have to pass second-language tests after the COVID-19 pandemic.
TBS activities
TBS organized various activities during the fiscal year 2019–20, sometimes in collaboration with other federal institutions, to discuss issues related to official languages, including the following:
- a half-day information gathering session on the modernization of the Official Languages Act to obtain feedback from federal institutions regarding the implementation of Part V (August 2019)
- a workshop on linguistic insecurity as part of Linguistic Duality Day (September 2019)
- the Official Languages Best Practices Forum, organized jointly by TBS, Canadian Heritage and the Council of the Network of Official Language Champions (November 2019)
- presentations to institutions in the Innovation, Science and Economic Development Canada portfolio (October 2019), to members of the Veterans Affairs Canada Advisory Group (June 2019), and to the Canada Infrastructure Bank (August 2019). Presentations were also given during an Atlantic Canada Opportunities Agency symposium (January 2020), an information session with airport authorities (January 2020), and to the Standards Council of Canada (January 2020)
- meetings of the Departmental Advisory Committee on Official Languages (August and October 2019 and January 2020) and of the Crown Corporations Advisory Committee on Official Languages (September and December 2019 and February and March 2020)
The meetings provided an opportunity to discuss legislative obligations and the application of official languages policies, the maintenance of second language proficiency, language training, artificial intelligence, leadership, the future of work, the impact of implementing section 91 of the act on the objective determination of linguistic requirements, as well as linguistic insecurity among public servants about using their second or their first official language in the workplace. The meetings were an opportunity to provide updates on the modernization of the act, amendments to the regulations, the approaches and tools needed to better support institutions and other best practices.
In addition, on March 31, 2020, shortly after the beginning of the health measures related to the pandemic, TBS held a virtual meeting with the official languages community of practice to discuss the issue of government communications in crisis situations and the relaxation of Public Service Commission measures related to second language tests and the validity of second-language evaluations' results.
The COVID-19 pandemic disrupted the delivery of services and the organization of work in several institutions towards the end of the fiscal year 2019–20, as many public servants started to work from home where possible. For all institutions, the pandemic highlighted the importance of integrating into their emergency and crisis communications plans and their business continuity plans processes that can be quickly adapted to ensure that quality services to the public and employees continue to be provided simultaneously and at all times in both official languages. Over the subsequent review period, TBS will inquire further into what institutions have done concretely to respect the language rights of the public and employees.
Conclusion and trends
Overall, one can observe stability and a solid performance in official languages matters for the federal public service in the fiscal year 2019–20. English and French speakers are equitably represented in the workforce of institutions subject to the act across the country. The core public administration maintains its capacity to provide services in both official languages to the public and to its employees. While the percentage of bilingual positions dipped slightly in comparison to the previous fiscal year (42.4% as of March 31, 2020, compared to 42.7% the previous year), the rate of incumbents who meet the language requirements of their positions has increased (95.6%, a 0.8% increase over the previous year), and more positions require the highest level of bilingualism (36.2%, a 0.7% increase over the previous year).
In terms of using official languages in the workplace, the perception of public servants is now more positive in regions designated bilingual for language of work purposes.
TBS will continue to monitor progress in this area, using the 2020 Public Service Employee Survey, which includes questions on the use of official languages.
At the same time, TBS will continue to provide training and professional development to persons responsible for official languages and official language champions as well as provide advice and guidance to institutions during advisory group meetings on horizontal issues, such as on the objective determination of the language requirements of positions and communications during emergency situations. TBS will also develop tools to counter linguistic insecurity among public servants.
Bill C‑32, An Act to amend the Official Languages Act and to make related and consequential amendments to other Acts, was tabled on June 15, 2021 in an effort to strengthen the Official Languages Act. The government’s intentions with regard to the modernization of Canada’s official languages regime were put forward in a document entitled English and French: Towards a substantive equality of official languages in Canada. The Official Languages Act, much like the Canadian Charter of Rights and Freedoms, expresses core Canadian values. Its renewal is an opportunity to align linguistic duality with the realities of the 21st century.
Appendix A: Methodology for reporting on the status of official languages programs
Federal institutions must submit a review on official languages to TBS at least once every three years. This fiscal year marks the third year of a three-year cycle.Footnote 17 Fifty-six (56) organizationsFootnote 18 had to complete a questionnaire on elements pertaining to the application of Parts IV, V and VI of the act.
Institutions were required to report on the following elements:
- communications with and services to the public in both official languages
- language of work
- human resources management
- governance
- monitoring of official languages programs
These five elements were evaluated mainly by using multiple-choice questions. To reduce the administrative burden on small institutions,Footnote 19 they were asked fewer questions than large institutions. Because the reviews exercise began during the COVID-19 pandemic and in the context of the upheaval in the institutions’ operations, several questions were optional. Deputy heads were responsible for ensuring that their institution’s responses were supported by facts and evidence. The following table describes the response scales used in the review on official languages for 2019–20.
| Nearly always | In 90% or more of cases |
|---|---|
| Very often | Between 70% and 89% of cases |
| Often | Between 50% and 69% of cases |
| Sometimes | Between 25% and 49% of cases |
| Almost never | In fewer than 25% of cases |
| Yes | Completely agree with the statement |
| No | Completely disagree with the statement |
| Regularly | With some regularity |
| Sometimes | From time to time, but not regularly |
| Almost never | Rarely |
| N/A | Does not apply to the institution |
The previous sections outline the status of official languages programs in the 56 institutions that submitted a review. The statistical tables in Appendix D of this report outline the resultsFootnote 20 for all federal institutions.
Appendix B: Federal institutions required to submit a review for the fiscal year 2019–20
In this section
Fifty-six federal institutions submitted a review for the fiscal year 2019–20. The distinction between small institutions and large institutions is based on size. Large institutions were required to respond to a longer questionnaire. Small institutions have fewer than 500 employees.
Large institutions
- Administrative Tribunals Support Service of Canada
- Air Canada
- Canada Border Services Agency
- Canada Post
- Canada Revenue Agency
- Canadian Broadcasting Corporation
- Canadian Forces Morale and Welfare Services
- Canadian Heritage
- Canadian Institutes of Health Research
- Canadian National Railway
- Communications Security Establishment Canada
- Correctional Service Canada
- Employment and Social Development Canada
- Fisheries and Oceans Canada
- Global Affairs Canada
- Health Canada
- Immigration and Refugee Board of Canada
- Immigration, Refugees and Citizenship Canada
- Innovation, Science and Economic Development Canada
- Marine Atlantic Inc.
- National Defence
- Natural Resources Canada
- Public Services and Procurement Canada
- Royal Canadian Mounted Police
- Shared Services Canada
- Transport Canada
- Treasury Board of Canada Secretariat
- VIA Rail Canada Inc.
Small institutions
- Atlantic Pilotage Authority Canada
- Canada Science and Technology Museum
- Canadian Commercial Corporation
- Canadian Dairy Commission
- Canadian Intergovernmental Conference Secretariat
- Canadian Museum of History
- Canadian Museum of Nature
- Federal Bridge Corporation
- Financial Consumer Agency of Canada
- Indian Oil and Gas Canada
- International Development Research Centre
- Invest in CanadaFootnote 21
- Laurentian Pilotage Authority Canada
- Military Police Complaints Commission of Canada
- Nanaimo Port Authority
- National Security and Intelligence Review AgencyFootnote 22
- Office of the Commissioner of Lobbying of Canada
- Office of the Secretary to the Governor General
- Pacific Pilotage Authority Canada
- Patented Medicine Prices Review Board Canada
- Polar Knowledge Canada
- Quebec Port Authority
- Saguenay Port Authority
- Standards Council of Canada
- The Jacques-Cartier and Champlain Bridges Inc.
- The National Battlefields Commission
- The Seaway International Bridge Corporation
- Windsor Port Authority
Appendix C: Definitions
- “Anglophone”
- refers to employees whose first official language is English.
- “Bilingual position”
- is a position in which all or part of the duties must be performed in both English and French.
- “First official language”
- is the language declared by the employee as the one that he or she primarily identifies with.
- “Francophone”
- refers to employees whose first official language is French.
- “Incomplete record”
- means a position for which data on language requirements is incorrect or missing.
- “Position”
- means a position filled for an indeterminate period or a determinate period of three months or more, according to the information in the Position and Classification Information System (PCIS).
- “Resources”
- refers to the resources required to meet obligations on a regular basis, according to the information available in the Official Languages Information System II (OLIS II). Resources can consist of a combination of full-time and part-time employees, as well as contract resources. Some cases involve automated functions, hence the need to use the term “resources” in this report.
- “Reversible” or “either/or position”
- is a position in which all the duties can be performed in English or French, depending on the employee’s preference.
Appendix D: Statistical tables
In this section
- Notes
- Table 1 - Bilingual positions and pool of bilingual employees in the core public administration as of March 31
- Table 2 - Language requirements of positions in the core public administration as of March 31
- Table 3 - Language requirements of positions in the core public administration, by province, territory or region as of March 31
- Table 4 - Bilingual positions in the core public administration and linguistic status of incumbents as of March 31
- Table 5 - Bilingual positions in the core public administration and level of second language proficiency required (oral interaction) as of March 31
- Table 6 - Service to the public: bilingual positions in the core public administration and linguistic status of incumbents as of March 31
- Table 7 - Service to the public: bilingual positions in the core public administration and level of second language proficiency required (oral interaction) as of March 31
- Table 8 - Service to the public: positions in the core public administration and linguistic status of incumbents, by province, territory or region as of March 31
- Table 9 - Personal and central services: bilingual positions in the core public administration and linguistic status of incumbents as of March 31
- Table 10 - Personal and central services: bilingual positions in the core public administration and level of second language proficiency required (oral interaction) as of March 31
- Table 11 - Supervision: bilingual positions in the core public administration and linguistic status of incumbents as of March 31
- Table 12 - Supervision: bilingual positions in the core public administration and level of second language proficiency required (oral interaction) as of March 31
- Table 13 - Participation of Anglophones and Francophones in the core public administration, by province, territory or region as of March 31
- Table 14 - Participation of Anglophones and Francophones in the core public administration, by occupational category as of March 31
- Table 15 - Language requirements of positions in the core public administration, by employment equity group as of March 31
- Table 16 - Bilingual positions in the core public administration and linguistic status of incumbents by employment equity group as of March 31
- Table 17 - Bilingual positions in the core public administration and level of second language proficiency required (oral interaction), by employment equity group as of March 31
- Table 18 - Participation of Anglophones and Francophones in the core public administration, by employment equity group as of March 31
- Table 19 - Service to the public: number of resources serving the public, by region or method of delivery, in bilingual offices in institutions not part of the core public administration as of March 31
- Table 20 - Participation of Anglophones and Francophones in institutions not part of the core public administration, by province, territory or region as of March 31
- Table 21 - Participation of Anglophones and Francophones in institutions not part of the core public administration, by occupational category or equivalent category as of March 31
- Table 22 - Participation of Anglophones and Francophones in all federal institutions subject to the Official Languages Act, by province, territory or region as of March 31
There are four main sources of statistical data:
- Burolis is the official inventory that indicates whether offices have an obligation to communicate with the public in both official languages
- The Position and Classification Information System (PCIS) covers the positions and employees of institutions that are part of the core public administration
- The Official Languages Information System II (OLIS II) provides information on the resources of institutions that are not part of the core public administration (in other words, Crown corporations and separate agencies)
- The Employment Equity Data Bank (EEDB) provides data based on voluntary declarations by employment equity groups and, for women, the Pay System
March 31 is the reference date for the data in the statistical tables and in the data systems (the Pay System, Burolis, the PCIS, OLIS II and EEDB).
Notes
Percentage totals may not add up to 100% due to rounding.
The data in this report relating to positions in the core public administration are compiled from the PCIS, except for tables 15 to 18, which also use the EEDB.
Pursuant to the Public Service Official Languages Exclusion Approval Order, incumbents may not meet the language requirements of their position for two reasons:
- they are exempted
- they have two years to meet the language requirements
The linguistic profile of a bilingual position is based on three levels of second language proficiency:
- Level A: minimum proficiency
- Level B: intermediate proficiency
- Level C: superior proficiency
Table 1
Bilingual positions and pool of bilingual employees in the core public administration as of March 31
As of March 31, 2020, the percentages of bilingual positions and bilingual employees in the core public administration had decreased slightly, by 0.42% and 0.25%, respectively, to 42.4% and 43.5% compared to March 31, 2019.
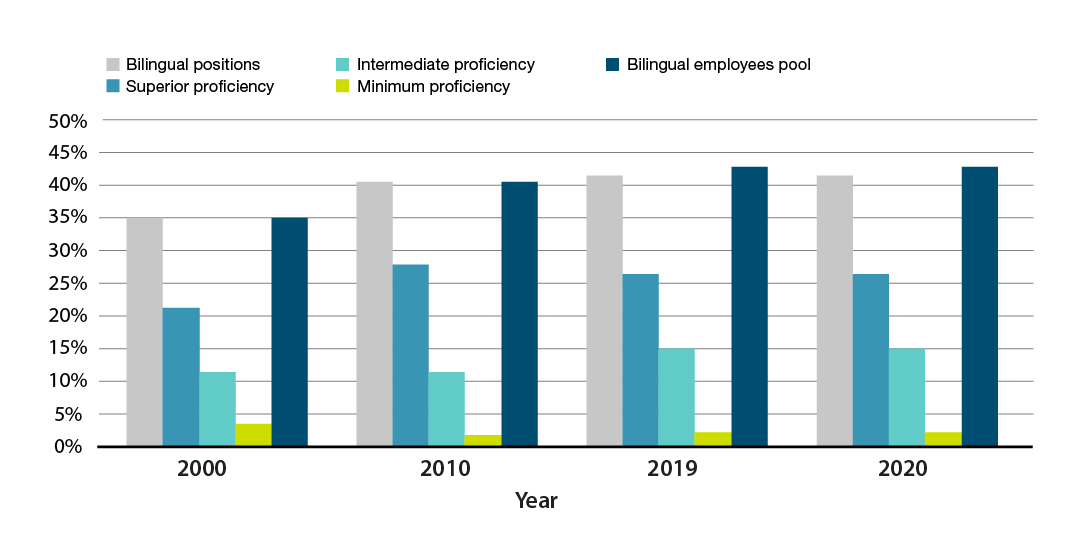
| Year | Bilingual positions | Superior proficiency | Intermediate proficiency | Minimum proficiency | Pool of bilingual employees |
|---|---|---|---|---|---|
| 2000 | 35% | 21% | 11% | 3% | 35% |
| 2010 | 41% | 27% | 12% | 2% | 41% |
| 2019 | 43% | 27% | 15% | 2% | 44% |
| 2020 | 42% | 26% | 15% | 2% | 43% |
Table 2
Language requirements of positions in the core public administration as of March 31
In the fiscal year 2019–20, the number of bilingual positions in the core public administration increased by 4.6%, but the number of bilingual positions as a percentage of the total number of positions decreased slightly, by 0.25%, compared to the fiscal year 2018–19.
| Year | Bilingual positions | English essential positions | French essential positions | English or French essential positions | Incomplete records | Total positions | |||||
|---|---|---|---|---|---|---|---|---|---|---|---|
| 2000 | 50,535 | 35.3% | 75,552 | 52.8% | 8,355 | 5.8% | 7,132 | 5.0% | 1,478 | 1.0% | 143,052 |
| 2010 | 82,985 | 41.0% | 102,484 | 50.6% | 7,827 | 3.9% | 8,791 | 4.3% | 450 | 0.2% | 202,537 |
| 2019 | 85,657 | 42.7% | 99,584 | 49.6% | 7,023 | 3.5% | 8,391 | 4.2% | 66 | 0.0% | 200,721 |
| 2020 | 89,632 | 42.4% | 105,062 | 49.7% | 7,191 | 3.4% | 9,334 | 4.4% | 50 | 0.0% | 211,269 |
Table 3
Language requirements of positions in the core public administration, by province, territory or region as of March 31
Of the 211,269 positions in the core public administration in the fiscal year 2019–20, 89,632 were bilingual positions. Most of the bilingual positions were in Quebec (excluding the National Capital Region) (where 67.5% of positions are bilingual), the National Capital Region (64.2% of positions) and New Brunswick (50.7% of positions).
| Province, territory or region | Bilingual positions | Unilingual positions | Incomplete records | Total positions | |||||||
|---|---|---|---|---|---|---|---|---|---|---|---|
| English essential | French essential | English or French essential | |||||||||
| British Columbia | 487 | 2.8% | 17,106 | 96.8% | 1 | 0.0% | 77 | 0.4% | 1 | 0.0% | 17,672 |
| Alberta | 400 | 3.8% | 10,056 | 95.8% | 0 | 0.0% | 40 | 0.4% | 2 | 0.0% | 10,498 |
| Saskatchewan | 120 | 2.5% | 4,652 | 97.1% | 0 | 0.0% | 16 | 0.3% | 1 | 0.0% | 4,789 |
| Manitoba | 541 | 7.8% | 6,331 | 91.5% | 2 | 0.0% | 46 | 0.7% | 2 | 0.0% | 6,922 |
| Ontario (excluding the NCR) | 2,619 | 10.2% | 22,786 | 88.8% | 12 | 0.0% | 237 | 0.9% | 5 | 0.0% | 25,659 |
| National Capital Region (NCR) | 63,254 | 64.2% | 26,560 | 27.0% | 293 | 0.3% | 8,406 | 8.5% | 33 | 0.0% | 98,546 |
| Quebec (excluding the NCR) | 14,725 | 67.5% | 182 | 0.8% | 6,669 | 30.6% | 251 | 1.1% | 1 | 0.0% | 21,828 |
| New Brunswick | 4,290 | 50.7% | 3,825 | 45.2% | 199 | 2.4% | 148 | 1.7% | 3 | 0.0% | 8,465 |
| Prince Edward Island | 513 | 24.6% | 1,564 | 75.0% | 1 | 0.0% | 6 | 0.3% | 0 | 0.0% | 2,084 |
| Nova Scotia | 955 | 10.9% | 7,743 | 88.1% | 14 | 0.2% | 71 | 0.8% | 2 | 0.0% | 8,785 |
| Newfoundland and Labrador | 109 | 3.2% | 3,297 | 96.0% | 0 | 0.0% | 30 | 0.9% | 0 | 0.0% | 3,436 |
| Yukon | 11 | 3.4% | 313 | 96.0% | 0 | 0.0% | 2 | 0.6% | 0 | 0.0% | 326 |
| Northwest Territories | 13 | 3.1% | 403 | 96.9% | 0 | 0.0% | 0 | 0.0% | 0 | 0.0% | 416 |
| Nunavut | 11 | 4.3% | 242 | 94.9% | 0 | 0.0% | 2 | 0.8% | 0 | 0.0% | 255 |
| Outside Canada | 1,584 | 99.8% | 2 | 0.1% | 0 | 0.0% | 1 | 0.1% | 0 | 0.0% | 1,587 |
| Unknown | 0 | 0.0% | 0 | 0.0% | 0 | 0.0% | 1 | 100.0% | 0 | 0.0% | 1 |
| Total | 89,632 | 42.4% | 105,062 | 49.7% | 7,191 | 3.4% | 9,334 | 4.4% | 50 | 0.0% | 211,269 |
Table 4
Bilingual positions in the core public administration and linguistic status of incumbents as of March 31
In the fiscal year 2019–20, the percentage of employees in bilingual positions in the core public administration who met the language requirements of their position slightly increased by 0.8% compared to the fiscal year 2018–19.
| Year | Incumbents meet requirements | Incumbents do not meet requirements | Incomplete records | Total employees | |||||
|---|---|---|---|---|---|---|---|---|---|
| Exempted | Must meet | ||||||||
| 2000 | 41,832 | 82.8% | 5,030 | 10.0% | 968 | 1.9% | 2,705 | 5.4% | 50,535 |
| 2010 | 77,331 | 93.2% | 3,625 | 4.4% | 831 | 1.0% | 1,198 | 1.4% | 82,985 |
| 2019 | 81,170 | 94.8% | 3,180 | 3.7% | 40 | 0.0% | 1,267 | 1.5% | 85,657 |
| 2020 | 85,676 | 95.6% | 3,297 | 3.7% | 35 | 0.0% | 624 | 0.7% | 89,632 |
Table 5
Bilingual positions in the core public administration and level of second language proficiency required (oral interaction) as of March 31Footnote 23
The percentage of bilingual positions in the core public administration that require Level C proficiency for oral interaction rose 0.7% from the fiscal year 2018–19 to the fiscal year 2019–20.
| Year | Level C | Level B | Level A | Other | Total positions | ||||
|---|---|---|---|---|---|---|---|---|---|
| 2000 | 12,836 | 25.4% | 34,677 | 68.6% | 1,085 | 2.1% | 1,937 | 3.8% | 50,535 |
| 2010 | 26,738 | 32.2% | 53,659 | 64.7% | 724 | 0.9% | 1,864 | 2.2% | 82,985 |
| 2019 | 30,374 | 35.5% | 53,572 | 62.5% | 349 | 0.4% | 1,362 | 1.6% | 85,657 |
| 2020 | 32,435 | 36.2% | 55,471 | 61.9% | 335 | 0.4% | 1,391 | 1.6% | 89,632 |
Table 6
Service to the public: bilingual positions in the core public administration and linguistic status of incumbents as of March 31
From the fiscal year 2018–19 to the fiscal year 2019–20, the percentage of employees in the core public administration who provided services to the public in both English and French and who met the language requirements of their position increased by 1.3%.
| Year | Incumbents meet requirements | Incumbents do not meet requirements | Incomplete records | Total employees | |||||
|---|---|---|---|---|---|---|---|---|---|
| Exempted | Must meet | ||||||||
| 2000 | 26,766 | 82.3% | 3,429 | 10.5% | 690 | 2.1% | 1,631 | 5.0% | 32,516 |
| 2010 | 46,413 | 93.0% | 2,217 | 4.4% | 555 | 1.1% | 746 | 1.5% | 49,931 |
| 2019 | 41,440 | 94.5% | 1,469 | 3.4% | 16 | 0.0% | 908 | 2.1% | 43,833 |
| 2020 | 42,839 | 95.8% | 1,468 | 3.3% | 14 | 0.0% | 378 | 0.8% | 44,699 |
Table 7
Service to the public: bilingual positions in the core public administration and level of second language proficiency required (oral interaction) as of March 31Footnote 24
The number of bilingual positions in the core public administration has increased since the fiscal year 2018–19. The percentage of bilingual positions that offer services to the public and require Level C proficiency for oral interaction increased 0.9% to 41.6% in the fiscal year 2019–20.
| Year | Level C | Level B | Level A | Other | Total positions | ||||
|---|---|---|---|---|---|---|---|---|---|
| 2000 | 9,088 | 27.9% | 22,421 | 69.0% | 587 | 1.8% | 420 | 1.3% | 32,516 |
| 2010 | 17,645 | 35.3% | 31,780 | 63.6% | 340 | 0.7% | 166 | 0.3% | 49,931 |
| 2019 | 17,829 | 40.7% | 25,788 | 58.8% | 97 | 0.2% | 119 | 0.3% | 43,833 |
| 2020 | 18,599 | 41.6% | 25,872 | 57.9% | 99 | 0.2% | 129 | 0.3% | 44,699 |
Table 8
Service to the public: positions in the core public administration and linguistic status of incumbents, by province, territory or region as of March 31
In the fiscal year 2019–20, of the 106,323 positions in the core public administration that provide services to the public, 44,699 provide services in both English and French. There were 42,839 incumbents in the 44,699 bilingual positions who met the language requirements of their position.
| Province, territory or region | Bilingual positions | Unilingual positions | Total employees | |||||
|---|---|---|---|---|---|---|---|---|
| Incumbents meet requirements | Incumbents do not meet requirements | Incomplete records | English essential | French essential | French or English essential | |||
| Exempted | Must meet | |||||||
| Western and northern Canada | 977 | 49 | 0 | 36 | 25,143 | 1 | 53 | 26,259 |
| Ontario (excluding the NCR) | 1,502 | 69 | 0 | 49 | 13,441 | 3 | 64 | 15,128 |
| National Capital Region (NCR) | 26,410 | 943 | 13 | 102 | 8,430 | 117 | 2,061 | 38,076 |
| Quebec (excluding the NCR) | 8,850 | 223 | 0 | 53 | 68 | 3,608 | 87 | 12,889 |
| New Brunswick | 2,914 | 110 | 0 | 7 | 2,403 | 114 | 29 | 5,577 |
| Other Atlantic provinces | 892 | 47 | 1 | 9 | 5,975 | 7 | 19 | 6,950 |
| Outside Canada | 1,294 | 27 | 0 | 122 | 1 | 0 | 0 | 1,444 |
| All regions | 42,839 | 1,468 | 14 | 378 | 55,461 | 3,850 | 2,313 | 106,323 |
Table 9
Personal and central services: bilingual positions in the core public administration and linguistic status of incumbents as of March 31
In the fiscal year 2019–20, 95.5% of incumbents in the 64,863 bilingual positions in the core public administration that offer personal and central services met the language requirements of their position, which is an increase of 0.9% compared to the fiscal year 2018–19.
| Year | Incumbents meet requirements | Incumbents do not meet requirements | Incomplete records | Total employees | |||||
|---|---|---|---|---|---|---|---|---|---|
| Exempted | Must meet | ||||||||
| 2019 | 58,442 | 94.6% | 2,278 | 3.7% | 19 | 0.0% | 1,054 | 1.7% | 61,793 |
| 2020 | 61,915 | 95.5% | 2,385 | 3.7% | 18 | 0.0% | 545 | 0.8% | 64,863 |
Table 10
Personal and central services: bilingual positions in the core public administration and level of second language proficiency required (oral interaction) as of March 31Footnote 25
In the fiscal year 2019–20, 36.5% of the 64,863 bilingual positions in the core public administration that offer personal and central services required Level C proficiency in oral interaction, which is an increase of 0.3% compared to the fiscal year 2018–19.
| Year | Level C | Level B | Level A | Other | Total positions | ||||
|---|---|---|---|---|---|---|---|---|---|
| 2019 | 22,345 | 36.2% | 38,266 | 61.9% | 184 | 0.3% | 998 | 1.6% | 61,793 |
| 2020 | 23,697 | 36.5% | 39,879 | 61.5% | 177 | 0.3% | 1,110 | 1.7% | 64,863 |
Table 11
Supervision: bilingual positions in the core public administration and linguistic status of incumbents as of March 31
As of March 31, 2020, 95.9% of incumbents in the core public administration’s 27,202 bilingual supervisory positions met the language requirements of their position.
| Year | Incumbents meet requirements | Incumbents do not meet requirements | Incomplete records | Total employees | |||||
|---|---|---|---|---|---|---|---|---|---|
| Exempted | Must meet | ||||||||
| 2019 | 24,317 | 95.0% | 934 | 3.6% | 28 | 0.1% | 327 | 1.3% | 25,606 |
| 2020 | 26,089 | 95.9% | 1,005 | 3.7% | 22 | 0.1% | 86 | 0.3% | 27,202 |
| Note: This table excludes employees working outside Canada. | |||||||||
Table 12
Supervision: bilingual positions in the core public administration and level of second language proficiency required (oral interaction) as of March 31Footnote 26
In the fiscal year 2019–20, 60.7% of the core public administration’s 27,202 bilingual supervisory positions required Level C proficiency in oral interaction, which is an increase of 1.4% over the fiscal year 2018–19.
| Year | Level C | Level B | Level A | Other | Total positions | ||||
|---|---|---|---|---|---|---|---|---|---|
| 2019 | 15,177 | 59.3% | 10,347 | 40.4% | 35 | 0.1% | 47 | 0.2% | 25,606 |
| 2020 | 16,502 | 60.7% | 10,604 | 39.0% | 36 | 0.1% | 60 | 0.2% | 27,202 |
| Note: This table excludes employees working outside Canada. | |||||||||
Table 13
Participation of Anglophones and Francophones in the core public administration, by province, territory or region as of March 31
As of March 31, 2020, Newfoundland and Labrador had the highest percentage of Anglophones (98.5%) working in the core public administration, and Quebec (excluding the National Capital Region) had the highest percentage of Francophones (88.7%).
| Province, territory or region | Anglophones | Francophones | Unknown | Total employees | |||
|---|---|---|---|---|---|---|---|
| British Columbia | 17,316 | 98.0% | 352 | 2.0% | 4 | 0.0% | 17,672 |
| Alberta | 10,160 | 96.8% | 337 | 3.2% | 1 | 0.0% | 10,498 |
| Saskatchewan | 4,713 | 98.4% | 76 | 1.6% | 0 | 0.0% | 4,789 |
| Manitoba | 6,638 | 95.9% | 283 | 4.1% | 1 | 0.0% | 6,922 |
| Ontario (excluding the NCR) | 24,244 | 94.5% | 1,413 | 5.5% | 2 | 0.0% | 25,659 |
| National Capital Region (NCR) | 60,363 | 61.3% | 38,152 | 38.7% | 31 | 0.0% | 98,546 |
| Quebec (excluding the NCR) | 2,466 | 11.3% | 19,358 | 88.7% | 4 | 0.0% | 21,828 |
| New Brunswick | 4,609 | 54.4% | 3,852 | 45.5% | 4 | 0.0% | 8,465 |
| Prince Edward Island | 1,876 | 90.0% | 208 | 10.0% | 0 | 0.0% | 2,084 |
| Nova Scotia | 8,303 | 94.5% | 482 | 5.5% | 0 | 0.0% | 8,785 |
| Newfoundland and Labrador | 3,386 | 98.5% | 49 | 1.4% | 1 | 0.0% | 3,436 |
| Yukon | 311 | 95.4% | 15 | 4.6% | 0 | 0.0% | 326 |
| Northwest Territories | 387 | 93.0% | 29 | 7.0% | 0 | 0.0% | 416 |
| Nunavut | 227 | 89.0% | 28 | 11.0% | 0 | 0.0% | 255 |
| Outside Canada | 1,011 | 63.7% | 576 | 36.3% | 0 | 0.0% | 1,587 |
| Unknown | 1 | 100.0% | 0 | 0.0% | 0 | 0.0% | 1 |
| All regions | 146,011 | 69.1% | 65,210 | 30.9% | 48 | 0.0% | 211,269 |
Table 14
Participation of Anglophones and Francophones in the core public administration, by occupational category as of March 31
As of March 31, 2020, the Operations category had the highest percentage of Anglophones (78.8%) and the Administration and Foreign Service category had the highest percentage of Francophones (37.6%) working in the core public administration. These results are similar to those observed on March 31, 2019.
| Categories | Anglophones | Francophones | Unknown | Total employees | ||||
|---|---|---|---|---|---|---|---|---|
| Management (EX) | 3,716 | 65.9% | 1,926 | 34.1% | 1 | 0.0% | 5,643 | |
| Scientific and professional | 30,959 | 76.1% | 9,684 | 23.8% | 14 | 0.0% | 40,657 | |
| Administration and foreign service | 63,749 | 62.4% | 38,365 | 37.6% | 26 | 0.0% | 102,140 | |
| Technical | 10,349 | 77.2% | 3,050 | 22.8% | 3 | 0.0% | 13,402 | |
| Administrative support | 14,123 | 70.4% | 5,949 | 29.6% | 3 | 0.0% | 20,075 | |
| Operations | 23,115 | 78.8% | 6,236 | 21.2% | 1 | 0.0% | 29,352 | |
| All categories | 146,011 | 69.1% | 65,210 | 30.9% | 48 | 0.0% | 211,269 | |
Table 15
Language requirements of positions in the core public administration, by employment equity group as of March 31Footnote 27
As of March 31, 2020, Indigenous people, members of visible minorities, and persons with disabilities were underrepresented among incumbents of bilingual positions in the core public administration, while women were overrepresented.
| Target groups | Bilingual positions | English essential positions | French essential positions | English or French essential positions | Incomplete records | Total | |||||
|---|---|---|---|---|---|---|---|---|---|---|---|
| Women | 52,672 | 44.7% | 53,886 | 45.8% | 3,749 | 3.2% | 4,416 | 3.8% | 3,037 | 2.6% | 117,760 |
| Indigenous people | 3,477 | 31.9% | 6,698 | 61.5% | 186 | 1.7% | 296 | 2.7% | 231 | 2.1% | 10,888 |
| Persons with disabilities | 4,082 | 36.8% | 5,892 | 53.1% | 236 | 2.1% | 583 | 5.3% | 294 | 2.7% | 11,087 |
| Members of visible minorities | 13,443 | 35.2% | 20,256 | 53.1% | 650 | 1.7% | 2,764 | 7.2% | 1,032 | 2.7% | 38,145 |
| All employees | 88,657 | 41.4% | 103,861 | 48.5% | 7,111 | 3.3% | 9,252 | 4.3% | 5,239 | 2.4% | 214,120 |
Table 16
Bilingual positions in the core public administration and linguistic status of incumbents by employment equity group as of March 31
As of March 31, 2020, members of visible minority groups and persons with disabilities were slightly underrepresented among incumbents of bilingual positions in the core public administration who met the language requirements of their position.
| Target groups | Incumbents meet requirements | Incumbents do not meet requirements | Incomplete records | Total | |||||
|---|---|---|---|---|---|---|---|---|---|
| Exempted | Must meet | ||||||||
| Women | 50,614 | 96.1% | 1,748 | 3.3% | 12 | 0.0% | 298 | 0.6% | 52,672 |
| Indigenous people | 3,352 | 96.4% | 103 | 3.0% | 2 | 0.1% | 20 | 0.6% | 3,477 |
| Persons with disabilities | 3,881 | 95.1% | 175 | 4.3% | 0 | 0.0% | 26 | 0.6% | 4,082 |
| Members of visible minorities | 12,727 | 94.7% | 593 | 4.4% | 7 | 0.1% | 116 | 0.9% | 13,443 |
| All employees | 84,657 | 95.6% | 3,247 | 3.7% | 35 | 0.0% | 580 | 0.7% | 88,657 |
Table 17
Bilingual positions in the core public administration and level of second language proficiency required (oral interaction), by employment equity group as of March 31Footnote 28
As of March 31, 2020, only members of visible minorities were underrepresented among incumbents of bilingual positions in the core public administration requiring level C proficiency in oral interaction.
| Target groups | Level C | Level B | Level A | Other | Total | ||||
|---|---|---|---|---|---|---|---|---|---|
| Women | 19,467 | 37.0% | 32,334 | 61.4% | 59 | 0.1% | 812 | 1.5% | 52,672 |
| Indigenous people | 1,268 | 36.5% | 2,182 | 62.8% | 9 | 0.3% | 18 | 0.5% | 3,477 |
| Persons with disabilities | 1,497 | 36.7% | 2,527 | 61.9% | 12 | 0.3% | 46 | 1.1% | 4,082 |
| Members of visible minorities | 4,270 | 31.8% | 9,029 | 67.2% | 25 | 0.2% | 119 | 0.9% | 13,443 |
| All employees | 32,182 | 36.3% | 54,765 | 61.8% | 329 | 0.4% | 1,381 | 1.6% | 88,657 |
Table 18
Participation of Anglophones and Francophones in the core public administration, by employment equity group as of March 31
As of March 31, 2020, women were underrepresented among Anglophones in the core public administration, while Indigenous people and members of visible minorities and persons with disabilities were underrepresented among Francophones.
| Target groups | Anglophones | Francophones | Unknown | Total | ||||
|---|---|---|---|---|---|---|---|---|
| Women | 79,619 | 67.6% | 38,003 | 32.3% | 138 | 0.1% | 117,760 | |
| Indigenous people | 8,107 | 74.5% | 2,772 | 25.5% | 9 | 0.1% | 10,888 | |
| Persons with disabilities | 8,431 | 76.0% | 2,642 | 23.8% | 14 | 0.1% | 11,087 | |
| Members of visible minorities | 29,771 | 78.0% | 8,339 | 21.9% | 35 | 0.1% | 38,145 | |
| All employees | 147,380 | 68.8% | 66,365 | 31.0% | 375 | 0.2% | 214,120 | |
Table 19
Service to the public: number of resources serving the public, by region or method of delivery, in bilingual offices in institutions not part of the core public administration as of March 31Footnote 29
In the fiscal year 2019–20, 80,005 resources offered services to the public in the bilingual offices of federal institutions that are not part of the core public administration. Of these resources, 27,564 provided services in English and French.
| Province, territory, region or method of delivery | Resources in English only | Resources in French only | Bilingual resources | Total resources |
|---|---|---|---|---|
| Western and northern Canada | 20,043 | 25 | 2,263 | 22,331 |
| Ontario (excluding the NCR) | 13,865 | 121 | 1,955 | 15,941 |
| National Capital Region (NCR) | 6,596 | 637 | 8,206 | 15,439 |
| Quebec (excluding the NCR) | 255 | 1,542 | 8,767 | 10,564 |
| New Brunswick | 496 | 36 | 1,327 | 1,859 |
| Other Atlantic provinces | 3,964 | 21 | 896 | 4,881 |
| Outside Canada | 120 | 0 | 30 | 150 |
| Travel | 4,682 | 0 | 3,975 | 8,657 |
| Telephone | 38 | 0 | 145 | 183 |
| Total | 50,059 | 2,382 | 27,564 | 80,005 |
Table 20
Participation of Anglophones and Francophones in institutions not part of the core public administration, by province, territory or region as of March 31
As of March 31, 2020, Newfoundland and Labrador had the highest percentage of Anglophones (98.1%) and Quebec (excluding the National Capital Region) had the highest percentage of Francophones (76.1%) working in institutions that are not part of the core public administration.
| Province, territory or region | Anglophones | Francophones | Unknown | Total resources | |||
|---|---|---|---|---|---|---|---|
| British Columbia | 37,630 | 95.9% | 1,513 | 3.9% | 103 | 0.3% | 39,246 |
| Alberta | 28,906 | 95.0% | 1,529 | 5.0% | 1 | 0.0% | 30,436 |
| Saskatchewan | 7,946 | 96.5% | 287 | 3.5% | 1 | 0.0% | 8,234 |
| Manitoba | 14,952 | 95.0% | 790 | 5.0% | 0 | 0.0% | 15,742 |
| Ontario (excluding the NCR) | 77,654 | 93.3% | 5,591 | 6.7% | 27 | 0.0% | 83,272 |
| National Capital Region (NCR) | 34,774 | 71.0% | 14,173 | 28.9% | 43 | 0.1% | 48,990 |
| Quebec (excluding the NCR) | 12,877 | 23.8% | 41,117 | 76.1% | 20 | 0.0% | 54,014 |
| New Brunswick | 7,759 | 74.3% | 2,678 | 25.7% | 0 | 0.0% | 10,437 |
| Prince Edward Island | 1,940 | 92.4% | 160 | 7.6% | 0 | 0.0% | 2,100 |
| Nova Scotia | 13,431 | 92.2% | 1,140 | 7.8% | 0 | 0.0% | 14,571 |
| Newfoundland and Labrador | 5,512 | 98.1% | 105 | 1.9% | 0 | 0.0% | 5,617 |
| Yukon | 367 | 91.3% | 35 | 8.7% | 0 | 0.0% | 402 |
| Northwest Territories | 656 | 87.1% | 97 | 12.9% | 0 | 0.0% | 753 |
| Nunavut | 297 | 85.6% | 50 | 14.4% | 0 | 0.0% | 347 |
| Outside Canada | 1,321 | 77.3% | 389 | 22.7% | 0 | 0.0% | 1,710 |
| All regions | 246,022 | 77.9% | 69,654 | 22.1% | 195 | 0.1% | 315,871 |
Table 21
Participation of Anglophones and Francophones in institutions not part of the core public administration, by occupational category or equivalent category as of March 31
As of March 31, 2020, the Operations category had the highest percentage of Anglophones (82.4%) working in institutions that are not part of the core public administration. The categories with the highest percentage of Francophones (26.2%) working in institutions that are not part of the core public administration were the Canadian Armed Forces and regular members of the Royal Canadian Mounted Police.
| Categories | Anglophones | Francophones | Unknown | Total resources | |||
|---|---|---|---|---|---|---|---|
| Management | 13,679 | 76.2% | 4,246 | 23.7% | 23 | 0.1% | 17,948 |
| Professionals | 31,015 | 74.5% | 10,554 | 25.4% | 52 | 0.1% | 41,621 |
| Specialists and technicians | 18,684 | 76.7% | 5,659 | 23.2% | 12 | 0.0% | 24,355 |
| Administrative support | 34,446 | 76.3% | 10,679 | 23.7% | 27 | 0.1% | 45,152 |
| Operations | 99,203 | 82.4% | 21,125 | 17.5% | 81 | 0.1% | 120,409 |
| Canadian Armed Forces and regular members of the Royal Canadian Mounted Police | 48,995 | 73.8% | 17,391 | 26.2% | 0 | 0.0% | 66,386 |
| All categories | 246,022 | 77.9% | 69,654 | 22.1% | 195 | 0.1% | 315,871 |
Table 22
Participation of Anglophones and Francophones in all federal institutions subject to the Official Languages Act, by province, territory or region as of March 31
As of March 31, 2020, Newfoundland and Labrador had the highest percentage of Anglophones (98.3%) and Quebec (excluding the National Capital Region) had the highest percentage of Francophones (79.7%) working in all institutions subject to the Official Languages Act.
| Province, territory or region | Anglophones | Francophones | Unknown | Total | |||
|---|---|---|---|---|---|---|---|
| British Columbia | 54,946 | 96.5% | 1,865 | 3.3% | 107 | 0.2% | 56,918 |
| Alberta | 39,066 | 95.4% | 1,866 | 4.6% | 2 | 0.0% | 40,934 |
| Saskatchewan | 12,659 | 97.2% | 363 | 2.8% | 1 | 0.0% | 13,023 |
| Manitoba | 21,590 | 95.3% | 1,073 | 4.7% | 1 | 0.0% | 22,664 |
| Ontario (excluding the NCR) | 101,898 | 93.5% | 7,004 | 6.4% | 29 | 0.0% | 108,931 |
| National Capital Region (NCR) | 95,137 | 64.5% | 52,325 | 35.5% | 74 | 0.1% | 147,536 |
| Quebec (excluding the NCR) | 15,343 | 20.2% | 60,475 | 79.7% | 24 | 0.0% | 75,842 |
| New Brunswick | 12,368 | 65.4% | 6,530 | 34.5% | 4 | 0.0% | 18,902 |
| Prince Edward Island | 3,816 | 91.2% | 368 | 8.8% | 0 | 0.0% | 4,184 |
| Nova Scotia | 21,734 | 93.1% | 1,622 | 6.9% | 0 | 0.0% | 23,356 |
| Newfoundland and Labrador | 8,898 | 98.3% | 154 | 1.7% | 1 | 0.0% | 9,053 |
| Yukon | 678 | 93.1% | 50 | 6.9% | 0 | 0.0% | 728 |
| Northwest Territories | 1,043 | 89.2% | 126 | 10.8% | 0 | 0.0% | 1,169 |
| Nunavut | 524 | 87.0% | 78 | 13.0% | 0 | 0.0% | 602 |
| Outside Canada | 2,332 | 70.7% | 965 | 29.3% | 0 | 0.0% | 3,297 |
| Unknown | 1 | 100.0% | 0 | 0.0% | 0 | 0.0% | 1 |
| All regions | 392,033 | 74.4% | 134,864 | 25.6% | 243 | 0.0% | 527,140 |
Footnotes
- Footnote 1
-
See subsection 3(1) of the Official Languages Act for the definition of “federal institution.”
- Footnote 2
-
Fiscal years in this report are from April 1 to March 31. Note that the impacts of the pandemic will be covered in the next annual report covering fiscal year 2020–21.
- Footnote 3
-
See the definition in the Directive on the implementation of the Official Languages (Communications with and Services to the Public) Regulations.
- Footnote 4
-
Appendix B contains an explanation of the distinction between small institutions and large institutions.
- Footnote 5
-
In this figure and in subsequent figures, the total number of institutions does not include those that replied “not applicable” or to which the question did not apply. Since the number of large institutions and small institutions is not the same, the results for all 56 institutions are not an average of the two previous results.
- Footnote 6
-
Percentages in the figures in this report may not add up to 100% due to rounding.
- Footnote 7
-
All elements of information, including any correspondence, memorandum, book, plan, map, drawing, diagram, pictorial or graph work, photograph, film, microform, sound recording, videotape, machine-readable record, and any other documentary material, regardless of physical form or characteristics, and any copy thereof.
- Footnote 8
-
In this table and the subsequent tables that contain information about the reviews, small institutions were not required to answer all the questions given that their questionnaire was longer. We have therefore indicated “n/a” (not applicable) in the empty boxes. In addition, since the numbers of large and small institutions are not the same, the results for all 56 institutions are not an average of the two results.
- Footnote 9
-
Eight institutions have no offices in bilingual regions.
- Footnote 10
-
See the definitions in Appendix C.
- Footnote 11
-
Small institutions were not required to answer this question. They are therefore not represented in these percentages or in the subsequent figures. Except for the new question on leadership, only 28 institutions were required to answer this question and the other questions in this section.
- Footnote 12
-
In total, 182,306 employees from 86 federal departments and agencies responded to the 2019 Public Service Employee Survey, which is a participation rate of 62.3%.
- Footnote 13
-
Comparisons were made with 2014 and 2017 because the Public Service Employee Survey does not include questions on the use of official languages every year.
- Footnote 14
-
Positive answers aggregate “Strongly agree” and “Somewhat agree”; neutral answers, “Neither agree nor disagree”; and negative answers, “Somewhat disagree” and “Strongly disagree”. For the question related to senior managers, positive answers aggregate “Always/Almost always” and “Often”; neutral answers, “Sometimes”; and negative answers: “Rarely” and “Never/Almost never”. For the question related to the lack of access to language training, positive answers aggregate “Not at all” and “To a small extent”; neutral answers, “To a moderate extent”; and negative answers, “To a large extent” and “To a very large extent”. Positive answers and negative answers are calculated by removing the “Don't know” and “Not applicable” responses from the total responses.
- Footnote 15
-
Throughout the public service, 72% of employees indicated that the senior executives in their organization use both official languages in their interactions with employees.
- Footnote 16
-
The core public administration consists of all the departments that appear in Schedule I and the parts of the federal public administration named in Schedule IV of the Financial Administration Act pursuant to sections 3 and 11 of that act. A minister of the Crown, the Treasury Board or the Governor in Council is authorized to establish or approve terms and conditions of employment for those departments and agencies.
- Footnote 17
-
Eighteen (18) institutions submit a review every year.
- Footnote 18
-
See Appendix B for the list of institutions required to submit a review for the fiscal year 2019–20.
- Footnote 19
-
The distinction between small and large institutions is based on their size, in accordance with the recommendations made by the Auditor General of Canada in his spring 2015 report, Report 2 – Required Reporting by Federal Organizations. In general, small organizations have fewer than 500 employees.
- Footnote 20
-
The statistical data from the core public administration institutions came from the Position and Classification Information System, and data from institutions that are not part of the core public administration came from the Official Languages Information System II. One institution, the National Security and Intelligence Review Agency, created in July 2019, was unable to provide recent data. The data compiled for that institution was as of March 31, 2019, when it was called the Security Intelligence Review Committee.
- Footnote 21
-
To establish a benchmark, Invest in Canada completed the long questionnaire for large institutions.
- Footnote 22
-
On July 12, 2019, the National Security and Intelligence Review Agency succeeded the Security Intelligence Review Committee and the former Office of the Commissioner of the Communications Security Establishment.
- Footnote 23
-
The levels required in second language proficiency refer only to oral interaction (understanding and speaking). The “Other” category refers to positions that require Code P (specialized proficiency) or that do not require any oral interaction skills in the second language.
- Footnote 24
-
The levels required in second language proficiency refer only to oral interaction (understanding and speaking). The “Other” category refers to positions that require Code P (specialized proficiency) or that do not require any oral interaction skills in the second language.
- Footnote 25
-
The levels required in second language proficiency refer only to oral interaction (understanding and speaking). The “Other” category refers to positions that require Code P (specialized proficiency) or that do not require any oral interaction skills in the second language.
- Footnote 26
-
The levels required in second language proficiency refer only to oral interaction (understanding and speaking). The “Other” category refers to positions that require Code P (specialized proficiency) or that do not require any oral interaction skills in the second language.
- Footnote 27
-
In this table and the following tables, the columns do not add up because people in the target groups can be in more than one target group, and in the “all employees” line, employees who are not in any of these groups are also counted. The total for all employees differs from previous tables because it is based on the Positions and Classification Information System, the Pay System, and the Employment Equity Data Bank.
- Footnote 28
-
The levels required in second language proficiency refer only to oral interaction (understanding and speaking). The “Other” category refers to positions that require Code P (specialized proficiency) or that do not require any oral interaction skills in the second language.
- Footnote 29
-
In this table, Canadian Forces Morale and Welfare Services regrouped all its resources serving the public as being in the National Capital Region. The Canadian Broadcasting Corporation was unable to provide complete data for this table.
© Her Majesty the Queen in Right of Canada, represented by the President of the Treasury Board, 2021,
Catalogue No.BT23-1E-PDF, ISSN: 1486-9683