
Spending and human resources - 2017-18 Departmental Plan
Planned spending
| Programs and Internal Services | 2014–15 Expenditures |
2015–16 Expenditures |
2016–17 Forecast spending |
2017–18 Main Estimates |
2017–18 |
2018–19 Planned spending |
2019–20 Planned spending |
|---|---|---|---|---|---|---|---|
| 1.0 Defence Combat and Support Operations | 1,229,363,372 | 1,360,079,139 | 1,414,538,963 | 1,204,608,692 | 1,204,608,692 | 1,242,203,250 | 1,289,764,460 |
| 2.0 Defence Services and Contributions to Government | 497,418,597 | 453,694,400 | 319,986,085 | 431,792,517 | 431,792,517 | 442,357,574 | 455,203,030 |
| 3.0 Defence Ready Force Element Production | 3,284,882,232 | 3,401,386,557 | 3,501,985,708 | 3,366,635,148 | 3,366,635,148 | 3,443,853,349 | 3,503,564,537 |
| 4.0 Defence Capability Element Production | 12,504,965,147 | 12,577,878,081 | 12,718,025,107 | 12,805,778,437 | 12,826,660,194* | 14,191,763,214 | 13,374,702,491 |
| 5.0 Defence Capability Development and Research | 462,489,089 | 424,789,408 | 391,110,254 | 395,158,296 | 395,158,296 | 409,054,794 | 415,793,336 |
| Subtotal | 17,979,118,437 | 18,217,827,585 | 18,345,646,117 | 18,203,973,090 | 18,224,854,847 | 19,729,232,181 | 19,039,027,854 |
| Internal Services Subtotal | 474,820,024 | 448,245,658 | 436,513,637 | 458,094,144 | 458,094,144 | 472,407,653 | 481,241,120 |
| Total | 18,453,938,461 | 18,666,073,243 | 18,782,159,754 | 18,662,067,234 | 18,682,948,991** | 20,201,639,834 | 19,520,268,974 |
Sources: Vice-Chief of the Defence Staff Group / Assistant Deputy Minister (Finance) / Chief Financial Officer Group
Notes:
- Planned spending figures for 2017-18 and onwards will not reflect figures shown in the Departmental Results Report (DRR).
- Due to rounding, figures may not add up to totals shown.
*The largest year-to-year variance in total planned spending occurs from 2017-18 to 2018-19 totalling $1.5 billion. Of this total, $1.3 billion is attributable to Program 4.0: Defence Capability Element Production. The increase in planned spending under this program is largely due to adjustments to the spending profile of major capital equipment and infrastructure projects to align financial resources with project acquisition timelines.
**The difference between Main Estimates and Planned Spending in FY 2017-18 relates to ‘‘Proceeds Forecasted to be Received’’ being included only in Planned Spending.
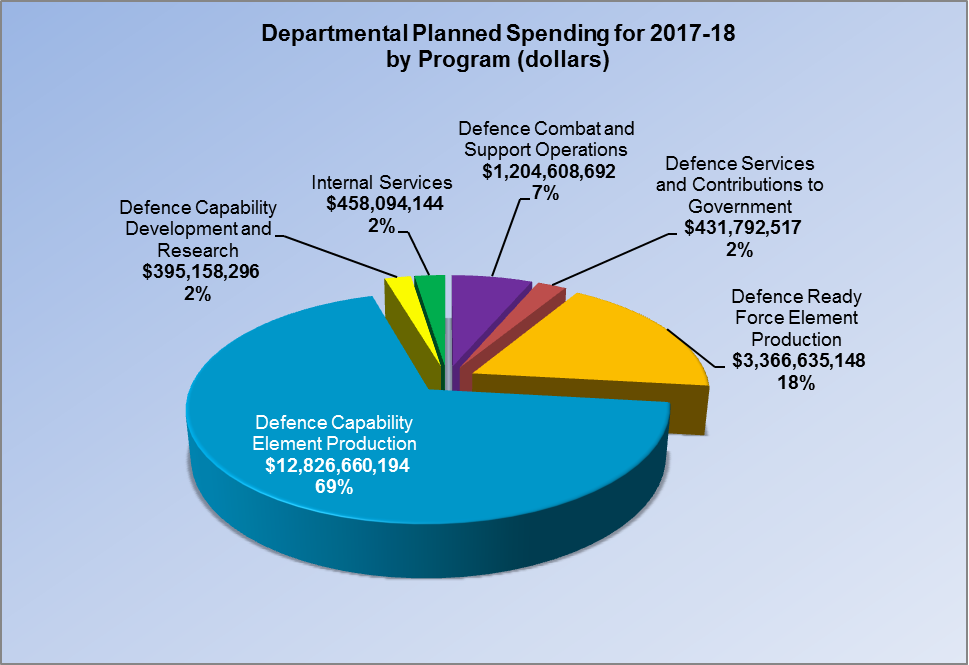
Departmental Planned Spending for 2017-18 by Program (dollars)
Departmental Spending Trend Graph
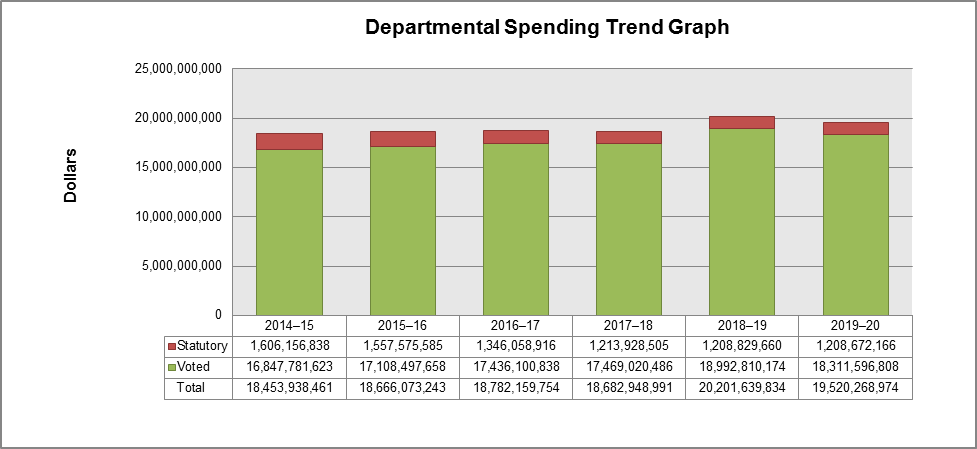
Over the period 2014-15 to 2019-20 actual expenditures, forecast spending and planned spending varies from a low of $18.4 billion in 2014-15 to a high of $20.2 billion in 2018-19. The net increase from 2014-15 to 2019-20 of $1.06 billion is summarized as follows:
| Explanation of Departmental Financial Spending Trend Changes from 2014-15 to 2019-20 (dollars) | |
|---|---|
| Net adjustments to spending on major capital equipment and infrastructure projects to align financial resources with current project acquisition timelines | (1,098,371,265) |
| Funding related to lower Employee Benefit Plan forecasts | (433,572,552) |
| Funding associated with Manuge v. Her Majesty the Queen Class Action Lawsuit | (204,154,597) |
| Funding related to military operations overseas | (85,811,095) |
| Funding related to measures announced by the Government in Budget 2016 to make Government more efficient | (58,318,000) |
| Total Decreases | (1,880,227,509) |
| Annual escalator on Defence spending as announced in Budget 2008 to provide long-term and predictable funding | 2,422,484,000 |
| Funding associated with the Canada First Defence Strategy | 173,603,950 |
| Other miscellaneous departmental requirements | 103,961,101 |
| Net transfers with other Government Organizations | 94,192,601 |
| Funding associated with the Government of Canada Federal Contaminated Sites Action Plan | 76,025,361 |
| Funding related to the North Atlantic Treaty Organization contribution program | 41,428,434 |
| Funding related to the Military Pension Renewal | 34,862,577 |
| Total Increases | 2,946,558,024 |
| Net Change | 1,066,330,514 |
Human resources planning summary for Programs and Internal Services (full-time equivalents)
| Programs and Internal Services | 2014–15 Full-time equivalents |
2015–16 Full-time equivalents |
2016–17 Forecast full-time equivalents |
2017–18 Planned full-time equivalents |
2018–19 Planned full-time equivalents |
2019–20 Planned full-time equivalents |
|
|---|---|---|---|---|---|---|---|
| 1.0 Defence Combat and Support Operations | Military – Regular Force | 5,978 | 5,785 | 6,730 | 6,799 | 6,904 | 6,916 |
| Civilian | 661 | 688 | 652 | 964 | 964 | 964 | |
| 2.0 Defence Services and Contributions to Government | Military – Regular Force | 1,356 | 1,444 | 1,419 | 1,433 | 1,455 | 1,458 |
| Civilian | 263 | 275 | 292 | 289 | 289 | 289 | |
| 3.0 Defence Ready Force Element Production | Military – Regular Force | 25,627 | 25,735 | 24,325 | 24,580 | 24,964 | 25,006 |
| Civilian | 1,457 | 1,507 | 2,134 | 3,449 | 3,449 | 3,449 | |
| 4.0 Defence Capability Element Production | Military – Regular Force | 31,860 | 31,712 | 31,804 | 32,134 | 32,630 | 32,688 |
| Civilian | 15,803 | 15,624 | 17,754 | 15,919 | 15,919 | 15,919 | |
| 5.0 Defence Capability Development and Research | Military – Regular Force | 788 | 671 | 1,028 | 1,038 | 1,055 | 1,056 |
| Civilian | 1,381 | 1,394 | 1,418 | 1,410 | 1,410 | 1,410 | |
| Subtotal | Military – Regular Force | 65,609 | 65,347 | 65,306 | 65,984 | 67,008 | 67,124 |
| Civilian | 19,565 | 19,488 | 22,250 | 22,031 | 22,031 | 22,031 | |
| Internal Services Subtotal | Military – Regular Force | 521 | 532 | 853 | 861 | 875 | 876 |
| Civilian | 2,446 | 2,666 | 2,157 | 2,254 | 2,254 | 2,254 | |
| Subtotal | Military – Regular Force | 66,130 | 65,879 | 66,159 | 66,845 | 67,883 | 68,000 |
| Civilian | 22,011 | 22,154 | 24,407 | 24,285 | 24,285 | 24,285 | |
| Total | 88,141 | 88,033 | 90,566 | 91,130 | 92,168 | 92,285 |
The Regular Force personnel strength is currently about 2,000 personnel below its authorized strength of 68,000. The institutional timetable details the annual change to manning levels forecasts the Regular Force to its authorized strength prior to 2020. That carefully balanced rate of increase fully utilizes the CAF’s current training capacity. The institutional timetable will be closely monitored.
The Department will continue to realign the civilian workforce in support of strategic priorities. Growth in key areas is projected and strategies are being implemented to increase growth and retention. The effect of these measures may not be visible in the short term.
Total planned human resources – Reserve Force personnel
The Reserve Force is a unique and valued component of the CAF. It is divided into three distinct sub-components: the Primary Reserve, Cadet Organization Administration and Training Service and the Canadian Rangers.
The Primary Reserve is currently below the Government of Canada authorized strength due to unscheduled attrition and challenges in meeting recruiting quotas. A review of the Primary Reserve has been completed and areas for growth identified to increase its effective strength to 28,500 by 2019. A complete establishment review will be conducted to ensure that future allocation and employment of personnel is consistent with Defence priorities.
The Cadet Organization Administration and Training Service completed an organizational restructure and will be maintained at the current approved target of 8,000 personnel.
An analysis of the Canadian Rangers is currently underway under the auspices of the Government of Canada’s Northern Strategy. The goal is to identify potential growth, and to determine if there is a need for increased capabilities within this sub-component of the Reserves.
The following table provides our total planned human resources for Reserve Force Personnel for the next three fiscal years, 2017-20.41
| 2017-18 | 2018-19 | 2019-20 | |
|---|---|---|---|
| Primary Reserve | 27,000 | 28,500 | 28,500 |
| Cadet Organization Administration and Training Service |
8,000 | 8,000 | 8,000 |
| Canadian Rangers | 5,000 | 5,000 | 5,000 |
Estimates by vote
For information on the Department of National Defence and the Canadian Armed Forces appropriations, consult the 2017-18 Main Estimates.42
Future-Oriented Condensed Statement of Operations
The Future-Oriented Condensed Statement of Operations provides a general overview of the Department of National Defence and the Canadian Armed Forces’ operations. The forecast of financial information on expenses and revenues is prepared on an accrual accounting basis to strengthen accountability and to improve transparency and financial management. Under cash-based accounting, expenditures are recorded in the amount and in the year that a cash payment is made. Under accrual-based accounting the expense is recorded in an amount and in the year the associated benefit is incurred. Funds set aside in the Fiscal Framework are recorded on the accrual basis.
Because the Future-Oriented Condensed Statement of Operations is prepared on an accrual accounting basis, and the forecast and planned spending amounts presented in other sections of the Departmental Plan are prepared on an expenditure cash basis, amounts may differ.
A more detailed Future-Oriented Statement of Operations and associated notes, including a reconciliation of the net cost of operations to the requested authorities, are available on the Department of National Defence and the Canadian Armed Forces website.
| Financial information | 2016-17 Forecast results |
2017-18 Planned results |
Difference (2017-18 Planned results minus 2016-17 Forecast results) |
|---|---|---|---|
| Total expenses | 20,335,674,000 | 20,072,635,000 | 263,039,000 |
| Total revenues | 547,694,000 | 482,923,000 | 64,771,000 |
| Net cost of operations before government funding and transfers | 19,787,980,000 | 19,589,712,000 | 198,268,000 |
Source: Assistant Deputy Minister (Finance) / Chief Financial Officer Group