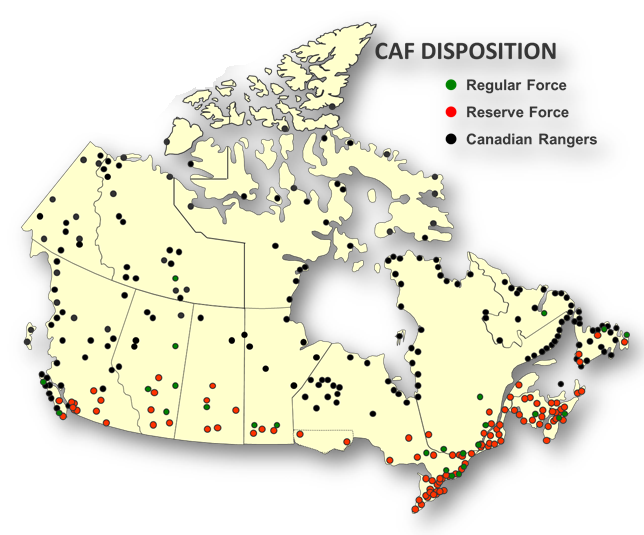
Canadian Armed Forces Overall Footprint
Archived content
This page was proactively published to meet the requirements of the Access to Information Act. It is a historical record which was valid when published, but may now contain information which is out of date.
CAF Disposition

Canadian Armed Forces military installations

Long description of Canadian Armed Forces military installations graphic
- Yukon:
- Joint Task Force North Whitehorse
- Northwest Territories:
- Joint Task Force North
- British Columbia:
- 19 Wing Comox
- Canadian Forces Base Equimalt
- Alberta:
- Canadian Forces Base Edmonton
- Canadian Forces Base Wainwright
- 4 Wing Cold Lake
- Canadian Forces Base Suffield
- Saskatchewan:
- 18 Wing Moose Jaw
- Manitoba:
- Canadian Forces Base Shilo
- 17 Wing Winnipeg
- Ontario:
- 22 Wing North Bay
- Canadian Forces Base Petawawa
- Canadian Forces Base Borden
- Canadian Forces Support Unit Ottawa
- Canadian Forces Base Kingston
- 8 Wing Trenton
- Quebec:
- 3 Wing Bagotville
- Canadian Forces Base Valcartier
- Area Support Unit Montreal
- New Brunswick:
- Canadian Forces Base Gagetown
- Nova Scotia:
- 14 Wing Greenwood
- Canadian Forces Base Halifax
- Newfoundland and Labrador:
- 5 Wing Goose Bay
- 9 Wing Gander
Civilian employees by location

Public Service Employee Overview
- Total public service population: 28,712 (~25% of the Defence Team population).
- ~3,700 military supervisors of public service employees.
- ~60 occupational groups ranging from administrative support to technical trades to defence research and scientists (some are unique to DND).
- Workforce is 57% male, average age is 47 with more than 40% of the workforce over 50.
- 23% of the workforce are former CAF which influences both the average age and the EE demographics.
Long description of Public Service Employee Overview graphic
- Northwest Territories:
- Yellowknife: 34
- British Columbia
- Comox: 248
- Nanoose: 40
- Esquimalt: 2,408
- Chiliwack: 0
- Alberta:
- Cold Lake: 359
- Edmonton: 626
- Wainwright: 327
- Suffield: 637
- Saskatchewan:
- Dundurn: 110
- Moose Jaw: 56
- Manitoba:
- Shilo: 292
- Winnipeg: 597
- Ontario:
- North Bay: 68
- Petawawa: 653
- Borden: 961
- London: 38
- Kingston: 1,385
- Trenton: 559
- Toronto: 420
- National Capital Region: 11,176
- Quebec:
- Montreal: 1,728
- Valcartier: 1,315
- Bagotville: 240
- New Brunswick:
- Gagetown: 976
- Nova Scotia:
- Halifax: 2,938
- Aldershot: 39
- Greenwood: 309
- Newfoundland and Labrador:
- St. John’s: 28
- Gander: 41
- Goose Bay: 42
- Total public service employees on map locations: 28,696
- Total public service locations located off map: 16
- Total public service population: 28,712
- Locations in close proximity have been aggregated
Economic presence

* The dollar amounts represent DND spending on personnel, operations and maintenance, capital, and grants and contributions. Personnel spending reflects only salaries and wages. Benefits and allowances are not included.
Long description of Economic presence graphic
Economic presence
Spending (FY 2019-2020)
- Personnel: $7,487 million
- O&M: $6,643 million
- Capital: $2,618 million
- G&C: $14 million
- Total spending: $16,763 million
Spending by province
- Yukon: $4 million
- Northwest Territories: $32 million
- Nunavut: $5 million
- British Columbia: $1,662 million
- Alberta: $1,135 million
- Saskatchewan: $108 million
- Manitoba: $474 million
- Ontario: $7,422 million
- Quebec: $3,121 million
- New Brunswick: $623 million
- Nova Scotia: $1,846 million
- Newfoundland and Labrador: $163 million
- Prince Edward Island: $169 million
