
Employment Equity Act: Annual Report 2020
On this page
- 2020 message from the Minister
- Introduction
- Section 1: Federally regulated private sector
- Section 2: Sector profiles
- Section 3: Designated group profiles
- Section 4: Employment equity highlights
- Conclusion
- Appendix A: Federally regulated private sector employers tables
- Appendix B: Technical notes
Alternate formats

Employment Equity Act: Annual Report 2020 [PDF - 1.30 MB]
Large print, braille, MP3 (audio), e-text and DAISY formats are available on demand by ordering online or calling 1 800 O-Canada (1-800-622-6232). If you use a teletypewriter (TTY), call 1-800-926-9105.
List of abbreviations
- The Act
- Employment Equity Act
- LMA
- Labour market availability
- FCP
- Federal Contractors Program
- WORBE
- Workplace Opportunities: Removing Barriers to Equity
- FAA
- Financial Administration Act
List of tables
- Table 1A: Representation and attainment rate of women in 2018 and 2019 (by percentage)
- Table 1B: Designated group representation and attainment rate in 2018 and 2019 (by percentage)
- Table 2A: Distribution of women and men in permanent full-time employment by salary range as of December 31, 2019 (by percentage)
- Table 2B: Distribution of Aboriginal and non-Aboriginal peoples in permanent full-time employment by salary range as of December 31, 2019 (by percentage)
- Table 2C: Distribution of persons with and without disabilities in permanent full-time employment by salary range as of December 31, 2019 (by percentage)
- Table 2D: Distribution of members and non-members of visible minorities in permanent full-time employment by salary range as of December 31, 2019 (by percentage)
- Table 3A: Number and percentage distribution of employers by sector in 2018 and 2019
- Table 3B: Number and percentage distribution of employees by sector in 2018 and 2019
- Table 3C: Number and percentage distribution of employers by subsectors of the transportation sector in 2018 and 2019
- Table 3D: Number and percentage distribution of employees by subsectors of the transportation sector in 2018 and 2019
- Table 3E: Number and percentage distribution of employers by subsectors of the ‘other’ sector in 2018 and 2019
- Table 3F: Number and percentage distribution of employees by subsectors of the ‘other’ sector in 2018 and 2019
- Table 4A: Representation and attainment rate of designated group members in the banking and financial services sector in 2018 and 2019 (by percentage)
- Table 4B: Representation and attainment rate of designated group members in the communications sector in 2018 and 2019 (by percentage)
- Table 4C: Representation and attainment rate of designated group members in the transportation sector in 2018 and 2019 (by percentage)
- Table 4D.1: Representation and attainment rate of designated group members in the air transportation subsector in 2018 and 2019 (by percentage)
- Table 4D.2: Representation and attainment rate of designated group members in the ground transportation subsector in 2018 and 2019 (by percentage)
- Table 4D.3: Representation and attainment rate of designated group members in the water transportation subsector in 2018 and 2019 (by percentage)
- Table 4E: Representation and attainment rate of designated group members in the ‘other’ sector in 2018 and 2019 (by percentage)
- Table 4F.1: Representation and attainment rate of designated group members in the production industries subsector in 2018 and 2019 (by percentage)
- Table 4F.2: Representation and attainment rate of designated group members in the service industries subsector in 2018 and 2019 (by percentage)
- Table 1.1: Representation and availability of women in the federally regulated private sector by census metropolitan area, province and territory in 1987, 2018 and 2019 (by percentage)
- Table 1.2: Representation and availability of Aboriginal peoples in the federally regulated private sector by census metropolitan area, province and territory in 1987, 2018 and 2019 (by percentage)
- Table 1.3: Representation and availability of persons with disabilities in the federally regulated private sector by census metropolitan area, province and territory in 1987, 2018 and 2019 (by percentage)
- Table 1.4: Representation and availability of members of visible minorities in the federally regulated private sector by census metropolitan area, province and territory in 1987, 2018 and 2019 (by percentage)
- Table 2.1: Representation and attainment rate (sector availability) of women in the banking and financial services sector by occupational group in 2018 and 2019 (by percentage)
- Table 2.2: Representation and attainment rate (sector availability) of women in the communications sector by occupational group in 2018 and 2019 (by percentage)
- Table 2.3: Representation and attainment rate (sector availability) of women in the transportation sector by occupational group in 2018 and 2019 (by percentage)
- Table 2.4: Representation and attainment rate (sector availability) of women in the ‘other’ sector by occupational group in 2018 and 2019 (by percentage)
- Table 2.5: Representation and attainment rate (sector availability) of Aboriginal peoples in the banking and financial services sector by occupational group in 2018 and 2019 (by percentage)
- Table 2.6: Representation and attainment rate (sector availability) of Aboriginal peoples in the communications sector by occupational group in 2018 and 2019 (by percentage)
- Table 2.7: Representation and attainment rate (sector availability) of Aboriginal peoples in the transportation sector by occupational group in 2018 and 2019 (by percentage)
- Table 2.8: Representation and attainment rate (sector availability) of Aboriginal peoples in the ‘other’ sector by occupational group in 2018 and 2019 (by percentage)
- Table 2.9: Representation and attainment rate (sector availability) of members of visible minorities in the banking and financial services sector by occupational group in 2018 and 2019 (by percentage)
- Table 2.10: Representation and attainment rate (sector availability) of members of visible minorities in the communications sector by occupational group in 2018 and 2019 (by percentage)
- Table 2.11: Representation and attainment rate (sector availability) of members of visible minorities in the transportation sector by occupational group in 2018 and 2019 (by percentage)
- Table 2.12: Representation and attainment rate (sector availability) of members of visible minorities in the ‘other’ sector by occupational group in 2018 and 2019 (by percentage)
- Table 2.13: Representation and attainment rate (Canadian availability) of women in all sectors by occupational group in 2018 and 2019 (by percentage)
- Table 2.14: Representation and attainment rate (Canadian availability) of Aboriginal peoples in all sectors by occupational group in 2018 and 2019 (by percentage)
- Table 2.15: Representation and attainment rate (Canadian availability) of persons with disabilities in all sectors by occupational group in 2018 and 2019 (by percentage)
- Table 2.16: Representation and attainment rate (Canadian availability) of members of visible minorities in all sectors by occupational group in 2018 and 2019 (by percentage)
- Table 3.1: Distribution of women and men in the federally regulated private sector by occupational group in 2018 and 2019 (by percentage)
- Table 3.2: Distribution of Aboriginal and non-Aboriginal peoples in the federally regulated private sector by occupational group in 2018 and 2019 (by percentage)
- Table 3.3: Distribution of persons with and without disabilities in the federally regulated private sector by occupational group in 2018 and 2019 (by percentage)
- Table 3.4: Distribution of members and non-members of visible minorities in the federally regulated private sector by occupational group in 2018 and 2019 (by percentage)
- Table 4.1: Number, hires, promotions, terminations and net effect of designated group members in the banking and financial services sector in 2018 and 2019
- Table 4.2: Representation and shares of hires, promotions and terminations of designated group members in the banking and financial services sector in 2018 and 2019 (by percentage)
- Table 4.3: Number, hires, promotions, terminations and net effect of designated group members in the communications sector in 2018 and 2019
- Table 4.4: Representation and shares of hires, promotions and terminations of designated group members in the communications sector in 2018 and 2019 (by percentage)
- Table 4.5: Number, hires, promotions, terminations and net effect of designated group members in the transportation sector in 2018 and 2019
- Table 4.6: Representation and shares of hires, promotions and terminations of designated group members in the transportation sector in 2018 and 2019 (by percentage)
- Table 4.7: Number, hires, promotions, terminations and net effect of designated group members in the ‘other’ sector in 2018 and 2019
- Table 4.8: Representation and shares of hires, promotions and terminations of designated group members in the ‘other’ sector in 2018 and 2019 (by percentage)
- Table 4.9: Number, hires, promotions, terminations and net effect of designated group members in all sectors in 2018 and 2019
- Table 4.10: Representation and shares of hires, promotions and terminations of designated group members in all sectors in 2018 and 2019 (by percentage)
- Table 5.1: Number and representation of men and women in permanent full-time employment in the federally regulated private sector by salary range as of December 31, 2019
- Table 5.2: Number and representation of Aboriginal peoples in permanent full-time employment in the federally regulated private sector by salary range as of December 31, 2019
- Table 5.3: Number and representation of persons with disabilities in permanent full-time employment in the federally regulated private sector by salary range as of December 31, 2019
- Table 5.4: Number and representation of members of visible minorities in permanent full-time employment in the federally regulated private sector by salary range as of December 31, 2019
- Table 6.1: Number and representation of men and women in permanent part-time employment in the federally regulated private sector by salary range as of December 31, 2019
- Table 6.2: Number and representation of Aboriginal peoples in permanent part-time employment in the federally regulated private sector by salary range as of December 31, 2019
- Table 6.3: Number and representation of persons with disabilities in permanent part-time employment in the federally regulated private sector by salary range as of December 31, 2019
- Table 6.4: Number and representation of members of visible minorities in permanent part-time employment in the federally regulated private sector by salary range as of December 31, 2019
List of charts
- Chart 1: Designated group attainment rate (Canadian LMA) from 1987 to 2019 (by percentage)
- Chart 2: Representation and Canadian LMA of women from 1987 to 2019 (by percentage)
- Chart 3: Attainment rate (occupational group’s Canadian LMA) of women in 2018 and 2019 (by percentage)
- Chart 4: Representation and Canadian LMA of Aboriginal peoples from 1987 to 2019 (by percentage)
- Chart 5: Attainment rate (occupational group’s Canadian LMA) of Aboriginal peoples in 2018 and 2019 (by percentage)
- Chart 6: Representation and Canadian LMA of persons with disabilities from 1987 to 2019 (by percentage)
- Chart 7: Attainment rate (occupational group’s Canadian LMA) of persons with disabilities in 2018 and 2019 (by percentage)
- Chart 8: Representation and Canadian LMA of members of visible minorities from 1987 to 2019 (by percentage)
- Chart 9: Attainment rate (occupational group’s Canadian LMA) of members of visible minorities in 2018 and 2019 (by percentage)
2020 message from the Minister
I am pleased to present the Employment Equity Act: Annual Report 2020. This report captures the most recent data on employment equity in federally regulated private sector workplaces. Overall, the report shows that while some progress was made in 2019, there remains work ahead to secure the full inclusion of the 4 designated groups covered under the Employment Equity Act.
In addition to the data presented, we must also recognize the lived experiences of Black, Indigenous and racialized individuals, LGBTQ2 people, women and persons with disabilities in federally regulated workplaces as we work to identify ways to make these spaces more inclusive and representative.
The Government of Canada is taking meaningful action to ensure workplaces are fair, inclusive, diverse, respectful and secure:
- we brought into force workplace harassment and violence prevention legislation with Bill C-65 and its regulations, which provide a comprehensive, streamlined approach to protecting workers against all forms of harassment and violence
- we implemented new pay transparency measures to help address wage gaps experienced by all four designated groups. This makes pay information available that can help shift business culture and expectations toward greater equality
- we are moving forward with the implementation of the Pay Equity Act, which will help ensure that women in all designated groups receive equal pay for work of equal value
We will soon be launching a task force to review the Employment Equity Act. the Act is a critical tool to ensure that our workplaces are equitable, diverse and representative spaces—yet, it has not seen a substantial overhaul since it was introduced 35 years ago. Through consultations and research, the task force will make evidence-based recommendations on how to modernize the Act. It will also advise on how a renewed act can contribute to ensuring that Canada’s economic recovery is equitable, inclusive and fair.
The COVID-19 pandemic has shaken our country and changed the way that many of us work and live. While everyone has been affected in some way, certain groups have felt the impacts more than others. The pandemic has also amplified many of the social and economic barriers that some were already facing. As we look toward our country’s economic recovery and growth, we must work together to build back better with equity and equality at the heart of everything we do.
This has been a challenging time, but I want to recognize the leadership and ongoing efforts of those who have continued working toward greater equity in their workplaces. Their efforts to eliminate barriers to recruitment, promotion and retention in their workplaces are critical to our success. Let’s keep working together to give all Canadians a fair and equal chance to live out their dreams and reach their full potential.
Minister of Labour
Filomena Tassi
Introduction
Under the Employment Equity Act (the Act), the Minister of Labour must prepare and table an annual report to Parliament on the status of employment equity in the federally regulated private sector.Footnote 1 This report consolidates and highlights the results achieved by employers subject to the Legislated Employment Equity ProgramFootnote 2 during the 2019 calendar year for the 4 designated groups:
- women
- Aboriginal peoples
- persons with disabilities, and
- members of visible minorities
The Act aims to achieve equality in the workplace so that no person shall be denied employment opportunities or benefits for reasons unrelated to ability. In the fulfilment of that goal, the Act seeks to correct the conditions of disadvantage in employment experienced by the 4 designated groups.
The Act supports the principle that employment equity means more than not only treating persons in the same way, but also requires special measures and the accommodation of differences.
In addition to presenting consolidated data from 2019, data from 2018 is provided to allow year-to-year comparison. The individual employers’ statistical forms containing the disaggregated data that is consolidated in this report are made available online.
Federally regulated private sector
Employers are grouped by sector, based on the classification of the majority of their workforce using the North American Industry Classification System. The federally regulated private sector workforce comprises 4 industrial sectors:
- banking and financial services: Includes all major Canadian banks and other establishments primarily engaged in financial transactions or in facilitating financial transactions
- communications: Comprises businesses that operate radio and television broadcasting studios and facilities, as well as telecommunications services providers
- transportation: Consists of:
- air, rail, bus, water and pipeline transportation industries
- inter-provincial trucking
- postal service
- couriers
- warehousing and storage
- other: Encompasses industries such as:
- nuclear power generation
- metal ore mining
- professional, scientific and technical services
- investigation and security services
- public administration
About the data
Employment equity requires employers to establish working conditions that are free of barriers, and to correct conditions of disadvantage in employment. It also means that equality requires special measures and the accommodation of differences. Employers use their data to assess representation gaps, determine whether there are barriers and identify where progress can be made.
Under the Act, employer reports consist of the following:
- statistical forms containing data on the number of employees and designated groups, their employment status (for example —permanent full-time, permanent part-time and temporary) geography, gender, occupational group and salary range, as well as data on the number of hires, promotions and terminations
- narrative reports providing information on consultations with employee representatives, measures taken to implement employment equity and the results achieved
A key employment equity performance measurement is the attainment rate,Footnote 3 where the representationFootnote 4 of designated groups is compared to their respective labour market availabilityFootnote 5 (LMA). The attainment rate is used to identify gaps between the representation and LMA of a designated group. Where a designated group’s representation is below LMA, the attainment rate is less than 100%. Progress is considered to have been made when the gap between a designated group’s representation and LMA narrows (that is, the attainment rate approaches 100%) or when a group’s representation equals or exceeds LMA (that is, the attainment rate equals or surpasses 100%). A segment of the workforce is considered representative when the representation of a designated group is equal to its LMA.
For this report, LMA is based on Statistics Canada data at the Canadian or sector level. The 2018 and 2019 employer data is compared to the 2016 Census for women, Aboriginal peoples and members of visible minorities. For persons with disabilities, the 2017 Canadian Survey on Disability (CSD) is used.
Section 1: Federally regulated private sector
For 2019, 595 employers submitted an employment equity annual report to the Minister of Labour. Together, they employed 776,997 employees across Canada, which represents approximately 3.8%Footnote 6 of the Canadian workforce. Of these submissions, 24 were from employers who were reporting for the first time on their 4,595 employees. Therefore, these employers reported statistical information for men and women only and will provide complete reports (that is, on all designated groups) for the 2020 reporting year and subsequent years.
Data from all 595 employers (Table 1A) shows that both the representation and the attainment rate of Canadian LMA of women remained about the same in 2018 and 2019.
| Year | Representation | LMA (Canadian)* |
Attainment rate |
|---|---|---|---|
| 2018 for all 603 employers | 39.3 | 48.2 | 81.6 |
| 2019 for all 595 employers | 39.4 | 48.2 | 81.7 |
* Source: Statistics Canada, 2016 Census.
Complete data from 571 employers, with 772,402 employees, (Table 1B) shows that the representation and attainment rates of women, Aboriginal peoples and persons with disabilities remained about the same between 2018 and 2019. Representation increased for members of visible minorities by +0.6 of a percentage point. Members of visible minorities was the only designated group whose representation exceeded Canadian LMA.
| Designated groups | 2018 representation for 536 employers | 2019 representation for 571 employers | Change* in representation from 2018 to 2019 | LMA (Canadian)** | 2018 attainment rate | 2019 attainment rate |
|---|---|---|---|---|---|---|
| Women | 39.4 | 39.5 | 0.0 | 48.2 | 81.8 | 81.9 |
| Aboriginal peoples | 2.3 | 2.3 | 0.0 | 4.0 | 57.1 | 57.8 |
| Persons with disabilities | 3.4 | 3.5 | 0.0 | 9.1 | 37.5 | 37.9 |
| Members of visible minorities | 23.8 | 24.4 | +0.6 | 21.3 | 111.8 | 114.5 |
* Change values may not equal the differences between the representation rates due to rounding.
** Sources: Statistics Canada, 2016 Census and 2017 Canadian Survey on Disability.
From this point forward, this report will cover information on the 571 employers who prepared a full set of employment equity forms (that is, exclude the 24 employers who reported for the first time).
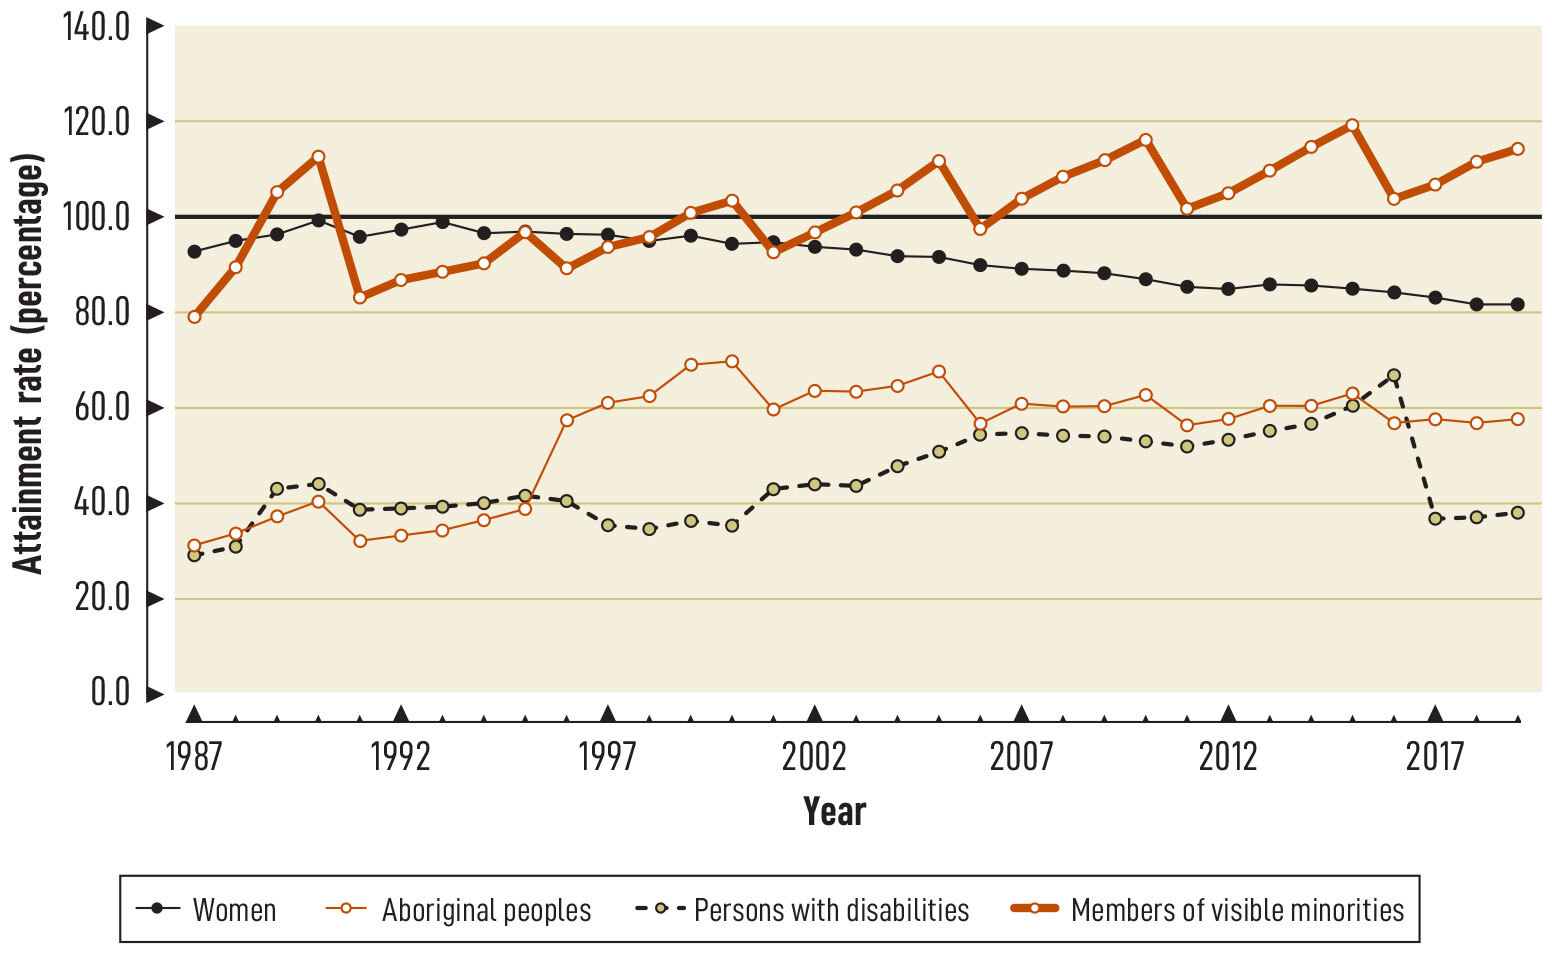
Chart 1 presents the attainment rate for the 4 designated groups at the overall national level since 1987, when employers started reporting under the Act. Values below 100% show that representation is less than LMA.
For women, the attainment rate has been declining since reaching its highest point in 1990 (99.4%), and 2018 marked the lowest rate (81.8%). For 2019, there was a small increase to 81.9%.
From 1987 to 2000, the attainment rate for Aboriginal peoples exhibited an upward trend. The sharp increase of 18.8 percentage points posted from 1995 (39.1%) to 1996 (57.9%) was due to changes made to LMA. Since 2001, the attainment rate has remained stable and, for 2019, was 57.8%.
The attainment rate of persons with disabilities more than doubled from 29.4% in 1987 to 67.0% in 2016. In 2017, because of changes in the collection of LMA data, this measurement increased from 4.9% to 9.1%. Given the new LMA, the attainment rate dropped to 36.4%. However, for 2019, there was a small increase to 37.9%.
For members of visible minorities, the attainment rate has been positive since 2007. While there have been adjustments to attainment rates due to changes to LMA, there continues to be an upward trend with the attainment rate for 2019 at 114.5%.
* Sources: Statistics Canada, 1986 to 2016 Census; 1986 and 1991 Health and Activity Limitation Survey; 2001 and 2006 Participation and Activity Limitation Survey; 2011 National Household Survey; and 2012 and 2017 Canadian Survey on Disability.
Chart 1: text description
| Year | Women (by percentage) |
Aboriginal peoples (by percentage) | Persons with disabilities (by percentage) | Members of visible minorities (by percentage) |
|---|---|---|---|---|
| 1987 | 93.0 | 31.4 | 29.4 | 79.3 |
| 1988 | 95.3 | 34.0 | 31.2 | 90.0 |
| 1989 | 96.6 | 37.7 | 43.3 | 105.9 |
| 1990 | 99.4 | 40.6 | 44.3 | 112.5 |
| 1991 | 96.3 | 32.1 | 38.6 | 83.1 |
| 1992 | 97.3 | 33.7 | 39.1 | 86.9 |
| 1993 | 99.1 | 34.8 | 39.5 | 88.5 |
| 1994 | 96.7 | 36.7 | 40.4 | 90.4 |
| 1995 | 96.9 | 39.1 | 42.0 | 97.1 |
| 1996 | 96.6 | 57.9 | 40.9 | 89.3 |
| 1997 | 96.0 | 61.3 | 35.6 | 93.9 |
| 1998 | 95.2 | 62.7 | 34.8 | 95.7 |
| 1999 | 96.1 | 69.4 | 36.8 | 101.2 |
| 2000 | 94.3 | 70.3 | 35.7 | 103.6 |
| 2001 | 94.8 | 59.8 | 43.2 | 92.6 |
| 2002 | 93.9 | 63.9 | 44.3 | 97.0 |
| 2003 | 93.0 | 63.6 | 43.8 | 101.0 |
| 2004 | 91.8 | 64.7 | 48.0 | 105.5 |
| 2005 | 91.5 | 67.8 | 50.9 | 111.6 |
| 2006 | 89.9 | 57.1 | 54.5 | 97.5 |
| 2007 | 89.2 | 61.2 | 55.0 | 103.8 |
| 2008 | 88.9 | 60.5 | 54.3 | 108.3 |
| 2009 | 88.2 | 60.8 | 54.2 | 111.9 |
| 2010 | 87.0 | 62.7 | 53.1 | 116.1 |
| 2011 | 85.5 | 56.4 | 52.2 | 102.1 |
| 2012 | 84.9 | 58.4 | 53.5 | 104.7 |
| 2013 | 86.2 | 60.7 | 55.4 | 110.0 |
| 2014 | 85.8 | 60.9 | 56.6 | 114.7 |
| 2015 | 85.1 | 63.1 | 60.4 | 119.0 |
| 2016 | 84.5 | 57.0 | 67.0 | 104.0 |
| 2017 | 83.3 | 57.9 | 36.4 | 107.1 |
| 2018 | 81.8 | 57.1 | 37.5 | 111.8 |
| 2019 | 81.9 | 57.8 | 37.9 | 114.5 |
Note: In 1996, the Census methodology for calculating LMA of Aboriginal peoples changed, causing a drop in LMA. In 2001, Statistics Canada began using the World Health Organization’s International Classification of Functioning, Disability and Health framework to define disability rather than the 1980 International Classification of Impairments, Disabilities, and Handicaps; this resulted in a drop in LMA for persons with disabilities. In 2017, Statistics Canada introduced a new methodology for gathering data on persons with disabilities that resulted in a significant increase in LMA for this designated group.
Tables 2A, 2B, 2C and 2D show the distribution and cumulative distribution of permanent full-time designated group and non-designated group employees by salary range: under $15,000, various ranges from $15,000 to $99,999, and $100,000 and over.
The data shows that designated groups had higher concentrations of members in some salary ranges when compared to other groups of employees within the same range. For example:
- the highest proportion of women (18.4%) earned between $50,000 and $59,999, compared to 25.5% of men, 18.2% of Aboriginal peoples, 22.2% of non-Aboriginal peoples, 19.1% of persons with disabilities, 22.2% of persons without disabilities, 20.3% of members of visible minorities and 22.7% of non-visible minority members who earned $100,000 and over
- a high proportion of women (29.0%) earned a salary below $50,000, compared to 19.5% of men, 26.2% of Aboriginal peoples, 23.0% of non-Aboriginal peoples, 25.1% of persons with disabilities, 23.0% of persons without disabilities, 25.7% of members of visible minorities and 22.3% of non-visible minority members
- a high proportion of Aboriginal peoples (13.1%) earned a salary below $40,000, compared to 9.8% of non-Aboriginal peoples, 12.5% of women, 8.3% of men, 9.8% of persons with disabilities, 9.9% of persons without disabilities, 10.9% of members of visible minorities and 9.6% of non-visible minority members
- over one half of persons with disabilities (52.1%) earned salaries between $35,000 and $69,999, compared to 47.2% of persons without disabilities, 54.2% of women and 43.3% of men
- a high proportion of members of visible minorities (41.3%) earned salaries between $20,000 and $59,999, compared to 37.5% of non-visible minority members, 46.8% of women and 33.3% of men
| Salary range (in dollars) |
Women distribution | Women cumulative distribution* | Men distribution | Men cumulative distribution* |
|---|---|---|---|---|
| Under 15,000 | 0.5 | 0.5 | 0.7 | 0.7 |
| 15,000 to 19,999 | 0.1 | 0.6 | 0.2 | 0.9 |
| 20,000 to 24,999 | 0.8 | 1.4 | 0.4 | 1.3 |
| 25,000 to 29,999 | 1.9 | 3.3 | 1.1 | 2.5 |
| 30,000 to 34,999 | 3.3 | 6.6 | 2.2 | 4.6 |
| 35,000 to 37,499 | 2.7 | 9.3 | 1.7 | 6.3 |
| 37,500 to 39,999 | 3.2 | 12.5 | 2.0 | 8.3 |
| 40,000 to 44,999 | 8.1 | 20.6 | 5.5 | 13.9 |
| 45,000 to 49,999 | 8.4 | 29.0 | 5.7 | 19.5 |
| 50,000 to 59,999 | 18.4 | 47.4 | 14.7 | 34.3 |
| 60,000 to 69,999 | 13.4 | 60.8 | 13.6 | 47.9 |
| 70,000 to 84,999 | 13.6 | 74.4 | 15.2 | 63.1 |
| 85,000 to 99,999 | 9.1 | 83.5 | 11.4 | 74.5 |
| 100,000 and over | 16.5 | 100.0 | 25.5 | 100.0 |
* Each figure in the cumulative percentage columns represents the cumulative total percentage of employees in the identified salary range or lower.
| Salary range (in dollars) |
Aboriginal peoples distribution | Aboriginal peoples cumulative distribution* | Non-Aboriginal peoples distribution | Non-Aboriginal peoples cumulative distribution* |
|---|---|---|---|---|
| Under 15,000 | 0.8 | 0.8 | 0.6 | 0.6 |
| 15,000 to 19,999 | 0.4 | 1.2 | 0.2 | 0.8 |
| 20,000 to 24,999 | 0.7 | 1.9 | 0.5 | 1.3 |
| 25,000 to 29,999 | 2.0 | 3.9 | 1.4 | 2.7 |
| 30,000 to 34,999 | 3.7 | 7.7 | 2.6 | 5.3 |
| 35,000 to 37,499 | 2.7 | 10.3 | 2.1 | 7.4 |
| 37,500 to 39,999 | 2.8 | 13.1 | 2.4 | 9.8 |
| 40,000 to 44,999 | 6.3 | 19.4 | 6.5 | 16.3 |
| 45,000 to 49,999 | 6.9 | 26.2 | 6.7 | 23.0 |
| 50,000 to 59,999 | 16.3 | 42.5 | 16.1 | 39.2 |
| 60,000 to 69,999 | 14.2 | 56.8 | 13.5 | 52.7 |
| 70,000 to 84,999 | 15.3 | 72.0 | 14.6 | 67.3 |
| 85,000 to 99,999 | 9.8 | 81.8 | 10.5 | 77.8 |
| 100,000 and over | 18.2 | 100.0 | 22.2 | 100.0 |
* Each figure in the cumulative percentage columns represents the cumulative total percentage of employees in the identified salary range or lower.
| Salary range (in dollars) |
Persons with disabilities distribution | Persons with disabilities cumulative distribution* | Persons without disabilities distribution | Persons without disabilities cumulative distribution* |
|---|---|---|---|---|
| Under 15,000 | 0.3 | 0.3 | 0.7 | 0.7 |
| 15,000 to 19,999 | 0.1 | 0.4 | 0.2 | 0.8 |
| 20,000 to 24,999 | 0.2 | 0.7 | 0.6 | 1.4 |
| 25,000 to 29,999 | 1.0 | 1.6 | 1.4 | 2.8 |
| 30,000 to 34,999 | 2.6 | 4.2 | 2.6 | 5.4 |
| 35,000 to 37,499 | 2.5 | 6.7 | 2.1 | 7.5 |
| 37,500 to 39,999 | 3.0 | 9.8 | 2.4 | 9.9 |
| 40,000 to 44,999 | 8.0 | 17.8 | 6.4 | 16.3 |
| 45,000 to 49,999 | 7.3 | 25.1 | 6.7 | 23.0 |
| 50,000 to 59,999 | 17.5 | 42.6 | 16.1 | 39.1 |
| 60,000 to 69,999 | 13.7 | 56.2 | 13.5 | 52.6 |
| 70,000 to 84,999 | 14.3 | 70.5 | 14.6 | 67.3 |
| 85,000 to 99,999 | 10.3 | 80.9 | 10.5 | 77.8 |
| 100,000 and over | 19.1 | 100.0 | 22.2 | 100.0 |
* Each figure in the cumulative percentage columns represents the cumulative total percentage of employees in the identified salary range or lower.
| Salary range (in dollars) |
Members of visible minorities distribution | Members of visible minorities cumulative distribution* | Non-members of visible minorities distribution | Non-members of visible minorities cumulative distribution* |
|---|---|---|---|---|
| Under 15,000 | 0.5 | 0.5 | 0.7 | 0.7 |
| 15,000 to 19,999 | 0.2 | 0.7 | 0.2 | 0.8 |
| 20,000 to 24,999 | 0.6 | 1.3 | 0.5 | 1.4 |
| 25,000 to 29,999 | 1.6 | 2.9 | 1.3 | 2.7 |
| 30,000 to 34,999 | 2.8 | 5.7 | 2.5 | 5.3 |
| 35,000 to 37,499 | 2.4 | 8.1 | 2.0 | 7.3 |
| 37,500 to 39,999 | 2.8 | 10.9 | 2.3 | 9.6 |
| 40,000 to 44,999 | 7.5 | 18.4 | 6.2 | 15.8 |
| 45,000 to 49,999 | 7.3 | 25.7 | 6.5 | 22.3 |
| 50,000 to 59,999 | 16.3 | 42.0 | 16.0 | 38.3 |
| 60,000 to 69,999 | 12.8 | 54.8 | 13.8 | 52.1 |
| 70,000 to 84,999 | 14.1 | 68.9 | 14.8 | 66.9 |
| 85,000 to 99,999 | 10.8 | 79.7 | 10.4 | 77.3 |
| 100,000 and over | 20.3 | 100.0 | 22.7 | 100.0 |
* Each figure in the cumulative percentage columns represents the cumulative total percentage of employees in the identified salary range or lower.
Section 2: Sector profiles
Sector employers and employees
This section provides an analysis of the combined federally regulated private sector, as well as its 4 industrial sectors and their subsectors for 2018 and 2019.
Between 2018 and 2019, the overall number of employers increased by +6.5% and the number of employees overall increased by +2.1% (shown in Table 3A and Table 3B, respectively).
While accounting for less than 10% of the employer population, the banking and financial services sector employs nearly a third of all employees. For 2019, there was growth in both the number of employers and employees. For employees, this was the highest growth of all sectors at +3.9%.
In the communications sector, the number of employers increased in 2019, while the number of employees decreased by -1.5%. It remained the third largest sector with nearly 11% of the employer population.
The transportation sector, with 68% of the employer population, continued to have the largest number of employers and of employees, and posted growth in 2019 (+2.3%).
The ‘other’ sector saw an increase in the number of employers and of employees by +11.4% and +1.4% respectively.
| Sector | 2018 number of employers | 2019 number of employers | Percentage change in number of employers from 2018 to 2019 | 2018 percentage distribution of employers** | 2019 percentage distribution of employers** |
|---|---|---|---|---|---|
| Banking and financial services | 38 | 43 | +13.2 | 7.1 | 7.5 |
| Communications | 58 | 62 | +6.9 | 10.8 | 10.9 |
| Transportation | 370 | 388 | +4.9 | 69.0 | 68.0 |
| 'Other' | 70 | 78 | +11.4 | 13.1 | 13.7 |
| All sectors | 536 | 571 | +6.5 | 100.0 | 100.0 |
* The number of employers in the federally regulated private sector can change from year to year because of mergers, acquisitions, closures, start-ups or organizations fluctuating above or below the 100-employee threshold.
** Total may not equal the sum of components due to rounding.
| Sector | 2018 number of employees | 2019 number of employees | Percentage change in number of employees from 2018 to 2019 | 2018 percentage distribution of employees* | 2019 percentage distribution of employees* |
|---|---|---|---|---|---|
| Banking and financial services | 244,910 | 254,434 | +3.9 | 32.4 | 32.9 |
| Communications | 131,305 | 129,398 | -1.5 | 17.4 | 16.8 |
| Transportation | 321,707 | 329,240 | +2.3 | 42.5 | 42.6 |
| 'Other' | 58,492 | 59,330 | +1.4 | 7.7 | 7.7 |
| All sectors | 756,414 | 772,402 | +2.1 | 100.0 | 100.0 |
* Total may not equal the sum of components due to rounding.
Further analysis of the transportation and ‘other’ sectors is shown in Tables 3C to 3F.
Table 3C and Table 3D show the number and distribution of employers and employees by the air, ground and water subsectors of the transportation sector for 2018 and 2019.
Overall, each of the subsectors posted growth in their employer population and number of employees.
The air transportation subsector posted the highest growth in the number of employers at +5.5% and accounted for 29.8% of the transportation workforce in 2019.
Among the subsectors, ground transportation was the largest, comprising 64.3% of the transportation’s workforce in 2019. It also saw the highest increase in the number of employees (+2.7%).
The water transportation subsector was the smallest, with 10.3% of the employer population and 5.9% of the transportation workforce.
| Subsectors of transportation sector | 2018 number of employers | 2019 number of employers | Percentage change in number of employers from 2018 to 2019 | 2018 percentage distribution of employers within sector** | 2019 percentage distribution of employers within sector** |
|---|---|---|---|---|---|
| Air transportation | 91 | 96 | +5.5 | 24.6 | 24.7 |
| Ground transportation | 241 | 252 | +4.6 | 65.1 | 64.9 |
| Water transportation | 38 | 40 | +5.3 | 10.3 | 10.3 |
| Transportation sector | 370 | 388 | +4.9 | 100.0 | 100.0 |
* The number of employers in the federally regulated private sector can change from year to year because of mergers, acquisitions, closures, start-ups or organizations fluctuating above or below the 100-employee threshold.
** Total may not equal the sum of components due to rounding.
| Subsectors of transportation sector | 2018 number of employees | 2019 number of employees | Percentage change in number of employees from 2018 to 2019 | 2018 percentage distribution of employees within sector* | 2019 percentage distribution of employees within sector* |
|---|---|---|---|---|---|
| Air transportation | 96,419 | 97,969 | +1.6 | 30.0 | 29.8 |
| Ground transportation | 206,160 | 211,829 | +2.7 | 64.1 | 64.3 |
| Water transportation | 19,128 | 19,442 | +1.6 | 5.9 | 5.9 |
| Transportation sector | 321,707 | 329,240 | +2.3 | 100.0 | 100.0 |
* Total may not equal the sum of components due to rounding.
Table 3E and Table 3F show the number and distribution of employers and employees by the 2 subsectors of the ‘other’ sector for 2018 and 2019. The production industries subsector includes employers such as those primarily engaged in nuclear power generation, metal ore mining, support activities for crop production, and grain and oilseed milling. The service industries subsector comprises businesses such as those providing professional, scientific and technical services, investigation and security services, public administration, and heritage institutions (museums).
Overall, each of the subsectors posted growth in their employer population and number of employees.
The number of employers in the ‘other’ sector’s subsectors were equally distributed in 2019. The highest proportional increase in the number of employers occurred in the production industries subsector (+14.7%), which saw a +1.4% increase in its number of employees.
The service industries subsector posted growth in the number of employers and of employees amounting to +8.3% and +1.5% respectively.
| Subsectors of 'other' sector | 2018 number of employers | 2019 number of employers | Percentage change in number of employers from 2018 to 2019 | 2018 percentage distribution of employers within sector** | 2019 percentage distribution of employers within sector** |
|---|---|---|---|---|---|
| Production industries | 34 | 39 | +14.7 | 48.6 | 50.0 |
| Service industries | 36 | 39 | +8.3 | 51.4 | 50.0 |
| 'Other' sector | 70 | 78 | +11.4 | 100.0 | 100.0 |
* The number of employers in the federally regulated private sector can change from year to year because of mergers, acquisitions, closures, start-ups or organizations fluctuating above or below the 100-employee threshold.
** Total may not equal the sum of components due to rounding.
| Subsectors of 'other' sector | 2018 number of employees | 2019 number of employees | Percentage change in number of employees from 2018 to 2019 | 2018 percentage distribution of employees within sector* | 2019 percentage distribution of employees within sector* |
|---|---|---|---|---|---|
| Production industries | 30,525 | 30,938 | +1.4 | 52.2 | 52.1 |
| Service industries | 27,967 | 28,392 | +1.5 | 47.8 | 47.9 |
| 'Other' sector | 58,492 | 59,330 | +1.4 | 100.0 | 100.0 |
* Total may not equal the sum of components due to rounding.
Sector representation and attainment rates of designated groups
This section provides an analysis of the designated groups’ representation and attainment rates for the 4 industrial sectors and their subsectors in 2018 and 2019, in order to focus on any improvements made by the federally regulated private sector employers when compared to federally and non-federally regulated employers in all sectors at the Canadian or national level (Canadian LMA) and in their respective sector LMA. The sector LMA is used to show how the designated groups in the federally regulated private sector are faring when compared to those employed by all federally and non-federally regulated employers within their sector. Sector LMA differs from Canadian LMA, because each sector has a unique occupational group profile.
Banking and financial services sector
Table 4A presents data on the overall representation and attainment rates (based on Canadian and sector LMA) of the designated groups in the banking and financial services sector between 2018 and 2019.
- Women: Representation in this sector decreased by 0.5 of a percentage point and continued to exceed Canadian LMA of 48.2%, for an attainment rate of 116.3%. When compared with sector LMA of 58.9%, the attainment rate decreased to 95.2%
- Aboriginal peoples: Representation in this sector remained unchanged and below Canadian LMA of 4.0%, with a corresponding attainment rate of 30.9%. When compared with sector LMA of 1.7%, the attainment rate increased slightly to 72.7%
- Persons with disabilities: Representation in this sector decreased by 0.1 of a percentage point and remained below Canadian LMA of 9.1%, with an attainment rate of 54.1%. When compared with sector LMA of 9.2%, the attainment rate decreased to 53.5%
- Members of visible minorities: Representation in this sector increased by 0.5 of a percentage point and continued to exceed Canadian LMA of 21.3%, for an attainment rate of 161.4%. When compared with sector LMA of 31.2%, the attainment rate increased to 110.2%
| Designated groups | 2018 representation | 2019 representation | Change* in representation from 2018 to 2019 | LMA (Canadian)** | 2018 attainment rate based on LMA (Canadian) | 2019 attainment rate based on LMA (Canadian) | LMA (sector)** | 2018 attainment rate based on LMA (sector) | 2019 attainment rate based on LMA (sector) |
|---|---|---|---|---|---|---|---|---|---|
| Women | 56.6 | 56.1 | -0.5 | 48.2 | 117.4 | 116.3 | 58.9 | 96.1 | 95.2 |
| Aboriginal peoples | 1.2 | 1.2 | 0.0 | 4.0 | 30.6 | 30.9 | 1.7 | 72.1 | 72.7 |
| Persons with disabilities | 5.0 | 4.9 | -0.1 | 9.1 | 54.7 | 54.1 | 9.2 | 54.1 | 53.5 |
| Members of visible minorities | 33.9 | 34.4 | +0.5 | 21.3 | 159.0 | 161.4 | 31.2 | 108.5 | 110.2 |
* Change values may not equal the differences between the representation rates due to rounding.
** Sources: Statistics Canada, 2016 Census and 2017 Canadian Survey on Disability.
Communications sector
Table 4B presents data on the overall representation and attainment rates (based on Canadian and sector LMA) of the designated groups in the communications sector between 2018 and 2019.
- Women: Representation in this sector increased by 0.2 of a percentage point and continued to be below Canadian LMA of 48.2%, for an attainment rate of 72.5%. When compared with sector LMA of 44.1%, the attainment rate increased to 79.2%
- Aboriginal peoples: Representation in this sector remained unchanged and below Canadian LMA of 4.0%, for an attainment rate of 53.8%. When compared with sector LMA of 2.5%, the attainment rate increased to 86.1%
- Persons with disabilities: Representation in this sector increased by 0.3 of a percentage point and remained below Canadian LMA of 9.1%, for an attainment rate of 40.4%. When compared with sector LMA of 11.0%, the attainment rate increased to 33.4%
- Members of visible minorities: Representation in this sector increased by 0.2 of a percentage point and continued to exceed Canadian LMA of 21.3%, for an attainment rate of 111.5%. When compared with sector LMA of 24.8%, the attainment rate increased to 95.8%
| Designated groups | 2018 representation | 2019 representation | Change* in representation from 2018 to 2019 | LMA (Canadian)** | 2018 attainment rate based on LMA (Canadian) | 2019 attainment rate based on LMA (Canadian) | LMA (sector)** | 2018 attainment rate based on LMA (sector) | 2019 attainment rate based on LMA (sector) |
|---|---|---|---|---|---|---|---|---|---|
| Women | 34.8 | 34.9 | +0.2 | 48.2 | 72.1 | 72.5 | 44.1 | 78.9 | 79.2 |
| Aboriginal peoples | 2.1 | 2.2 | 0.0 | 4.0 | 52.9 | 53.8 | 2.5 | 84.6 | 86.1 |
| Persons with disabilities | 3.4 | 3.7 | +0.3 | 9.1 | 37.5 | 40.4 | 11.0 | 31.0 | 33.4 |
| Members of visible minorities | 23.5 | 23.8 | +0.2 | 21.3 | 110.4 | 111.5 | 24.8 | 94.8 | 95.8 |
* Change values may not equal the differences between the representation rates due to rounding.
** Sources: Statistics Canada, 2016 Census and 2017 Canadian Survey on Disability.
Transportation sector and subsectors
Table 4C presents data on the overall representation and attainment rates (based on Canadian and sector LMA) of the designated groups in the transportation sector between 2018 and 2019.
- Women: Representation and attainment rates in this sector remained unchanged. Representation continued to be below Canadian LMA of 48.2%, for an attainment rate of 62.4%. When compared with sector LMA of 25.3%, the attainment rate stayed at 118.9%
- Aboriginal peoples: Representation in this sector remained unchanged and below Canadian LMA of 4.0%, for an attainment rate of 73.3%. When compared with sector LMA of 3.9%, the attainment rate increased to 75.1%
- Persons with disabilities: Representation in this sector remained unchanged and below Canadian LMA of 9.1%, for an attainment rate of 27.1%. When compared with sector LMA of 9.8%, the attainment rate increased slightly to 25.1%
- Members of visible minorities: Representation in this sector increased by 0.7 of a percentage point and continued to be below Canadian LMA of 21.3%, for an attainment rate of 86.3%. When compared with sector LMA of 25.1%, the attainment rate increased to 73.2%
| Designated groups | 2018 representation | 2019 representation | Change* in representation from 2018 to 2019 | LMA (Canadian)** | 2018 attainment rate based on LMA (Canadian) | 2019 attainment rate based on LMA (Canadian) | LMA (sector)** | 2018 attainment rate based on LMA (sector) | 2019 attainment rate based on LMA (sector) |
|---|---|---|---|---|---|---|---|---|---|
| Women | 30.1 | 30.1 | 0.0 | 48.2 | 62.4 | 62.4 | 25.3 | 118.9 | 118.9 |
| Aboriginal peoples | 2.9 | 2.9 | 0.0 | 4.0 | 72.9 | 73.3 | 3.9 | 74.7 | 75.1 |
| Persons with disabilities | 2.5 | 2.5 | 0.0 | 9.1 | 27.0 | 27.1 | 9.8 | 25.0 | 25.1 |
| Members of visible minorities | 17.7 | 18.4 | +0.7 | 21.3 | 83.2 | 86.3 | 25.1 | 70.6 | 73.2 |
* Change values may not equal the differences between the representation rates due to rounding.
** Sources: Statistics Canada, 2016 Census and 2017 Canadian Survey on Disability.
Table 4D.1 presents data on the overall representation and attainment rates (based on the transportation sector LMA) of the designated groups in the air transportation subsector between 2018 and 2019.
- Women: Representation in this subsector increased by 0.1 of a percentage point and continued to be above sector LMA of 25.3%, for an increase in the attainment rate to 152.6%
- Aboriginal peoples: Representation in this subsector remained unchanged and below sector LMA of 3.9%, for an increase in the attainment rate to 72.2%
- Persons with disabilities: Representation in this subsector decreased by 0.1 of a percentage point and continued to be below sector LMA of 9.8%, for a decrease in the attainment rate to 15.8%
- Members of visible minorities: Representation in this subsector increased by 1.2 of a percentage point and continued to be below sector LMA of 25.1%, for an increase in the attainment rate to 82.8%
| Designated groups | 2018 representation | 2019 representation | Change* in representation from 2018 to 2019 | LMA (sector)** | 2018 attainment rate based on LMA (sector) | 2019 attainment rate based on LMA (sector) |
|---|---|---|---|---|---|---|
| Women | 38.5 | 38.6 | +0.1 | 25.3 | 152.0 | 152.6 |
| Aboriginal peoples | 2.8 | 2.8 | 0.0 | 3.9 | 71.2 | 72.2 |
| Persons with disabilities | 1.6 | 1.5 | -0.1 | 9.8 | 16.4 | 15.8 |
| Members of visible minorities | 19.6 | 20.8 | +1.2 | 25.1 | 78.0 | 82.8 |
* Change values may not equal the differences between the representation rates due to rounding.
** Sources: Statistics Canada, 2016 Census and 2017 Canadian Survey on Disability.
Table 4D.2 presents data on the overall representation and attainment rates (based on the transportation sector LMA) of the designated groups in the ground transportation subsector between 2018 and 2019.
- Women: Representation in this subsector remained unchanged and continued to be above sector LMA of 25.3%, for a decrease in the attainment rate to 108.1%
- Aboriginal peoples: Representation in this subsector remained unchanged and below sector LMA of 3.9%, for an increase in the attainment rate to 72.2%
- Persons with disabilities: Representation in this subsector remained unchanged and continued to be below sector LMA of 9.8%, for an increase in the attainment rate to 29.6%
- Members of visible minorities: Representation in this subsector increased by 0.5 of a percentage point and continued to be below sector LMA of 25.1%, for an increase in the attainment rate to 70.2%
| Designated groups | 2018 representation | 2019 representation | Change* in representation from 2018 to 2019 | LMA (sector)** | 2018 attainment rate based on LMA (sector) | 2019 attainment rate based on LMA (sector) |
|---|---|---|---|---|---|---|
| Women | 27.4 | 27.4 | 0.0 | 25.3 | 108.2 | 108.1 |
| Aboriginal peoples | 2.8 | 2.8 | 0.0 | 3.9 | 71.7 | 72.2 |
| Persons with disabilities | 2.9 | 2.9 | 0.0 | 9.8 | 29.3 | 29.6 |
| Members of visible minorities | 17.1 | 17.6 | +0.5 | 25.1 | 68.3 | 70.2 |
* Change values may not equal the differences between the representation rates due to rounding.
** Sources: Statistics Canada, 2016 Census and 2017 Canadian Survey on Disability.
Table 4D.3 presents data on the overall representation and attainment rates (based on the transportation sector LMA) of the designated groups in the water transportation subsector between 2018 and 2019.
- Women: Representation in this subsector increased by 0.1 of a percentage point and continued to be below sector LMA of 25.3%, for an increase in the attainment rate to 67.1%
- Aboriginal peoples: Representation in this subsector decreased by 0.1 of a percentage point and remained above sector LMA of 3.9%, for a decrease in the attainment rate to 122.1%
- Persons with disabilities: Representation in this subsector increased by 0.2 of a percentage point and continued to be below sector LMA of 9.8%, for an increase in the attainment rate to 24.3%
- Members of visible minorities: Representation in this subsector increased by 0.3 of a percentage point and continued to be below sector LMA of 25.1%, for an increase in the attainment rate to 58.9%
| Designated groups | 2018 representation | 2019 representation | Change* in representation from 2018 to 2019 | LMA (sector)** | 2018 attainment rate based on LMA (sector) | 2019 attainment rate based on LMA (sector) |
|---|---|---|---|---|---|---|
| Women | 16.9 | 17.0 | +0.1 | 25.3 | 66.8 | 67.1 |
| Aboriginal peoples | 4.9 | 4.8 | -0.1 | 3.9 | 124.8 | 122.1 |
| Persons with disabilities | 2.2 | 2.4 | +0.2 | 9.8 | 22.7 | 24.3 |
| Members of visible minorities | 14.5 | 14.8 | +0.3 | 25.1 | 57.6 | 58.9 |
* Change values may not equal the differences between the representation rates due to rounding.
** Sources: Statistics Canada, 2016 Census and 2017 Canadian Survey on Disability.
‘Other’ sector and subsectors
Table 4E presents data on the overall representation and attainment rates (based on Canadian and sector LMA) of the designated groups in the ‘other’ sector between 2018 and 2019.
- Women: Representation in this sector increased by 0.5 of a percentage point and continued to be below Canadian LMA of 48.2%, for an attainment rate of 62.8%. When compared with sector LMA of 34.5%, the attainment rate increased to 87.8%
- Aboriginal peoples: Representation in this sector increased by 0.2 of a percentage point and continued to be below Canadian LMA of 4.0%, for an attainment rate of 95.4%. When compared with sector LMA of 4.6%, the attainment rate increased to 82.9%
- Persons with disabilities: Representation in this sector increased by 0.1 of a percentage point and continued to be below Canadian LMA of 9.1%, for an attainment rate of 23.8%. When compared with sector LMA of 8.3%, the attainment rate increased to 26.1%
- Members of visible minorities: Representation in this sector increased by 0.4 of a percentage point and continued to be below Canadian LMA of 21.3%, for an attainment rate of 76.1%. When compared with sector LMA of 16.0%, the attainment rate increased to 101.3%
Table 4E: Representation and attainment rate of designated group members in the ‘other’ sector in 2018 and 2019 (by percentage)
| Designated groups | 2018 representation | 2019 representation | Change* in representation from 2018 to 2019 | LMA (Canadian)** | 2018 attainment rate based on LMA (Canadian) | 2019 attainment rate based on LMA (Canadian) | LMA (sector)** | 2018 attainment rate based on LMA (sector) | 2019 attainment rate based on LMA (sector) |
|---|---|---|---|---|---|---|---|---|---|
| Women | 29.8 | 30.3 | +0.5 | 48.2 | 61.7 | 62.8 | 34.5 | 86.2 | 87.8 |
| Aboriginal peoples | 3.6 | 3.8 | +0.2 | 4.0 | 90.5 | 95.4 | 4.6 | 78.7 | 82.9 |
| Persons with disabilities | 2.1 | 2.2 | +0.1 | 9.1 | 22.6 | 23.8 | 8.3 | 24.7 | 26.1 |
| Members of visible minorities | 15.9 | 16.2 | +0.4 | 21.3 | 74.4 | 76.1 | 16.0 | 99.1 | 101.3 |
* Change values may not equal the differences between the representation rates due to rounding.
** Sources: Statistics Canada, 2016 Census and 2017 Canadian Survey on Disability.
Table 4F.1 presents data on the overall representation and attainment rates (based on the ‘other’ sector LMA) of the designated groups in the production industries subsector between 2018 and 2019.
- Women: Representation in this subsector decreased by 0.2 of a percentage point and continued to be below sector LMA of 34.5%, for a decrease in the attainment rate to 67.4%
- Aboriginal peoples: Representation in this subsector increased by 0.4 of a percentage point and exceeded sector LMA of 4.6%, for an increase in the attainment rate to 102.7%
- Persons with disabilities: Representation in this subsector increased by 0.1 of a percentage point and continued to be below sector LMA of 8.3%, for an increase in the attainment rate to 27.6%
- Members of visible minorities: Representation in this subsector increased by 0.1 of a percentage point and continued to be below sector LMA of 16.0%, for an increase in the attainment rate to 80.1%
| Designated groups | 2018 representation | 2019 representation | Change* in representation from 2018 to 2019 | LMA (sector)** | 2018 attainment rate based on LMA (sector) | 2019 attainment rate based on LMA (sector) |
|---|---|---|---|---|---|---|
| Women | 23.4 | 23.3 | -0.2 | 34.5 | 67.9 | 67.4 |
| Aboriginal peoples | 4.3 | 4.7 | +0.4 | 4.6 | 93.5 | 102.7 |
| Persons with disabilities | 2.2 | 2.3 | +0.1 | 8.3 | 27.0 | 27.6 |
| Members of visible minorities | 12.7 | 12.8 | +0.1 | 16.0 | 79.6 | 80.1 |
* Change values may not equal the differences between the representation rates due to rounding.
** Sources: Statistics Canada, 2016 Census and 2017 Canadian Survey on Disability.
Table 4F.2 presents data on the overall representation and attainment rates (based on the ‘other’ sector LMA) of the designated groups in the service industries subsector between 2018 and 2019.
- Women: Representation in this subsector increased by 1.3 of a percentage point and continued to be above sector LMA of 34.5%, for an increase in the attainment rate to 109.9%
- Aboriginal peoples: Representation in this subsector decreased by 0.1 of a percentage point and continued to be below sector LMA of 4.6%, for a decrease in the attainment rate to 61.3%
- Persons with disabilities: Representation in this subsector increased by 0.2 of a percentage point and continued to be below sector LMA of 8.3%, for an increase in the attainment rate to 24.6%
- Members of visible minorities: Representation in this subsector increased by 0.6 of a percentage point and continued to be above sector LMA of 16.0%, for an increase in the attainment rate to 124.4%
Table 4F.2: Representation and attainment rate of designated group members in the service industries subsector in 2018 and 2019 (by percentage)
| Designated groups | 2018 representation | 2019 representation | Change* in representation from 2018 to 2019 | LMA (sector)** | 2018 attainment rate based on LMA (sector) | 2019 attainment rate based on LMA (sector) |
|---|---|---|---|---|---|---|
| Women | 36.7 | 37.9 | +1.3 | 34.5 | 106.3 | 109.9 |
| Aboriginal peoples | 2.9 | 2.8 | -0.1 | 4.6 | 62.5 | 61.3 |
| Persons with disabilities | 1.9 | 2.0 | +0.2 | 8.3 | 22.3 | 24.6 |
| Members of visible minorities | 19.3 | 19.9 | +0.6 | 16.0 | 120.3 | 124.4 |
* Change values may not equal the differences between the representation rates due to rounding.
** Sources: Statistics Canada, 2016 Census and 2017 Canadian Survey on Disability.
Additional data on the representation, attainment rates, hires, promotions and terminations of employees by designated group and sector is provided in Appendix A.
Section 3: Designated group profiles
Women
The representation of women increased slightly from 39.4% in 2018 to 39.5% in 2019. Overall, between 2013 and 2018, the percentages of women leaving the workforce were higher than the percentages of women entering the workforce, resulting in a decrease in the representation of women. This trend was reversed in 2019, when the percentage of women hired (35.2%) exceeded the percentage of women leaving the workforce (34.6%). Women’s share of promotions decreased from 47.2% in 2018 to 46.8% in 2019, but remained above their representation level. In 2019, in the banking and financial services sector, where the majority of women were employed (46.8%), the number of all employees increased by +3.9% and the number of women also increased by +2.9%, but women’s representation decreased by -0.5 of a percentage point. In this sector, the percentage of women leaving the workforce continued to be higher than the percentage entering the workforce (53.6%, compared to 51.0%), and their share of promotions decreased from 55.9% in 2018 to 55.6% in 2019.
Progress was observed for women in some occupations in the federally regulated private sector. For instance, between 2018 and 2019, the representation of women in the senior managers occupational group continued to exceed this occupational group’s Canadian LMA. During the same period, although the representation of women decreased in the skilled sales and service personnel and in theskilled crafts and trades workers occupational groups, it continued to exceed the corresponding occupational group’s Canadian LMA.
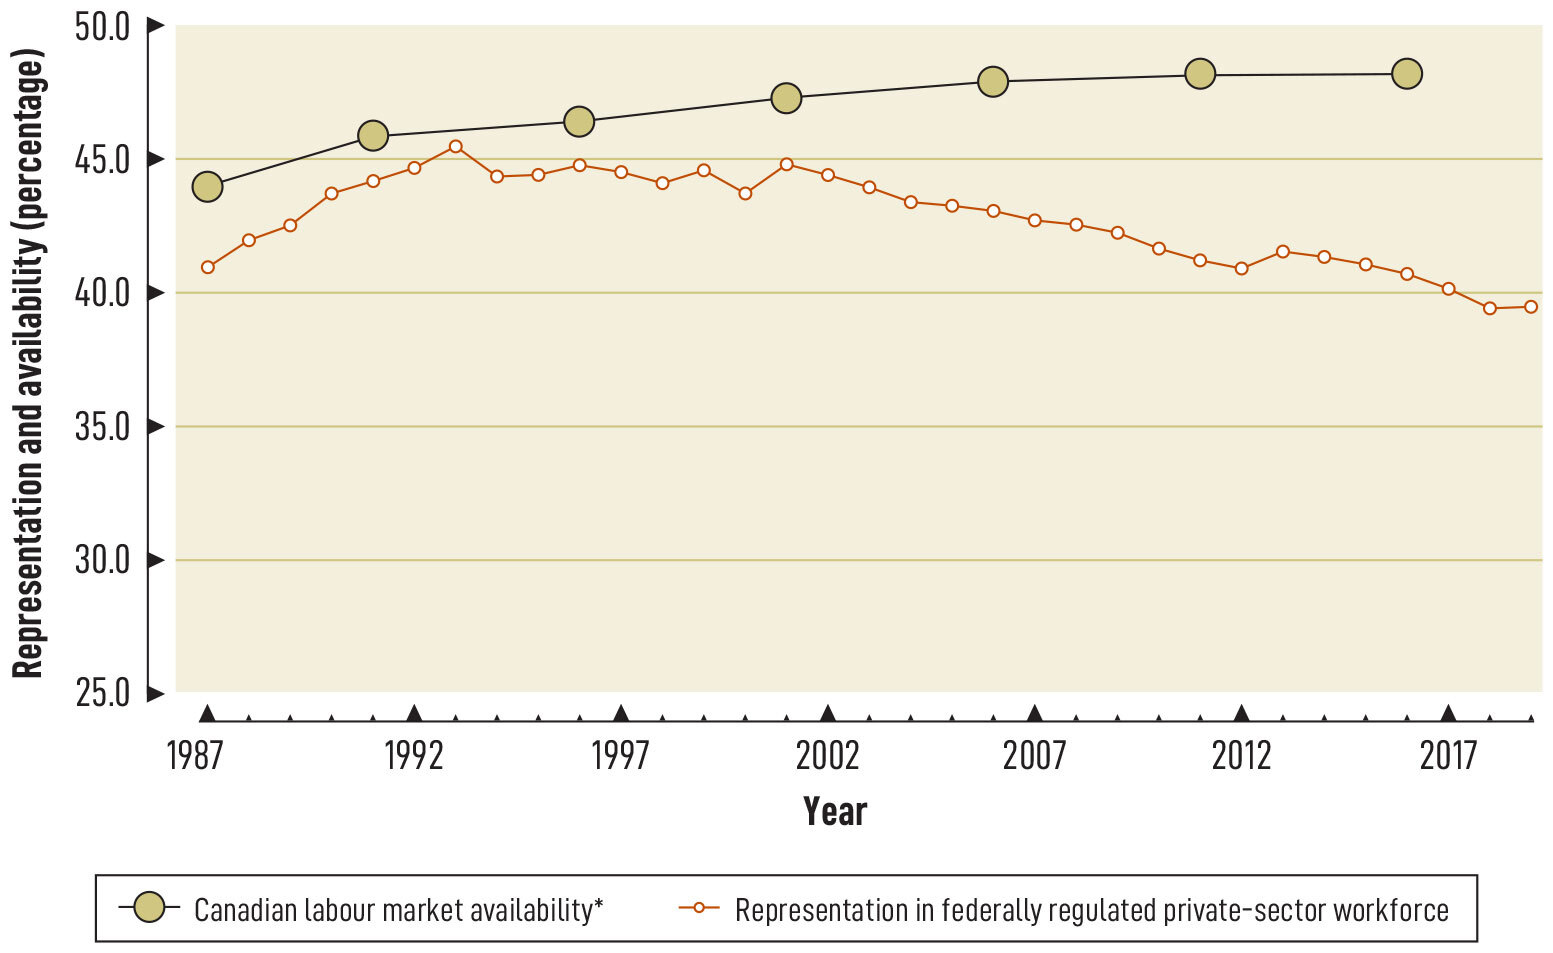
Chart 2 shows that from 1987 onwards, the representation of women increased and peaked in 1993, but the trend has been downward since the early 2000s. The representation of women in 2019 (39.5%) was 1.5 of a percentage point below what it was in 1987 (40.9%).
* Sources: Statistics Canada, 1986 to 2016 Census and 2011 National Household Survey.
Chart 2: text description
| Year | Canadian labour market availability (by percentage) | Representation (by percentage) |
|---|---|---|
| 1987 | 44.0 | 40.9 |
| 1988 | N/A | 41.9 |
| 1989 | N/A | 42.5 |
| 1990 | N/A | 43.7 |
| 1991 | 45.9 | 44.2 |
| 1992 | N/A | 44.7 |
| 1993 | N/A | 45.5 |
| 1994 | N/A | 44.4 |
| 1995 | N/A | 44.5 |
| 1996 | 46.4 | 44.8 |
| 1997 | N/A | 44.5 |
| 1998 | N/A | 44.2 |
| 1999 | N/A | 44.6 |
| 2000 | N/A | 43.8 |
| 2001 | 47.3 | 44.9 |
| 2002 | N/A | 44.4 |
| 2003 | N/A | 44.0 |
| 2004 | N/A | 43.4 |
| 2005 | N/A | 43.3 |
| 2006 | 47.9 | 43.1 |
| 2007 | N/A | 42.7 |
| 2008 | N/A | 42.6 |
| 2009 | N/A | 42.3 |
| 2010 | N/A | 41.7 |
| 2011 | 48.2 | 41.2 |
| 2012 | N/A | 40.9 |
| 2013 | N/A | 41.6 |
| 2014 | N/A | 41.4 |
| 2015 | N/A | 41.0 |
| 2016 | 48.2 | 40.7 |
| 2017 | N/A | 40.2 |
| 2018 | N/A | 39.4 |
| 2019 | N/A | 39.5 |
Occupational group
Chart 3 shows that overall between 2018 and 2019, the representation of women in management and skilled occupational groups continued to exceed the corresponding occupational group’s Canadian LMA (senior managers, middle and other managers, supervisors, skilled sales and service personnel, and skilled crafts and trades workers). Attainment rates in 2 occupational groups (semi-professionals and technicians andother manual workers) remain particularly low. Among the 4 designated groups, women have the highest attainment rate in the senior managers occupational group. Among all occupational groups, the attainment rate is highest for women in the skilled crafts and trades workers group.

* Source: Statistics Canada, 2016 Census.
Chart 3: text description
| Employment equity occupational group | 2018 attainment rate based on occupational group's Canadian labour market availability (by percentage) | 2019 attainment rate based on occupational group's Canadian labour market availability (by percentage) |
|---|---|---|
| Senior managers | 101.3 | 104.0 |
| Middle and other managers | 105.0 | 107.6 |
| Professionals | 79.9 | 79.8 |
| Semi-professionals and technicians | 36.1 | 35.7 |
| Supervisors | 104.7 | 105.8 |
| Supervisors: crafts and trades | 78.5 | 86.1 |
| Administrative and senior clerical personnel | 88.7 | 88.2 |
| Skilled sales and service personnel | 106.9 | 106.5 |
| Skilled crafts and trades workers | 120.0 | 117.7 |
| Clerical personnel | 80.6 | 77.8 |
| Intermediate sales and service personnel | 90.9 | 91.3 |
| Semi-skilled manual workers | 68.1 | 69.0 |
| Other sales and service personnel | 72.5 | 69.6 |
| Other manual workers | 44.5 | 55.6 |
| Total | 81.8 | 81.9 |
Wage gap
According to Statistics Canada, in 2019, full- and part-time employed women combined (aged 25 to 54) earned an average of $28.06 per hour, while men earned $31.93. Women earned $3.87 less per hour than men, or $0.88 for every dollar earned by men.Footnote 7 That is a wage gap of 12.1%. In the case of full-time workers, for every dollar a man earned, a woman earned $0.89.
Despite narrowing gaps in education and work experience, there continues to be gap in hourly wages between men and women workers in Canada. Some of the reasons cited for this ongoing disparity by Employment and Social Development Canada, Statistics Canada and various academics include:
- more limited employment in more highly paid jobs (for example, some managerial and professional jobs) related to less flexibility in the weekly schedule and reduced work hours owing to caregiving
- workforce interruptions related to caregiving
- gender discrimination in hiring and under-valuation of work traditionally done by women, and
- lower likelihood of negotiation over salary, raises and promotions
The wage gap is also reflected in the salary reporting for men and women in permanent full-time positions. According to the 2019 data:
- 52.6% of women earned a salary of $60,000 or more, compared to 65.7% of men
- 29.0% of women earned below $50,000, while only 19.5% of men earned below $50,000
- 16.5% of women earned salaries of $100,000 or more, compared to 25.5% of men
Additional data on the representation, attainment rates, hires, promotions and terminations of employees by designated group and sector is provided in Appendix A.
Aboriginal peoples
For the fourth year in a row, the representation of Aboriginal peoples remained at 2.3%. In 2019, a higher percentage of Aboriginal employees left the workforce than entered it at the overall level and in 3 of the 4 sectors. The only exception was the ‘other’ sector, where the number and percentage of Aboriginal employees who entered the workforce exceeded the number and percentage who left. At the overall level, this designated group’s share of promotions decreased from 1.9% in 2018 to 1.7% in 2019, and continued to be below their representation.
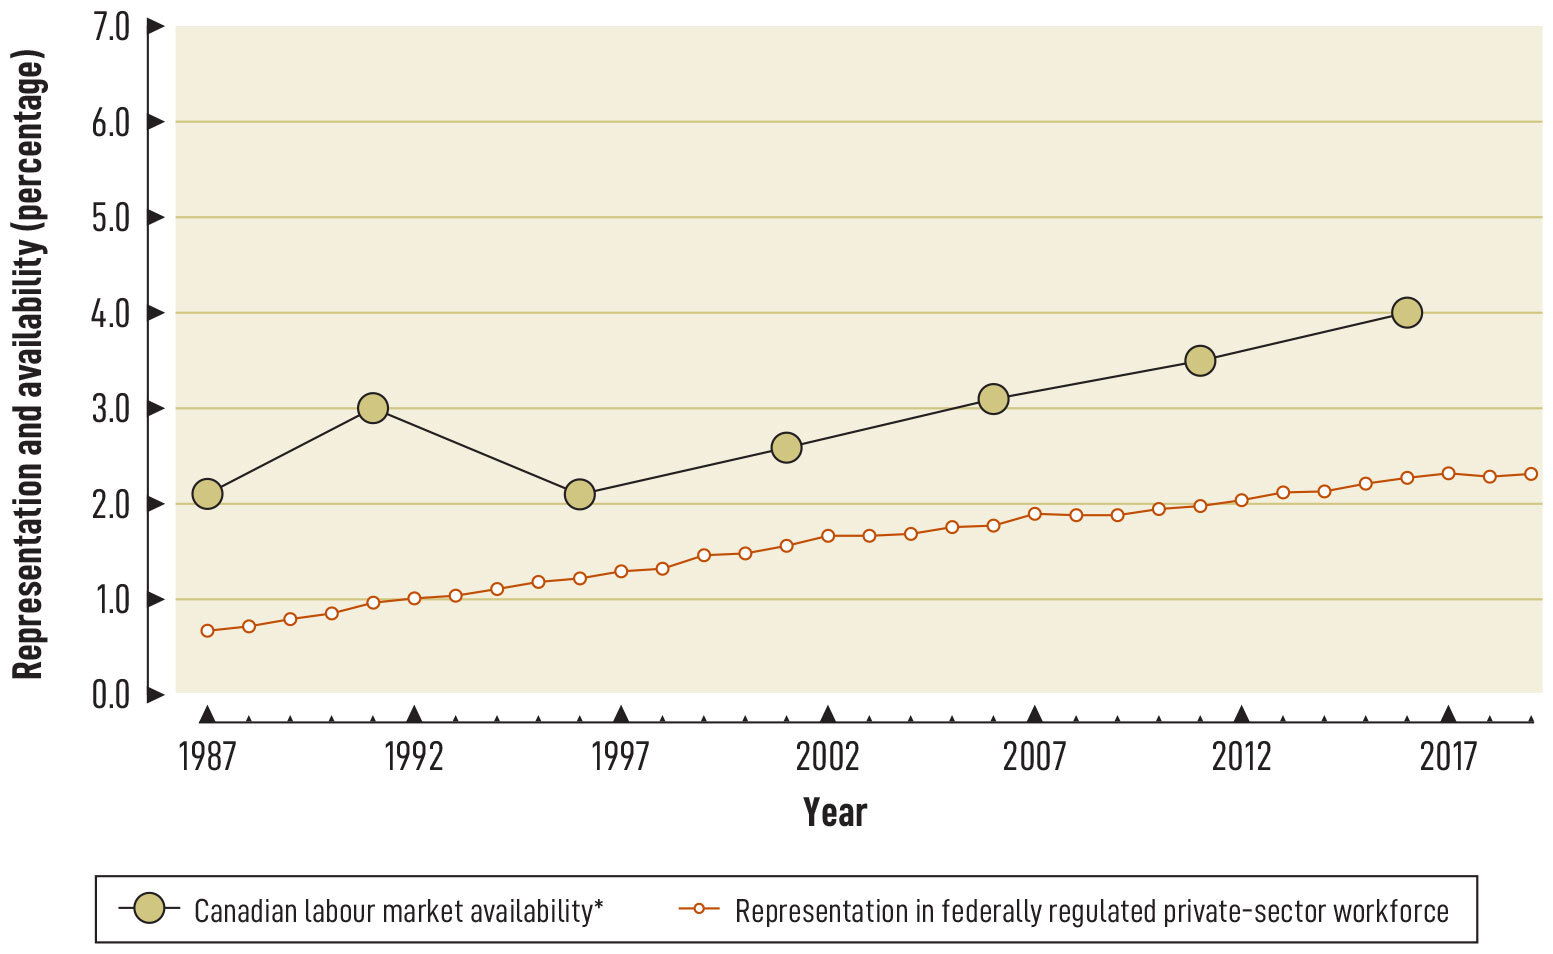
Chart 4 shows that the representation of Aboriginal peoples remained below the 4.0% Canadian LMA; however, the representation of Aboriginal peoples has been increasing steadily since its initial low of 0.7% in 1987.
* Sources: Statistics Canada, 1986 to 2016 Census and 2011 National Household Survey.
Chart 4: text description
| Year | Canadian labour market availability (by percentage) | Representation (by percentage) |
|---|---|---|
| 1987 | 2.1 | 0.7 |
| 1988 | N/A | 0.7 |
| 1989 | N/A | 0.8 |
| 1990 | N/A | 0.9 |
| 1991 | 3.0 | 1.0 |
| 1992 | N/A | 1.0 |
| 1993 | N/A | 1.0 |
| 1994 | N/A | 1.1 |
| 1995 | N/A | 1.2 |
| 1996 | 2.1 | 1.2 |
| 1997 | N/A | 1.3 |
| 1998 | N/A | 1.3 |
| 1999 | N/A | 1.5 |
| 2000 | N/A | 1.5 |
| 2001 | 2.6 | 1.6 |
| 2002 | N/A | 1.7 |
| 2003 | N/A | 1.7 |
| 2004 | N/A | 1.7 |
| 2005 | N/A | 1.8 |
| 2006 | 3.1 | 1.8 |
| 2007 | N/A | 1.9 |
| 2008 | N/A | 1.9 |
| 2009 | N/A | 1.9 |
| 2010 | N/A | 1.9 |
| 2011 | 3.5 | 2.0 |
| 2012 | N/A | 2.0 |
| 2013 | N/A | 2.1 |
| 2014 | N/A | 2.1 |
| 2015 | N/A | 2.2 |
| 2016 | 4.0 | 2.3 |
| 2017 | N/A | 2.3 |
| 2018 | N/A | 2.3 |
| 2019 | N/A | 2.3 |
Note: In 1996, the Census methodology for calculating LMA of Aboriginal peoples changed, causing a drop in LMA.
Occupational group
Chart 5 shows that at the overall level between 2018 and 2019, the representation of Aboriginal peoples continued to be below the corresponding occupational group’s Canadian LMA in all occupational groups. Aboriginal peoples’ representation is significantly short of reaching full representation in the senior managers occupational group. Of all occupational groups, the attainment rates are highest for Aboriginal peoples in the supervisors: crafts and trades and other manual workers groups.

* Source: Statistics Canada, 2016 Census.
Chart 5: text description
| Employment equity occupational group | 2018 attainment rate based on occupational group's Canadian labour market availability (by percentage) | 2019 attainment rate based on occupational group's Canadian labour market availability (by percentage) |
|---|---|---|
| Senior managers | 29.8 | 35.0 |
| Middle and other managers | 49.9 | 48.8 |
| Professionals | 52.8 | 54.4 |
| Semi-professionals and technicians | 60.8 | 63.4 |
| Supervisors | 62.6 | 58.7 |
| Supervisors: crafts and trades | 83.4 | 82.1 |
| Administrative and senior clerical personnel | 52.2 | 52.4 |
| Skilled sales and service personnel | 42.4 | 43.0 |
| Skilled crafts and trades workers | 74.4 | 76.7 |
| Clerical personnel | 50.7 | 53.2 |
| Intermediate sales and service personnel | 54.0 | 54.4 |
| Semi-skilled manual workers | 69.9 | 71.2 |
| Other sales and service personnel | 71.3 | 59.5 |
| Other manual workers | 86.5 | 88.1 |
| Total | 57.1 | 57.8 |
Wage gap
The wage gap is reflected in the statistics for Aboriginal women working in permanent full-time positions in 2019:
- Aboriginal women remained much less likely (46.3%) to earn $60,000 or more, compared to Aboriginal men (63.5%) and all women (52.6%)
- a higher percentage of Aboriginal women (34.4%) earned salaries below $50,000 than Aboriginal men (21.8%) and all women (29.0%)
- a smaller percentage of Aboriginal women (11.4%) earned salaries of $100,000 or more, compared to Aboriginal men (21.8%) and all women (16.5%)
Additional data on the representation, attainment rates, hires, promotions and terminations of employees by designated group and sector is provided in Appendix A.
Persons with disabilities
The representation of persons with disabilities increased from 3.4% in 2018 to 3.5% in 2019, despite the continued trend over the past decade of a higher number of this designated group leaving than entering the workforce. At the overall level, this designated group’s share of promotions was the same as their representation in 2018 and 2019.
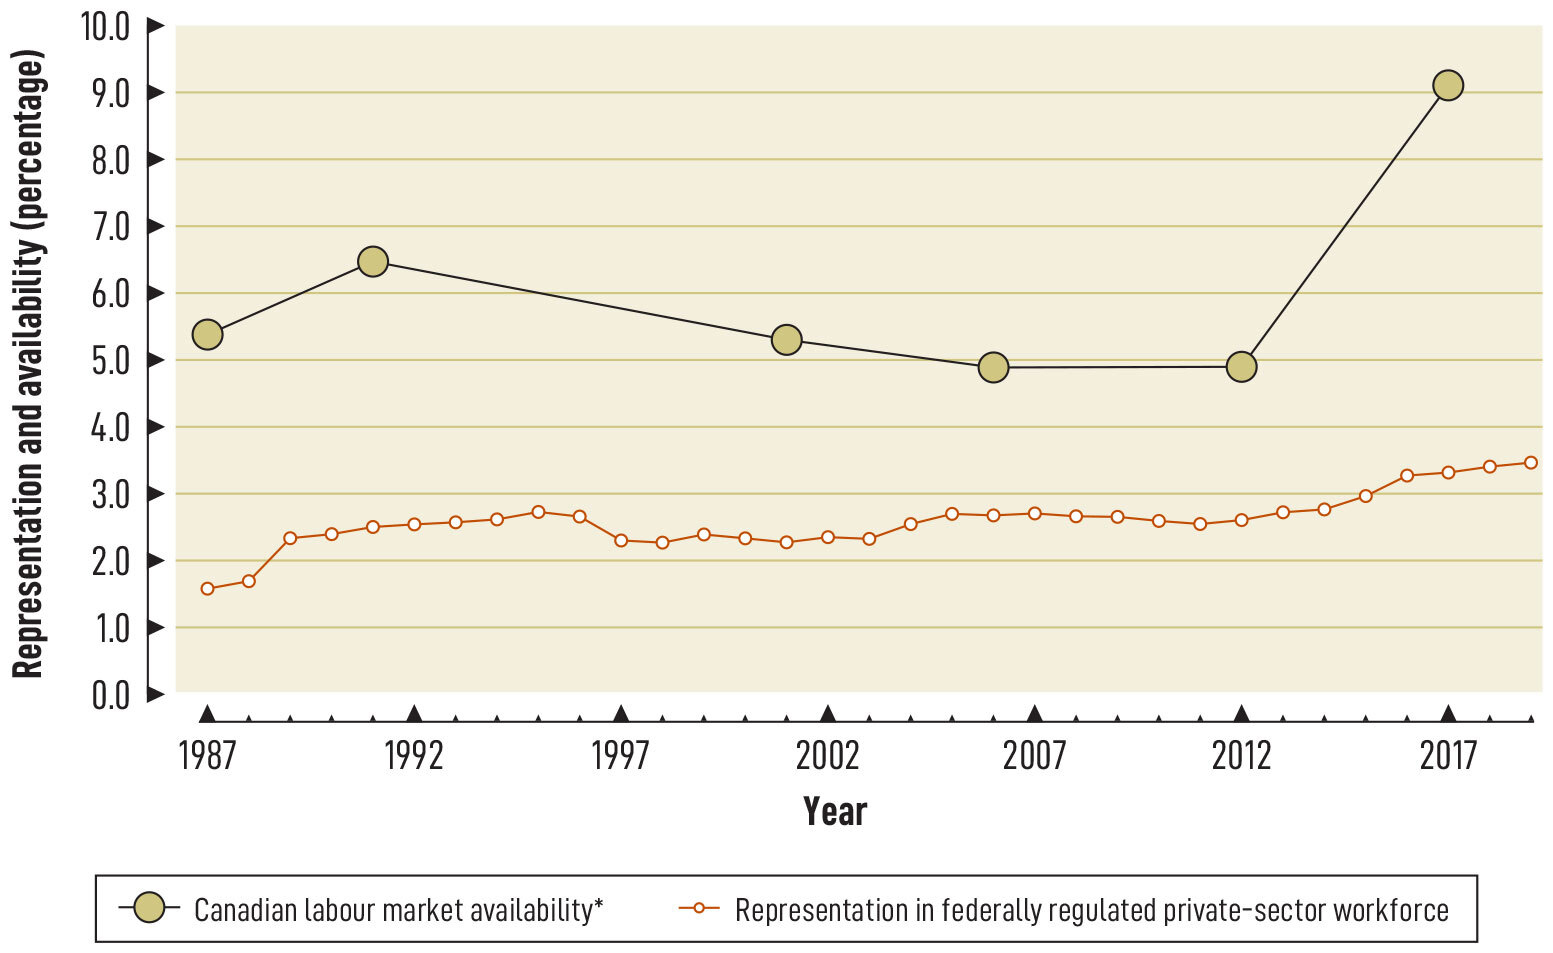
Chart 6 shows that the representation of persons with disabilities reached its highest level of 3.5% in 2019, an increase from the initial low of 1.6% in 1987. The 2019 representation rate is 5.6 percentage points below the 9.1% Canadian LMA.
* Sources: Statistics Canada, 1986 and 1991 Health and Activity Limitation Survey; 2001 and 2006 Participation and Activity Limitation Survey; and 2012 and 2017 Canadian Survey on Disability.
Chart 6: text description
| Year | Canadian labour market availability (by percentage) | Representation (by percentage) |
|---|---|---|
| 1987 | 5.4 | 1.6 |
| 1988 | N/A | 1.7 |
| 1989 | N/A | 2.3 |
| 1990 | N/A | 2.4 |
| 1991 | 6.5 | 2.5 |
| 1992 | N/A | 2.5 |
| 1993 | N/A | 2.6 |
| 1994 | N/A | 2.6 |
| 1995 | N/A | 2.7 |
| 1996 | N/A | 2.7 |
| 1997 | N/A | 2.3 |
| 1998 | N/A | 2.3 |
| 1999 | N/A | 2.4 |
| 2000 | N/A | 2.3 |
| 2001 | 5.3 | 2.3 |
| 2002 | N/A | 2.3 |
| 2003 | N/A | 2.3 |
| 2004 | N/A | 2.5 |
| 2005 | N/A | 2.7 |
| 2006 | 4.9 | 2.7 |
| 2007 | N/A | 2.7 |
| 2008 | N/A | 2.7 |
| 2009 | N/A | 2.7 |
| 2010 | N/A | 2.6 |
| 2011 | N/A | 2.6 |
| 2012 | 4.9 | 2.6 |
| 2013 | N/A | 2.7 |
| 2014 | N/A | 2.8 |
| 2015 | N/A | 3.0 |
| 2016 | N/A | 3.3 |
| 2017 | 9.1 | 3.3 |
| 2018 | N/A | 3.4 |
| 2019 | N/A | 3.5 |
Note: In 2001, Statistics Canada began using the World Health Organization’s International Classification of Functioning, Disability and Health framework to define disability rather than the 1980 International Classification of Impairments, Disabilities, and Handicaps; this resulted in a drop in LMA. In 2017, Statistics Canada introduced a new methodology for gathering data on persons with disabilities that resulted in a significant increase in LMA for this designated group.
Occupational Group
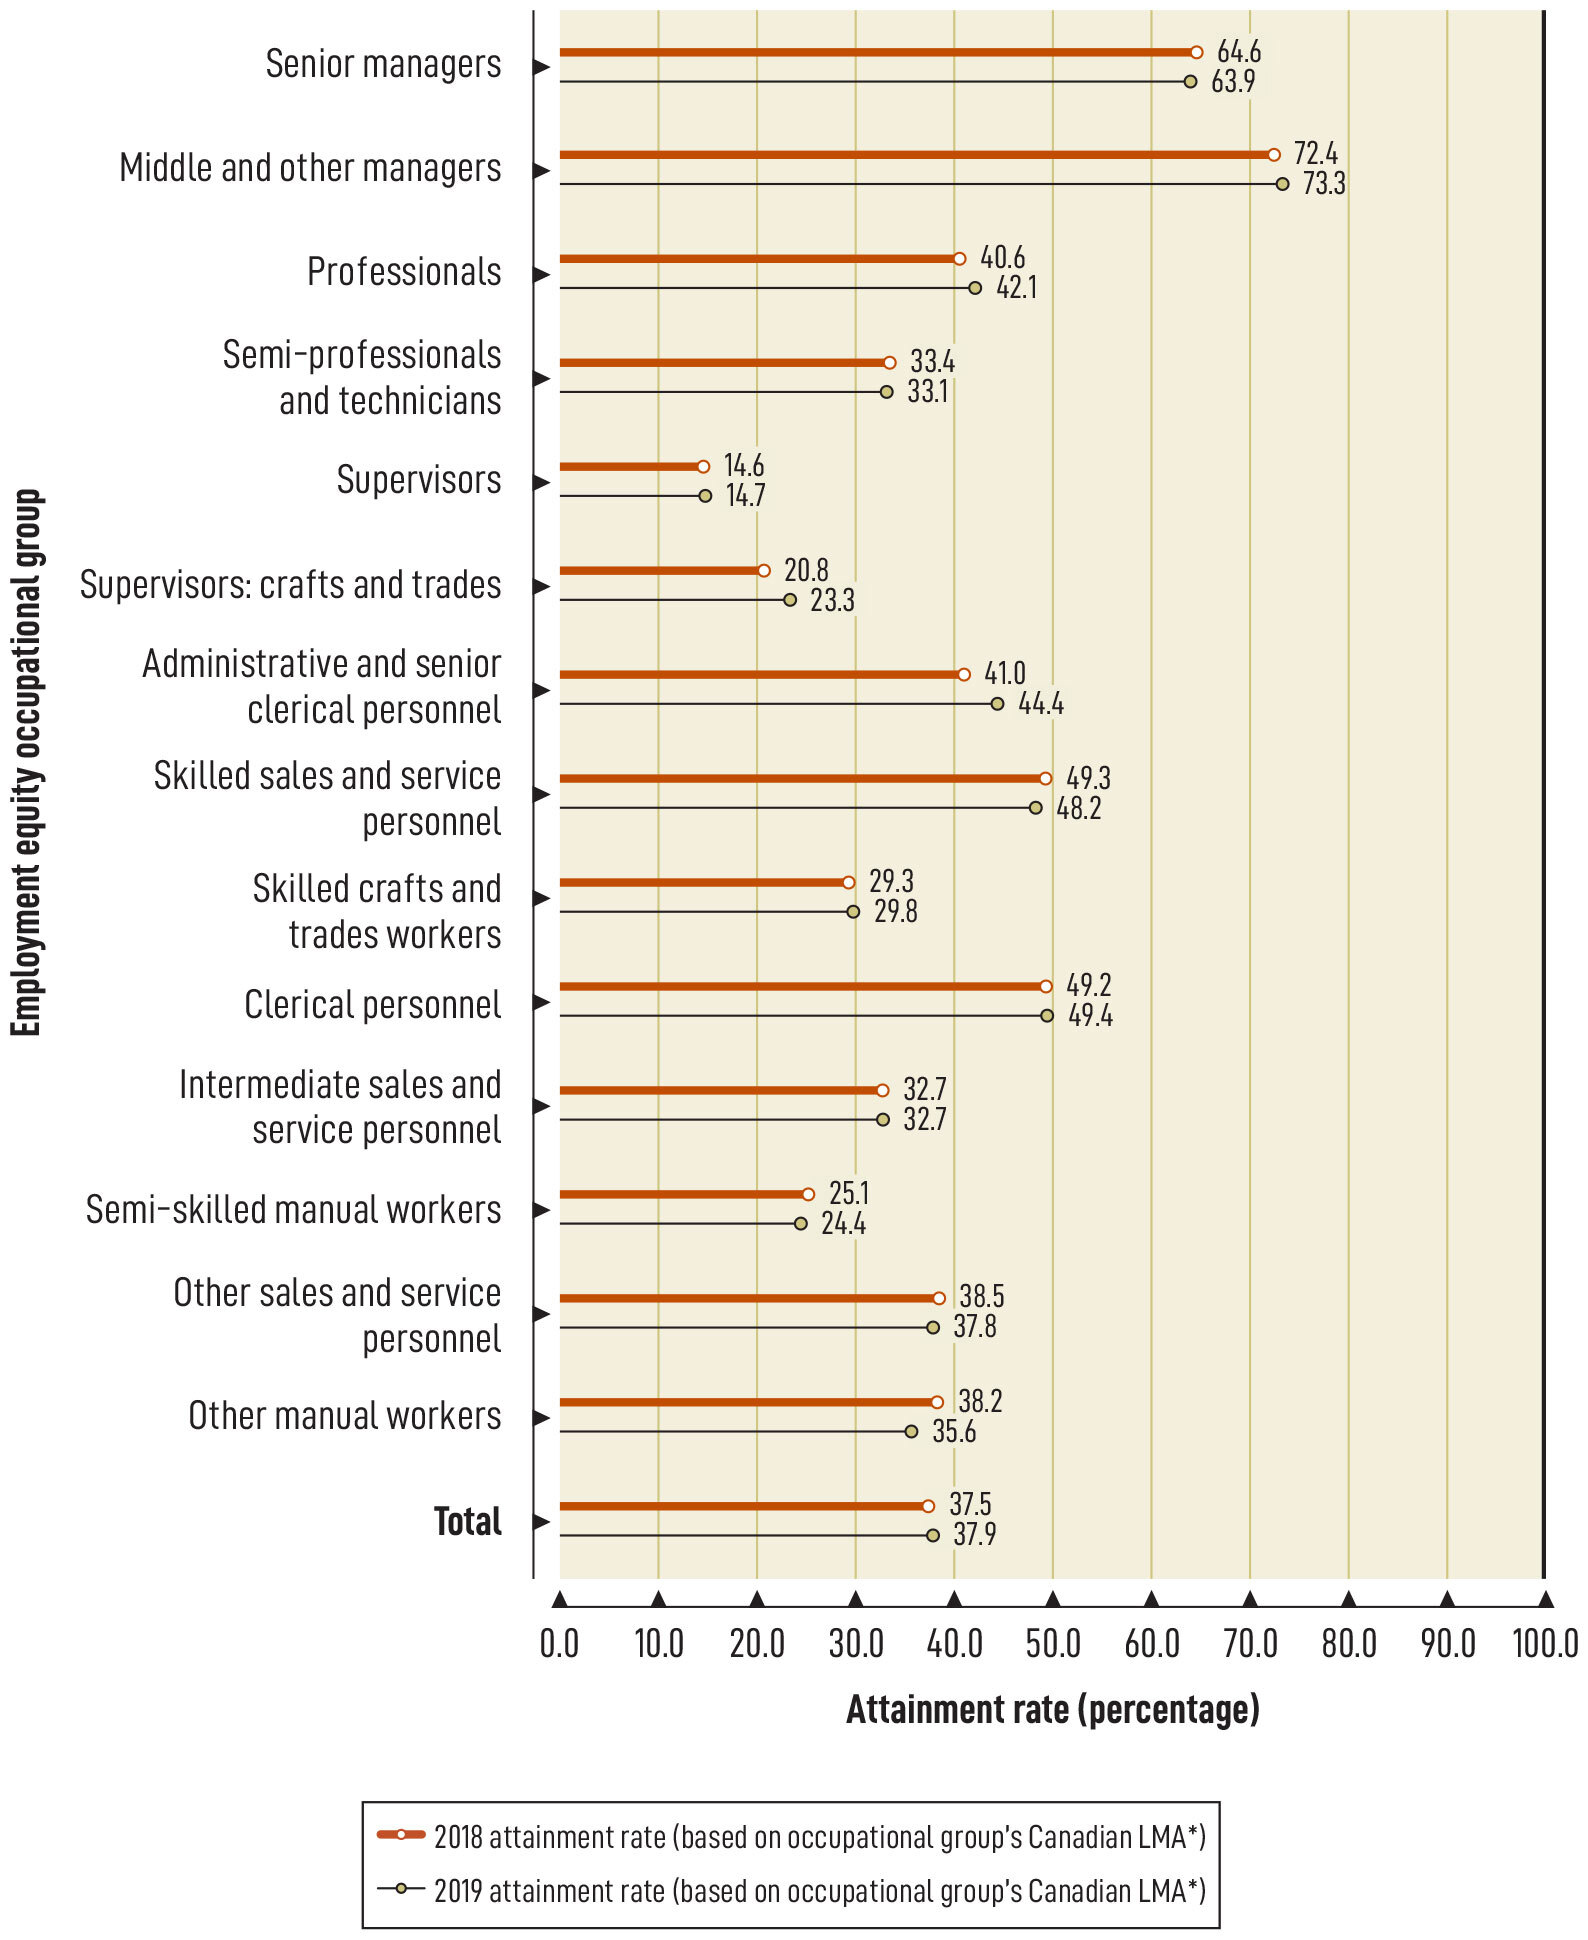
Chart 7 shows that at the overall level between 2018 and 2019, the representation of persons with disabilities continued to be below the corresponding occupational group’s Canadian LMA in all occupational groups. Among all occupational groups, the attainment rate is highest for persons with disabilities in the middle and other managers group.
* Source: Statistics Canada, 2017 Canadian Survey on Disability.
Chart 7: text description
| Employment equity occupational group | 2018 attainment rate based on occupational group's Canadian labour market availability (by percentage) | 2019 attainment rate based on occupational group's Canadian labour market availability (by percentage) |
|---|---|---|
| Senior managers | 64.6 | 63.9 |
| Middle and other managers | 72.4 | 73.3 |
| Professionals | 40.6 | 42.1 |
| Semi-professionals and technicians | 33.4 | 33.1 |
| Supervisors | 14.6 | 14.7 |
| Supervisors: crafts and trades | 20.8 | 23.3 |
| Administrative and senior clerical personnel | 41.0 | 44.4 |
| Skilled sales and service personnel | 49.3 | 48.2 |
| Skilled crafts and trades workers | 29.3 | 29.8 |
| Clerical personnel | 49.2 | 49.4 |
| Intermediate sales and service personnel | 32.7 | 32.7 |
| Semi-skilled manual workers | 25.1 | 24.4 |
| Other sales and service personnel | 38.5 | 37.8 |
| Other manual workers | 38.2 | 35.6 |
| Total | 37.5 | 37.9 |
Wage gap
In 2019,there was a wage gap in the case of women with disabilities working in permanent full-time positions:
- women with disabilities remained less likely (50.8%) to earn $60,000 or more, compared to men with disabilities (63.1%) and all women (52.6%)
- a higher percentage of women with disabilities (30.2%) earned salaries below $50,000 than men with disabilities (20.7%) and all women (29.0%)
- a smaller percentage of women with disabilities (15.0%) earned salaries of $100,000 or more, compared to men with disabilities (22.7%) and all women (16.5%)
Additional data on the representation, attainment rates, hires, promotions and terminations of employees by designated group and sector is provided in Appendix A.
Members of visible minorities
The representation of members of visible minorities in the federally regulated private sector increased from 23.8% in 2018 to 24.4% in 2019. In all sectors combined and in each sector, except for the communications sector, more members of visible minorities entered than left the workforce. This designated group also received a higher share of promotions than their representation level at the overall level and in each sector, with the exception of the ‘other’ sector.
Chart 8 shows that since 1987, the representation of members of visible minorities has been increasing steadily; this designated group has made the most progress in overall representation since 1987.
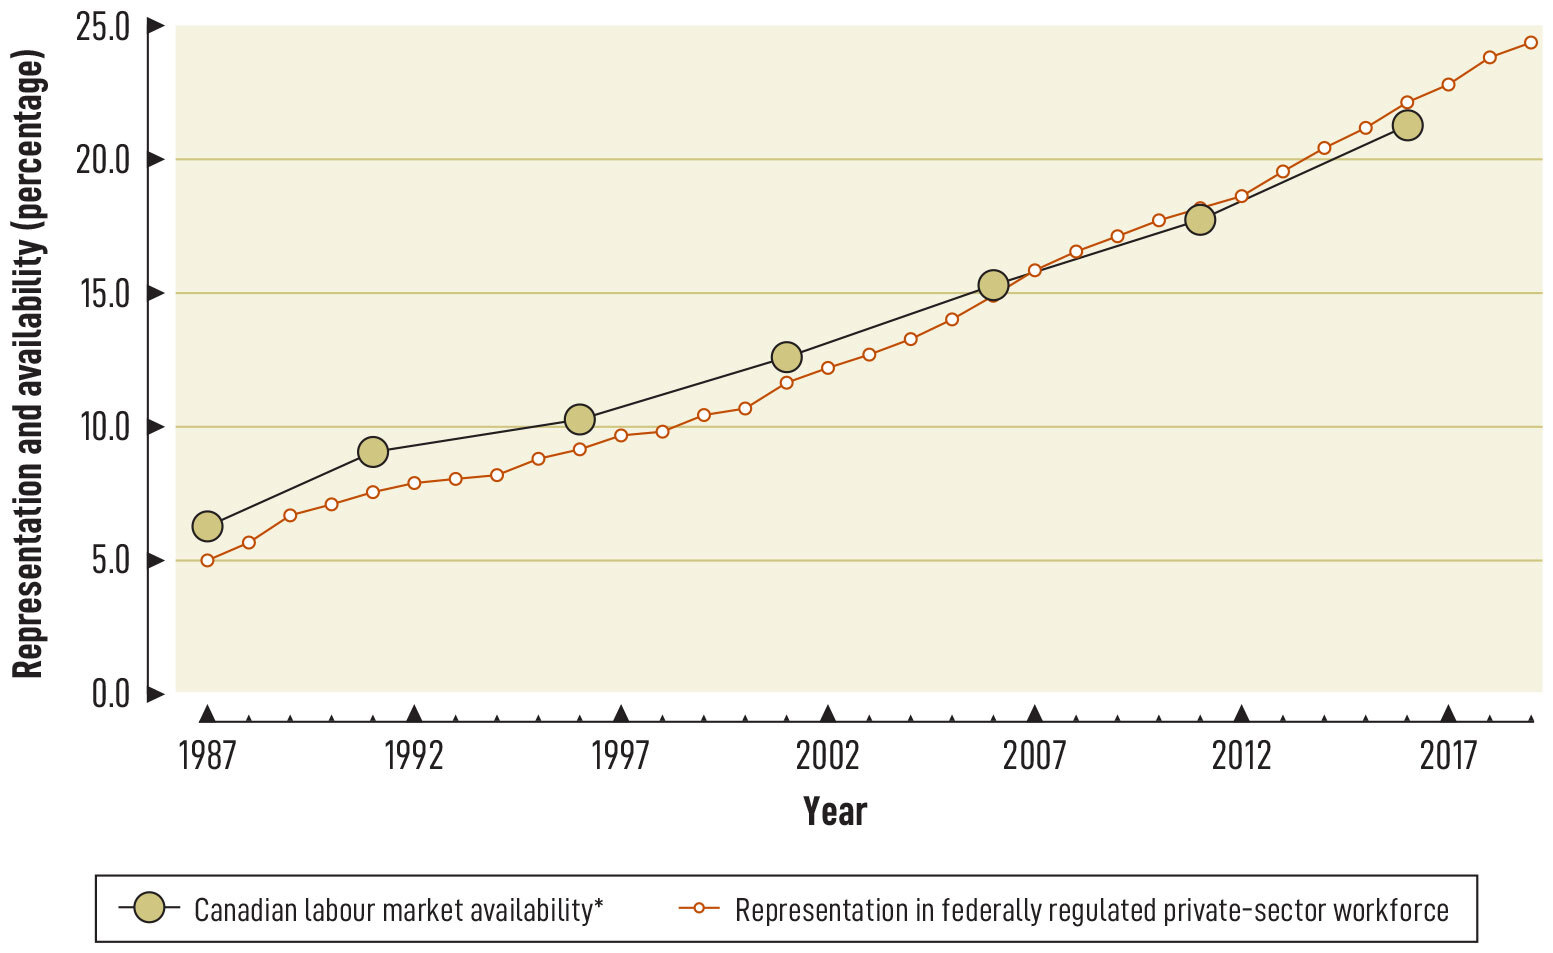
* Sources: Statistics Canada, 1986 to 2016 Census and 2011 National Household Survey.
Chart 8: text description
| Year | Canadian labour market availability (by percentage) | Representation (by percentage) |
|---|---|---|
| 1987 | 6.3 | 5.0 |
| 1988 | N/A | 5.7 |
| 1989 | N/A | 6.7 |
| 1990 | N/A | 7.1 |
| 1991 | 9.1 | 7.6 |
| 1992 | N/A | 7.9 |
| 1993 | N/A | 8.1 |
| 1994 | N/A | 8.2 |
| 1995 | N/A | 8.8 |
| 1996 | 10.3 | 9.2 |
| 1997 | N/A | 9.7 |
| 1998 | N/A | 9.9 |
| 1999 | N/A | 10.4 |
| 2000 | N/A | 10.7 |
| 2001 | 12.6 | 11.7 |
| 2002 | N/A | 12.2 |
| 2003 | N/A | 12.7 |
| 2004 | N/A | 13.3 |
| 2005 | N/A | 14.1 |
| 2006 | 15.3 | 14.9 |
| 2007 | N/A | 15.9 |
| 2008 | N/A | 16.6 |
| 2009 | N/A | 17.1 |
| 2010 | N/A | 17.8 |
| 2011 | 17.8 | 18.2 |
| 2012 | N/A | 18.6 |
| 2013 | N/A | 19.6 |
| 2014 | N/A | 20.4 |
| 2015 | N/A | 21.2 |
| 2016 | 21.3 | 22.2 |
| 2017 | N/A | 22.8 |
| 2018 | N/A | 23.8 |
| 2019 | N/A | 24.4 |
Occupational Group
Chart 9 shows that at the overall level, the attainment rates (based on occupational groups’ Canadian LMA) of members of visible minorities are above the 100% threshold in 8 of the 14 occupational groups in 2019, and reached full representation and the highest attainment rate in the administrative and senior clerical personnel occupational group. This designated group’s representation continued to exceed the corresponding occupational group’s Canadian LMA in the middle and other managers and professionals occupational groups that are important feeder groups to the senior managers occupational group.
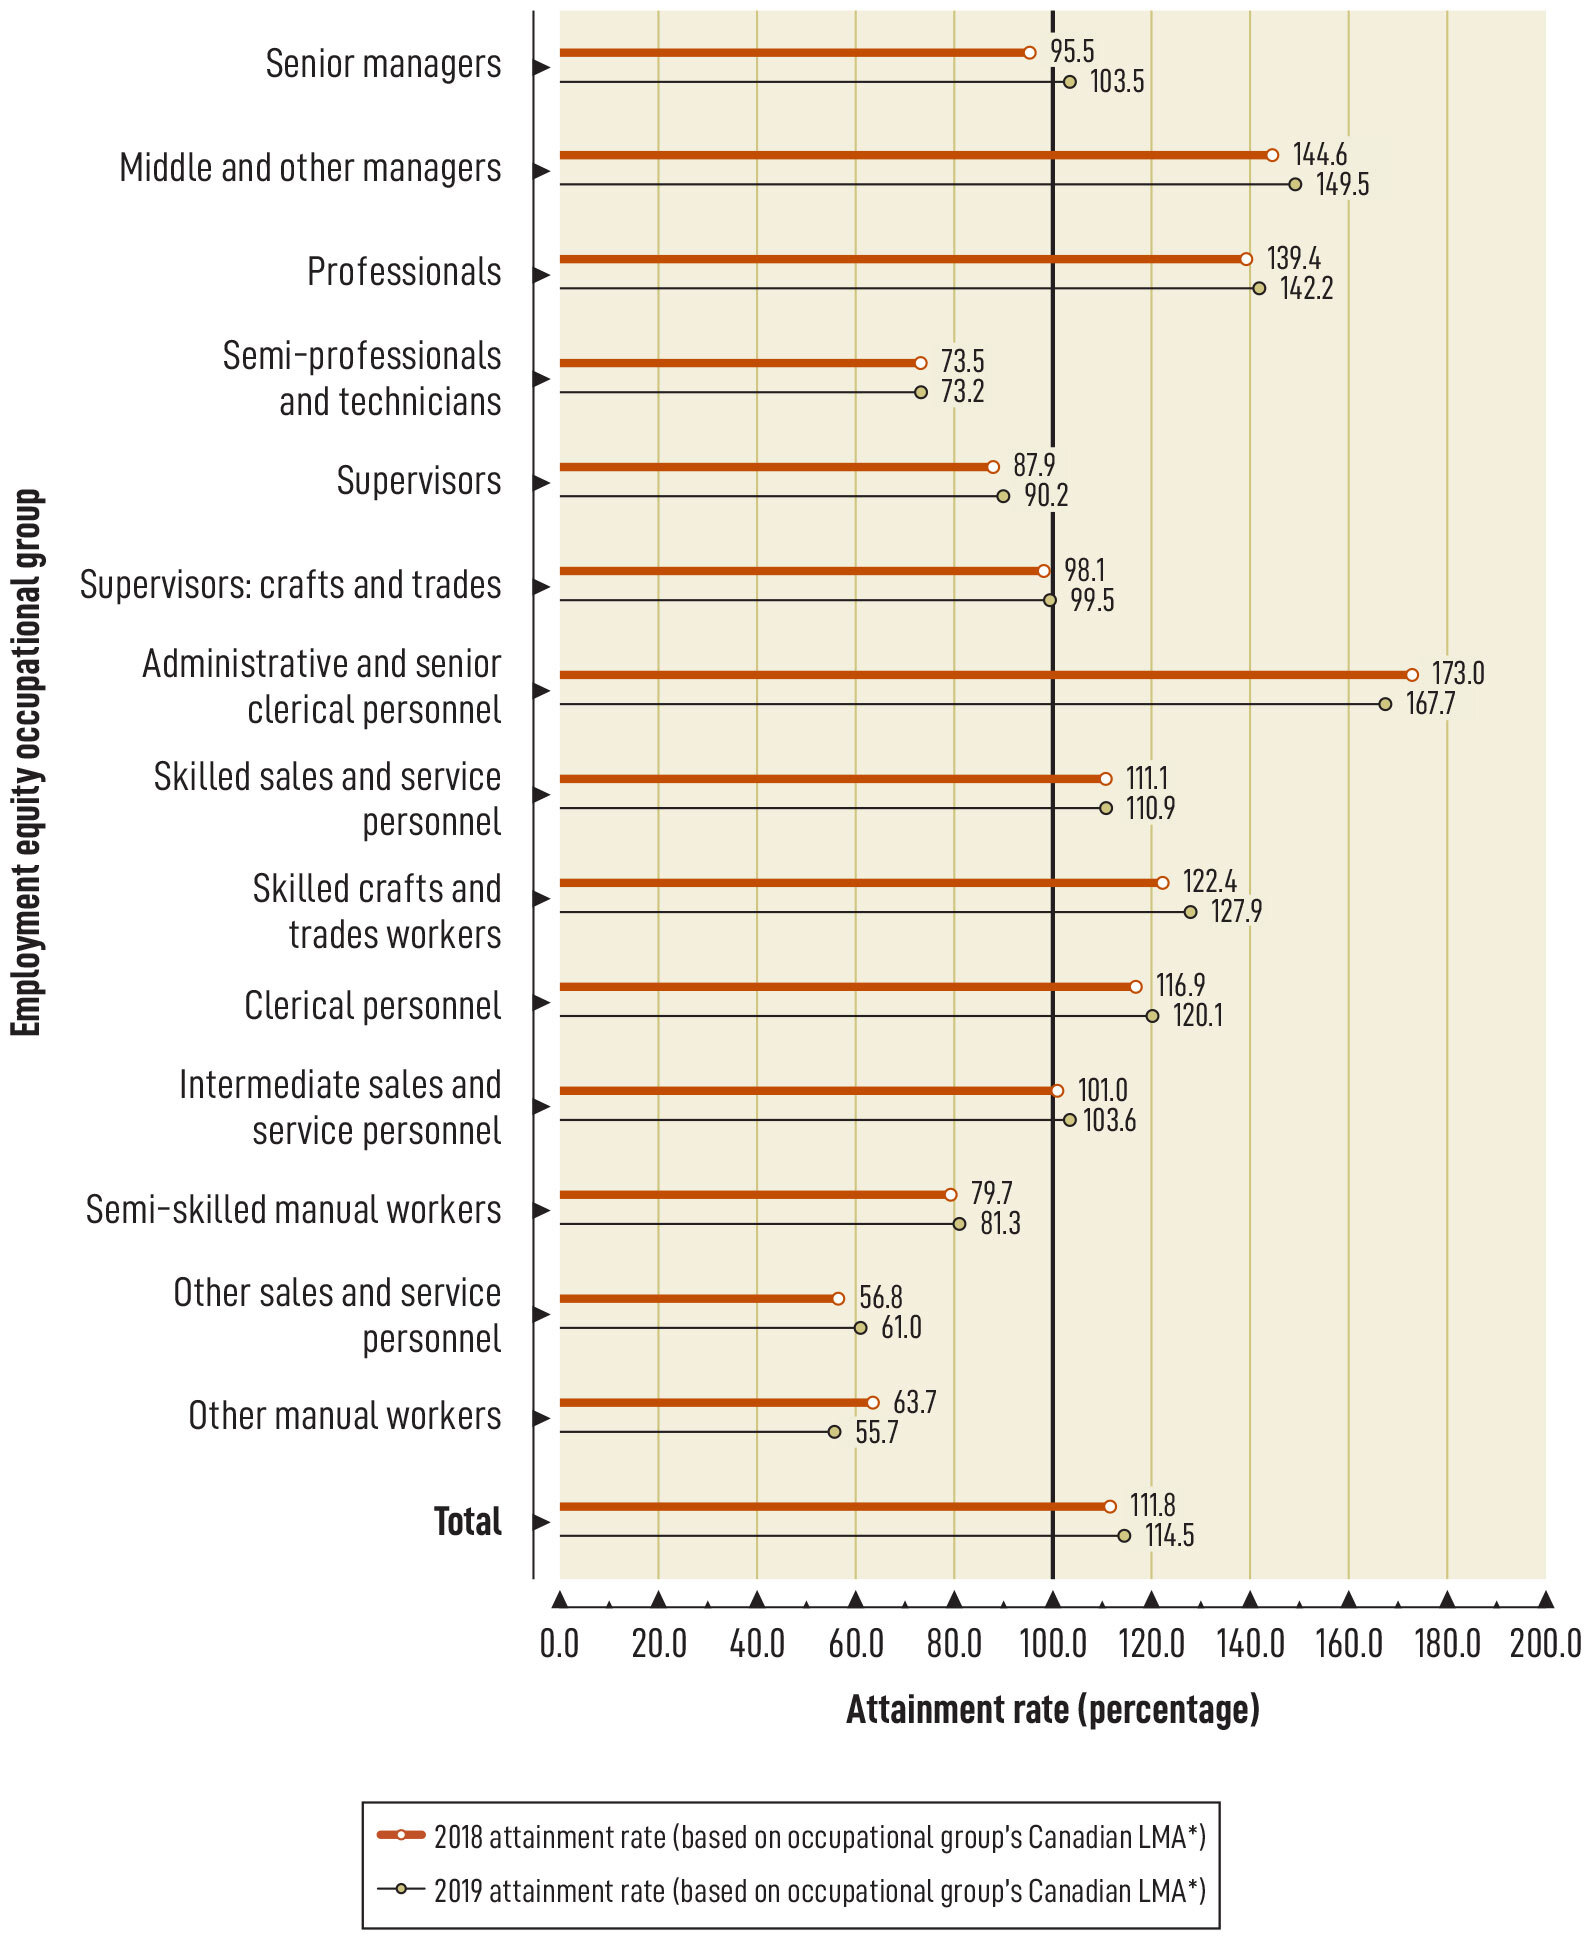
* Source: Statistics Canada, 2016 Census.
Chart 9: text description
| Employment equity occupational group | 2018 attainment rate based on occupational group's Canadian labour market availability (by percentage) | 2019 attainment rate based on occupational group's Canadian labour market availability (by percentage) |
|---|---|---|
| Senior managers | 95.5 | 103.5 |
| Middle and other managers | 144.6 | 149.5 |
| Professionals | 139.4 | 142.2 |
| Semi-professionals and technicians | 73.5 | 73.2 |
| Supervisors | 87.9 | 90.2 |
| Supervisors: crafts and trades | 98.1 | 99.5 |
| Administrative and senior clerical personnel | 173.0 | 167.7 |
| Skilled sales and service personnel | 111.1 | 110.9 |
| Skilled crafts and trades workers | 122.4 | 127.9 |
| Clerical personnel | 116.9 | 120.1 |
| Intermediate sales and service personnel | 101.0 | 103.6 |
| Semi-skilled manual workers | 79.7 | 81.3 |
| Other sales and service personnel | 56.8 | 61.0 |
| Other manual workers | 63.7 | 55.7 |
| Total | 111.8 | 114.5 |
Wage gap
In 2019, there was a wage gap in the case of visible minority women working in permanent full-time positions:
- visible minority women remained less likely (52.1%) to earn $60,000 or more, compared to visible minority men (62.1%) and all women (52.6%)
- a higher percentage of visible minority women (30.2%) earned salaries below $50,000 than visible minority men (22.6%) and all women (29.0%)
- a smaller percentage of visible minority women (16.4%) earned salaries of $100,000 or more, compared to visible minority men (23.0%) and all women (16.5%)
Additional data on the representation, attainment rates, hires, promotions and terminations of employees by designated group and sector is provided in Appendix A.
Section 4: Employment equity highlights
This section provides an overview of the initiatives and activities that support the achievement of employment equity objectives, including:
- the Federal Contractors Program (FCP)
- the Workplace Opportunities: Removing Barriers to Equity (grants and contributions)
- pay transparency measures
- review of the Employment Equity Act, and
- other legislative initiatives that support diversity and inclusion
Federal Contractors Program
The aim of the Federal Contractors Program (FCP) is to advance social and economic development objectives through government procurement by requiring organizations that are under contract with the Government of Canada to implement employment equity in their workplaces. It applies to provincially regulated employers that have a workforce in Canada of 100 or more employees and have a federal government goods and services contract valued at $1 million or more (including applicable taxes).
As part of their obligations, contractors must collect and analyze data about their workforce and, where gaps in representation exist, set goals to increase representation for the 4 designated groups: women, Aboriginal peoples, persons with disabilities and members of visible minorities. Contractors are required to make progress towards meeting their goals and achieving an equitable workforce.
As of December 31, 2019, 350 (341 certified and 9 voluntary) employers were covered under the FCP. A total of 22 (20 certified and 2 voluntary) employers were added during the 2019 calendar year.
The Labour Program conducts compliance assessments to ensure that contractors fulfill the terms of the FCP. A first compliance assessment is conducted 1 year after an employer has been awarded a contract. Subsequent assessments are conducted 4 years after the contract award date and every 3 years thereafter to verify that progress is being made. In 2019, the Labour Program completed 34 first-year assessments and 71 subsequent assessments for a combined total of 105 compliance assessments, with all contractors found to be in compliance.
Workplace Opportunities: Removing Barriers to Equity
Workplace Opportunities: Removing Barriers to Equity (WORBE) is a grants and contributions initiative designed to support private-sector employers subject to the Act in their efforts to improve the representation and participation of designated group members in areas with low representation through partnerships, information sharing and implementation of industry-tailored strategies.
Up to $500,000 per fiscal year in total funding is currently available to eligible recipients. In the Supporting Canadians and Fighting COVID-19 Fall Economic Statement 2020, the Government of Canada committed $3.6 million on an ongoing basis to expand WORBE, to promote projects that help federally regulated workplaces become more representative of Canada’s diversity.
Since its launch in 2014, WORBE has supported 10 projects, as follows:
- 4 grant projects completed in 2016
- 2 contribution agreements concluded in 2017
- 3 contribution agreements concluded in 2018, and
- 1 project in progress
In 2018, a contribution agreement valued at nearly $1.5 million with Ryerson University for the ALiGN Network for Employment Equity and Inclusion project began and will conclude in March 2022. The objectives of this project are to:
- improve understanding among stakeholders in the banking and financial services, communications and transportation sectors of industry-specific barriers to inclusion, including systemic barriers, implicit bias and non-essential qualifications in high demand occupations, and of effective processes to overcome them
- expand the pool of women, Aboriginal peoples and persons with disabilities for select job classifications across the 3 sectors using evidence-based recruitment to minimize unconscious bias and industry-tailored skills training, and
- develop new inclusion tools and guides to promote evidence-based approaches to recruitment, based on research and practices for the 3 sectors
A new intake process will be launched in 2021 to allocate future WORBE funding.
Pay transparency
In 2018, the Government of Canada undertook to implement new pay transparency measures in federally regulated private-sector workplaces that require employers subject to the Act to report new salary data as part of their annual reporting requirements. The new pay transparency measures will provide Canadians with online and easily comparable information on wage gaps among these employers. Pay transparency will go beyond addressing the gender wage gap by highlighting wage gaps that affect all 4 designated groups, making Canada the first country to make this level of information publicly available. The pay transparency measures will give employers an opportunity to review their practices, show leadership in reducing wage gaps and improve employment outcomes, thus helping to shift business culture and expectations towards greater equality.
After the Employment Equity Regulations were amended in 2020, the new measures came into force on January 1, 2021 and will require employers to report new salary data in their 2021 annual employment equity reports to be submitted by June 1, 2022.
Review of the Employment Equity Act
In the 2020 Fall Economic Statement, the government committed $4 million to support a task force on modernizing the Act. The task force will have a mandate to study, consult and advise on how a renewed Employment Equity Act can help ensure that Canada’s economic recovery is equitable, inclusive and fair. The review of the Act will be supported by a Secretariat housed within the Labour Program.
Other legislative initiatives in support of inclusive workplaces
Over the past few years, a number of legislative and regulatory initiatives have been implemented to further support diversity and inclusion in the federally regulated private sector, including the following:
- the federal government passed the Pay Equity Act in 2018 to ensure that employers provide equal pay to women and men doing work of equal value
- in 2019, the Accessible Canada Act came into force to make Canada barrier-free by
January 1, 2040 - in 2019, a number of changes to Part III (Standard Hours, Wages, Vacations and Holidays) of the Canada Labour Code came into force. The changes included making improvements to employees’ work-life balance and introducing new types of leave, such as leave for victims of family violence, to address gender-based violence, and leave for traditional Aboriginal peoples practices. Employees may now have more flexibility with respect to annual vacations and greater control over their hours of work
- to ensure that workplaces are free from harassment and violence, including sexual harassment and sexual violence, the Workplace Harassment and Violence Prevention Regulations came into force on January 1, 2021
Conclusion
This report contains a broad analysis of the results that federally regulated private sector employers have achieved in implementing employment equity in their workplaces for the 2019 calendar year. This year’s report covers 571 employers with a combined workforce of 772,402 employees. This is a 29.7% increase in the workforce coverage since the gathering of employment equity data started in 1987, when 373 employers reported on their workforce data for 595,417 employees.
At the overall level, the representation of members of visible minorities has continued to consistently exceed the Canadian LMA since 2007, reaching 24.4% in 2019. Women, Aboriginal peoples and persons with disabilities continue to be under-represented, as their representation remained stable between 2018 and 2019. Increases in representation were observed for all of the designated groups in the communications and ‘other’ sectors at the sector level. Improvements in representation were also noted for women and members of visible minorities in management positions, and Aboriginal peoples and persons with disabilities in the professionals occupational group at the all employers combined level. Although members of visible minorities have attained a representation rate that exceeds LMA at the overall level, they are under-represented in some sectors and occupational groups.
With the spread of COVID-19 in 2020, employers and employees may have faced significant disruptions in the workplace. It is anticipated that the employers’ 2020 annual employment equity reports to be submitted in 2021 will show contractions, especially in some industries that were the most affected by the pandemic. We will be analyzing the impacts on the designated groups and providing the results in next year’s annual report.
Given Canada’s current economic situation, it is important to ensure that everyone has access to equal employment opportunities. Employers are encouraged to continue their efforts to eliminate barriers to recruitment, promotion and retention of the designated groups and contribute to the creation of safe, fair and productive workplaces for all Canadians.
Appendix A: Federally regulated private sector employers tables
The following tables consolidate data from the annual reports submitted by federally regulated private sector employers. To allow for comparative analysis, some of the data from 1987 (the year when data was first collected) is included with 2018 and 2019 data.
Tables 1.1 to 3.4 in this Appendix present data aggregated to include permanent full-time, permanent part-time and temporary employees. Tables 4.1 to 4.10 summarize information for the 4 industrial sectors, including: number, representation, shares of hires, promotions and terminations, as well as the net effect of hires less terminations. Tables 5.1 to 6.4 present salary data for permanent full-time and permanent part-time employees respectively.
List of tables
- Table 1.1: Representation and availability of women in the federally regulated private sector by census metropolitan area, province and territory in 1987, 2018 and 2019 (by percentage)
- Table 1.2: Representation and availability of Aboriginal peoples in the federally regulated private sector by census metropolitan area, province and territory in 1987, 2018 and 2019 (by percentage)
- Table 1.3: Representation and availability of persons with disabilities in the federally regulated private sector by census metropolitan area, province and territory in 1987, 2018 and 2019 (by percentage)
- Table 1.4: Representation and availability of members of visible minorities in the federally regulated private sector by census metropolitan area, province and territory in 1987, 2018 and 2019 (by percentage)
- Table 2.1: Representation and attainment rate (sector availability) of women in the banking and financial services sector by occupational group in 2018 and 2019 (by percentage)
- Table 2.2: Representation and attainment rate (sector availability) of women in the communications sector by occupational group in 2018 and 2019 (by percentage)
- Table 2.3: Representation and attainment rate (sector availability) of women in the transportation sector by occupational group in 2018 and 2019 (by percentage)
- Table 2.4: Representation and attainment rate (sector availability) of women in the ‘other’ sector by occupational group in 2018 and 2019 (by percentage)
- Table 2.5: Representation and attainment rate (sector availability) of Aboriginal peoples in the banking and financial services sector by occupational group in 2018 and 2019 (by percentage)
- Table 2.6: Representation and attainment rate (sector availability) of Aboriginal peoples in the communications sector by occupational group in 2018 and 2019 (by percentage)
- Table 2.7: Representation and attainment rate (sector availability) of Aboriginal peoples in the transportation sector by occupational group in 2018 and 2019 (by percentage)
- Table 2.8: Representation and attainment rate (sector availability) of Aboriginal peoples in the ‘other’ sector by occupational group in 2018 and 2019 (by percentage)
- Table 2.9: Representation and attainment rate (sector availability) of members of visible minorities in the banking and financial services sector by occupational group in 2018 and 2019 (by percentage)
- Table 2.10: Representation and attainment rate (sector availability) of members of visible minorities in the communications sector by occupational group in 2018 and 2019 (by percentage)
- Table 2.11: Representation and attainment rate (sector availability) of members of visible minorities in the transportation sector by occupational group in 2018 and 2019 (by percentage)
- Table 2.12: Representation and attainment rate (sector availability) of members of visible minorities in the ‘other’ sector by occupational group in 2018 and 2019 (by percentage)
- Table 2.13: Representation and attainment rate (Canadian availability) of women in all sectors by occupational group in 2018 and 2019 (by percentage)
- Table 2.14: Representation and attainment rate (Canadian availability) of Aboriginal peoples in all sectors by occupational group in 2018 and 2019 (by percentage)
- Table 2.15: Representation and attainment rate (Canadian availability) of persons with disabilities in all sectors by occupational group in 2018 and 2019 (by percentage)
- Table 2.16: Representation and attainment rate (Canadian availability) of members of visible minorities in all sectors by occupational group in 2018 and 2019 (by percentage)
- Table 3.1: Distribution of women and men in the federally regulated private sector by occupational group in 2018 and 2019 (by percentage)
- Table 3.2: Distribution of Aboriginal and non-Aboriginal peoples in the federally regulated private sector by occupational group in 2018 and 2019 (by percentage)
- Table 3.3: Distribution of persons with and without disabilities in the federally regulated private sector by occupational group in 2018 and 2019 (by percentage)
- Table 3.4: Distribution of members and non-members of visible minorities in the federally regulated private sector by occupational group in 2018 and 2019 (by percentage)
- Table 4.1: Number, hires, promotions, terminations and net effect of designated group members in the banking and financial services sector in 2018 and 2019
- Table 4.2: Representation and shares of hires, promotions and terminations of designated group members in the banking and financial services sector in 2018 and 2019 (by percentage)
- Table 4.3: Number, hires, promotions, terminations and net effect of designated group members in the communications sector in 2018 and 2019
- Table 4.4: Representation and shares of hires, promotions and terminations of designated group members in the communications sector in 2018 and 2019 (by percentage)
- Table 4.5: Number, hires, promotions, terminations and net effect of designated group members in the transportation sector in 2018 and 2019
- Table 4.6: Representation and shares of hires, promotions and terminations of designated group members in the transportation sector in 2018 and 2019 (by percentage)
- Table 4.7: Number, hires, promotions, terminations and net effect of designated group members in the ‘other’ sector in 2018 and 2019
- Table 4.8: Representation and shares of hires, promotions and terminations of designated group members in the ‘other’ sector in 2018 and 2019 (by percentage)
- Table 4.9: Number, hires, promotions, terminations and net effect of designated group members in all sectors in 2018 and 2019
- Table 4.10: Representation and shares of hires, promotions and terminations of designated group members in all sectors in 2018 and 2019 (by percentage)
- Table 5.1: Number and representation of men and women in permanent full-time employment in the federally regulated private sector by salary range as of December 31, 2019
- Table 5.2: Number and representation of Aboriginal peoples in permanent full-time employment in the federally regulated private sector by salary range as of December 31, 2019
- Table 5.3: Number and representation of persons with disabilities in permanent full-time employment in the federally regulated private sector by salary range as of December 31, 2019
- Table 5.4: Number and representation of members of visible minorities in permanent full-time employment in the federally regulated private sector by salary range as of December 31, 2019
- Table 6.1: Number and representation of men and women in permanent part-time employment in the federally regulated private sector by salary range as of December 31, 2019
- Table 6.2: Number and representation of Aboriginal peoples in permanent part-time employment in the federally regulated private sector by salary range as of December 31, 2019
- Table 6.3: Number and representation of persons with disabilities in permanent part-time employment in the federally regulated private sector by salary range as of December 31, 2019
- Table 6.4: Number and representation of members of visible minorities in permanent part-time employment in the federally regulated private sector by salary range as of December 31, 2019
| Census metropolitan area, province and territory | 1987 representation | 2018 representation | 2019 representation | 2016 availability* |
|---|---|---|---|---|
| Halifax | 41.2 | 40.9 | 41.1 | 49.6 |
| Montréal | 39.0 | 39.6 | 39.4 | 48.5 |
| Toronto | 47.1 | 43.5 | 43.8 | 48.7 |
| Winnipeg | 32.7 | 31.8 | 32.0 | 48.6 |
| Regina | 42.9 | 47.2 | 46.3 | 48.1 |
| Calgary | 47.6 | 43.0 | 42.3 | 47.2 |
| Edmonton | 44.5 | 37.1 | 38.0 | 47.1 |
| Vancouver | 40.4 | 37.5 | 38.1 | 48.5 |
| Newfoundland and Labrador | 38.4 | 42.9 | 42.2 | 48.2 |
| Prince Edward Island | 38.0 | 35.2 | 34.2 | 49.4 |
| Nova Scotia | 34.4 | 42.6 | 41.8 | 49.2 |
| New Brunswick | 32.2 | 46.7 | 47.0 | 48.5 |
| Quebec | 39.8 | 38.3 | 38.0 | 48.1 |
| Ontario | 44.2 | 41.6 | 41.7 | 48.6 |
| Manitoba | 30.5 | 31.2 | 31.3 | 47.9 |
| Saskatchewan | 35.1 | 37.0 | 37.2 | 47.5 |
| Alberta | 45.3 | 40.0 | 39.9 | 46.7 |
| British Columbia | 41.5 | 36.9 | 37.4 | 48.4 |
| Yukon | 31.4 | 40.3 | 40.8 | 49.7 |
| Northwest Territories | 21.9 | 27.6 | 27.4 | 47.8 |
| Nunavut | N/A | 26.4 | 22.3 | 48.4 |
| Canada | 40.9 | 39.4 | 39.5 | 48.2 |
* Source: Statistics Canada, 2016 Census.
| Census metropolitan area, province and territory | 1987 representation | 2018 representation | 2019 representation | 2016 availability* |
|---|---|---|---|---|
| Halifax | 0.5 | 2.5 | 2.6 | 3.8 |
| Montréal | 0.3 | 0.8 | 0.8 | 0.8 |
| Toronto | 0.6 | 1.0 | 1.0 | 0.8 |
| Winnipeg | 0.8 | 7.3 | 7.6 | 9.8 |
| Regina | 0.4 | 2.9 | 3.2 | 6.8 |
| Calgary | 0.5 | 2.1 | 2.0 | 2.7 |
| Edmonton | 0.7 | 3.1 | 3.0 | 5.0 |
| Vancouver | 0.5 | 2.1 | 2.1 | 2.3 |
| Newfoundland and Labrador | 0.6 | 6.1 | 6.1 | 8.7 |
| Prince Edward Island | 0.2 | 1.3 | 1.2 | 1.8 |
| Nova Scotia | 0.4 | 2.6 | 2.6 | 5.3 |
| New Brunswick | 0.4 | 1.4 | 1.6 | 3.6 |
| Quebec | 0.4 | 1.1 | 1.1 | 2.1 |
| Ontario | 0.7 | 1.5 | 1.5 | 2.5 |
| Manitoba | 1.0 | 8.1 | 8.6 | 13.2 |
| Saskatchewan | 1.4 | 6.2 | 6.5 | 11.1 |
| Alberta | 0.7 | 2.8 | 2.8 | 5.2 |
| British Columbia | 0.7 | 3.4 | 3.3 | 5.2 |
| Yukon | 3.8 | 7.3 | 8.3 | 19.9 |
| Northwest Territories | 9.6 | 9.2 | 8.4 | 41.7 |
| Nunavut | N/A | 32.0 | 28.1 | 75.6 |
| Canada | 0.7 | 2.3 | 2.3 | 4.0 |
* Source: Statistics Canada, 2016 Census.
| Census metropolitan area, province and territory | 1987 representation | 2018 representation | 2019 representation | 2017 availability* |
|---|---|---|---|---|
| Halifax | 1.6 | 5.6 | 5.4 | N/A |
| Montréal | 1.1 | 2.3 | 2.3 | N/A |
| Toronto | 1.5 | 3.6 | 3.7 | N/A |
| Winnipeg | 1.8 | 3.4 | 3.4 | N/A |
| Regina | 2.4 | 3.6 | 3.7 | N/A |
| Calgary | 1.9 | 3.1 | 3.3 | N/A |
| Edmonton | 2.0 | 3.4 | 3.6 | N/A |
| Vancouver | 1.5 | 3.0 | 3.0 | N/A |
| Newfoundland and Labrador | 1.0 | 3.0 | 2.9 | 8.9 |
| Prince Edward Island | 1.2 | 2.9 | 2.4 | 10.2 |
| Nova Scotia | 3.5 | 5.5 | 5.3 | 13.1 |
| New Brunswick | 1.8 | 4.5 | 4.5 | 10.7 |
| Quebec | 1.1 | 2.2 | 2.1 | 6.1 |
| Ontario | 1.6 | 3.9 | 4.0 | 9.6 |
| Manitoba | 1.7 | 3.3 | 3.4 | 10.1 |
| Saskatchewan | 1.8 | 3.1 | 3.4 | 9.1 |
| Alberta | 1.9 | 3.3 | 3.4 | 9.9 |
| British Columbia | 1.7 | 3.3 | 3.3 | 11.0 |
| Yukon | 0.8 | 3.2 | 3.2 | 11.3 |
| Northwest Territories | 1.4 | 1.6 | 1.8 | 9.8 |
| Nunavut | N/A | 2.1 | 2.0 | 8.2 |
| Canada | 1.6 | 3.4 | 3.5 | 9.1 |
* Source: Statistics Canada, 2017 Canadian Survey on Disability.
| Census metropolitan area, province and territory | 1987 representation | 2018 representation | 2019 representation | 2016 availability* |
|---|---|---|---|---|
| Halifax | 1.9 | 9.8 | 10.7 | 9.7 |
| Montréal | 3.0 | 18.1 | 19.1 | 20.7 |
| Toronto | 12.0 | 39.0 | 39.6 | 48.8 |
| Winnipeg | 2.9 | 20.9 | 22.2 | 25.2 |
| Regina | 1.6 | 18.0 | 17.1 | 16.9 |
| Calgary | 5.6 | 24.8 | 26.0 | 31.3 |
| Edmonton | 4.4 | 24.2 | 24.9 | 26.5 |
| Vancouver | 7.9 | 37.0 | 37.4 | 45.9 |
| Newfoundland and Labrador | 0.7 | 2.5 | 3.4 | 2.3 |
| Prince Edward Island | 1.0 | 2.8 | 3.1 | 4.2 |
| Nova Scotia | 1.3 | 8.5 | 9.1 | 5.8 |
| New Brunswick | 1.1 | 5.0 | 6.4 | 3.0 |
| Quebec | 2.6 | 15.2 | 15.9 | 12.1 |
| Ontario | 7.3 | 29.9 | 30.4 | 27.9 |
| Manitoba | 2.6 | 17.6 | 18.6 | 17.8 |
| Saskatchewan | 1.2 | 11.0 | 11.2 | 10.7 |
| Alberta | 4.0 | 21.5 | 22.1 | 22.3 |
| British Columbia | 6.2 | 29.4 | 29.8 | 29.2 |
| Yukon | 1.4 | 13.0 | 12.3 | 8.5 |
| Northwest Territories | 2.5 | 14.3 | 16.2 | 10.5 |
| Nunavut | N/A | 8.6 | 8.8 | 4.0 |
| Canada | 5.0 | 23.8 | 24.4 | 21.3 |
* Source: Statistics Canada, 2016 Census.
| Employment equity occupational group | 2018 representation | 2019 representation | 2016 availability (sector)* | 2018 attainment rate | 2019 attainment rate |
|---|---|---|---|---|---|
| Senior managers | 36.1 | 36.5 | 29.1 | 124.1 | 125.5 |
| Middle and other managers | 47.5 | 48.4 | 53.4 | 88.8 | 90.6 |
| Professionals | 47.2 | 47.0 | 44.9 | 105.1 | 104.6 |
| Semi-professionals and technicians | 33.1 | 32.2 | 40.2 | 82.3 | 80.2 |
| Supervisors | 71.0 | 70.4 | 70.9 | 100.1 | 99.3 |
| Supervisors: crafts and trades | 15.4 | 13.3 | 32.7 | 47.1 | 40.8 |
| Administrative and senior clerical personnel | 73.6 | 72.6 | 76.3 | 96.5 | 95.2 |
| Skilled sales and service personnel | 61.3 | 60.6 | 63.2 | 97.0 | 95.9 |
| Skilled crafts and trades workers | 7.1 | 12.5 | 10.3 | 69.4 | 121.4 |
| Clerical personnel | 66.9 | 65.8 | 76.0 | 88.0 | 86.5 |
| Intermediate sales and service personnel | 74.6 | 74.9 | 77.7 | 96.1 | 96.4 |
| Semi-skilled manual workers | 15.8 | 16.2 | 24.2 | 65.3 | 66.9 |
| Other sales and service personnel | 28.9 | 27.8 | 50.2 | 57.6 | 55.3 |
| Other manual workers | 66.7 | 100.0 | 26.6 | 250.6 | 375.9 |
| Total | 56.6 | 56.1 | 58.9 | 96.1 | 95.2 |
* Source: Statistics Canada, 2016 Census.
| Employment equity occupational group | 2018 representation | 2019 representation | 2016 availability (sector)* | 2018 attainment rate | 2019 attainment rate |
|---|---|---|---|---|---|
| Senior managers | 27.2 | 28.8 | 21.8 | 124.8 | 132.1 |
| Middle and other managers | 37.3 | 37.8 | 38.6 | 96.8 | 98.0 |
| Professionals | 38.3 | 38.4 | 44.7 | 85.7 | 85.8 |
| Semi-professionals and technicians | 27.3 | 27.5 | 31.4 | 87.0 | 87.6 |
| Supervisors | 43.4 | 43.9 | 57.7 | 75.3 | 76.2 |
| Supervisors: crafts and trades | 18.7 | 17.7 | 27.1 | 68.9 | 65.2 |
| Administrative and senior clerical personnel | 74.7 | 74.5 | 77.0 | 97.1 | 96.7 |
| Skilled sales and service personnel | 32.5 | 32.6 | 38.6 | 84.3 | 84.4 |
| Skilled crafts and trades workers | 5.3 | 5.1 | 6.6 | 80.1 | 78.1 |
| Clerical personnel | 66.0 | 65.3 | 78.0 | 84.6 | 83.7 |
| Intermediate sales and service personnel | 45.7 | 45.2 | 51.9 | 88.0 | 86.9 |
| Semi-skilled manual workers | 27.9 | 34.9 | 18.2 | 153.7 | 191.8 |
| Other sales and service personnel | 56.0 | 52.7 | 41.4 | 135.1 | 127.1 |
| Other manual workers | 0.0 | 0.0 | 17.3 | 0.0 | 0.0 |
| Total | 34.8 | 34.9 | 44.1 | 78.9 | 79.2 |
* Source: Statistics Canada, 2016 Census.
| Employment equity occupational group | 2018 representation | 2019 representation | 2016 availability (sector)* | 2018 attainment rate | 2019 attainment rate |
|---|---|---|---|---|---|
| Senior managers | 21.0 | 21.9 | 17.0 | 123.7 | 128.6 |
| Middle and other managers | 31.1 | 31.9 | 28.7 | 108.3 | 111.3 |
| Professionals | 40.4 | 40.1 | 39.2 | 103.1 | 102.3 |
| Semi-professionals and technicians | 11.3 | 11.5 | 14.2 | 79.2 | 80.6 |
| Supervisors | 53.4 | 53.2 | 45.1 | 118.5 | 118.0 |
| Supervisors: crafts and trades | 7.2 | 8.9 | 12.7 | 57.0 | 70.0 |
| Administrative and senior clerical personnel | 70.7 | 71.6 | 80.3 | 88.0 | 89.1 |
| Skilled sales and service personnel | 21.8 | 24.9 | 33.8 | 64.5 | 73.6 |
| Skilled crafts and trades workers | 4.2 | 4.0 | 3.2 | 130.4 | 126.2 |
| Clerical personnel | 48.5 | 46.5 | 48.8 | 99.4 | 95.2 |
| Intermediate sales and service personnel | 71.1 | 70.8 | 65.2 | 109.0 | 108.5 |
| Semi-skilled manual workers | 11.5 | 11.6 | 11.0 | 104.0 | 105.8 |
| Other sales and service personnel | 41.6 | 39.1 | 33.2 | 125.1 | 117.6 |
| Other manual workers | 9.7 | 12.5 | 24.7 | 39.2 | 50.6 |
| Total | 30.1 | 30.1 | 25.3 | 118.9 | 118.9 |
* Source: Statistics Canada, 2016 Census.
| Employment equity occupational group | 2018 representation | 2019 representation | 2016 availability (sector)* | 2018 attainment rate | 2019 attainment rate |
|---|---|---|---|---|---|
| Senior managers | 27.8 | 27.1 | 23.3 | 119.4 | 116.3 |
| Middle and other managers | 25.9 | 27.0 | 29.5 | 87.7 | 91.4 |
| Professionals | 39.1 | 39.2 | 41.6 | 93.9 | 94.3 |
| Semi-professionals and technicians | 24.7 | 25.0 | 36.8 | 67.2 | 68.1 |
| Supervisors | 41.3 | 44.4 | 44.8 | 92.0 | 99.0 |
| Supervisors: crafts and trades | 7.1 | 6.7 | 9.1 | 78.2 | 73.1 |
| Administrative and senior clerical personnel | 74.5 | 73.8 | 75.5 | 98.8 | 97.8 |
| Skilled sales and service personnel | 12.0 | 13.5 | 39.2 | 30.6 | 34.5 |
| Skilled crafts and trades workers | 6.3 | 6.5 | 3.4 | 186.6 | 194.7 |
| Clerical personnel | 70.3 | 70.6 | 71.0 | 99.0 | 99.4 |
| Intermediate sales and service personnel | 34.6 | 36.8 | 43.8 | 79.0 | 84.0 |
| Semi-skilled manual workers | 13.5 | 13.2 | 21.5 | 62.5 | 61.3 |
| Other sales and service personnel | 37.3 | 36.9 | 36.7 | 101.7 | 100.7 |
| Other manual workers | 10.2 | 12.0 | 22.1 | 46.2 | 54.2 |
| Total | 29.8 | 30.3 | 34.5 | 86.2 | 87.8 |
* Source: Statistics Canada, 2016 Census.
| Employment equity occupational group | 2018 representation | 2019 representation | 2016 availability (sector)* | 2018 attainment rate | 2019 attainment rate |
|---|---|---|---|---|---|
| Senior managers | 0.7 | 0.6 | 1.2 | 58.5 | 48.5 |
| Middle and other managers | 1.1 | 1.0 | 1.5 | 74.0 | 72.0 |
| Professionals | 0.9 | 0.9 | 1.1 | 84.6 | 87.0 |
| Semi-professionals and technicians | 0.9 | 1.2 | 1.6 | 53.1 | 75.5 |
| Supervisors | 1.6 | 1.5 | 2.4 | 67.7 | 61.8 |
| Supervisors: crafts and trades | 0.0 | 0.0 | 3.8 | 0.0 | 0.0 |
| Administrative and senior clerical personnel | 1.3 | 1.3 | 2.0 | 63.8 | 66.0 |
| Skilled sales and service personnel | 1.4 | 1.4 | 2.1 | 64.8 | 64.3 |
| Skilled crafts and trades workers | 0.0 | 6.3 | 5.9 | 0.0 | 106.3 |
| Clerical personnel | 1.4 | 1.5 | 2.0 | 71.7 | 74.9 |
| Intermediate sales and service personnel | 1.9 | 2.0 | 2.7 | 69.5 | 72.8 |
| Semi-skilled manual workers | 1.5 | 1.7 | 2.7 | 56.9 | 62.3 |
| Other sales and service personnel | 0.0 | 0.0 | 3.9 | 0.0 | 0.0 |
| Other manual workers | 0.0 | 0.0 | 7.3 | 0.0 | 0.0 |
| Total | 1.2 | 1.2 | 1.7 | 72.1 | 72.7 |
* Source: Statistics Canada, 2016 Census.
| Employment equity occupational group | 2018 representation | 2019 representation | 2016 availability (sector)* | 2018 attainment rate | 2019 attainment rate |
|---|---|---|---|---|---|
| Senior managers | 0.5 | 1.6 | 1.0 | 53.6 | 167.1 |
| Middle and other managers | 1.6 | 1.6 | 1.8 | 85.2 | 86.4 |
| Professionals | 1.7 | 1.9 | 1.6 | 109.3 | 119.8 |
| Semi-professionals and technicians | 2.1 | 2.2 | 3.5 | 61.6 | 64.6 |
| Supervisors | 2.4 | 2.2 | 1.0 | 231.4 | 211.3 |
| Supervisors: crafts and trades | 2.2 | 1.7 | 2.1 | 104.0 | 81.2 |
| Administrative and senior clerical personnel | 1.8 | 1.8 | 2.7 | 67.9 | 67.5 |
| Skilled sales and service personnel | 1.9 | 1.9 | 2.2 | 84.8 | 85.0 |
| Skilled crafts and trades workers | 2.9 | 2.8 | 3.1 | 93.3 | 92.1 |
| Clerical personnel | 2.3 | 2.3 | 2.9 | 80.6 | 78.6 |
| Intermediate sales and service personnel | 2.3 | 2.3 | 3.0 | 77.1 | 77.5 |
| Semi-skilled manual workers | 2.8 | 1.8 | 3.7 | 75.0 | 48.2 |
| Other sales and service personnel | 3.0 | 2.4 | 3.4 | 87.1 | 70.5 |
| Other manual workers | 0.0 | 0.0 | 5.5 | 0.0 | 0.0 |
| Total | 2.1 | 2.2 | 2.5 | 84.6 | 86.1 |
* Source: Statistics Canada, 2016 Census.
| Employment equity occupational group | 2018 representation | 2019 representation | 2016 availability (sector)* | 2018 attainment rate | 2019 attainment rate |
|---|---|---|---|---|---|
| Senior managers | 1.3 | 1.4 | 2.3 | 58.0 | 60.1 |
| Middle and other managers | 1.8 | 1.7 | 2.7 | 65.6 | 61.7 |
| Professionals | 1.6 | 1.6 | 1.6 | 101.1 | 97.9 |
| Semi-professionals and technicians | 2.5 | 2.5 | 3.7 | 66.9 | 67.2 |
| Supervisors | 3.0 | 3.0 | 3.6 | 83.5 | 83.1 |
| Supervisors: crafts and trades | 3.8 | 3.7 | 4.9 | 77.7 | 76.6 |
| Administrative and senior clerical personnel | 2.1 | 2.1 | 3.2 | 66.2 | 67.0 |
| Skilled sales and service personnel | 2.8 | 2.9 | 3.6 | 77.5 | 81.9 |
| Skilled crafts and trades workers | 4.0 | 4.1 | 4.7 | 85.8 | 86.8 |
| Clerical personnel | 2.3 | 2.4 | 3.5 | 66.1 | 69.2 |
| Intermediate sales and service personnel | 3.1 | 3.1 | 3.6 | 84.8 | 85.1 |
| Semi-skilled manual workers | 3.2 | 3.2 | 4.0 | 79.4 | 80.1 |
| Other sales and service personnel | 4.4 | 4.1 | 5.0 | 87.3 | 81.6 |
| Other manual workers | 5.8 | 5.6 | 9.5 | 60.4 | 58.5 |
| Total | 2.9 | 2.9 | 3.9 | 74.7 | 75.1 |
* Source: Statistics Canada, 2016 Census.
| Employment equity occupational group | 2018 representation | 2019 representation | 2016 availability (sector)* | 2018 attainment rate | 2019 attainment rate |
|---|---|---|---|---|---|
| Senior managers | 0.9 | 1.4 | 6.4 | 14.8 | 21.2 |
| Middle and other managers | 1.6 | 1.8 | 2.6 | 61.1 | 67.9 |
| Professionals | 2.1 | 2.2 | 2.4 | 89.9 | 91.1 |
| Semi-professionals and technicians | 4.5 | 4.7 | 4.2 | 106.3 | 111.3 |
| Supervisors | 2.8 | 2.3 | 4.5 | 60.9 | 50.0 |
| Supervisors: crafts and trades | 3.8 | 3.9 | 5.2 | 73.7 | 74.9 |
| Administrative and senior clerical personnel | 3.6 | 3.1 | 5.0 | 73.3 | 63.1 |
| Skilled sales and service personnel | 3.0 | 3.6 | 4.4 | 68.4 | 82.5 |
| Skilled crafts and trades workers | 6.3 | 7.0 | 5.5 | 113.0 | 125.6 |
| Clerical personnel | 4.1 | 4.7 | 6.3 | 65.4 | 74.7 |
| Intermediate sales and service personnel | 2.2 | 2.0 | 5.0 | 44.4 | 40.0 |
| Semi-skilled manual workers | 7.3 | 8.3 | 5.7 | 127.5 | 145.2 |
| Other sales and service personnel | 3.9 | 2.2 | 8.4 | 45.8 | 26.6 |
| Other manual workers | 6.2 | 6.8 | 8.7 | 71.6 | 78.2 |
| Total | 3.6 | 3.8 | 4.6 | 78.7 | 82.9 |
* Source: Statistics Canada, 2016 Census.
| Employment equity occupational group | 2018 representation | 2019 representation | 2016 availability (sector)* | 2018 attainment rate | 2019 attainment rate |
|---|---|---|---|---|---|
| Senior managers | 16.4 | 18.5 | 15.3 | 107.3 | 120.5 |
| Middle and other managers | 31.0 | 31.8 | 27.8 | 111.4 | 114.6 |
| Professionals | 36.6 | 37.2 | 34.9 | 104.9 | 106.5 |
| Semi-professionals and technicians | 38.2 | 40.9 | 35.7 | 106.8 | 114.3 |
| Supervisors | 32.7 | 31.9 | 25.1 | 130.5 | 127.0 |
| Supervisors: crafts and trades | 61.5 | 66.7 | 13.5 | 457.1 | 495.2 |
| Administrative and senior clerical personnel | 37.6 | 36.8 | 24.3 | 155.1 | 151.5 |
| Skilled sales and service personnel | 34.5 | 34.6 | 32.9 | 105.1 | 105.4 |
| Skilled crafts and trades workers | 7.1 | 6.3 | 13.2 | 54.0 | 47.2 |
| Clerical personnel | 39.8 | 39.9 | 33.6 | 118.3 | 118.5 |
| Intermediate sales and service personnel | 26.6 | 27.5 | 32.2 | 82.8 | 85.4 |
| Semi-skilled manual workers | 62.2 | 58.1 | 26.5 | 234.5 | 218.9 |
| Other sales and service personnel | 39.5 | 38.9 | 25.5 | 154.6 | 152.4 |
| Other manual workers | 0.0 | 0.0 | 25.7 | 0.0 | 0.0 |
| Total | 33.9 | 34.4 | 31.2 | 108.5 | 110.2 |
* Source: Statistics Canada, 2016 Census.
| Employment equity occupational group | 2018 representation | 2019 representation | 2016 availability (sector)* | 2018 attainment rate | 2019 attainment rate |
|---|---|---|---|---|---|
| Senior managers | 10.2 | 10.1 | 11.7 | 87.6 | 86.3 |
| Middle and other managers | 23.4 | 23.7 | 21.3 | 109.9 | 111.2 |
| Professionals | 26.7 | 27.0 | 27.2 | 98.3 | 99.3 |
| Semi-professionals and technicians | 18.5 | 18.3 | 21.4 | 86.1 | 85.5 |
| Supervisors | 22.6 | 23.1 | 27.5 | 82.3 | 84.1 |
| Supervisors: crafts and trades | 16.2 | 17.4 | 20.3 | 79.9 | 85.8 |
| Administrative and senior clerical personnel | 22.4 | 22.6 | 20.4 | 109.9 | 110.7 |
| Skilled sales and service personnel | 24.3 | 22.8 | 32.2 | 75.5 | 70.8 |
| Skilled crafts and trades workers | 17.4 | 18.2 | 20.6 | 84.7 | 88.6 |
| Clerical personnel | 22.5 | 23.2 | 20.9 | 107.3 | 111.0 |
| Intermediate sales and service personnel | 28.5 | 28.4 | 36.3 | 78.6 | 78.3 |
| Semi-skilled manual workers | 28.6 | 29.5 | 28.1 | 101.8 | 105.0 |
| Other sales and service personnel | 20.9 | 14.0 | 28.7 | 72.9 | 48.9 |
| Other manual workers | 11.1 | 0.0 | 20.9 | 53.1 | 0.0 |
| Total | 23.5 | 23.8 | 24.8 | 94.8 | 95.8 |
* Source: Statistics Canada, 2016 Census.
| Employment equity occupational group | 2018 representation | 2019 representation | 2016 availability (sector)* | 2018 attainment rate | 2019 attainment rate |
|---|---|---|---|---|---|
| Senior managers | 7.1 | 7.4 | 10.8 | 66.0 | 68.4 |
| Middle and other managers | 14.2 | 15.1 | 19.0 | 75.0 | 79.6 |
| Professionals | 25.9 | 26.5 | 31.3 | 82.5 | 84.6 |
| Semi-professionals and technicians | 9.4 | 9.9 | 12.9 | 72.9 | 76.8 |
| Supervisors | 13.6 | 13.9 | 22.8 | 59.8 | 61.2 |
| Supervisors: crafts and trades | 11.5 | 11.4 | 13.9 | 82.8 | 81.9 |
| Administrative and senior clerical personnel | 19.5 | 20.2 | 19.1 | 101.8 | 105.7 |
| Skilled sales and service personnel | 6.6 | 6.5 | 23.2 | 28.2 | 28.1 |
| Skilled crafts and trades workers | 13.7 | 14.2 | 13.8 | 99.2 | 102.5 |
| Clerical personnel | 20.3 | 21.6 | 24.7 | 82.2 | 87.3 |
| Intermediate sales and service personnel | 23.6 | 24.7 | 28.3 | 83.4 | 87.3 |
| Semi-skilled manual workers | 18.1 | 18.4 | 28.6 | 63.1 | 64.3 |
| Other sales and service personnel | 14.0 | 16.5 | 31.2 | 44.9 | 52.9 |
| Other manual workers | 13.1 | 12.7 | 20.6 | 63.7 | 61.7 |
| Total | 17.7 | 18.4 | 25.1 | 70.6 | 73.2 |
* Source: Statistics Canada, 2016 Census.
| Employment equity occupational group | 2018 representation | 2019 representation | 2016 availability (sector)* | 2018 attainment rate | 2019 attainment rate |
|---|---|---|---|---|---|
| Senior managers | 7.6 | 7.9 | 10.7 | 70.7 | 73.4 |
| Middle and other managers | 12.3 | 12.7 | 9.6 | 128.8 | 132.6 |
| Professionals | 22.4 | 22.8 | 23.6 | 94.9 | 96.6 |
| Semi-professionals and technicians | 10.3 | 10.5 | 16.0 | 64.6 | 65.6 |
| Supervisors | 10.1 | 10.1 | 17.5 | 57.9 | 57.8 |
| Supervisors: crafts and trades | 6.5 | 7.0 | 7.6 | 86.0 | 92.5 |
| Administrative and senior clerical personnel | 13.6 | 14.3 | 15.0 | 90.8 | 95.8 |
| Skilled sales and service personnel | 11.7 | 10.8 | 17.7 | 66.0 | 60.8 |
| Skilled crafts and trades workers | 11.1 | 12.7 | 9.2 | 119.7 | 137.6 |
| Clerical personnel | 14.5 | 15.2 | 17.9 | 81.1 | 85.0 |
| Intermediate sales and service personnel | 23.2 | 24.0 | 25.2 | 91.9 | 95.1 |
| Semi-skilled manual workers | 9.4 | 10.0 | 15.0 | 62.3 | 66.4 |
| Other sales and service personnel | 15.6 | 14.5 | 15.4 | 101.5 | 94.5 |
| Other manual workers | 14.0 | 9.7 | 16.2 | 86.3 | 59.6 |
| Total | 15.9 | 16.2 | 16.0 | 99.1 | 101.3 |
* Source: Statistics Canada, 2016 Census.
| Employment equity occupational group | 2018 representation | 2019 representation | 2016 availability (Canadian)* | 2018 attainment rate | 2019 attainment rate |
|---|---|---|---|---|---|
| Senior managers | 28.0 | 28.7 | 27.6 | 101.3 | 104.0 |
| Middle and other managers | 41.4 | 42.4 | 39.4 | 105.0 | 107.6 |
| Professionals | 44.0 | 43.9 | 55.0 | 79.9 | 79.8 |
| Semi-professionals and technicians | 19.3 | 19.1 | 53.5 | 36.1 | 35.7 |
| Supervisors | 58.1 | 58.7 | 55.5 | 104.7 | 105.8 |
| Supervisors: crafts and trades | 8.4 | 9.3 | 10.8 | 78.5 | 86.1 |
| Administrative and senior clerical personnel | 73.1 | 72.7 | 82.4 | 88.7 | 88.2 |
| Skilled sales and service personnel | 53.1 | 53.0 | 49.7 | 106.9 | 106.5 |
| Skilled crafts and trades workers | 4.8 | 4.7 | 4.0 | 120.0 | 117.7 |
| Clerical personnel | 55.4 | 53.5 | 68.7 | 80.6 | 77.8 |
| Intermediate sales and service personnel | 62.2 | 62.4 | 68.4 | 90.9 | 91.3 |
| Semi-skilled manual workers | 11.6 | 11.8 | 17.1 | 68.1 | 69.0 |
| Other sales and service personnel | 40.8 | 39.2 | 56.3 | 72.5 | 69.6 |
| Other manual workers | 9.8 | 12.3 | 22.1 | 44.5 | 55.6 |
| Total | 39.4 | 39.5 | 48.2 | 81.8 | 81.9 |
* Source: Statistics Canada, 2016 Census.
| Employment equity occupational group | 2018 representation | 2019 representation | 2016 availability (Canadian)* | 2018 attainment rate | 2019 attainment rate |
|---|---|---|---|---|---|
| Senior managers | 1.0 | 1.1 | 3.2 | 29.8 | 35.0 |
| Middle and other managers | 1.3 | 1.3 | 2.7 | 49.9 | 48.8 |
| Professionals | 1.2 | 1.3 | 2.4 | 52.8 | 54.4 |
| Semi-professionals and technicians | 2.5 | 2.6 | 4.2 | 60.8 | 63.4 |
| Supervisors | 2.4 | 2.3 | 3.9 | 62.6 | 58.7 |
| Supervisors: crafts and trades | 3.6 | 3.6 | 4.3 | 83.4 | 82.1 |
| Administrative and senior clerical personnel | 1.8 | 1.8 | 3.5 | 52.2 | 52.4 |
| Skilled sales and service personnel | 1.6 | 1.6 | 3.7 | 42.4 | 43.0 |
| Skilled crafts and trades workers | 3.9 | 4.0 | 5.2 | 74.4 | 76.7 |
| Clerical personnel | 2.1 | 2.2 | 4.2 | 50.7 | 53.2 |
| Intermediate sales and service personnel | 2.4 | 2.4 | 4.5 | 54.0 | 54.4 |
| Semi-skilled manual workers | 3.3 | 3.4 | 4.8 | 69.9 | 71.2 |
| Other sales and service personnel | 4.1 | 3.5 | 5.8 | 71.3 | 59.5 |
| Other manual workers | 5.9 | 6.0 | 6.8 | 86.5 | 88.1 |
| Total | 2.3 | 2.3 | 4.0 | 57.1 | 57.8 |
* Source: Statistics Canada, 2016 Census.
| Employment equity occupational group | 2018 representation | 2019 representation | 2017 availability (Canadian)* | 2018 attainment rate | 2019 attainment rate |
|---|---|---|---|---|---|
| Senior managers | 3.2 | 3.2 | 5.0 | 64.6 | 63.9 |
| Middle and other managers | 3.6 | 3.7 | 5.0 | 72.4 | 73.3 |
| Professionals | 3.6 | 3.8 | 8.9 | 40.6 | 42.1 |
| Semi-professionals and technicians | 2.5 | 2.5 | 7.6 | 33.4 | 33.1 |
| Supervisors | 4.0 | 4.0 | 27.5 | 14.6 | 14.7 |
| Supervisors: crafts and trades | 2.1 | 2.3 | 10.1 | 20.8 | 23.3 |
| Administrative and senior clerical personnel | 4.1 | 4.5 | 10.0 | 41.0 | 44.4 |
| Skilled sales and service personnel | 4.0 | 3.9 | 8.0 | 49.3 | 48.2 |
| Skilled crafts and trades workers | 2.3 | 2.3 | 7.8 | 29.3 | 29.8 |
| Clerical personnel | 4.6 | 4.6 | 9.3 | 49.2 | 49.4 |
| Intermediate sales and service personnel | 3.5 | 3.5 | 10.8 | 32.7 | 32.7 |
| Semi-skilled manual workers | 2.6 | 2.5 | 10.3 | 25.1 | 24.4 |
| Other sales and service personnel | 4.1 | 4.0 | 10.7 | 38.5 | 37.8 |
| Other manual workers | 2.6 | 2.4 | 6.8 | 38.2 | 35.6 |
| Total | 3.4 | 3.5 | 9.1 | 37.5 | 37.9 |
* Source: Statistics Canada, 2017 Canadian Survey on Disability.
| Employment equity occupational group | 2018 representation | 2019 representation | 2016 availability (Canadian)* | 2018 attainment rate | 2019 attainment rate |
|---|---|---|---|---|---|
| Senior managers | 11.0 | 11.9 | 11.5 | 95.5 | 103.5 |
| Middle and other managers | 25.4 | 26.3 | 17.6 | 144.6 | 149.5 |
| Professionals | 32.4 | 33.0 | 23.2 | 139.4 | 142.2 |
| Semi-professionals and technicians | 14.0 | 14.0 | 19.1 | 73.5 | 73.2 |
| Supervisors | 21.1 | 21.7 | 24.0 | 87.9 | 90.2 |
| Supervisors: crafts and trades | 10.9 | 11.1 | 11.1 | 98.1 | 99.5 |
| Administrative and senior clerical personnel | 28.3 | 27.4 | 16.4 | 173.0 | 167.7 |
| Skilled sales and service personnel | 30.7 | 30.7 | 27.7 | 111.1 | 110.9 |
| Skilled crafts and trades workers | 14.7 | 15.3 | 12.0 | 122.4 | 127.9 |
| Clerical personnel | 25.6 | 26.4 | 21.9 | 116.9 | 120.1 |
| Intermediate sales and service personnel | 25.6 | 26.3 | 25.4 | 101.0 | 103.6 |
| Semi-skilled manual workers | 17.9 | 18.2 | 22.4 | 79.7 | 81.3 |
| Other sales and service personnel | 15.1 | 16.2 | 26.5 | 56.8 | 61.0 |
| Other manual workers | 13.4 | 11.7 | 21.0 | 63.7 | 55.7 |
| Total | 23.8 | 24.4 | 21.3 | 111.8 | 114.5 |
* Source: Statistics Canada, 2016 Census.
| Employment equity occupational group | 2018 women distribution | 2018 men distribution | 2019 women distribution | 2019 men distribution |
|---|---|---|---|---|
| Senior managers | 0.6 | 1.0 | 0.6 | 1.0 |
| Middle and other managers | 11.3 | 10.5 | 12.2 | 10.9 |
| Professionals | 21.4 | 17.8 | 21.9 | 18.3 |
| Semi-professionals and technicians | 3.2 | 8.7 | 3.1 | 8.6 |
| Supervisors | 4.6 | 2.2 | 4.9 | 2.2 |
| Supervisors: crafts and trades | 0.3 | 2.2 | 0.3 | 2.2 |
| Administrative and senior clerical personnel | 5.4 | 1.3 | 4.9 | 1.2 |
| Skilled sales and service personnel | 4.4 | 2.5 | 4.3 | 2.5 |
| Skilled crafts and trades workers | 1.0 | 13.0 | 1.0 | 12.6 |
| Clerical personnel | 18.0 | 9.5 | 17.8 | 10.1 |
| Intermediate sales and service personnel | 25.0 | 9.9 | 24.2 | 9.5 |
| Semi-skilled manual workers | 4.0 | 19.9 | 3.9 | 19.1 |
| Other sales and service personnel | 0.4 | 0.4 | 0.4 | 0.4 |
| Other manual workers | 0.2 | 1.1 | 0.3 | 1.4 |
| Total | 100.0 | 100.0 | 100.0 | 100.0 |
| Employment equity occupational group | 2018 Aboriginal peoples distribution | 2018 non-Aboriginal peoples distribution | 2019 Aboriginal peoples distribution | 2019 non-Aboriginal peoples distribution |
|---|---|---|---|---|
| Senior managers | 0.4 | 0.9 | 0.4 | 0.9 |
| Middle and other managers | 6.3 | 10.9 | 6.4 | 11.5 |
| Professionals | 10.5 | 19.4 | 11.0 | 19.9 |
| Semi-professionals and technicians | 7.2 | 6.5 | 7.3 | 6.4 |
| Supervisors | 3.3 | 3.1 | 3.2 | 3.3 |
| Supervisors: crafts and trades | 2.3 | 1.5 | 2.3 | 1.5 |
| Administrative and senior clerical personnel | 2.3 | 2.9 | 2.1 | 2.7 |
| Skilled sales and service personnel | 2.3 | 3.3 | 2.2 | 3.2 |
| Skilled crafts and trades workers | 14.1 | 8.2 | 13.9 | 7.9 |
| Clerical personnel | 11.9 | 12.9 | 12.6 | 13.1 |
| Intermediate sales and service personnel | 16.8 | 15.9 | 16.1 | 15.3 |
| Semi-skilled manual workers | 19.9 | 13.5 | 19.3 | 12.9 |
| Other sales and service personnel | 0.8 | 0.4 | 0.7 | 0.4 |
| Other manual workers | 1.9 | 0.7 | 2.4 | 0.9 |
| Total | 100.0 | 100.0 | 100.0 | 100.0 |
| Employment equity occupational group | 2018 persons with disabilities distribution | 2018 persons without disabilities distribution | 2019 persons with disabilities distribution | 2019 persons without disabilities distribution |
|---|---|---|---|---|
| Senior managers | 0.8 | 0.9 | 0.8 | 0.9 |
| Middle and other managers | 11.4 | 10.8 | 12.1 | 11.4 |
| Professionals | 20.5 | 19.2 | 21.5 | 19.7 |
| Semi-professionals and technicians | 4.8 | 6.6 | 4.7 | 6.5 |
| Supervisors | 3.7 | 3.1 | 3.8 | 3.3 |
| Supervisors: crafts and trades | 0.9 | 1.5 | 1.0 | 1.5 |
| Administrative and senior clerical personnel | 3.5 | 2.9 | 3.4 | 2.6 |
| Skilled sales and service personnel | 3.8 | 3.2 | 3.6 | 3.2 |
| Skilled crafts and trades workers | 5.6 | 8.4 | 5.4 | 8.1 |
| Clerical personnel | 17.2 | 12.7 | 17.4 | 12.9 |
| Intermediate sales and service personnel | 16.4 | 15.9 | 15.6 | 15.3 |
| Semi-skilled manual workers | 10.3 | 13.7 | 9.5 | 13.2 |
| Other sales and service personnel | 0.5 | 0.4 | 0.5 | 0.4 |
| Other manual workers | 0.6 | 0.7 | 0.7 | 1.0 |
| Total | 100.0 | 100.0 | 100.0 | 100.0 |
| Employment equity occupational group | 2018 members of visible minorities distribution | 2018 non-members of visible minorities distribution | 2019 members of visible minorities distribution | 2019 non-members of visible minorities distribution |
|---|---|---|---|---|
| Senior managers | 0.4 | 1.0 | 0.4 | 1.0 |
| Middle and other managers | 11.6 | 10.6 | 12.3 | 11.1 |
| Professionals | 26.1 | 17.1 | 26.7 | 17.5 |
| Semi-professionals and technicians | 3.8 | 7.3 | 3.7 | 7.3 |
| Supervisors | 2.8 | 3.3 | 2.9 | 3.4 |
| Supervisors: crafts and trades | 0.7 | 1.7 | 0.7 | 1.7 |
| Administrative and senior clerical personnel | 3.5 | 2.7 | 3.0 | 2.6 |
| Skilled sales and service personnel | 4.2 | 3.0 | 4.0 | 2.9 |
| Skilled crafts and trades workers | 5.1 | 9.3 | 5.0 | 9.0 |
| Clerical personnel | 13.8 | 12.5 | 14.2 | 12.8 |
| Intermediate sales and service personnel | 17.1 | 15.5 | 16.6 | 14.9 |
| Semi-skilled manual workers | 10.2 | 14.7 | 9.8 | 14.1 |
| Other sales and service personnel | 0.3 | 0.5 | 0.3 | 0.5 |
| Other manual workers | 0.4 | 0.8 | 0.5 | 1.1 |
| Total | 100.0 | 100.0 | 100.0 | 100.0 |
| Designated groups | 2018 number of employees | 2019 number of employees | 2018 number of hires | 2019 number of hires | 2018 number of promotions | 2019 number of promotions | 2018 number of terminations | 2019 number of terminations | 2018 net effect* | 2019 net effect* |
|---|---|---|---|---|---|---|---|---|---|---|
| Women | 138,586 | 142,657 | 22,763 | 21,891 | 21,046 | 17,866 | 22,652 | 20,310 | 111 | 1,581 |
| Aboriginal peoples | 3,002 | 3,145 | 465 | 512 | 500 | 372 | 559 | 486 | -94 | 26 |
| Persons with disabilities | 12,199 | 12,520 | 1,557 | 1,402 | 1,475 | 1,335 | 1,917 | 1,844 | -360 | -442 |
| Members of visible minorities | 82,920 | 87,454 | 14,603 | 13,382 | 13,560 | 11,878 | 11,671 | 12,263 | 2,932 | 1,119 |
| All employees | 244,910 | 254,434 | 45,721 | 42,895 | 37,658 | 32,142 | 40,533 | 37,883 | 5,188 | 5,012 |
* The number of employees hired reduced by those terminated.
** The number of employees covers permanent full-time, permanent part-time and temporary employees. The data on hires, promotions, terminations and net effect covers only permanent full-time and permanent part-time employees.
| Designated groups | 2018 representation | 2019 representation | 2018 share of hires | 2019 share of hires | 2018 share of promotions | 2019 share of promotions | 2018 share of terminations | 2019 share of terminations |
|---|---|---|---|---|---|---|---|---|
| Women | 56.6 | 56.1 | 49.8 | 51.0 | 55.9 | 55.6 | 55.9 | 53.6 |
| Aboriginal peoples | 1.2 | 1.2 | 1.0 | 1.2 | 1.3 | 1.2 | 1.4 | 1.3 |
| Persons with disabilities | 5.0 | 4.9 | 3.4 | 3.3 | 3.9 | 4.2 | 4.7 | 4.9 |
| Members of visible minorities | 33.9 | 34.4 | 31.9 | 31.2 | 36.0 | 37.0 | 28.8 | 32.4 |
| All employees | 100.0 | 100.0 | 100.0 | 100.0 | 100.0 | 100.0 | 100.0 | 100.0 |
* The data on the representation of designated group employees covers permanent full-time, permanent part-time and temporary employees. The data on the shares of hires, promotions and terminations covers only permanent full-time and permanent part-time employees.
| Designated groups | 2018 number of employees | 2019 number of employees | 2018 number of hires | 2019 number of hires | 2018 number of promotions | 2019 number of promotions | 2018 number of terminations | 2019 number of terminations | 2018 net effect* | 2019 net effect* |
|---|---|---|---|---|---|---|---|---|---|---|
| Women | 45,662 | 45,204 | 7,193 | 6,523 | 2,955 | 2,560 | 9,040 | 7,176 | -1,847 | -653 |
| Aboriginal peoples | 2,776 | 2,786 | 456 | 289 | 161 | 139 | 624 | 397 | -168 | -108 |
| Persons with disabilities | 4,484 | 4,753 | 571 | 503 | 252 | 205 | 849 | 673 | -278 | -170 |
| Members of visible minorities | 30,877 | 30,738 | 5,335 | 4,614 | 2,127 | 1,828 | 5,884 | 5,000 | -549 | -386 |
| All employees | 131,305 | 129,398 | 20,032 | 17,737 | 7,783 | 6,406 | 24,226 | 20,270 | -4,194 | -2,533 |
* The number of employees hired reduced by those terminated.
** The number of employees covers permanent full-time, permanent part-time and temporary employees. The data on the hires, promotions, terminations and net effect covers only permanent full-time and permanent part-time employees.
| Designated groups | 2018 representation | 2019 representation | 2018 share of hires | 2019 share of hires | 2018 share of promotions | 2019 share of promotions | 2018 share of terminations | 2019 share of terminations |
|---|---|---|---|---|---|---|---|---|
| Women | 34.8 | 34.9 | 35.9 | 36.8 | 38.0 | 40.0 | 37.3 | 35.4 |
| Aboriginal peoples | 2.1 | 2.2 | 2.3 | 1.6 | 2.1 | 2.2 | 2.6 | 2.0 |
| Persons with disabilities | 3.4 | 3.7 | 2.9 | 2.8 | 3.2 | 3.2 | 3.5 | 3.3 |
| Members of visible minorities | 23.5 | 23.8 | 26.6 | 26.0 | 27.3 | 28.5 | 24.3 | 24.7 |
| All employees | 100.0 | 100.0 | 100.0 | 100.0 | 100.0 | 100.0 | 100.0 | 100.0 |
* The data on the representation of designated group employees covers permanent full-time, permanent part-time and temporary employees. The data on the shares of hires, promotions and terminations covers only permanent full-time and permanent part-time employees.
| Designated groups | 2018 number of employees | 2019 number of employees | 2018 number of hires | 2019 number of hires | 2018 number of promotions | 2019 number of promotions | 2018 number of terminations | 2019 number of terminations | 2018 net effect* | 2019 net effect* |
|---|---|---|---|---|---|---|---|---|---|---|
| Women | 96,736 | 99,069 | 18,739 | 18,411 | 3,716 | 3,802 | 16,467 | 17,331 | 2,272 | 1,080 |
| Aboriginal peoples | 9,375 | 9,649 | 2,556 | 2,215 | 343 | 316 | 2,155 | 2,259 | 401 | -44 |
| Persons with disabilities | 7,895 | 8,113 | 1,278 | 1,381 | 287 | 269 | 1,469 | 1,629 | -191 | -248 |
| Members of visible minorities | 56,997 | 60,528 | 17,694 | 17,804 | 2,397 | 2,439 | 13,249 | 14,928 | 4,445 | 2,876 |
| All employees | 321,707 | 329,240 | 74,744 | 70,878 | 12,474 | 12,556 | 65,584 | 69,712 | 9,160 | 1,166 |
* The number of employees hired reduced by those terminated.
** The number of employees covers permanent full-time, permanent part-time and temporary employees. The data on the hires, promotions, terminations and net effect covers only permanent full-time and permanent part-time employees.
| Designated groups | 2018 representation | 2019 representation | 2018 share of hires | 2019 share of hires | 2018 share of promotions | 2019 share of promotions | 2018 share of terminations | 2019 share of terminations |
|---|---|---|---|---|---|---|---|---|
| Women | 30.1 | 30.1 | 25.1 | 26.0 | 29.8 | 30.3 | 25.1 | 24.9 |
| Aboriginal peoples | 2.9 | 2.9 | 3.4 | 3.1 | 2.7 | 2.5 | 3.3 | 3.2 |
| Persons with disabilities | 2.5 | 2.5 | 1.7 | 1.9 | 2.3 | 2.1 | 2.2 | 2.3 |
| Members of visible minorities | 17.7 | 18.4 | 23.7 | 25.1 | 19.2 | 19.4 | 20.2 | 21.4 |
| All employees | 100.0 | 100.0 | 100.0 | 100.0 | 100.0 | 100.0 | 100.0 | 100.0 |
* The data on the representation of designated group employees covers permanent full-time, permanent part-time and temporary employees. The data on the shares of hires, promotions and terminations covers only permanent full-time and permanent part-time employees.
| Designated groups | 2018 number of employees | 2019 number of employees | 2018 number of hires | 2019 number of hires | 2018 number of promotions | 2019 number of promotions | 2018 number of terminations | 2019 number of terminations | 2018 net effect* | 2019 net effect* |
|---|---|---|---|---|---|---|---|---|---|---|
| Women | 17,403 | 17,965 | 2,698 | 2,783 | 869 | 848 | 2,289 | 2,830 | 409 | -47 |
| Aboriginal peoples | 2,117 | 2,263 | 293 | 391 | 129 | 82 | 527 | 342 | -234 | 49 |
| Persons with disabilities | 1,201 | 1,287 | 88 | 116 | 37 | 53 | 159 | 179 | -71 | -63 |
| Members of visible minorities | 9,274 | 9,615 | 2,072 | 2,223 | 322 | 363 | 1,675 | 1,826 | 397 | 397 |
| All employees | 58,492 | 59,330 | 8,827 | 9,530 | 2,690 | 2,517 | 8,448 | 9,921 | 379 | -391 |
* The number of employees hired reduced by those terminated.
** The number of employees covers permanent full-time, permanent part-time and temporary employees. The data on hires, promotions, terminations and net effect covers only permanent full-time and permanent part-time employees.
| Designated groups | 2018 representation | 2019 representation | 2018 share of hires | 2019 share of hires | 2018 share of promotions | 2019 share of promotions | 2018 share of terminations | 2019 share of terminations |
|---|---|---|---|---|---|---|---|---|
| Women | 29.8 | 30.3 | 30.6 | 29.2 | 32.3 | 33.7 | 27.1 | 28.5 |
| Aboriginal peoples | 3.6 | 3.8 | 3.3 | 4.1 | 4.8 | 3.3 | 6.2 | 3.4 |
| Persons with disabilities | 2.1 | 2.2 | 1.0 | 1.2 | 1.4 | 2.1 | 1.9 | 1.8 |
| Members of visible minorities | 15.9 | 16.2 | 23.5 | 23.3 | 12.0 | 14.4 | 19.8 | 18.4 |
| All employees | 100.0 | 100.0 | 100.0 | 100.0 | 100.0 | 100.0 | 100.0 | 100.0 |
* The data on the representation of designated group employees covers permanent full-time, permanent part-time and temporary employees. The data on the shares of hires, promotions and terminations covers only permanent full-time and permanent part-time employees.
| Designated groups | 2018 number of employees | 2019 number of employees | 2018 number of hires | 2019 number of hires | 2018 number of promotions | 2019 number of promotions | 2018 number of terminations | 2019 number of terminations | 2018 net effect* | 2019 net effect* |
|---|---|---|---|---|---|---|---|---|---|---|
| Women | 298,387 | 304,895 | 51,393 | 49,608 | 28,586 | 25,076 | 50,448 | 47,647 | 945 | 1,961 |
| Aboriginal peoples | 17,270 | 17,843 | 3,770 | 3,407 | 1,133 | 909 | 3,865 | 3,484 | -95 | -77 |
| Persons with disabilities | 25,779 | 26,673 | 3,494 | 3,402 | 2,051 | 1,862 | 4,394 | 4,325 | -900 | -923 |
| Members of visible minorities | 180,068 | 188,335 | 39,704 | 38,023 | 18,406 | 16,508 | 32,479 | 34,017 | 7,225 | 4,006 |
| All employees | 756,414 | 772,402 | 149,324 | 141,040 | 60,605 | 53,621 | 138,791 | 137,786 | 10,533 | 3,254 |
* The number of employees hired reduced by those terminated.
** The number of employees covers permanent full-time, permanent part-time and temporary employees. The data on hires, promotions, terminations and net effect covers only permanent full-time and permanent part-time employees.
| Designated groups | 2018 representation | 2019 representation | 2018 share of hires | 2019 share of hires | 2018 share of promotions | 2019 share of promotions | 2018 share of terminations | 2019 share of terminations |
|---|---|---|---|---|---|---|---|---|
| Women | 39.4 | 39.5 | 34.4 | 35.2 | 47.2 | 46.8 | 36.3 | 34.6 |
| Aboriginal peoples | 2.3 | 2.3 | 2.5 | 2.4 | 1.9 | 1.7 | 2.8 | 2.5 |
| Persons with disabilities | 3.4 | 3.5 | 2.3 | 2.4 | 3.4 | 3.5 | 3.2 | 3.1 |
| Members of visible minorities | 23.8 | 24.4 | 26.6 | 27.0 | 30.4 | 30.8 | 23.4 | 24.7 |
| All employees | 100.0 | 100.0 | 100.0 | 100.0 | 100.0 | 100.0 | 100.0 | 100.0 |
* The data on the representation of designated group employees covers permanent full-time, permanent part-time and temporary employees. The data on the shares of hires, promotions and terminations covers only permanent full-time and permanent part-time employees.
| Salary range (in dollars) |
Number of all employees | Number of men | Representation of men (by percentage) | Number of Women | Representation of women (by percentage) |
|---|---|---|---|---|---|
| Under 15,000 | 4,269 | 3,116 | 73.0 | 1,153 | 27.0 |
| 15,000 to 19,999 | 1,144 | 801 | 70.0 | 343 | 30.0 |
| 20,000 to 24,999 | 3,620 | 1,679 | 46.4 | 1,941 | 53.6 |
| 25,000 to 29,999 | 9,431 | 4,673 | 49.5 | 4,758 | 50.5 |
| 30,000 to 34,999 | 17,341 | 8,995 | 51.9 | 8,346 | 48.1 |
| 35,000 to 37,499 | 13,962 | 7,068 | 50.6 | 6,894 | 49.4 |
| 37,500 to 39,999 | 16,225 | 8,255 | 50.9 | 7,970 | 49.1 |
| 40,000 to 44,999 | 43,235 | 22,999 | 53.2 | 20,236 | 46.8 |
| 45,000 to 49,999 | 44,802 | 23,669 | 52.8 | 21,133 | 47.2 |
| 50,000 to 59,999 | 107,462 | 61,286 | 57.0 | 46,176 | 43.0 |
| 60,000 to 69,999 | 90,204 | 56,559 | 62.7 | 33,645 | 37.3 |
| 70,000 to 84,999 | 97,363 | 63,354 | 65.1 | 34,009 | 34.9 |
| 85,000 to 99,999 | 70,150 | 47,295 | 67.4 | 22,855 | 32.6 |
| 100,000 and over | 147,400 | 105,948 | 71.9 | 41,452 | 28.1 |
| Total | 666,608 | 415,697 | 62.4 | 250,911 | 37.6 |
| Salary range (in dollars) |
Number of all employees | Number of Aboriginal peoples | Representation of Aboriginal peoples (by percentage) | Number of Aboriginal men | Number of Aboriginal women |
|---|---|---|---|---|---|
| Under 15,000 | 4,269 | 124 | 2.9 | 90 | 34 |
| 15,000 to 19,999 | 1,144 | 55 | 4.8 | 36 | 19 |
| 20,000 to 24,999 | 3,620 | 108 | 3.0 | 70 | 38 |
| 25,000 to 29,999 | 9,431 | 306 | 3.2 | 155 | 151 |
| 30,000 to 34,999 | 17,341 | 562 | 3.2 | 304 | 258 |
| 35,000 to 37,499 | 13,962 | 401 | 2.9 | 204 | 197 |
| 37,500 to 39,999 | 16,225 | 417 | 2.6 | 219 | 198 |
| 40,000 to 44,999 | 43,235 | 944 | 2.2 | 519 | 425 |
| 45,000 to 49,999 | 44,802 | 1,036 | 2.3 | 532 | 504 |
| 50,000 to 59,999 | 107,462 | 2,454 | 2.3 | 1,430 | 1,024 |
| 60,000 to 69,999 | 90,204 | 2,141 | 2.4 | 1,399 | 742 |
| 70,000 to 84,999 | 97,363 | 2,301 | 2.4 | 1,608 | 693 |
| 85,000 to 99,999 | 70,150 | 1,477 | 2.1 | 1,062 | 415 |
| 100,000 and over | 147,400 | 2,735 | 1.9 | 2,129 | 606 |
| Total | 666,608 | 15,061 | 2.3 | 9,757 | 5,304 |
| Salary range (in dollars) |
Number of all employees | Number of persons with disabilities | Representation of persons with disabilities (by percentage) | Number of men with disabilities | Number of women with disabilities |
|---|---|---|---|---|---|
| Under 15,000 | 4,269 | 73 | 1.7 | 48 | 25 |
| 15,000 to 19,999 | 1,144 | 22 | 1.9 | 19 | 3 |
| 20,000 to 24,999 | 3,620 | 54 | 1.5 | 27 | 27 |
| 25,000 to 29,999 | 9,431 | 222 | 2.4 | 118 | 104 |
| 30,000 to 34,999 | 17,341 | 586 | 3.4 | 250 | 336 |
| 35,000 to 37,499 | 13,962 | 580 | 4.2 | 237 | 343 |
| 37,500 to 39,999 | 16,225 | 698 | 4.3 | 295 | 403 |
| 40,000 to 44,999 | 43,235 | 1,837 | 4.2 | 813 | 1,024 |
| 45,000 to 49,999 | 44,802 | 1,673 | 3.7 | 757 | 916 |
| 50,000 to 59,999 | 107,462 | 4,009 | 3.7 | 1,996 | 2,013 |
| 60,000 to 69,999 | 90,204 | 3,127 | 3.5 | 1,701 | 1,426 |
| 70,000 to 84,999 | 97,363 | 3,271 | 3.4 | 1,873 | 1,398 |
| 85,000 to 99,999 | 70,150 | 2,370 | 3.4 | 1,418 | 952 |
| 100,000 and over | 147,400 | 4,385 | 3.0 | 2,807 | 1,578 |
| Total | 666,608 | 22,907 | 3.4 | 12,359 | 10,548 |
| Salary range (in dollars) |
Number of all employees | Number of members of visible minorities | Representation of members of visible minorities (by percentage) | Number of visible minority men | Number of visible minority women |
|---|---|---|---|---|---|
| Under 15,000 | 4,269 | 883 | 20.7 | 641 | 242 |
| 15,000 to 19,999 | 1,144 | 254 | 22.2 | 190 | 64 |
| 20,000 to 24,999 | 3,620 | 918 | 25.4 | 386 | 532 |
| 25,000 to 29,999 | 9,431 | 2,664 | 28.2 | 1,302 | 1,362 |
| 30,000 to 34,999 | 17,341 | 4,525 | 26.1 | 2,510 | 2,015 |
| 35,000 to 37,499 | 13,962 | 3,917 | 28.1 | 1,994 | 1,923 |
| 37,500 to 39,999 | 16,225 | 4,521 | 27.9 | 2,300 | 2,221 |
| 40,000 to 44,999 | 43,235 | 12,102 | 28.0 | 6,228 | 5,874 |
| 45,000 to 49,999 | 44,802 | 11,884 | 26.5 | 6,191 | 5,693 |
| 50,000 to 59,999 | 107,462 | 26,522 | 24.7 | 14,803 | 11,719 |
| 60,000 to 69,999 | 90,204 | 20,773 | 23.0 | 12,496 | 8,277 |
| 70,000 to 84,999 | 97,363 | 22,831 | 23.4 | 13,962 | 8,869 |
| 85,000 to 99,999 | 70,150 | 17,564 | 25.0 | 11,166 | 6,398 |
| 100,000 and over | 147,400 | 32,940 | 22.3 | 22,132 | 10,808 |
| Total | 666,608 | 162,298 | 24.3 | 96,301 | 65,997 |
| Salary range (in dollars) |
Number of all employees | Number of men | Representation of men (by percentage) | Number of Women | Representation of women (by percentage) |
|---|---|---|---|---|---|
| Under 5,000 | 2,720 | 1,650 | 60.7 | 1,070 | 39.3 |
| 5,000 to 7,499 | 1,821 | 908 | 49.9 | 913 | 50.1 |
| 7,500 to 9,999 | 1,847 | 950 | 51.4 | 897 | 48.6 |
| 10,000 to 12,499 | 2,521 | 1,316 | 52.2 | 1,205 | 47.8 |
| 12,500 to 14,999 | 10,393 | 5,892 | 56.7 | 4,501 | 43.3 |
| 15,000 to 17,499 | 8,346 | 4,126 | 49.4 | 4,220 | 50.6 |
| 17,500 to 19,999 | 8,625 | 4,290 | 49.7 | 4,335 | 50.3 |
| 20,000 to 22,499 | 8,043 | 3,722 | 46.3 | 4,321 | 53.7 |
| 22,500 to 24,999 | 6,992 | 3,116 | 44.6 | 3,876 | 55.4 |
| 25,000 to 29,999 | 15,999 | 7,485 | 46.8 | 8,514 | 53.2 |
| 30,000 to 34,999 | 10,261 | 4,344 | 42.3 | 5,917 | 57.7 |
| 35,000 to 39,999 | 7,143 | 3,118 | 43.7 | 4,025 | 56.3 |
| 40,000 to 49,999 | 7,552 | 3,479 | 46.1 | 4,073 | 53.9 |
| 50,000 and over | 7,212 | 3,392 | 47.0 | 3,820 | 53.0 |
| Total | 99,475 | 47,788 | 48.0 | 51,687 | 52.0 |
| Salary range (in dollars) |
Number of all employees | Number of Aboriginal peoples | Representation of Aboriginal peoples (by percentage) | Number of Aboriginal men | Number of Aboriginal women |
|---|---|---|---|---|---|
| Under 5,000 | 2,720 | 120 | 4.4 | 74 | 46 |
| 5,000 to 7,499 | 1,821 | 61 | 3.3 | 34 | 27 |
| 7,500 to 9,999 | 1,847 | 70 | 3.8 | 32 | 38 |
| 10,000 to 12,499 | 2,521 | 84 | 3.3 | 50 | 34 |
| 12,500 to 14,999 | 10,393 | 246 | 2.4 | 129 | 117 |
| 15,000 to 17,499 | 8,346 | 240 | 2.9 | 111 | 129 |
| 17,500 to 19,999 | 8,625 | 249 | 2.9 | 109 | 140 |
| 20,000 to 22,499 | 8,043 | 208 | 2.6 | 83 | 125 |
| 22,500 to 24,999 | 6,992 | 178 | 2.5 | 73 | 105 |
| 25,000 to 29,999 | 15,999 | 406 | 2.5 | 172 | 234 |
| 30,000 to 34,999 | 10,261 | 253 | 2.5 | 108 | 145 |
| 35,000 to 39,999 | 7,143 | 177 | 2.5 | 79 | 98 |
| 40,000 to 49,999 | 7,552 | 171 | 2.3 | 67 | 104 |
| 50,000 and over | 7,212 | 180 | 2.5 | 80 | 100 |
| Total | 99,475 | 2,643 | 2.7 | 1,201 | 1,442 |
| Salary range (in dollars) |
Number of all employees | Number of persons with disabilities | Representation of persons with disabilities (by percentage) | Number of men with disabilities | Number of women with disabilities |
|---|---|---|---|---|---|
| Under 5,000 | 2,720 | 81 | 3.0 | 49 | 32 |
| 5,000 to 7,499 | 1,821 | 51 | 2.8 | 26 | 25 |
| 7,500 to 9,999 | 1,847 | 55 | 3.0 | 29 | 26 |
| 10,000 to 12,499 | 2,521 | 116 | 4.6 | 48 | 68 |
| 12,500 to 14,999 | 10,393 | 346 | 3.3 | 171 | 175 |
| 15,000 to 17,499 | 8,346 | 276 | 3.3 | 110 | 166 |
| 17,500 to 19,999 | 8,625 | 278 | 3.2 | 120 | 158 |
| 20,000 to 22,499 | 8,043 | 292 | 3.6 | 95 | 197 |
| 22,500 to 24,999 | 6,992 | 273 | 3.9 | 91 | 182 |
| 25,000 to 29,999 | 15,999 | 689 | 4.3 | 259 | 430 |
| 30,000 to 34,999 | 10,261 | 400 | 3.9 | 141 | 259 |
| 35,000 to 39,999 | 7,143 | 271 | 3.8 | 98 | 173 |
| 40,000 to 49,999 | 7,552 | 265 | 3.5 | 108 | 157 |
| 50,000 and over | 7,212 | 272 | 3.8 | 108 | 164 |
| Total | 99,475 | 3,665 | 3.7 | 1,453 | 2,212 |
| Salary range (in dollars) |
Number of all employees | Number of members of visible minorities | Representation of members of visible minorities (by percentage) | Number of visible minority men | Number of visible minority women |
|---|---|---|---|---|---|
| Under 5,000 | 2,720 | 571 | 21.0 | 404 | 167 |
| 5,000 to 7,499 | 1,821 | 328 | 18.0 | 203 | 125 |
| 7,500 to 9,999 | 1,847 | 359 | 19.4 | 221 | 138 |
| 10,000 to 12,499 | 2,521 | 509 | 20.2 | 287 | 222 |
| 12,500 to 14,999 | 10,393 | 3,279 | 31.6 | 2,078 | 1,201 |
| 15,000 to 17,499 | 8,346 | 2,370 | 28.4 | 1,293 | 1,077 |
| 17,500 to 19,999 | 8,625 | 2,390 | 27.7 | 1,324 | 1,066 |
| 20,000 to 22,499 | 8,043 | 2,198 | 27.3 | 1,124 | 1,074 |
| 22,500 to 24,999 | 6,992 | 1,879 | 26.9 | 974 | 905 |
| 25,000 to 29,999 | 15,999 | 4,579 | 28.6 | 2,664 | 1,915 |
| 30,000 to 34,999 | 10,261 | 2,420 | 23.6 | 1,185 | 1,235 |
| 35,000 to 39,999 | 7,143 | 1,635 | 22.9 | 820 | 815 |
| 40,000 to 49,999 | 7,552 | 1,521 | 20.1 | 852 | 669 |
| 50,000 and over | 7,212 | 1,232 | 17.1 | 712 | 520 |
| Total | 99,475 | 25,270 | 25.4 | 14,141 | 11,129 |
Appendix B: Technical notes
Employers covered under the Employment Equity Act
the Act covers:
- organizations that employ 100 or more employees in the federally regulated private sector, federal Crown corporations, other federal consolidated entities (namely, Canada Pension Plan Investment Board, Public Sector Pension Investment Board and St. Lawrence Seaway Management Corporation) and other federal government business enterprises (namely, Montreal Port Authority, PortsToronto and Vancouver Fraser Port Authority)
- core public administration organizations listed in Schedule I or IV of the Financial Administration Act (FAA) (federal government departments and agencies)
- separate employer organizations in the federal public sector with 100 or more employees, listed in Schedule V of the FAA (separate agencies), and
- other public-sector employer organizations with 100 or more employees, including the Canadian Forces (officers and non-commissioned members in the Regular and Reserve Forces) and the Royal Canadian Mounted Police (regular and civilian members, excluding federal public service employees)
Limitations of the employment equity data
This report provides the most recent information on employment equity data for the federally regulated private sector, with the following limitations:
- to measure progress of the designated groups, their representation (that is, the number of designated group employees divided by the number of all employees) in the federally regulated private sector is compared to their availability in the workforce population. Availability data is obtained from censuses or surveys conducted every 5 years by Statistics Canada. As a result, there is a time lag in measuring representation gaps. The current labour market availability (LMA) is based on the 2016 Census and the 2017 Canadian Survey on Disability. More information on LMA can be found in the 2016 Employment Equity Data Report
- the designated groups data is based on self-identification. Some individuals may not self-identify to their employer and/or to Statistics Canada. Therefore, the data on all designated group members may not be gathered by the employers and Statistics Canada
- data is received annually from employers; however, the number of employers may differ from one year to the next
- the Treasury Board of Canada Secretariat is responsible for reporting on employment equity in the federal departments and agencies that make up the core public administration. This information is available on the Employment Equity in Public Service of Canada website. Other areas of the federal public sector are responsible for preparing their own reports on employment equity, which can be found on their respective websites or obtained upon request directly from the organizations
- federal contractors are not required to report annually
Page details
- Date modified: