
Employment Equity Act: Annual Report 2021
From: Employment and Social Development Canada
Overview of the 2021 Employment Equity Act Report
Read the Overview of the 2021 Employment Equity Act Report for key highlights and initiatives related to employment equity.
On this page
Alternate formats

Large print, braille, MP3 (audio), e-text and DAISY formats are available on demand by ordering online or calling 1 800 O-Canada (1-800-622-6232). If you use a teletypewriter (TTY), call 1-800-926-9105.
-
List of abbreviations
- The Act
- Employment Equity Act
- LMA
- Labour market availability
- FCP
- Federal Contractors Program
- WORBE
- Workplace Opportunities: Removing Barriers to Equity
- FAA
- Financial Administration Act
-
List of tables
- Table 1A: Representation and attainment rate of women in 2019 and 2020 (by percentage)
- Table 1B: Designated group representation and attainment rate in 2019 and 2020 (by percentage)
- Table 2A: Distribution of women and men in permanent full-time employment by salary range as of December 31, 2020 (by percentage)
- Table 2B: Distribution of Aboriginal and non-Aboriginal peoples in permanent full-time employment by salary range as of December 31, 2020 (by percentage)
- Table 2C: Distribution of persons with and without disabilities in permanent full-time employment by salary range as of December 31, 2020 (by percentage)
- Table 2D: Distribution of members and non-members of visible minorities in permanent full-time employment by salary range as of December 31, 2020 (by percentage)
- Table 3A: Number and percentage distribution of employers by sector in 2019 and 2020
- Table 3B: Number and percentage distribution of employees by sector in 2019 and 2020
- Table 3C: Number and percentage distribution of employers by subsectors of the transportation sector in 2019 and 2020
- Table 3D: Number and percentage distribution of employees by subsectors of the transportation sector in 2019 and 2020
- Table 3E: Number and percentage distribution of employers by subsectors of the ‘other’ sector in 2019 and 2020
- Table 3F: Number and percentage distribution of employees by subsectors of the ‘other’ sector in 2019 and 2020
- Table 4A: Representation and attainment rate of designated group members in the banking and financial services sector in 2019 and 2020 (by percentage)
- Table 4B: Representation and attainment rate of designated group members in the communications sector in 2019 and 2020 (by percentage)
- Table 4C: Representation and attainment rate of designated group members in the transportation sector in 2019 and 2020 (by percentage)
- Table 4D.1: Representation and attainment rate of designated group members in the air transportation subsector in 2019 and 2020 (by percentage)
- Table 4D.2: Representation and attainment rate of designated group members in the ground transportation subsector in 2019 and 2020 (by percentage)
- Table 4D.3: Representation and attainment rate of designated group members in the water transportation subsector in 2019 and 2020 (by percentage)
- Table 4E: Representation and attainment rate of designated group members in the ‘other’ sector in 2019 and 2020 (by percentage)
- Table 4F.1: Representation and attainment rate of designated group members in the production industries subsector in 2019 and 2020 (by percentage)
- Table 4F.2: Representation and attainment rate of designated group members in the service industries subsector in 2019 and 2020 (by percentage)
- Table 1.1: Representation and availability of women in the federally-regulated private sector by census metropolitan area, province and territory in 1987, 2019 and 2020 (by percentage)
- Table 1.2: Representation and availability of Aboriginal peoples in the federally-regulated private sector by census metropolitan area, province and territory in 1987, 2019 and 2020 (by percentage)
- Table 1.3: Representation and availability of persons with disabilities in the federally-regulated private sector by census metropolitan area, province and territory in 1987, 2019 and 2020 (by percentage)
- Table 1.4: Representation and availability of members of visible minorities in the federally-regulated private sector by census metropolitan area, province and territory in 1987, 2019 and 2020 (by percentage)
- Table 2.1: Representation and attainment rate (sector availability) of women in the banking and financial services sector by occupational group in 2019 and 2020 (by percentage)
- Table 2.2: Representation and attainment rate (sector availability) of women in the communications sector by occupational group in 2019 and 2020 (by percentage)
- Table 2.3: Representation and attainment rate (sector availability) of women in the transportation sector by occupational group in 2019 and 2020 (by percentage)
- Table 2.4: Representation and attainment rate (sector availability) of women in the ‘other’ sector by occupational group in 2019 and 2020 (by percentage)
- Table 2.5: Representation and attainment rate (sector availability) of Aboriginal peoples in the banking and financial services sector by occupational group in 2019 and 2020 (by percentage)
- Table 2.6: Representation and attainment rate (sector availability) of Aboriginal peoples in the communications sector by occupational group in 2019 and 2020 (by percentage)
- Table 2.7: Representation and attainment rate (sector availability) of Aboriginal peoples in the transportation sector by occupational group in 2019 and 2020 (by percentage)
- Table 2.8: Representation and attainment rate (sector availability) of Aboriginal peoples in the ‘other’ sector by occupational group in 2019 and 2020 (by percentage)
- Table 2.9: Representation and attainment rate (sector availability) of members of visible minorities in the banking and financial services sector by occupational group in 2019 and 2020 (by percentage)
- Table 2.10: Representation and attainment rate (sector availability) of members of visible minorities in the communications sector by occupational group in 2019 and 2020 (by percentage)
- Table 2.11: Representation and attainment rate (sector availability) of members of visible minorities in the transportation sector by occupational group in 2019 and 2020 (by percentage)
- Table 2.12: Representation and attainment rate (sector availability) of members of visible minorities in the ‘other’ sector by occupational group in 2019 and 2020 (by percentage)
- Table 2.13: Representation and attainment rate (Canadian availability) of women in all sectors by occupational group in 2019 and 2020 (by percentage)
- Table 2.14: Representation and attainment rate (Canadian availability) of Aboriginal peoples in all sectors by occupational group in 2019 and 2020 (by percentage)
- Table 2.15: Representation and attainment rate (Canadian availability) of persons with disabilities in all sectors by occupational group in 2019 and 2020 (by percentage)
- Table 2.16: Representation and attainment rate (Canadian availability) of members of visible minorities in all sectors by occupational group in 2019 and 2020 (by percentage)
- Table 3.1: Distribution of women and men in the federally-regulated private sector by occupational group in 2019 and 2020 (by percentage)
- Table 3.2: Distribution of Aboriginal and non-Aboriginal peoples in the federally-regulated private sector by occupational group in 2019 and 2020 (by percentage)
- Table 3.3: Distribution of persons with and without disabilities in the federally-regulated private sector by occupational group in 2019 and 2020 (by percentage)
- Table 3.4: Distribution of members and non-members of visible minorities in the federally-regulated private sector by occupational group in 2019 and 2020 (by percentage)
- Table 4.1: Number, hires, promotions, terminations and net effect of designated group members in the banking and financial services sector in 2019 and 2020
- Table 4.2: Representation and shares of hires, promotions and terminations of designated group members in the banking and financial services sector in 2019 and 2020 (by percentage)
- Table 4.3: Number, hires, promotions, terminations and net effect of designated group members in the communications sector in 2019 and 2020
- Table 4.4: Representation and shares of hires, promotions and terminations of designated group members in the communications sector in 2019 and 2020 (by percentage)
- Table 4.5: Number, hires, promotions, terminations and net effect of designated group members in the transportation sector in 2019 and 2020
- Table 4.6: Representation and shares of hires, promotions and terminations of designated group members in the transportation sector in 2019 and 2020 (by percentage)
- Table 4.7: Number, hires, promotions, terminations and net effect of designated group members in the ‘other’ sector in 2019 and 2020
- Table 4.8: Representation and shares of hires, promotions and terminations of designated group members in the ‘other’ sector in 2019 and 2020 (by percentage)
- Table 4.9: Number, hires, promotions, terminations and net effect of designated group members in all sectors in 2019 and 2020
- Table 4.10: Representation and shares of hires, promotions and terminations of designated group members in all sectors in 2019 and 2020 (by percentage)
- Table 5.1: Number and representation of men and women in permanent full-time employment in the federally-regulated private sector by salary range as of December 31, 2020
- Table 5.2: Number and representation of Aboriginal peoples in permanent full-time employment in the federally-regulated private sector by salary range as of December 31, 2020
- Table 5.3: Number and representation of persons with disabilities in permanent full-time employment in the federally-regulated private sector by salary range as of December 31, 2020
- Table 5.4: Number and representation of members of visible minorities in permanent full-time employment in the federally-regulated private sector by salary range as of December 31, 2020
- Table 6.1: Number and representation of men and women in permanent part-time employment in the federally-regulated private sector by salary range as of December 31, 2020
- Table 6.2: Number and representation of Aboriginal peoples in permanent part-time employment in the federally-regulated private sector by salary range as of December 31, 2020
- Table 6.3: Number and representation of persons with disabilities in permanent part-time employment in the federally-regulated private sector by salary range as of December 31, 2020
- Table 6.4: Number and representation of members of visible minorities in permanent part-time employment in the federally-regulated private sector by salary range as of December 31, 2020
-
List of charts
- Chart 1: Designated group attainment rate (Canadian LMA) from 1987 to 2020 (by percentage)
- Chart 2: Representation and Canadian LMA of women from 1987 to 2020 (by percentage)
- Chart 3: Attainment rate (occupational group’s Canadian LMA) of women in 2019 and 2020 (by percentage)
- Chart 4: Representation and Canadian LMA of Aboriginal peoples from 1987 to 2020 (by percentage)
- Chart 5: Attainment rate (occupational group’s Canadian LMA) of Aboriginal peoples in 2019 and 2020 (by percentage)
- Chart 6: Representation and Canadian LMA of persons with disabilities from 1987 to 2020 (by percentage)
- Chart 7: Attainment rate (occupational group’s Canadian LMA) of persons with disabilities in 2019 and 2020 (by percentage)
- Chart 8: Representation and Canadian LMA of members of visible minorities from 1987 to 2020 (by percentage)
- Chart 9: Attainment rate (occupational group’s Canadian LMA) of members of visible minorities in 2019 and 2020 (by percentage)
2021 message from the Minister
The diversity of our country is what makes it stronger. Canadians understand that representation matters, and that is why, day in and day out, we must strive for inclusion.
The pandemic has shone a light on the essential work done by Canadian workers and businesses. Despite the challenges we have collectively faced, Canadian employers still made the choice to put people first, and to continue their efforts to create workplaces that are representative of our diversity.
We have captured these efforts in the Employment Equity Act: Annual Report 2021. The report provides the most recent data on employment equity in federally regulated private-sector workplaces. I am pleased that there continues to be progress in the representation and participation of the 4 designated groups (women, Indigenous peoples, persons with disabilities and members of visible minorities). However, it is clear that barriers to employment still exist for many Canadians.
Since the introduction of the Employment Equity Act in 1986, economic and social changes have occurred. More importantly, the understanding of diversity and inclusion has evolved. That is why we:
- implemented pay gap reporting measures for the 4 designated groups in the federally-regulated private sector. These measures make Canada the first country to publicly release this level of information
- passed legislation in federally-regulated workplaces:
- to protect workers against all forms of harassment and violence, and
- to ensure women receive equal pay for work of equal value
- established the new $15 per hour federal minimum wage
Furthermore, the Employment Equity Act Review Task Force is conducting an independent review of the Act. By engaging with stakeholders and communities to hear about their lived experiences and needs, the Task Force will make recommendations on how to modernize the Act. I am confident that a renewed Act will contribute to creating a more vibrant and diverse workforce that benefits all Canadians.
Let’s keep working together to give every Canadian a fair and equal chance to reach their full potential. When you include everyone, you get the best, and Canadians and businesses alike succeed.
Minister of Labour
Seamus O’Regan Jr.
Introduction
Under the Employment Equity Act (the Act), the Minister of Labour must prepare and table an annual report to Parliament on the status of employment equity in the federally-regulated private sector.Footnote 1 This report consolidates and highlights the results achieved by employers who employed 100 or more employees during the 2020 calendar year for the 4 designated groups:
- women
- Aboriginal peoples
- persons with disabilities, and
- members of visible minorities
The Act aims to achieve equality in the workplace so that no person shall be denied employment opportunities or benefits for reasons unrelated to ability. In the fulfilment of that goal, the Act seeks to correct the conditions of disadvantage in employment experienced by the 4 designated groups.
The Act supports the principle that employment equity means more than not only treating persons in the same way, but also might require special measures and the accommodation of differences.
In addition to presenting consolidated data from 2020, data from 2019 is provided to allow year-to-year comparison. The individual employers’ statistical forms containing the disaggregated data that is consolidated in this report are made available online.
Federally-regulated private sector
Employers are grouped by sector, based on the classification of the majority of their workforce using the North American Industry Classification System. The federally regulated private-sector workforce comprises 4 industrial sectors:
- banking and financial services: Includes all major Canadian banks and other establishments primarily engaged in financial transactions or in facilitating financial transactions
- communications: Covers businesses that operate radio and television broadcasting studios and facilities, as well as telecommunications services providers
- transportation: Consists of:
- air, rail, bus, water and pipeline transportation industries
- inter-provincial trucking
- postal service
- couriers
- warehousing and storage
- other: Encompasses industries such as:
- nuclear power generation
- metal ore mining
- professional, scientific and technical services
- investigation and security services
- public administration
About the data
Employment equity requires employers to establish working conditions that are free of barriers, and to correct conditions of disadvantage in employment. It also means that achieving equality might require special measures and the accommodation of differences. Employers use their data to assess representation gaps, determine whether there are barriers and identify where progress can be made.
Under the Act, employer reports consist of the following:
- statistical forms containing data on the number of employees and designated groups, their employment status (for example—permanent full-time, permanent part-time and temporary), geography, gender, occupational group and salary range, as well as data on the number of hires, promotions and terminations
- narrative reports providing information on consultations with employee representatives, measures taken to implement employment equity and the results achieved
A key employment equity performance measurement is the attainment rate,Footnote 2 where the representationFootnote 3 of designated groups is compared to their respective labour market availabilityFootnote 4 (LMA). The attainment rate is used to identify gaps between the representation and LMA of a designated group. Where a designated group’s representation is below LMA, the attainment rate is less than 100%. Progress is considered to have been made when the gap between a designated group’s representation and LMA narrows (that is, the attainment rate approaches 100%) or when a group’s representation equals or exceeds LMA (that is, the attainment rate equals or surpasses 100%). A segment of the workforce is considered representative when the representation of a designated group is equal to its LMA.
For this report, LMA is based on Statistics Canada data at the Canadian (national) or sector level. The 2019 and 2020 employer data is compared to the 2016 Census for women, Aboriginal peoples and members of visible minorities. For persons with disabilities, the 2017 Canadian Survey on Disability (CSD) is used.
Section 1: Federally-regulated private sector
The federally-regulated private sector includes approximately 19,000 employers and 1,300,000 employees. For federally-regulated employers with 100 or more employees, in 2020, 575 employers submitted an employment equity annual report, compared to 595 employers who reported for 2019. Together, the 2020 reports covered 739,067 employees across Canada (a drop of 4.9% from the 776,997 employees reported for 2019), which represents approximately 3.6%Footnote 5 of the Canadian workforce.
Data from all employers (Table 1A) shows that the representation of women decreased from 39.4% in 2019 to 39.0% in 2020, and the attainment rate based on the Canadian LMA decreased from 81.7% to 80.9%.
| Year | Representation | LMA (Canadian)* | Attainment rate |
|---|---|---|---|
| 2019 for all 595 employers | 39.4 | 48.2 | 81.7 |
| 2020 for all 575 employers | 39.0 | 48.2 | 80.9 |
* Source: Statistics Canada, 2016 Census.
The 2020 submissions included 13 from employers who were reporting for the first time on their 3,277 employees. Therefore, these employers were required to report statistical information for men and women only and will provide complete reports (that is, on the 4 designated groups) for the 2021 reporting year and subsequent years.
Complete data was submitted by 562 employers (575 less 13), with 735,790 employees for the 2020 reporting year. That is a loss of 36,612 employees or a decrease of 4.7% from the 772,402 employees reported for 2019. In addition, the number of all employees and each of the 4 designated groups leaving the workforce were higher than the number of all employees and designated groups entering the workforce in 2020. Overall, 123,251 employees left the workforce, compared to 101,033 hired (a difference of 22,218 employees). While the reason for the decline is not captured during the reporting process, a likely cause of the decrease could be attributed to the COVID-19 pandemic. The COVID-19 virus was first identified in December 2019 and by March 2020, it had spread around the world, including Canada. In the first half of 2020, full or partial closures of non-essential federally- and non-federally-regulated businesses, travel restrictions and social distancing were put in place in an effort to help slow down the spread of the virus. These public health measures and changes in consumer activities, business investment, and international trade have had varied impacts on different sectors and sub-sectors within the Canadian economy.
Table 1B shows that between 2019 and 2020, the representation and attainment rate of women decreased, while that of Aboriginal peoples, persons with disabilities and members of visible minorities increased. Members of visible minorities made the most progress, increasing their overall representation by +1.6 percentage point, and was the only designated group whose representation exceeded Canadian LMA.
| Designated groups | 2019 representation for 571 employers | 2020 representation for 562 employers | Change* in representation from 2019 to 2020 | LMA (Canadian)** | 2019 attainment rate | 2020 attainment rate |
|---|---|---|---|---|---|---|
| Women | 39.5 | 39.1 | -0.4 | 48.2 | 81.9 | 81.0 |
| Aboriginal peoples | 2.3 | 2.4 | +0.1 | 4.0 | 57.8 | 59.9 |
| Persons with disabilities | 3.5 | 3.9 | +0.5 | 9.1 | 37.9 | 43.0 |
| Members of visible minorities | 24.4 | 26.0 | +1.6 | 21.3 | 114.5 | 122.1 |
* Change values may not equal the differences between the representation rates due to rounding.
** Sources: Statistics Canada, 2016 Census and 2017 Canadian Survey on Disability.
From this point forward, this report will cover information on the 562 employers who submitted a complete set of employment equity forms (that is, excluding the 13 employers who reported for the first time) for 2020.
Chart 1 presents the attainment rate for the 4 designated groups at the overall national level since 1987, when employers started reporting under the Act. Values below 100% show that representation is less than LMA.
For women, the attainment rate has been declining since reaching its highest point in 1990 (99.4%), and 2020 marked the lowest rate (81.0%).
From 1987 to 2000, the attainment rate for Aboriginal peoples exhibited an upward trend. The sharp increase of 18.8 percentage points posted from 1995 (39.1%) to 1996 (57.9%) was due to changes made to LMA. Since 2001, the attainment rate has remained stable and, for 2020, was 59.9%.
The attainment rate of persons with disabilities more than doubled from 29.4% in 1987 to 67.0% in 2016. In 2017, because of changes in the collection of LMA data, this measurement increased from 4.9% to 9.1%. Given the new LMA, the attainment rate dropped to 36.4% in 2017, but has since increased to 43.0% in 2020.
For members of visible minorities, the attainment rate has been positive since 2007. While there have been adjustments to attainment rates due to changes to LMA, there continues to be an upward trend with the attainment rate for 2020 at 122.1%.
Chart 1: Designated group attainment rate (Canadian LMA*) from 1987 to 2020 (by percentage)
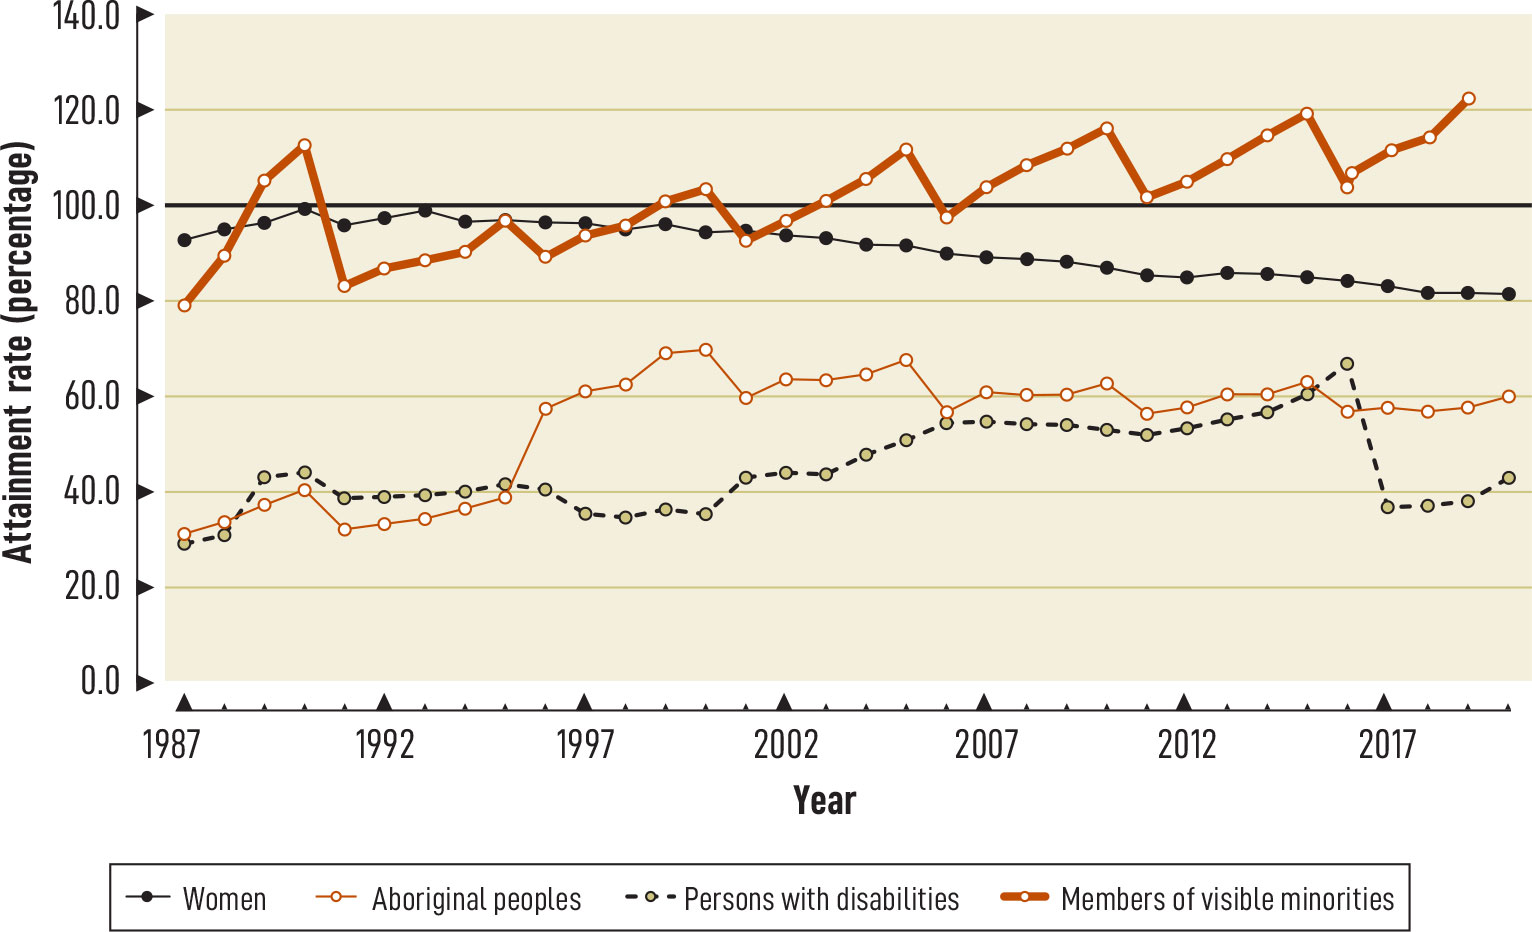
* Sources: Statistics Canada, 1986 to 2016 Census; 1986 and 1991 Health and Activity Limitation Survey; 2001 and 2006 Participation and Activity Limitation Survey; 2011 National Household Survey; and 2012 and 2017 Canadian Survey on Disability.
Chart 1: text description
| Year | Women (by percentage) | Aboriginal peoples (by percentage) | Persons with disabilities (by percentage) | Members of visible minorities (by percentage) |
|---|---|---|---|---|
| 1987 | 93.0 | 31.4 | 29.4 | 79.3 |
| 1988 | 95.3 | 34.0 | 31.2 | 90.0 |
| 1989 | 96.6 | 37.7 | 43.3 | 105.9 |
| 1990 | 99.4 | 40.6 | 44.3 | 112.5 |
| 1991 | 96.3 | 32.1 | 38.6 | 83.1 |
| 1992 | 97.3 | 33.7 | 39.1 | 86.9 |
| 1993 | 99.1 | 34.8 | 39.5 | 88.5 |
| 1994 | 96.7 | 36.7 | 40.4 | 90.4 |
| 1995 | 96.9 | 39.1 | 42.0 | 97.1 |
| 1996 | 96.6 | 57.9 | 40.9 | 89.3 |
| 1997 | 96.0 | 61.3 | 35.6 | 93.9 |
| 1998 | 95.2 | 62.7 | 34.8 | 95.7 |
| 1999 | 96.1 | 69.4 | 36.8 | 101.2 |
| 2000 | 94.3 | 70.3 | 35.7 | 103.6 |
| 2001 | 94.8 | 59.8 | 43.2 | 92.6 |
| 2002 | 93.9 | 63.9 | 44.3 | 97.0 |
| 2003 | 93.0 | 63.6 | 43.8 | 101.0 |
| 2004 | 91.8 | 64.7 | 48.0 | 105.5 |
| 2005 | 91.5 | 67.8 | 50.9 | 111.6 |
| 2006 | 89.9 | 57.1 | 54.5 | 97.5 |
| 2007 | 89.2 | 61.2 | 55.0 | 103.8 |
| 2008 | 88.9 | 60.5 | 54.3 | 108.3 |
| 2009 | 88.2 | 60.8 | 54.2 | 111.9 |
| 2010 | 87.0 | 62.7 | 53.1 | 116.1 |
| 2011 | 85.5 | 56.4 | 52.2 | 102.1 |
| 2012 | 84.9 | 58.4 | 53.5 | 104.7 |
| 2013 | 86.2 | 60.7 | 55.4 | 110.0 |
| 2014 | 85.8 | 60.9 | 56.6 | 114.7 |
| 2015 | 85.1 | 63.1 | 60.4 | 119.0 |
| 2016 | 84.5 | 57.0 | 67.0 | 104.0 |
| 2017 | 83.3 | 57.9 | 36.4 | 107.1 |
| 2018 | 81.8 | 57.1 | 37.5 | 111.8 |
| 2019 | 81.9 | 57.8 | 37.9 | 114.5 |
| 2020 | 81.0 | 59.9 | 43.0 | 122.1 |
Note: In 1996, the Census methodology for calculating LMA of Aboriginal peoples changed, causing a drop in LMA. In 2001, Statistics Canada began using the World Health Organization’s International Classification of Functioning, Disability and Health framework to define disability rather than the 1980 International Classification of Impairments, Disabilities, and Handicaps; this resulted in a drop in LMA for persons with disabilities. In 2017, Statistics Canada introduced a new methodology for gathering data on persons with disabilities that resulted in a significant increase in LMA for this designated group.
Tables 2A, 2B, 2C and 2D show the distribution and cumulative distribution of permanent full-time designated group and non-designated group employees by salary range: under $15,000, various ranges from $15,000 to $99,999, and $100,000 and over.
The data shows that designated groups had lower or higher concentrations of members in some salary ranges when compared to other groups of employees within the same range. For example:
- the proportion of women (18.2%) who earned $100,000 and over was the lowest, compared to 26.6% of men, 19.2% of Aboriginal peoples, 23.6% of non-Aboriginal peoples, 20.5% of persons with disabilities, 23.6% of persons without disabilities, 21.9% of members of visible minorities and 24.1% of non-members of visible minorities
- a high proportion of women (25.1%) earned a salary below $50,000, compared to 17.6% of men, 24.7% of Aboriginal peoples, 20.2% of non-Aboriginal peoples, 21.9% of persons with disabilities, 20.3% of persons without disabilities, 22.2% of members of visible minorities and 19.7% of non-members of visible minorities
- a high proportion of Aboriginal peoples (12.2%) earned a salary below $40,000, compared to 8.3% of non-Aboriginal peoples, 9.5% of women, 7.7% of men, 8.1% of persons with disabilities, 8.4% of persons without disabilities, 8.6% of members of visible minorities and 8.3% of non-members of visible minorities
- about one half of persons with disabilities (49.6%) earned salaries between $35,000 and $69,999, compared to 45.8% of persons without disabilities, 53.1% of women and 41.7% of men
- a high proportion of members of visible minorities (37.4%) earned salaries between $20,000 and $59,999, compared to 33.0% of non-members of visible minorities, 41.7% of women and 29.7% of men
| Salary range (in dollars) |
Women distribution | Women cumulative distribution* | Men distribution | Men cumulative distribution* |
|---|---|---|---|---|
| Under 15,000 | 0.5 | 0.5 | 1.0 | 1.0 |
| 15,000 to 19,999 | 0.2 | 0.7 | 0.3 | 1.3 |
| 20,000 to 24,999 | 0.3 | 1.1 | 0.4 | 1.6 |
| 25,000 to 29,999 | 0.9 | 2.0 | 0.8 | 2.4 |
| 30,000 to 34,999 | 2.2 | 4.2 | 1.7 | 4.0 |
| 35,000 to 37,499 | 2.4 | 6.6 | 1.9 | 5.9 |
| 37,500 to 39,999 | 2.9 | 9.5 | 1.8 | 7.7 |
| 40,000 to 44,999 | 7.4 | 16.9 | 4.6 | 12.3 |
| 45,000 to 49,999 | 8.1 | 25.1 | 5.3 | 17.6 |
| 50,000 to 59,999 | 17.4 | 42.4 | 13.4 | 31.0 |
| 60,000 to 69,999 | 14.9 | 57.3 | 14.8 | 45.7 |
| 70,000 to 84,999 | 14.3 | 71.6 | 15.6 | 61.4 |
| 85,000 to 99,999 | 10.1 | 81.8 | 12.0 | 73.4 |
| 100,000 and over | 18.2 | 100.0 | 26.6 | 100.0 |
* Each figure in the cumulative percentage columns represents the cumulative total percentage of employees in the identified salary range or lower.
| Salary range (in dollars) |
Aboriginal peoples distribution | Aboriginal peoples cumulative distribution* | Non-Aboriginal peoples distribution | Non-Aboriginal peoples cumulative distribution* |
|---|---|---|---|---|
| Under 15,000 | 1.9 | 1.9 | 0.8 | 0.8 |
| 15,000 to 19,999 | 0.5 | 2.4 | 0.2 | 1.0 |
| 20,000 to 24,999 | 0.6 | 3.0 | 0.4 | 1.4 |
| 25,000 to 29,999 | 1.5 | 4.4 | 0.8 | 2.2 |
| 30,000 to 34,999 | 2.9 | 7.3 | 1.8 | 4.0 |
| 35,000 to 37,499 | 2.3 | 9.6 | 2.0 | 6.1 |
| 37,500 to 39,999 | 2.6 | 12.2 | 2.2 | 8.3 |
| 40,000 to 44,999 | 6.0 | 18.2 | 5.6 | 13.9 |
| 45,000 to 49,999 | 6.5 | 24.7 | 6.3 | 20.2 |
| 50,000 to 59,999 | 14.6 | 39.3 | 14.9 | 35.2 |
| 60,000 to 69,999 | 15.0 | 54.3 | 14.8 | 50.0 |
| 70,000 to 84,999 | 16.1 | 70.4 | 15.1 | 65.1 |
| 85,000 to 99,999 | 10.4 | 80.8 | 11.3 | 76.4 |
| 100,000 and over | 19.2 | 100.0 | 23.6 | 100.0 |
* Each figure in the cumulative percentage columns represents the cumulative total percentage of employees in the identified salary range or lower.
| Salary range (in dollars) |
Persons with disabilities distribution | Persons with disabilities cumulative distribution* | Persons without disabilities distribution | Persons without disabilities cumulative distribution* |
|---|---|---|---|---|
| Under 15,000 | 0.6 | 0.6 | 0.8 | 0.8 |
| 15,000 to 19,999 | 0.2 | 0.8 | 0.3 | 1.1 |
| 20,000 to 24,999 | 0.3 | 1.1 | 0.4 | 1.4 |
| 25,000 to 29,999 | 0.6 | 1.7 | 0.8 | 2.3 |
| 30,000 to 34,999 | 1.7 | 3.4 | 1.9 | 4.1 |
| 35,000 to 37,499 | 1.9 | 5.2 | 2.1 | 6.2 |
| 37,500 to 39,999 | 2.8 | 8.1 | 2.2 | 8.4 |
| 40,000 to 44,999 | 6.9 | 15.0 | 5.6 | 14.0 |
| 45,000 to 49,999 | 6.9 | 21.9 | 6.3 | 20.3 |
| 50,000 to 59,999 | 16.1 | 38.0 | 14.8 | 35.1 |
| 60,000 to 69,999 | 15.0 | 53.0 | 14.8 | 49.9 |
| 70,000 to 84,999 | 15.0 | 68.0 | 15.1 | 65.1 |
| 85,000 to 99,999 | 11.5 | 79.5 | 11.3 | 76.4 |
| 100,000 and over | 20.5 | 100.0 | 23.6 | 100.0 |
* Each figure in the cumulative percentage columns represents the cumulative total percentage of employees in the identified salary range or lower.
| Salary range (in dollars) |
Members of visible minorities distribution | Members of visible minorities cumulative distribution* | Non-members of visible minorities distribution | Non-members of visible minorities cumulative distribution* |
|---|---|---|---|---|
| Under 15,000 | 0.7 | 0.7 | 0.8 | 0.8 |
| 15,000 to 19,999 | 0.2 | 0.9 | 0.3 | 1.1 |
| 20,000 to 24,999 | 0.4 | 1.3 | 0.4 | 1.5 |
| 25,000 to 29,999 | 0.8 | 2.1 | 0.8 | 2.3 |
| 30,000 to 34,999 | 1.9 | 3.9 | 1.9 | 4.2 |
| 35,000 to 37,499 | 2.1 | 6.0 | 2.0 | 6.2 |
| 37,500 to 39,999 | 2.6 | 8.6 | 2.1 | 8.3 |
| 40,000 to 44,999 | 6.8 | 15.4 | 5.2 | 13.5 |
| 45,000 to 49,999 | 6.8 | 22.2 | 6.2 | 19.7 |
| 50,000 to 59,999 | 16.1 | 38.4 | 14.5 | 34.1 |
| 60,000 to 69,999 | 13.3 | 51.7 | 15.3 | 49.5 |
| 70,000 to 84,999 | 14.5 | 66.2 | 15.4 | 64.9 |
| 85,000 to 99,999 | 12.0 | 78.1 | 11.0 | 75.9 |
| 100,000 and over | 21.9 | 100.0 | 24.1 | 100.0 |
* Each figure in the cumulative percentage columns represents the cumulative total percentage of employees in the identified salary range or lower.
Section 2: Sector profiles
Sector employers and employees
This section provides an analysis of the combined federally-regulated private sector, as well as its 4 industrial sectors and their subsectors for 2019 and 2020.
Between 2019 and 2020, the overall number of employers decreased by -1.6% and the overall number of employees decreased by -4.7% (shown in Table 3A and Table 3B, respectively).
While accounting for less than 10% of the employer population, the banking and financial services sector employed over a third of all employees. For 2020, the number of employers remained unchanged, but there was growth in the number of employees. This was the only sector that saw a proportional increase in the number of employees (+0.4 %).
The communications sector remained the third largest sector, accounting for 10.9% of the employer population and 16.2% of the combined workforce in 2020. Its number of employers and of employees decreased by -1.6% and -8.1% respectively. It posted the highest proportional decrease in the number of employees among all 4 sectors, likely the result of the COVID-19 pandemic.
The transportation sector, with 67% of the employer population, continued to have the largest number of employers and of employees. Its number of employees decreased by -7.9%.
The ‘other’ sector saw an increase in the number of employers by +2.6%, but the number of employees decreased by -1.8%.
| Sector | 2019 number of employers | 2020 number of employers | Percentage change in number of employers from 2019 to 2020 | 2019 percentage distribution of employers** | 2020 percentage distribution of employers** |
|---|---|---|---|---|---|
| Banking and financial services | 43 | 43 | 0.0 | 7.5 | 7.7 |
| Communications | 62 | 61 | -1.6 | 10.9 | 10.9 |
| Transportation | 388 | 378 | -2.6 | 68.0 | 67.3 |
| 'Other' | 78 | 80 | +2.6 | 13.7 | 14.2 |
| All sectors | 571 | 562 | -1.6 | 100.0 | 100.0 |
* The number of employers in the federally-regulated private sector can change from year to year because of mergers, acquisitions, closures, start-ups or organizations fluctuating above or below the 100-employee threshold.
** Total may not equal the sum of components due to rounding.
| Sector | 2019 number of employees | 2020 number of employees | Percentage change in number of employees from 2019 to 2020 | 2019 percentage distribution of employees* | 2020 percentage distribution of employees* |
|---|---|---|---|---|---|
| Banking and financial services | 254,434 | 255,560 | +0.4 | 32.9 | 34.7 |
| Communications | 129,398 | 118,905 | -8.1 | 16.8 | 16.2 |
| Transportation | 329,240 | 303,071 | -7.9 | 42.6 | 41.2 |
| 'Other' | 59,330 | 58,254 | -1.8 | 7.7 | 7.9 |
| All sectors | 772,402 | 735,790 | -4.7 | 100.0 | 100.0 |
* Total may not equal the sum of components due to rounding.
Further analysis of the transportation and ‘other’ sectors is shown in Tables 3C to 3F.
Table 3C and Table 3D show the number and distribution of employers and employees by the air, ground and water subsectors of the transportation sector for 2019 and 2020.
The air transportation subsector accounted for 25.1% of employers and 22.4% of employees in the transportation sector in 2020. It saw a decrease in the number of employers and of employees by -1.0% and -30.8% respectively. Greatly impacted by the effects of COVID-19, this subsector lost the most number of employees and posted the highest proportional drop in the number of employees among all sectors and subsectors.
Among the subsectors, ground transportation was the largest, comprising 64.3% of employers and 71.6% of employees in the transportation sector in 2020. It saw a proportional decrease of -3.6% in its employer population and was the only subsector that posted a growth in the number of employees (+2.4%).
The water transportation subsector was the smallest, with 10.6% of the employer population and 6.1% of the transportation workforce. The number of employers remained unchanged, but the number of employees decreased by -5.4%.
| Subsectors of transportation sector | 2019 number of employers | 2020 number of employers | Percentage change in number of employers from 2019 to 2020 | 2019 percentage distribution of employers within sector** | 2020 percentage distribution of employers within sector** |
|---|---|---|---|---|---|
| Air transportation | 96 | 95 | -1.0 | 24.7 | 25.1 |
| Ground transportation | 252 | 243 | -3.6 | 64.9 | 64.3 |
| Water transportation | 40 | 40 | 0.0 | 10.3 | 10.6 |
| Transportation sector | 388 | 378 | -2.6 | 100.0 | 100.0 |
* The number of employers in the federally-regulated private sector can change from year to year because of mergers, acquisitions, closures, start-ups or organizations fluctuating above or below the 100-employee threshold.
** Total may not equal the sum of components due to rounding.
| Subsectors of transportation sector | 2019 number of employees | 2020 number of employees | Percentage change in number of employees from 2019 to 2020 | 2019 percentage distribution of employees within sector* | 2020 percentage distribution of employees within sector* |
|---|---|---|---|---|---|
| Air transportation | 97,969 | 67,787 | -30.8 | 29.8 | 22.4 |
| Ground transportation | 211,829 | 216,884 | +2.4 | 64.3 | 71.6 |
| Water transportation | 19,442 | 18,400 | -5.4 | 5.9 | 6.1 |
| Transportation sector | 329,240 | 303,071 | -7.9 | 100.0 | 100.0 |
* Total may not equal the sum of components due to rounding.
Table 3E and Table 3F show the number and distribution of employers and employees by the 2 subsectors of the ‘other’ sector for 2019 and 2020. The production industries subsector includes employers such as those primarily engaged in nuclear power generation, metal ore mining, support activities for crop production, and grain and oilseed milling. The service industries subsector comprises businesses such as those providing professional, scientific and technical services, investigation and security services, public administration, and heritage institutions (museums).
The production industries subsector posted growth in the number of employers and of employees amounting to +5.1% and +3.3% respectively. This subsector accounted for 51.3% of the employer population and 54.9% of the employees in the ‘other’ sector in 2020.
In the service industries subsector, the number of employers remained unchanged, but the number of employees decreased by -7.4% in 2020, which is in line with the losses of employees in the service industry due to COVID-19. This subsector constituted 48.8% of the employer population and 45.1% of the ‘other’ sector workforce.
| Subsectors of 'other' sector | 2019 number of employers | 2020 number of employers | Percentage change in number of employers from 2019 to 2020 | 2019 percentage distribution of employers within sector** | 2020 percentage distribution of employers within sector** |
|---|---|---|---|---|---|
| Production industries | 39 | 41 | +5.1 | 50.0 | 51.3 |
| Service industries | 39 | 39 | 0.0 | 50.0 | 48.8 |
| 'Other' sector | 78 | 80 | +2.6 | 100.0 | 100.0 |
* The number of employers in the federally-regulated private sector can change from year to year because of mergers, acquisitions, closures, start-ups or organizations fluctuating above or below the 100-employee threshold.
** Total may not equal the sum of components due to rounding.
| Subsectors of 'other' sector | 2019 number of employees | 2020 number of employees | Percentage change in number of employees from 2019 to 2020 | 2019 percentage distribution of employees within sector* | 2020 percentage distribution of employees within sector* |
|---|---|---|---|---|---|
| Production industries | 30,938 | 31,961 | +3.3 | 52.1 | 54.9 |
| Service industries | 28,392 | 26,293 | -7.4 | 47.9 | 45.1 |
| 'Other' sector | 59,330 | 58,254 | -1.8 | 100.0 | 100.0 |
* Total may not equal the sum of components due to rounding.
Sector representation and attainment rates of designated groups
This section provides an analysis of the designated groups’ representation and attainment rates for the 4 industrial sectors and their subsectors in 2019 and 2020, in order to focus on any improvements made by the federally regulated private-sector employers when compared to federally-and non-federally regulated employers in all sectors at the Canadian or national level (Canadian LMA) and in their respective sector LMA. The sector LMA is used to show how the designated groups in the federally-regulated private sector are faring when compared to those employed by all federally-and non-federally regulated employers within their sector. Sector LMA differs from Canadian LMA, because each sector has a unique occupational group profile.
Banking and financial services sector
Table 4A presents data on the overall representation and attainment rates (based on Canadian and sector LMA) of the designated groups in the banking and financial services sector between 2019 and 2020.
- Women: Representation in this sector decreased by 0.7 of a percentage point and continued to exceed Canadian LMA of 48.2%, for an attainment rate of 114.9%. When compared with sector LMA of 58.9%, the attainment rate decreased to 94.0%
- Aboriginal peoples: Representation in this sector increased by 0.2 of a percentage point and remained below Canadian LMA of 4.0%, with a corresponding attainment rate of 35.4%. When compared with sector LMA of 1.7%, the attainment rate increased to 83.3%
- Persons with disabilities: Representation in this sector increased by 0.9 of a percentage point and remained below Canadian LMA of 9.1%, with an attainment rate of 64.0%. When compared with sector LMA of 9.2%, the attainment rate increased to 63.3%
- Members of visible minorities: Representation in this sector increased by 4.2 percentage points and continued to exceed Canadian LMA of 21.3%, for an attainment rate of 180.9%. When compared with sector LMA of 31.2%, the attainment rate increased to 123.5%
| Designated groups | 2019 representation | 2020 representation | Change* in representation from 2019 to 2020 | LMA (Canadian)** | 2019 attainment rate based on LMA (Canadian) | 2020 attainment rate based on LMA (Canadian) | LMA (sector)** | 2019 attainment rate based on LMA (sector) | 2020 attainment rate based on LMA (sector) |
|---|---|---|---|---|---|---|---|---|---|
| Women | 56.1 | 55.4 | -0.7 | 48.2 | 116.3 | 114.9 | 58.9 | 95.2 | 94.0 |
| Aboriginal peoples | 1.2 | 1.4 | +0.2 | 4.0 | 30.9 | 35.4 | 1.7 | 72.7 | 83.3 |
| Persons with disabilities | 4.9 | 5.8 | +0.9 | 9.1 | 54.1 | 64.0 | 9.2 | 53.5 | 63.3 |
| Members of visible minorities | 34.4 | 38.5 | +4.2 | 21.3 | 161.4 | 180.9 | 31.2 | 110.2 | 123.5 |
* Change values may not equal the differences between the representation rates due to rounding.
** Sources: Statistics Canada, 2016 Census and 2017 Canadian Survey on Disability.
Communications sector
Table 4B presents data on the overall representation and attainment rates (based on Canadian and sector LMA) of the designated groups in the communications sector between 2019 and 2020.
- Women: Representation in this sector increased by 0.7 of a percentage point and continued to be below Canadian LMA of 48.2%, for an attainment rate of 74.0%. When compared with sector LMA of 44.1%, the attainment rate increased to 80.9%
- Aboriginal peoples: Representation in this sector increased by 0.1 of a percentage point and continued to be below Canadian LMA of 4.0%, for an attainment rate of 55.2%. When compared with sector LMA of 2.5%, the attainment rate increased to 88.3%
- Persons with disabilities: Representation in this sector increased by 0.7 of a percentage point and remained below Canadian LMA of 9.1%, for an attainment rate of 48.5%. When compared with sector LMA of 11.0%, the attainment rate increased to 40.2%
- Members of visible minorities: Representation in this sector increased by 0.9 of a percentage point and continued to exceed Canadian LMA of 21.3%, for an attainment rate of 115.5%. When compared with sector LMA of 24.8%, the attainment rate increased to 99.2%
| Designated groups | 2019 representation | 2020 representation | Change* in representation from 2019 to 2020 | LMA (Canadian)** | 2019 attainment rate based on LMA (Canadian) | 2020 attainment rate based on LMA (Canadian) | LMA (sector)** | 2019 attainment rate based on LMA (sector) | 2020 attainment rate based on LMA (sector) |
|---|---|---|---|---|---|---|---|---|---|
| Women | 34.9 | 35.7 | +0.7 | 48.2 | 72.5 | 74.0 | 44.1 | 79.2 | 80.9 |
| Aboriginal peoples | 2.2 | 2.2 | +0.1 | 4.0 | 53.8 | 55.2 | 2.5 | 86.1 | 88.3 |
| Persons with disabilities | 3.7 | 4.4 | +0.7 | 9.1 | 40.4 | 48.5 | 11.0 | 33.4 | 40.2 |
| Members of visible minorities | 23.8 | 24.6 | +0.9 | 21.3 | 111.5 | 115.5 | 24.8 | 95.8 | 99.2 |
* Change values may not equal the differences between the representation rates due to rounding.
** Sources: Statistics Canada, 2016 Census and 2017 Canadian Survey on Disability.
Transportation sector and subsectors
Table 4C presents data on the overall representation and attainment rates (based on Canadian and sector LMA) of the designated groups in the transportation sector between 2019 and 2020.
- Women: Representation in this sector decreased by 1.8 of a percentage point and continued to be below Canadian LMA of 48.2%, for an attainment rate of 58.7%. When compared with sector LMA of 25.3%, the attainment rate decreased to 111.9% from 118.9% in the previous year
- Aboriginal peoples: Representation in this sector remained unchanged and below Canadian LMA of 4.0%, for an attainment rate of 74.2%. When compared with sector LMA of 3.9%, the attainment rate increased to 76.1%
- Persons with disabilities: Representation in this sector remained unchanged and below Canadian LMA of 9.1%, for an attainment rate of 26.9%. When compared with sector LMA of 9.8%, the attainment rate decreased to 24.9%
- Members of visible minorities: Representation in this sector decreased by 0.6 of a percentage point and continued to be below Canadian LMA of 21.3%, for an attainment rate of 83.7%. When compared with sector LMA of 25.1%, the attainment rate decreased to 71.0%
| Designated groups | 2019 representation | 2020 representation | Change* in representation from 2019 to 2020 | LMA (Canadian)** | 2019 attainment rate based on LMA (Canadian) | 2020 attainment rate based on LMA (Canadian) | LMA (sector)** | 2019 attainment rate based on LMA (sector) | 2020 attainment rate based on LMA (sector) |
|---|---|---|---|---|---|---|---|---|---|
| Women | 30.1 | 28.3 | -1.8 | 48.2 | 62.4 | 58.7 | 25.3 | 118.9 | 111.9 |
| Aboriginal peoples | 2.9 | 3.0 | 0.0 | 4.0 | 73.3 | 74.2 | 3.9 | 75.1 | 76.1 |
| Persons with disabilities | 2.5 | 2.4 | 0.0 | 9.1 | 27.1 | 26.9 | 9.8 | 25.1 | 24.9 |
| Members of visible minorities | 18.4 | 17.8 | -0.6 | 21.3 | 86.3 | 83.7 | 25.1 | 73.2 | 71.0 |
* Change values may not equal the differences between the representation rates due to rounding.
** Sources: Statistics Canada, 2016 Census and 2017 Canadian Survey on Disability.
Table 4D.1 presents data on the overall representation and attainment rates (based on the transportation sector LMA) of the designated groups in the air transportation subsector between 2019 and 2020.
- Women: Representation in this subsector decreased by 4.1 percentage points and continued to be above sector LMA of 25.3%, for a decrease in the attainment rate to 136.5% from 152.6% in 2019
- Aboriginal peoples: Representation in this subsector increased by 0.4 of a percentage point and remained below sector LMA of 3.9%, for an increase in the attainment rate to 82.9%
- Persons with disabilities: Representation in this subsector increased by 0.1 of a percentage point and continued to be below sector LMA of 9.8%, for an increase in the attainment rate to 17.2%
- Members of visible minorities: Representation in this subsector decreased by 3.0 percentage points and continued to be below sector LMA of 25.1%, for a decrease in the attainment rate to 70.6%
| Designated groups | 2019 representation | 2020 representation | Change* in representation from 2019 to 2020 | LMA (sector)** | 2019 attainment rate based on LMA (sector) | 2020 attainment rate based on LMA (sector) |
|---|---|---|---|---|---|---|
| Women | 38.6 | 34.5 | -4.1 | 25.3 | 152.6 | 136.5 |
| Aboriginal peoples | 2.8 | 3.2 | +0.4 | 3.9 | 72.2 | 82.9 |
| Persons with disabilities | 1.5 | 1.7 | +0.1 | 9.8 | 15.8 | 17.2 |
| Members of visible minorities | 20.8 | 17.7 | -3.0 | 25.1 | 82.8 | 70.6 |
* Change values may not equal the differences between the representation rates due to rounding.
** Sources: Statistics Canada, 2016 Census and 2017 Canadian Survey on Disability.
Table 4D.2 presents data on the overall representation and attainment rates (based on the transportation sector LMA) of the designated groups in the ground transportation subsector between 2019 and 2020.
- Women: Representation in this subsector decreased by 0.1 of a percentage point and continued to be above sector LMA of 25.3%, for a decrease in the attainment rate to 107.9%
- Aboriginal peoples: Representation in this subsector decreased by 0.1 of a percentage point and continued to be below sector LMA of 3.9%, for a decrease in the attainment rate to 69.5%
- Persons with disabilities: Representation in this subsector deceased by 0.2 of a percentage point and continued to be below sector LMA of 9.8%, for a decrease in the attainment rate to 27.5%
- Members of visible minorities: Representation in this subsector increased by 0.4 of a percentage point and continued to be below sector LMA of 25.1%, for an increase in the attainment rate to 71.8%
| Designated groups | 2019 representation | 2020 representation | Change* in representation from 2019 to 2020 | LMA (sector)** | 2019 attainment rate based on LMA (sector) | 2020 attainment rate based on LMA (sector) |
|---|---|---|---|---|---|---|
| Women | 27.4 | 27.3 | -0.1 | 25.3 | 108.1 | 107.9 |
| Aboriginal peoples | 2.8 | 2.7 | -0.1 | 3.9 | 72.2 | 69.5 |
| Persons with disabilities | 2.9 | 2.7 | -0.2 | 9.8 | 29.6 | 27.5 |
| Members of visible minorities | 17.6 | 18.0 | +0.4 | 25.1 | 70.2 | 71.8 |
* Change values may not equal the differences between the representation rates due to rounding.
** Sources: Statistics Canada, 2016 Census and 2017 Canadian Survey on Disability.
Table 4D.3 presents data on the overall representation and attainment rates (based on the transportation sector LMA) of the designated groups in the water transportation subsector between 2019 and 2020.
- Women: Representation in this subsector increased by 0.2 of a percentage point and continued to be below sector LMA of 25.3%, for an increase in the attainment rate to 68.0%
- Aboriginal peoples: Representation in this subsector increased by 0.3 of a percentage point and remained above sector LMA of 3.9%, for an increase in the attainment rate to 128.9%
- Persons with disabilities: Representation in this subsector decreased by 0.1 of a percentage point and continued to be below sector LMA of 9.8%, for a decrease in the attainment rate to 23.5%
- Members of visible minorities: Representation in this subsector increased by 0.9 of a percentage point and continued to be below sector LMA of 25.1%, for an increase in the attainment rate to 62.5%
| Designated groups | 2019 representation | 2020 representation | Change* in representation from 2019 to 2020 | LMA (sector)** | 2019 attainment rate based on LMA (sector) | 2020 attainment rate based on LMA (sector) |
|---|---|---|---|---|---|---|
| Women | 17.0 | 17.2 | +0.2 | 25.3 | 67.1 | 68.0 |
| Aboriginal peoples | 4.8 | 5.0 | +0.3 | 3.9 | 122.1 | 128.9 |
| Persons with disabilities | 2.4 | 2.3 | -0.1 | 9.8 | 24.3 | 23.5 |
| Members of visible minorities | 14.8 | 15.7 | +0.9 | 25.1 | 58.9 | 62.5 |
* Change values may not equal the differences between the representation rates due to rounding.
** Sources: Statistics Canada, 2016 Census and 2017 Canadian Survey on Disability.
‘Other’ sector and subsectors
Table 4E presents data on the overall representation and attainment rates (based on Canadian and sector LMA) of the designated groups in the ‘other’ sector between 2019 and 2020.
- Women: Representation in this sector increased by 0.2 of a percentage point and continued to be below Canadian LMA of 48.2%, for an attainment rate of 63.3%. When compared with sector LMA of 34.5%, the attainment rate increased to 88.4%
- Aboriginal peoples: Representation in this sector increased by 0.3 of a percentage point and exceeded Canadian LMA of 4.0%, for an attainment rate of 102.0%. When compared with sector LMA of 4.6%, the attainment rate increased to 88.7%
- Persons with disabilities: Representation in this sector remained unchanged and below Canadian LMA of 9.1%, for an attainment rate of 23.7%. When compared with sector LMA of 8.3%, the attainment rate decreased to 26.0%
- Members of visible minorities: Representation in this sector increased by 0.4 of a percentage point and continued to be below Canadian LMA of 21.3%, for an attainment rate of 77.9%. When compared with sector LMA of 16.0%, the attainment rate increased to 103.7%
| Designated groups | 2019 representation | 2020 representation | Change* in representation from 2019 to 2020 | LMA (Canadian)** | 2019 attainment rate based on LMA (Canadian) | 2020 attainment rate based on LMA (Canadian) | LMA (sector)** | 2019 attainment rate based on LMA (sector) | 2020 attainment rate based on LMA (sector) |
|---|---|---|---|---|---|---|---|---|---|
| Women | 30.3 | 30.5 | +0.2 | 48.2 | 62.8 | 63.3 | 34.5 | 87.8 | 88.4 |
| Aboriginal peoples | 3.8 | 4.1 | +0.3 | 4.0 | 95.4 | 102.0 | 4.6 | 82.9 | 88.7 |
| Persons with disabilities | 2.2 | 2.2 | 0.0 | 9.1 | 23.8 | 23.7 | 8.3 | 26.1 | 26.0 |
| Members of visible minorities | 16.2 | 16.6 | +0.4 | 21.3 | 76.1 | 77.9 | 16.0 | 101.3 | 103.7 |
* Change values may not equal the differences between the representation rates due to rounding.
** Sources: Statistics Canada, 2016 Census and 2017 Canadian Survey on Disability.
Table 4F.1 presents data on the overall representation and attainment rates (based on the ‘other’ sector LMA) of the designated groups in the production industries subsector between 2019 and 2020.
- Women: Representation in this subsector increased by 0.7 of a percentage point and continued to be below sector LMA of 34.5%, for an increase in the attainment rate to 69.5%
- Aboriginal peoples: Representation in this subsector increased by 0.1 of a percentage point and continued to be above sector LMA of 4.6%, for an increase in the attainment rate to 104.1%
- Persons with disabilities: Representation in this subsector decreased by 0.2 of a percentage point and continued to be below sector LMA of 8.3%, for a decrease in the attainment rate to 25.1%
- Members of visible minorities: Representation in this subsector decreased by 0.2 of a percentage point and continued to be below sector LMA of 16.0%, for a decrease in the attainment rate to 78.8%
| Designated groups | 2019 representation | 2020 representation | Change* in representation from 2019 to 2020 | LMA (sector)** | 2019 attainment rate based on LMA (sector) | 2020 attainment rate based on LMA (sector) |
|---|---|---|---|---|---|---|
| Women | 23.3 | 24.0 | +0.7 | 34.5 | 67.4 | 69.5 |
| Aboriginal peoples | 4.7 | 4.8 | +0.1 | 4.6 | 102.7 | 104.1 |
| Persons with disabilities | 2.3 | 2.1 | -0.2 | 8.3 | 27.6 | 25.1 |
| Members of visible minorities | 12.8 | 12.6 | -0.2 | 16.0 | 80.1 | 78.8 |
* Change values may not equal the differences between the representation rates due to rounding.
** Sources: Statistics Canada, 2016 Census and 2017 Canadian Survey on Disability.
Table 4F.2 presents data on the overall representation and attainment rates (based on the ‘other’ sector LMA) of the designated groups in the service industries subsector between 2019 and 2020.
- Women: Representation in this subsector increased by 0.5 of a percentage point and continued to be above sector LMA of 34.5%, for an increase in the attainment rate to 111.3%
- Aboriginal peoples: Representation in this subsector increased by 0.4 of a percentage point and continued to be below sector LMA of 4.6%, for an increase in the attainment rate to 69.9%
- Persons with disabilities: Representation in this subsector increased by 0.2 of a percentage point and continued to be below sector LMA of 8.3%, for an increase in the attainment rate to 27.1%
- Members of visible minorities: Representation in this subsector increased by 1.5 of a percentage point and continued to be above sector LMA of 16.0%, for an increase in the attainment rate to 133.9%
| Designated groups | 2019 representation | 2020 representation | Change* in representation from 2019 to 2020 | LMA (sector)** | 2019 attainment rate based on LMA (sector) | 2020 attainment rate based on LMA (sector) |
|---|---|---|---|---|---|---|
| Women | 37.9 | 38.4 | +0.5 | 34.5 | 109.9 | 111.3 |
| Aboriginal peoples | 2.8 | 3.2 | +0.4 | 4.6 | 61.3 | 69.9 |
| Persons with disabilities | 2.0 | 2.2 | +0.2 | 8.3 | 24.6 | 27.1 |
| Members of visible minorities | 19.9 | 21.4 | +1.5 | 16.0 | 124.4 | 133.9 |
* Change values may not equal the differences between the representation rates due to rounding.
** Sources: Statistics Canada, 2016 Census and 2017 Canadian Survey on Disability.
Additional data on the representation, attainment rates, hires, promotions and terminations of employees by designated group and sector is provided in Appendix A.
Section 3: Designated group profiles
Women
The number of employed women decreased from 304,895 in 2019 to 287,425 in 2020, with a proportional drop of 5.7%. The representation of women also decreased from 39.5% to 39.1%. This was the only designated group that posted a decrease in representation at the combined workforce level for 2020. According to Statistics Canada, this could be attributed to COVID-19, as women were also leaving the labour market to care for children or others who were ill, uncertain if and when they would able to return to work.Footnote 6
In 2020, the percentages of women leaving the workforce were higher than the percentages of women entering the workforce in all sectors combined and in 3 of the 4 sectors. The only exception was the communications sector, where the percentage of women who entered the workforce exceeded the percentage who left. Women’s share of promotions at the combined workforce level decreased from 46.8% in 2019 to 45.0% in 2020, but remained above their representation level.
Progress was observed for women in some occupations. For instance, between 2019 and 2020, the representation of women increased in 7 of the 14 occupational groups. During the same period, the representation of women in the senior managers occupational group continued to exceed this occupational group’s Canadian LMA. Although the representation of women decreased in the middle and other managers and in the supervisors occupational groups, it continued to exceed the corresponding occupational group’s Canadian LMA.
Chart 2 shows that from 1987 onwards, the representation of women increased and peaked in 1993, but the trend has been downward since the early 2000s. The representation of women in 2020 (39.1%) was 1.9 of a percentage point below what it was in 1987 (40.9%).
Chart 2: Representation and Canadian LMA* of women from 1987 to 2020 (by percentage)

* Sources: Statistics Canada, 1986 to 2016 Census and 2011 National Household Survey.
Chart 2: text description
| Year | Canadian labour market availability (by percentage) | Representation (by percentage) |
|---|---|---|
| 1987 | 44.0 | 40.9 |
| 1988 | 44.0 | 41.9 |
| 1989 | 44.0 | 42.5 |
| 1990 | 44.0 | 43.7 |
| 1991 | 45.9 | 44.2 |
| 1992 | 45.9 | 44.7 |
| 1993 | 45.9 | 45.5 |
| 1994 | 45.9 | 44.4 |
| 1995 | 45.9 | 44.5 |
| 1996 | 46.4 | 44.8 |
| 1997 | 46.4 | 44.5 |
| 1998 | 46.4 | 44.2 |
| 1999 | 46.4 | 44.6 |
| 2000 | 46.4 | 43.8 |
| 2001 | 47.3 | 44.9 |
| 2002 | 47.3 | 44.4 |
| 2003 | 47.3 | 44.0 |
| 2004 | 47.3 | 43.4 |
| 2005 | 47.3 | 43.3 |
| 2006 | 47.9 | 43.1 |
| 2007 | 47.9 | 42.7 |
| 2008 | 47.9 | 42.6 |
| 2009 | 47.9 | 42.3 |
| 2010 | 47.9 | 41.7 |
| 2011 | 48.2 | 41.2 |
| 2012 | 48.2 | 40.9 |
| 2013 | 48.2 | 41.6 |
| 2014 | 48.2 | 41.4 |
| 2015 | 48.2 | 41.0 |
| 2016 | 48.2 | 40.7 |
| 2017 | 48.2 | 40.2 |
| 2018 | 48.2 | 39.4 |
| 2019 | 48.2 | 39.5 |
| 2020 | 48.2 | 39.1 |
Occupational group
Chart 3 shows that overall between 2019 and 2020, the representation of women in management and skilled occupational groups continued to exceed the corresponding occupational group’s Canadian LMA (senior managers, middle and other managers, supervisors, skilled sales and service personnel, and skilled crafts and trades workers). Attainment rates in the semi-professionals and technicians group remains particularly low. Among all occupational groups, the attainment rate is highest for women in the skilled crafts and trades workers group.
Chart 3: Attainment rate (occupational group’s Canadian LMA*) of women in 2019 and 2020 (by percentage)

* Source: Statistics Canada, 2016 Census.
Chart 3: text description
| Employment equity occupational group | 2019 attainment rate based on occupational group's Canadian labour market availability (by percentage) | 2020 attainment rate based on occupational group's Canadian labour market availability (by percentage) |
|---|---|---|
| Senior managers | 104.0 | 105.8 |
| Middle and other managers | 107.6 | 107.2 |
| Professionals | 79.8 | 79.9 |
| Semi-professionals and technicians | 35.7 | 36.7 |
| Supervisors | 105.8 | 104.9 |
| Supervisors: crafts and trades | 86.1 | 97.8 |
| Administrative and senior clerical personnel | 88.2 | 87.4 |
| Skilled sales and service personnel | 106.5 | 106.9 |
| Skilled crafts and trades workers | 117.7 | 125.9 |
| Clerical personnel | 77.8 | 77.1 |
| Intermediate sales and service personnel | 91.3 | 90.9 |
| Semi-skilled manual workers | 69.0 | 73.1 |
| Other sales and service personnel | 69.6 | 65.2 |
| Other manual workers | 55.6 | 66.3 |
| Total | 81.9 | 81.0 |
Salaries
According to Statistics Canada, in 2020, full- and part-time employed women combined (aged 25 to 54) earned an average of $29.87 per hour, while men earned $33.51. Women earned $3.64 less per hour than men, or $0.89 for every dollar earned by men.Footnote 7 That is a wage gap of 10.9%.
The pay gap is also reflected in the employers’ annual employment equity reports. According to the salary data reported for women and men in permanent full-time positions in 2020:
- 25.1% of women earned below $50,000, compared to 17.6% of men
- 56.7% of women earned a salary of $50,000 to $99,999, compared to 55.8% of men
- 18.2% of women earned salaries of $100,000 or more, compared to 26.6% of men
The following are the salary analyses of women compared to men in permanent part-time positions in 2020:
- 47.8% of women earned below $25,000, compared to 54.0% of men
- 43.9% of women earned a salary of $25,000 to $49,999, compared to 37.3% of men
- 8.3% of women earned salaries of $50,000 or more, compared to 8.6% of men
Additional data on the representation, attainment rates, hires, promotions and terminations of employees by designated group and sector is provided in Appendix A.
Aboriginal peoples
Between 2019 and 2020, the number of employed Aboriginal peoples decreased from 17,843 to 17,616, with a proportional drop of 1.3%. During the same period, the representation of Aboriginal peoples increased from 2.3% to 2.4%.
In 2020, a higher percentage of Aboriginal employees left the workforce than entered it at the overall workforce level and in 3 of the 4 sectors. The only exception was the ‘other’ sector, where the number and percentage of Aboriginal employees who entered the workforce exceeded the number and percentage who left. At the combined workforce level, this designated group’s share of promotions increased from 1.7% in 2019 to 2.1% in 2020, and continued to be below their representation.
Chart 4 shows that the representation of Aboriginal peoples remained below the 4.0% Canadian LMA; however, the representation of Aboriginal peoples has been increasing steadily since its initial low of 0.7% in 1987.
Chart 4: Representation and Canadian LMA* of Aboriginal peoples from 1987 to 2020 (by percentage)
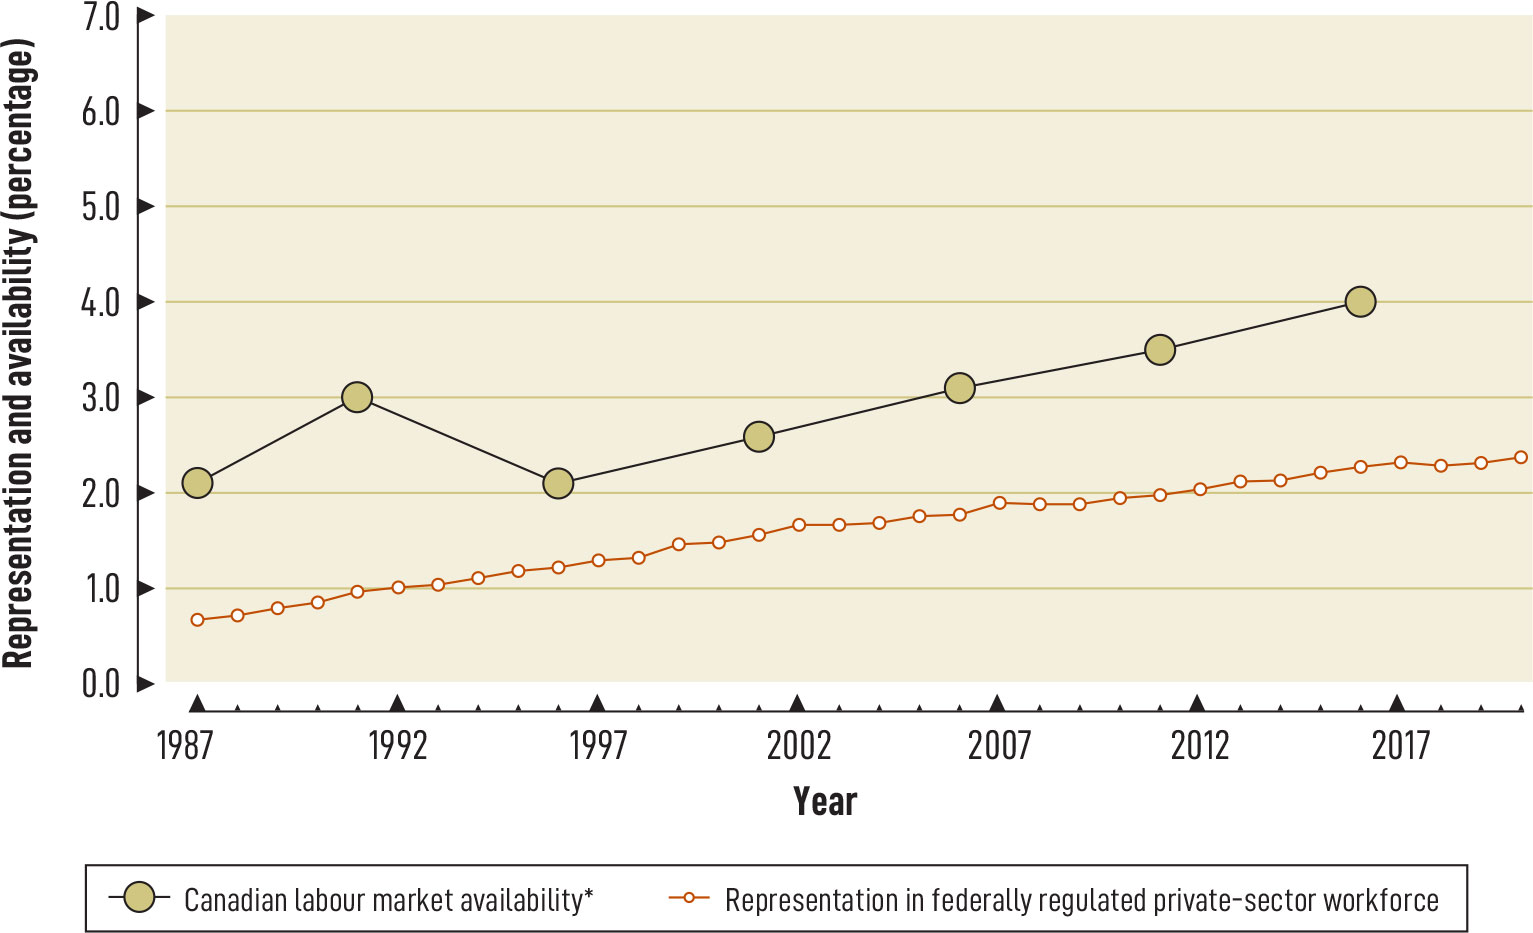
* Sources: Statistics Canada, 1986 to 2016 Census and 2011 National Household Survey.
Chart 4: text description
| Year | Canadian labour market availability (by percentage) | Representation (by percentage) |
|---|---|---|
| 1987 | 2.1 | 0.7 |
| 1988 | 2.1 | 0.7 |
| 1989 | 2.1 | 0.8 |
| 1990 | 2.1 | 0.9 |
| 1991 | 3.0 | 1.0 |
| 1992 | 3.0 | 1.0 |
| 1993 | 3.0 | 1.0 |
| 1994 | 3.0 | 1.1 |
| 1995 | 3.0 | 1.2 |
| 1996 | 2.1 | 1.2 |
| 1997 | 2.1 | 1.3 |
| 1998 | 2.1 | 1.3 |
| 1999 | 2.1 | 1.5 |
| 2000 | 2.1 | 1.5 |
| 2001 | 2.6 | 1.6 |
| 2002 | 2.6 | 1.7 |
| 2003 | 2.6 | 1.7 |
| 2004 | 2.6 | 1.7 |
| 2005 | 2.6 | 1.8 |
| 2006 | 3.1 | 1.8 |
| 2007 | 3.1 | 1.9 |
| 2008 | 3.1 | 1.9 |
| 2009 | 3.1 | 1.9 |
| 2010 | 3.1 | 1.9 |
| 2011 | 3.5 | 2.0 |
| 2012 | 3.5 | 2.0 |
| 2013 | 3.5 | 2.1 |
| 2014 | 3.5 | 2.1 |
| 2015 | 3.5 | 2.2 |
| 2016 | 4.0 | 2.3 |
| 2017 | 4.0 | 2.3 |
| 2018 | 4.0 | 2.3 |
| 2019 | 4.0 | 2.3 |
| 2020 | 4.0 | 2.4 |
Note: In 1996, the Census methodology for calculating LMA of Aboriginal peoples changed, causing a drop in LMA.
Occupational group
Chart 5 shows that at the overall level between 2019 and 2020, the representation of Aboriginal peoples continued to be below the corresponding occupational group’s Canadian LMA in all occupational groups. Aboriginal peoples’ representation is significantly short of reaching full representation in the senior managers occupational group. Of all occupational groups, the attainment rates are highest for Aboriginal peoples in the supervisors: crafts and trades and skilled crafts and trades workers groups.
Chart 5: Attainment rate (occupational group’s Canadian LMA*) of Aboriginal peoples in 2019 and 2020 (by percentage)

* Source: Statistics Canada, 2016 Census.
Chart 5: text description
| Employment equity occupational group | 2019 attainment rate based on occupational group's Canadian labour market availability (by percentage) | 2020 attainment rate based on occupational group's Canadian labour market availability (by percentage) |
|---|---|---|
| Senior managers | 35.0 | 41.5 |
| Middle and other managers | 48.8 | 49.3 |
| Professionals | 54.4 | 56.1 |
| Semi-professionals and technicians | 63.4 | 65.2 |
| Supervisors | 58.7 | 63.5 |
| Supervisors: crafts and trades | 82.1 | 82.5 |
| Administrative and senior clerical personnel | 52.4 | 57.5 |
| Skilled sales and service personnel | 43.0 | 54.4 |
| Skilled crafts and trades workers | 76.7 | 83.8 |
| Clerical personnel | 53.2 | 52.5 |
| Intermediate sales and service personnel | 54.4 | 62.4 |
| Semi-skilled manual workers | 71.2 | 71.5 |
| Other sales and service personnel | 59.5 | 67.9 |
| Other manual workers | 88.1 | 68.6 |
| Total | 57.8 | 59.9 |
Salaries
The pay gap is reflected in the salary data reported for Aboriginal women working in permanent full-time positions in 2020:
- a higher percentage of Aboriginal women (32.1%) earned salaries below $50,000 than Aboriginal men (20.7%), all women (25.1%) and all men (17.6%)
- Aboriginal women were less likely (55.5%) to earn $50,000 to $99,999, compared to Aboriginal men (56.5%), all women (56.7%) and all men (55.8%)
- a smaller percentage of Aboriginal women (12.5%) earned salaries of $100,000 or more, compared to Aboriginal men (22.8%), all women (18.2%) and all men (26.6%)
The following are the salary analyses of Aboriginal women in permanent part-time positions in 2020:
- a higher percentage of Aboriginal women (51.3%) earned salaries below $25,000 than Aboriginal men (48.2%) and all women (47.8%), but not all men (54.0%)
- Aboriginal women were less likely (41.9%) to earn $25,000 to $49,999, compared to Aboriginal men (43.5%) and all women (43.9%), but not all men (37.3%)
- a smaller percentage of Aboriginal women (6.9%) earned salaries of $50,000 or more, compared to Aboriginal men (8.3%), all women (8.3%) and all men (8.6%)
Additional data on the representation, attainment rates, hires, promotions and terminations of employees by designated group and sector is provided in Appendix A.
Persons with disabilities
The number of employed persons with disabilities increased from 26,673 in 2019 to 28,811 in 2020, with a proportional growth of 8.0%. The representation of persons with disabilities also increased from 3.5% in 2019 to 3.9% in 2020.
Over the past decade, a higher number of persons with disabilities left than entered the workforce at the all sectors combined level. This trend continued in 2020, where the number of persons with disabilities who left the workforce was nearly double the number who entered. The percentages of employees with disabilities leaving the workforce also exceeded the percentages of employees with disabilities entering the workforce in all sectors combined and in each of the 4 sectors in 2020. At the overall level, this designated group’s share of promotions has been the same as their representation since 2018.
Chart 6 shows that the representation of persons with disabilities reached its highest level of 3.5% in 2019, an increase from the initial low of 1.6% in 1987. The 2019 representation rate is 5.6 percentage points below the 9.1% Canadian LMA.
Chart 6: Representation and Canadian LMA* of persons with disabilities from 1987 to 2020 (by percentage)

* Sources: Statistics Canada, 1986 and 1991 Health and Activity Limitation Survey; 2001 and 2006 Participation and Activity Limitation Survey; and 2012 and 2017 Canadian Survey on Disability.
Chart 6: text description
| Year | Canadian labour market availability (by percentage) | Representation (by percentage) |
|---|---|---|
| 1987 | 5.4 | 1.6 |
| 1988 | 5.4 | 1.7 |
| 1989 | 5.4 | 2.3 |
| 1990 | 5.4 | 2.4 |
| 1991 | 6.5 | 2.5 |
| 1992 | 6.5 | 2.5 |
| 1993 | 6.5 | 2.6 |
| 1994 | 6.5 | 2.6 |
| 1995 | 6.5 | 2.7 |
| 1996 | 6.5 | 2.7 |
| 1997 | 6.5 | 2.3 |
| 1998 | 6.5 | 2.3 |
| 1999 | 6.5 | 2.4 |
| 2000 | 6.5 | 2.3 |
| 2001 | 5.3 | 2.3 |
| 2002 | 5.3 | 2.3 |
| 2003 | 5.3 | 2.3 |
| 2004 | 5.3 | 2.5 |
| 2005 | 5.3 | 2.7 |
| 2006 | 4.9 | 2.7 |
| 2007 | 4.9 | 2.7 |
| 2008 | 4.9 | 2.7 |
| 2009 | 4.9 | 2.7 |
| 2010 | 4.9 | 2.6 |
| 2011 | 4.9 | 2.6 |
| 2012 | 4.9 | 2.6 |
| 2013 | 4.9 | 2.7 |
| 2014 | 4.9 | 2.8 |
| 2015 | 4.9 | 3.0 |
| 2016 | 4.9 | 3.3 |
| 2017 | 9.1 | 3.3 |
| 2018 | 9.1 | 3.4 |
| 2019 | 9.1 | 3.5 |
| 2020 | 9.1 | 3.9 |
Note: In 2001, Statistics Canada began using the World Health Organization’s International Classification of Functioning, Disability and Health framework to define disability rather than the 1980 International Classification of Impairments, Disabilities, and Handicaps; this resulted in a drop in LMA. In 2017, Statistics Canada introduced a new methodology for gathering data on persons with disabilities that resulted in a significant increase in LMA for this designated group.
Occupational group
Chart 7 shows that at the overall level between 2019 and 2020, the representation of persons with disabilities continued to be below the corresponding occupational group’s Canadian LMA in all occupational groups. Among all occupational groups, the attainment rate is highest for persons with disabilities in the middle and other managers group.
Chart 7: Attainment rate (occupational group’s Canadian LMA*) of persons with disabilities in 2019 and 2020 (by percentage)

* Source: Statistics Canada, 2017 Canadian Survey on Disability.
Chart 7: text description
| Employment equity occupational group | 2019 attainment rate based on occupational group's Canadian labour market availability (by percentage) | 2020 attainment rate based on occupational group's Canadian labour market availability (by percentage) |
|---|---|---|
| Senior managers | 63.9 | 68.4 |
| Middle and other managers | 73.3 | 85.9 |
| Professionals | 42.1 | 50.0 |
| Semi-professionals and technicians | 33.1 | 35.7 |
| Supervisors | 14.7 | 17.3 |
| Supervisors: crafts and trades | 23.3 | 23.1 |
| Administrative and senior clerical personnel | 44.4 | 46.8 |
| Skilled sales and service personnel | 48.2 | 57.5 |
| Skilled crafts and trades workers | 29.8 | 34.6 |
| Clerical personnel | 49.4 | 51.5 |
| Intermediate sales and service personnel | 32.7 | 41.8 |
| Semi-skilled manual workers | 24.4 | 23.1 |
| Other sales and service personnel | 37.8 | 42.2 |
| Other manual workers | 35.6 | 34.4 |
| Total | 37.9 | 43.0 |
Salaries
The pay gap is reflected in the salary data reported for women with disabilities working in permanent full-time positions in 2020:
- a higher percentage of women with disabilities (25.9%) earned salaries below $50,000 than men with disabilities (18.3%), all women (25.1%) and all men (17.6%)
- women with disabilities were more likely (57.9%) to earn $50,000 to $99,999, compared to men with disabilities (57.3%), all women (56.7%) and all men (55.8%)
- a smaller percentage of women with disabilities (16.2%) earned salaries of $100,000 or more, compared to men with disabilities (24.4%), all women (18.2%) and all men (26.6%)
The following are the salary analyses of women with disabilities in permanent part-time positions in 2020:
- a smaller percentage of women with disabilities (43.3%) earned salaries below $25,000 than men with disabilities (45.6%), all women (47.8%) and all men (54.0%)
- women with disabilities were more likely (49.4%) to earn $25,000 to $49,999, compared to men with disabilities (45.6%), all women (43.9%) and all men (37.3%)
- a smaller percentage of women with disabilities (7.3%) earned salaries of $50,000 or more, compared to men with disabilities (8.8%), all women (8.3%) and all men (8.6%)
Additional data on the representation, attainment rates, hires, promotions and terminations of employees by designated group and sector is provided in Appendix A.
Members of visible minorities
The number of employed members of visible minorities increased from 188,335 in 2019 to 191,389 in 2020, with a proportional growth of 1.6%. The representation of members of visible minorities also increased from 24.4% to 26.0%.
In 2020, the percentages of members of visible minorities entering the workforce were higher than the percentages of members of visible minorities leaving the workforce in all sectors combined and in 3 of the 4 sectors. The only exception was the transportation sector, where the percentages of members of visible minorities who entered and left the workforce were the same. This designated group also continued to receive a higher share of promotions than their representation level at the overall level and in each sector, with the exception of the ‘other’ sector.
Chart 8 shows that since 1987, the representation of members of visible minorities has been increasing steadily; this designated group has made the most progress in overall representation since 1987.
Chart 8: Representation and Canadian LMA* of members of visible minorities from 1987 to 2020 (by percentage)

* Sources: Statistics Canada, 1986 to 2016 Census and 2011 National Household Survey.
Chart 8: text description
| Year | Canadian labour market availability (by percentage) | Representation (by percentage) |
|---|---|---|
| 1987 | 6.3 | 5.0 |
| 1988 | 6.3 | 5.7 |
| 1989 | 6.3 | 6.7 |
| 1990 | 6.3 | 7.1 |
| 1991 | 9.1 | 7.6 |
| 1992 | 9.1 | 7.9 |
| 1993 | 9.1 | 8.1 |
| 1994 | 9.1 | 8.2 |
| 1995 | 9.1 | 8.8 |
| 1996 | 10.3 | 9.2 |
| 1997 | 10.3 | 9.7 |
| 1998 | 10.3 | 9.9 |
| 1999 | 10.3 | 10.4 |
| 2000 | 10.3 | 10.7 |
| 2001 | 12.6 | 11.7 |
| 2002 | 12.6 | 12.2 |
| 2003 | 12.6 | 12.7 |
| 2004 | 12.6 | 13.3 |
| 2005 | 12.6 | 14.1 |
| 2006 | 15.3 | 14.9 |
| 2007 | 15.3 | 15.9 |
| 2008 | 15.3 | 16.6 |
| 2009 | 15.3 | 17.1 |
| 2010 | 15.3 | 17.8 |
| 2011 | 17.8 | 18.2 |
| 2012 | 17.8 | 18.6 |
| 2013 | 17.8 | 19.6 |
| 2014 | 17.8 | 20.4 |
| 2015 | 17.8 | 21.2 |
| 2016 | 21.3 | 22.2 |
| 2017 | 21.3 | 22.8 |
| 2018 | 21.3 | 23.8 |
| 2019 | 21.3 | 24.4 |
| 2020 | 21.3 | 26.0 |
Occupational group
Chart 9 shows that at the overall level, the attainment rates (based on occupational groups’ Canadian LMA) of members of visible minorities are above the 100% threshold in 9 of the 14 occupational groups in 2020, and reached full representation and the highest attainment rate in the administrative and senior clerical personnel occupational group. Among the 4 designated groups, members of visible minorities have the highest attainment rate in the senior managers occupational group. This designated group’s representation continued to exceed the corresponding occupational group’s Canadian LMA in the middle and other managers and professionals occupational groups that are important feeder groups to the senior managers occupational group.
Chart 9: Attainment rate (occupational group’s Canadian LMA*) of members of visible minorities in 2019 and 2020 (by percentage)
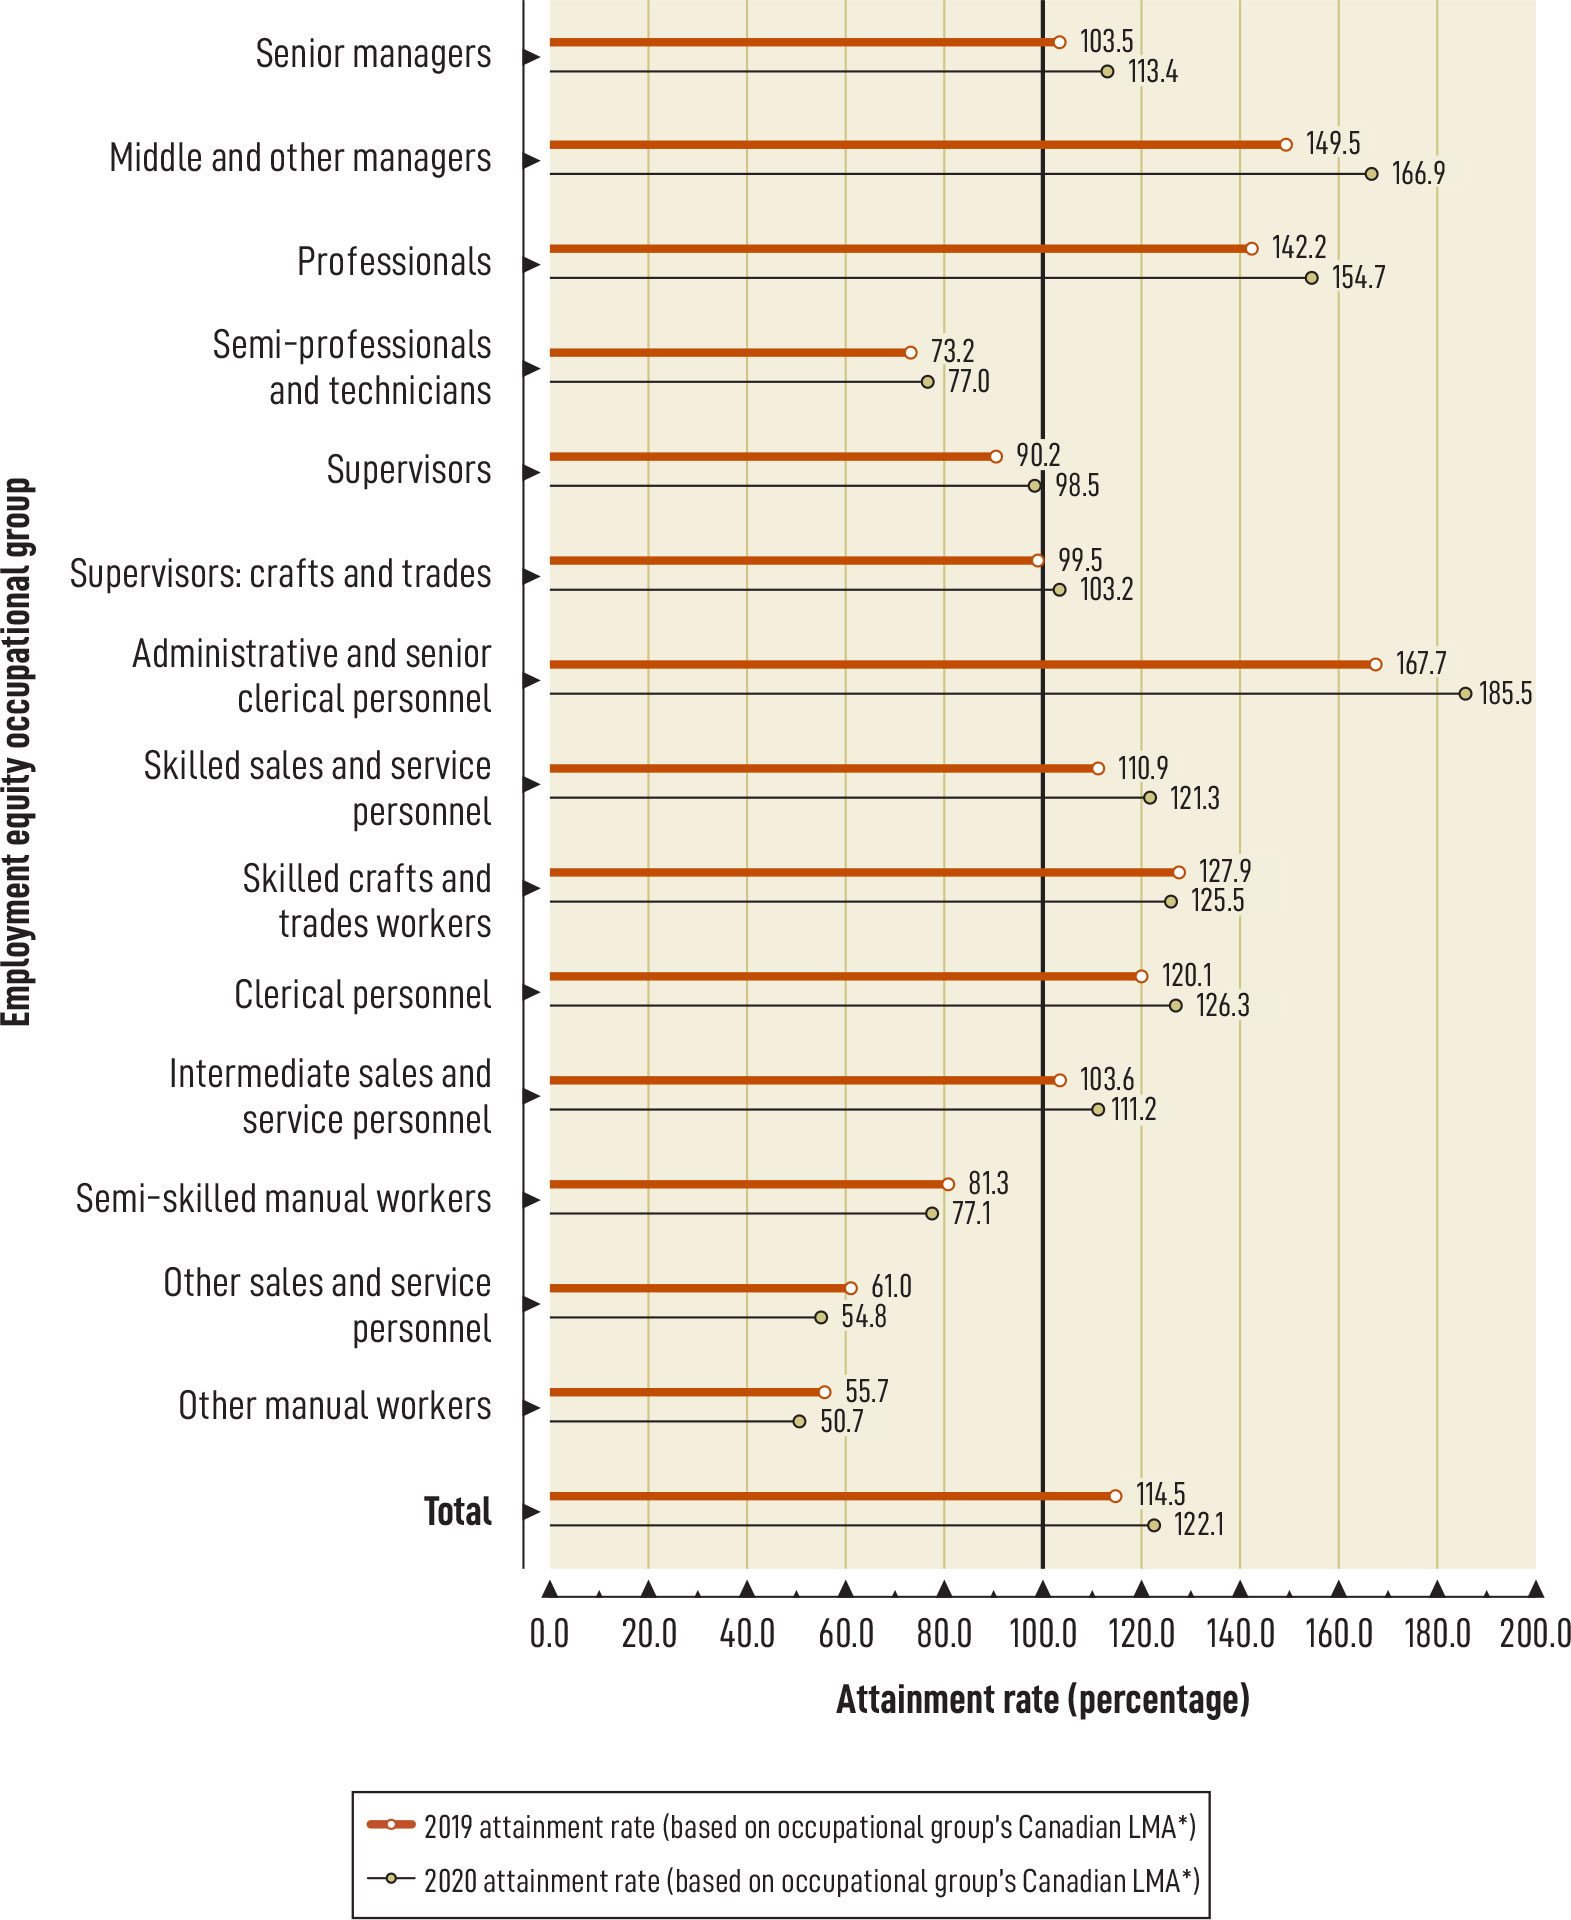
* Source: Statistics Canada, 2016 Census.
Chart 9: text description
| Employment equity occupational group | 2019 attainment rate based on occupational group's Canadian labour market availability (by percentage) | 2020 attainment rate based on occupational group's Canadian labour market availability (by percentage) |
|---|---|---|
| Senior managers | 103.5 | 113.4 |
| Middle and other managers | 149.5 | 166.9 |
| Professionals | 142.2 | 154.7 |
| Semi-professionals and technicians | 73.2 | 77.0 |
| Supervisors | 90.2 | 98.5 |
| Supervisors: crafts and trades | 99.5 | 103.2 |
| Administrative and senior clerical personnel | 167.7 | 185.5 |
| Skilled sales and service personnel | 110.9 | 121.3 |
| Skilled crafts and trades workers | 127.9 | 125.5 |
| Clerical personnel | 120.1 | 126.3 |
| Intermediate sales and service personnel | 103.6 | 111.2 |
| Semi-skilled manual workers | 81.3 | 77.1 |
| Other sales and service personnel | 61.0 | 54.8 |
| Other manual workers | 55.7 | 50.7 |
| Total | 114.5 | 122.1 |
Salaries
The pay gap is reflected in the salary data reported for visible minority women working in permanent full-time positions in 2020:
- a higher percentage of visible minority women (25.9%) earned salaries below $50,000 than visible minority men (19.7%), all women (25.1%) and all men (17.6%)
- the same percentage of visible minority women and visible minority men (55.9%) earned $50,000 to $99,999, compared to all women (56.7%) and all men (55.8%)
- a smaller percentage of visible minority women (18.1%) earned salaries of $100,000 or more, compared to visible minority men (24.4%), all women (18.2%) and all men (26.6%)
The following are the salary analyses of visible minority women in permanent part-time positions in 2020:
- a smaller percentage of visible minority women (49.7%) earned salaries below $25,000 than visible minority men (50.3%) and all men (54.0%), but not all women (47.8%)
- a higher percentage of visible minority women (44.8%) earned $25,000 to $49,999, compared to visible minority men (43.3%), all women (43.9%) and all men (37.3%)
- a smaller percentage of visible minority women (5.5%) earned salaries of $100,000 or more, compared to visible minority men (6.3%), all women (8.3%) and all men (8.6%)
Additional data on the representation, attainment rates, hires, promotions and terminations of employees by designated group and sector is provided in Appendix A.
Section 4: Employment equity highlights
This section provides an overview of the initiatives and activities that support the achievement of employment equity objectives, including:
- the Federal Contractors Program
- the Workplace Opportunities: Removing Barriers to Equity (grants and contributions)
- pay gap reporting
- review of the Employment Equity Act, and
- other legislative initiatives that support diversity and inclusion
Federal Contractors Program
The aim of the Federal Contractors Program (FCP) is to advance social and economic development objectives through government procurement by requiring organizations that are under contract with the Government of Canada to implement employment equity in their workplaces. It applies to provincially regulated employers that have a workforce in Canada of 100 or more employees and have a federal government goods and services contract valued at $1 million or more (including applicable taxes).
As part of their obligations, contractors must collect and analyze data about their workforce and, where gaps in representation exist, set goals to increase representation for the 4 designated groups: women, Aboriginal peoples, persons with disabilities and members of visible minorities. Contractors are required to make progress towards meeting their goals and achieving an equitable workforce.
As of December 31, 2020, 371 (362 certified and 9 voluntary) employers were covered under the FCP. In 2020, a total of 23 certified employers were added and 3 withdrew due to ceasing to operate in Canada or employing fewer than 100 employees.
The Labour Program conducts compliance assessments to ensure that contractors fulfill the terms of the FCP. A first compliance assessment is conducted 1 year after an employer has been awarded a contract. Subsequent assessments are conducted 4 years after the contract award date and every 3 years thereafter to verify that progress is being made. In 2020, the Labour Program completed 8 first-year assessments and 35 subsequent assessments for a combined total of 43 compliance assessments, with all contractors found to be in compliance.
Workplace Opportunities: Removing Barriers to Equity
Workplace Opportunities: Removing Barriers to Equity (WORBE) is a grants and contributions initiative that supports private-sector employers subject to the Act in their efforts to improve the representation and participation of designated group members in areas with low representation. Projects funded through WORBE seek to raise awareness, identify barriers and best practices, or test innovative approaches in employment equity.
Previously, $500,000 per fiscal year in funding was made available, which was later increased to $2 million in 2021-22. Beginning in 2022-23, funding of $3 million per fiscal year is available to eligible recipients, including federally regulated private-sector employers, employer associations or councils, sector associations or councils, non-governmental organizations, not-for-profit organizations, and academic institutions. Each project can receive a maximum of $500,000 per fiscal year and $1.5 million in total contributions funding. Projects must conclude within 60 months.
Since its launch in 2014, WORBE has supported 16 projects, as follows:
- 4 grant projects completed in 2016
- 2 contribution agreements concluded in 2017
- 3 contribution agreements concluded in 2018, and
- 7 projects in progress and will conclude in spring 2022
A contribution agreement valued at nearly $1.5 million with Ryerson University for the ALiGN Network for Employment Equity and Inclusion project began in 2018 and will conclude in 2022. This project focuses on women, Aboriginal peoples and persons with disabilities in the banking and financial services, communications and transportation sectors. The objectives of this project are to:
- improve understanding among stakeholders in the 3 sectors of industry-specific barriers to inclusion, including systemic barriers, implicit bias and non-essential qualifications in high demand occupations, and of effective processes to overcome them
- expand the pool of the 3 designated groups for select job classifications across the 3 sectors using evidence-based recruitment to minimize unconscious bias and industry-tailored skills training, and
- develop new inclusion tools and guides to promote evidence-based approaches to recruitment, based on research and practices for the 3 sectors
An agreement of nearly $140,000 was recently signed with Indigenous Works and 5 projects focusing on Black, Indigenous and People of Colour (BIPOC) for a value of about $1.5 million were put in place in 2021.
For 2022 to 2023, a separate intake process will be conducted to allocate future WORBE funding.
Pay gap reporting
In 2018, the Government of Canada introduced a new pay gap reporting measure that requires federally regulated private-sector employers subject to the Act to report new salary data as part of their annual reporting requirements. The new pay gap reporting measure will provide Canadians with user-friendly and comparable online information on pay gaps among these employers. Pay gap reporting will go beyond addressing the gender wage gap by highlighting pay gaps that affect all 4 designated groups, making Canada the first country to make this level of information publicly available. Further, it will give employers an opportunity to review their practices, show leadership in reducing pay gaps and improve employment outcomes, thus helping to shift business culture and expectations towards greater equality.
After the Employment Equity Regulations were amended in 2020, the new measure came into force on January 1, 2021 and will require employers to report new salary data in their 2021 annual employment equity reports to be submitted by June 1, 2022.
The Workplace Equity Information Management System (WEIMS) that supports employers in meeting their reporting obligations has been modified and was launched in October 2021. The modified WEIMS will facilitate the gathering and reporting of the new salary-related data.
Review of the Employment Equity Act
In 2020, $3.2 million was allocated to support a task force to review the Employment Equity Act. The Employment Equity Act Review Task Force was launched in July 2021 with a mandate to advise the Minister of Labour on how to modernize and strengthen the federal employment equity framework and its supporting programs. The Task Force will study, consult and advise on how a renewed Employment Equity Act could help ensure that Canada’s economic recovery is equitable, inclusive and fair.
The Task Force is composed of 13 members, who have a wide range of expertise and experience related to equity, including workplace equity. A Secretariat, housed within the Labour Program, has been established to support the Task Force and is responsible for providing policy advice, conducting research, facilitating consultations and preparing briefing materials.
Other legislative initiatives in support of inclusive workplaces
Recently, a number of legislative and regulatory initiatives were implemented that further support diversity and inclusion in federally-regulated workplaces, including the following, which are organized by when they came into force:
- September 2020: interns became entitled to full labour standards protections under Part III (labour standards) of the Canada Labour Code, including the right to be paid at least the minimum wage. Student interns who are fulfilling the requirements of an educational program may be unpaid and became entitled to certain labour standards protections, such as standard hours of work, 30-minute breaks and general holidays
- January 2021: amendments to Part II (occupational health and safety) of the Canada Labour Code and new Work Place Harassment and Violence Prevention Regulations came into force to protect workers against all forms of harassment and violence
- August 2021: the Pay Equity Act and supporting regulations came into force to ensure that workers receive equal pay for work of equal value, and
- December 2021: amendments to Part III of the Canada Labour Code introduced a new federal minimum wage ($15 per hour) and extended the maximum duration of medical leave from 17 to 27 weeks.
Conclusion
This report contains a broad analysis of the results that federally regulated private-sector employers have achieved in implementing employment equity in their workplaces for the 2020 calendar year. This year’s report covers 562 employers with a combined workforce of 735,790 employees, a decrease of 4.7% from the 772,402 employees reported for 2019, which could be attributed to the COVID-19 pandemic; however, specific reasons for this decline are not captured in the reporting process. There is however, a 23.6% increase in the workforce coverage since the gathering of employment equity data started in 1987, when 373 employers reported on their workforce data for 595,417 employees.
Between 2019 and 2020, the number of employees decreased in 3 of the 4 sectors. The banking and financial services sector was the only sector that saw a proportional increase in its workforce. The highest proportional decreases in the number of employees were observed in the communications and the transportation sectors, especially in the air transportation subsector.
At the overall workforce level, the representation of members of visible minorities has continued to consistently exceed the Canadian LMA since 2007, reaching 26.0% in 2020. Women, Aboriginal peoples and persons with disabilities continue to be under-represented. Women is the only designated group that posted a decrease in representation at the overall workforce level in 2020.
Mixed improvements in the representation of the designated groups were observed at the sector level. Increases in representation were noted for Aboriginal peoples, persons with disabilities and members of visible minorities in the banking and financial services sector. The representation of women, persons with disabilities and members of visible minorities increased in the communications sector. Aboriginal peoples was the only designated group that saw an increase in representation in the transportation sector. The representation of women, Aboriginal peoples and members of visible minorities improved in the ‘other’ sector.
At the occupational group level, improvements in representation were noted for all designated groups in the senior managers, semi-professionals and technicians, and skilled sales and service personnel positions at the all employers combined level. Although members of visible minorities have attained a representation rate that exceeds LMA at the overall level, they are under-represented in some sectors, subsectors and occupational groups.
Following the amendments to the Employment Equity Regulations, the 2021 annual employment equity reports to be submitted in 2022 will be requiring employers to provide new salary-related data to support pay gap reporting. The employer reports will give Canadians user-friendly and comparable online information on pay gaps starting next year.
Overall, a number of studies have shown that the COVID-19 pandemic has intensified inequalities for designated group members and other marginalized groups in workplaces throughout Canada to varying degrees. In the federally-regulated private sector, however, the negative impacts were minimal, with only the air transportation sub-sector being greatly impacted by the effects of COVID-19. As we look toward Canada’s economic recovery and growth, it is important to keep on ensuring that everyone has access to equal employment opportunities. Employers are encouraged to continue their efforts to eliminate barriers to recruitment, promotion and retention of the designated groups and contribute to the creation of safe, fair and productive workplaces for all Canadians.
Appendix A: Federally regulated private-sector employers tables
The following tables consolidate data from the annual reports submitted by federally regulated private-sector employers. To allow for comparative analysis, some of the data from 1987 (the year when data was first collected) is included with 2019 and 2020 data.
Tables 1.1 to 3.4 in this Appendix present data aggregated to include permanent full-time, permanent part-time and temporary employees. Tables 4.1 to 4.10 summarize information for the 4 industrial sectors, including: number, representation, shares of hires, promotions and terminations, as well as the net effect of hires less terminations. Tables 5.1 to 6.4 present salary data for permanent full-time and permanent part-time employees respectively.
List of tables
- Table 1.1: Representation and availability of women in the federally-regulated private sector by census metropolitan area, province and territory in 1987, 2019 and 2020 (by percentage)
- Table 1.2: Representation and availability of Aboriginal peoples in the federally-regulated private sector by census metropolitan area, province and territory in 1987, 2019 and 2020 (by percentage)
- Table 1.3: Representation and availability of persons with disabilities in the federally-regulated private sector by census metropolitan area, province and territory in 1987, 2019 and 2020 (by percentage)
- Table 1.4: Representation and availability of members of visible minorities in the federally-regulated private sector by census metropolitan area, province and territory in 1987, 2019 and 2020 (by percentage)
- Table 2.1: Representation and attainment rate (sector availability) of women in the banking and financial services sector by occupational group in 2019 and 2020 (by percentage)
- Table 2.2: Representation and attainment rate (sector availability) of women in the communications sector by occupational group in 2019 and 2020 (by percentage)
- Table 2.3: Representation and attainment rate (sector availability) of women in the transportation sector by occupational group in 2019 and 2020 (by percentage)
- Table 2.4: Representation and attainment rate (sector availability) of women in the ‘other’ sector by occupational group in 2019 and 2020 (by percentage)
- Table 2.5: Representation and attainment rate (sector availability) of Aboriginal peoples in the banking and financial services sector by occupational group in 2019 and 2020 (by percentage)
- Table 2.6: Representation and attainment rate (sector availability) of Aboriginal peoples in the communications sector by occupational group in 2019 and 2020 (by percentage)
- Table 2.7: Representation and attainment rate (sector availability) of Aboriginal peoples in the transportation sector by occupational group in 2019 and 2020 (by percentage)
- Table 2.8: Representation and attainment rate (sector availability) of Aboriginal peoples in the ‘other’ sector by occupational group in 2019 and 2020 (by percentage)
- Table 2.9: Representation and attainment rate (sector availability) of members of visible minorities in the banking and financial services sector by occupational group in 2019 and 2020 (by percentage)
- Table 2.10: Representation and attainment rate (sector availability) of members of visible minorities in the communications sector by occupational group in 2019 and 2020 (by percentage)
- Table 2.11: Representation and attainment rate (sector availability) of members of visible minorities in the transportation sector by occupational group in 2019 and 2020 (by percentage)
- Table 2.12: Representation and attainment rate (sector availability) of members of visible minorities in the ‘other’ sector by occupational group in 2019 and 2020 (by percentage)
- Table 2.13: Representation and attainment rate (Canadian availability) of women in all sectors by occupational group in 2019 and 2020 (by percentage)
- Table 2.14: Representation and attainment rate (Canadian availability) of Aboriginal peoples in all sectors by occupational group in 2019 and 2020 (by percentage)
- Table 2.15: Representation and attainment rate (Canadian availability) of persons with disabilities in all sectors by occupational group in 2019 and 2020 (by percentage)
- Table 2.16: Representation and attainment rate (Canadian availability) of members of visible minorities in all sectors by occupational group in 2019 and 2020 (by percentage)
- Table 3.1: Distribution of women and men in the federally-regulated private sector by occupational group in 2019 and 2020 (by percentage)
- Table 3.2: Distribution of Aboriginal and non-Aboriginal peoples in the federally-regulated private sector by occupational group in 2019 and 2020 (by percentage)
- Table 3.3: Distribution of persons with and without disabilities in the federally-regulated private sector by occupational group in 2019 and 2020 (by percentage)
- Table 3.4: Distribution of members and non-members of visible minorities in the federally-regulated private sector by occupational group in 2019 and 2020 (by percentage)
- Table 4.1: Number, hires, promotions, terminations and net effect of designated group members in the banking and financial services sector in 2019 and 2020
- Table 4.2: Representation and shares of hires, promotions and terminations of designated group members in the banking and financial services sector in 2019 and 2020 (by percentage)
- Table 4.3: Number, hires, promotions, terminations and net effect of designated group members in the communications sector in 2019 and 2020
- Table 4.4: Representation and shares of hires, promotions and terminations of designated group members in the communications sector in 2019 and 2020 (by percentage)
- Table 4.5: Number, hires, promotions, terminations and net effect of designated group members in the transportation sector in 2019 and 2020
- Table 4.6: Representation and shares of hires, promotions and terminations of designated group members in the transportation sector in 2019 and 2020 (by percentage)
- Table 4.7: Number, hires, promotions, terminations and net effect of designated group members in the ‘other’ sector in 2019 and 2020
- Table 4.8: Representation and shares of hires, promotions and terminations of designated group members in the ‘other’ sector in 2019 and 2020 (by percentage)
- Table 4.9: Number, hires, promotions, terminations and net effect of designated group members in all sectors in 2019 and 2020
- Table 4.10: Representation and shares of hires, promotions and terminations of designated group members in all sectors in 2019 and 2020 (by percentage)
- Table 5.1: Number and representation of men and women in permanent full-time employment in the federally-regulated private sector by salary range as of December 31, 2020
- Table 5.2: Number and representation of Aboriginal peoples in permanent full-time employment in the federally-regulated private sector by salary range as of December 31, 2020
- Table 5.3: Number and representation of persons with disabilities in permanent full-time employment in the federally-regulated private sector by salary range as of December 31, 2020
- Table 5.4: Number and representation of members of visible minorities in permanent full-time employment in the federally-regulated private sector by salary range as of December 31, 2020
- Table 6.1: Number and representation of men and women in permanent part-time employment in the federally-regulated private sector by salary range as of December 31, 2020
- Table 6.2: Number and representation of Aboriginal peoples in permanent part-time employment in the federally-regulated private sector by salary range as of December 31, 2020
- Table 6.3: Number and representation of persons with disabilities in permanent part-time employment in the federally-regulated private sector by salary range as of December 31, 2020
- Table 6.4: Number and representation of members of visible minorities in permanent part-time employment in the federally-regulated private sector by salary range as of December 31, 2020
| Census metropolitan area, province and territory | 1987 representation | 2019 representation | 2020 representation | 2016 availability* |
|---|---|---|---|---|
| Halifax | 41.2 | 41.1 | 40.5 | 49.6 |
| Montréal | 39.0 | 39.4 | 39.3 | 48.5 |
| Toronto | 47.1 | 43.8 | 43.7 | 48.7 |
| Winnipeg | 32.7 | 32.0 | 31.9 | 48.6 |
| Regina | 42.9 | 46.3 | 47.3 | 48.1 |
| Calgary | 47.6 | 42.3 | 41.3 | 47.2 |
| Edmonton | 44.5 | 38.0 | 37.2 | 47.1 |
| Vancouver | 40.4 | 38.1 | 37.2 | 48.5 |
| Newfoundland and Labrador | 38.4 | 42.2 | 42.9 | 48.2 |
| Prince Edward Island | 38.0 | 34.2 | 31.7 | 49.4 |
| Nova Scotia | 34.4 | 41.8 | 41.1 | 49.2 |
| New Brunswick | 32.2 | 47.0 | 45.8 | 48.5 |
| Quebec | 39.8 | 38.0 | 37.7 | 48.1 |
| Ontario | 44.2 | 41.7 | 41.4 | 48.6 |
| Manitoba | 30.5 | 31.3 | 31.4 | 47.9 |
| Saskatchewan | 35.1 | 37.2 | 36.7 | 47.5 |
| Alberta | 45.3 | 39.9 | 39.2 | 46.7 |
| British Columbia | 41.5 | 37.4 | 36.4 | 48.4 |
| Yukon | 31.4 | 40.8 | 38.9 | 49.7 |
| Northwest Territories | 21.9 | 27.4 | 27.7 | 47.8 |
| Nunavut | N/A | 22.3 | 22.8 | 48.4 |
| Canada | 40.9 | 39.5 | 39.1 | 48.2 |
* Source: Statistics Canada, 2016 Census.
| Census metropolitan area, province and territory | 1987 representation | 2019 representation | 2020 representation | 2016 availability* |
|---|---|---|---|---|
| Halifax | 0.5 | 2.6 | 2.7 | 3.8 |
| Montréal | 0.3 | 0.8 | 0.9 | 0.8 |
| Toronto | 0.6 | 1.0 | 1.1 | 0.8 |
| Winnipeg | 0.8 | 7.6 | 7.3 | 9.8 |
| Regina | 0.4 | 3.2 | 3.6 | 6.8 |
| Calgary | 0.5 | 2.0 | 2.0 | 2.7 |
| Edmonton | 0.7 | 3.0 | 3.2 | 5.0 |
| Vancouver | 0.5 | 2.1 | 2.0 | 2.3 |
| Newfoundland and Labrador | 0.6 | 6.1 | 6.3 | 8.7 |
| Prince Edward Island | 0.2 | 1.2 | 0.9 | 1.8 |
| Nova Scotia | 0.4 | 2.6 | 2.8 | 5.3 |
| New Brunswick | 0.4 | 1.6 | 1.7 | 3.6 |
| Quebec | 0.4 | 1.1 | 1.2 | 2.1 |
| Ontario | 0.7 | 1.5 | 1.6 | 2.5 |
| Manitoba | 1.0 | 8.6 | 8.3 | 13.2 |
| Saskatchewan | 1.4 | 6.5 | 6.7 | 11.1 |
| Alberta | 0.7 | 2.8 | 2.8 | 5.2 |
| British Columbia | 0.7 | 3.3 | 3.5 | 5.2 |
| Yukon | 3.8 | 8.3 | 6.0 | 19.9 |
| Northwest Territories | 9.6 | 8.4 | 9.7 | 41.7 |
| Nunavut | N/A | 28.1 | 33.0 | 75.6 |
| Canada | 0.7 | 2.3 | 2.4 | 4.0 |
* Source: Statistics Canada, 2016 Census.
| Census metropolitan area, province and territory | 1987 representation | 2019 representation | 2020 representation | 2017 availability* |
|---|---|---|---|---|
| Halifax | 1.6 | 5.4 | 7.0 | N/A |
| Montréal | 1.1 | 2.3 | 2.6 | N/A |
| Toronto | 1.5 | 3.7 | 4.3 | N/A |
| Winnipeg | 1.8 | 3.4 | 3.7 | N/A |
| Regina | 2.4 | 3.7 | 3.9 | N/A |
| Calgary | 1.9 | 3.3 | 3.8 | N/A |
| Edmonton | 2.0 | 3.6 | 4.1 | N/A |
| Vancouver | 1.5 | 3.0 | 3.3 | N/A |
| Newfoundland and Labrador | 1.0 | 2.9 | 3.5 | 8.9 |
| Prince Edward Island | 1.2 | 2.4 | 2.3 | 10.2 |
| Nova Scotia | 3.5 | 5.3 | 6.7 | 13.1 |
| New Brunswick | 1.8 | 4.5 | 5.3 | 10.7 |
| Quebec | 1.1 | 2.1 | 2.4 | 6.1 |
| Ontario | 1.6 | 4.0 | 4.5 | 9.6 |
| Manitoba | 1.7 | 3.4 | 3.5 | 10.1 |
| Saskatchewan | 1.8 | 3.4 | 3.6 | 9.1 |
| Alberta | 1.9 | 3.4 | 3.9 | 9.9 |
| British Columbia | 1.7 | 3.3 | 3.6 | 11.0 |
| Yukon | 0.8 | 3.2 | 4.8 | 11.3 |
| Northwest Territories | 1.4 | 1.8 | 2.5 | 9.8 |
| Nunavut | N/A | 2.0 | 1.9 | 8.2 |
| Canada | 1.6 | 3.5 | 3.9 | 9.1 |
* Source: Statistics Canada, 2017 Canadian Survey on Disability.
| Census metropolitan area, province and territory | 1987 representation | 2019 representation | 2020 representation | 2016 availability* |
|---|---|---|---|---|
| Halifax | 1.9 | 10.7 | 12.1 | 9.7 |
| Montréal | 3.0 | 19.1 | 20.0 | 20.7 |
| Toronto | 12.0 | 39.6 | 43.4 | 48.8 |
| Winnipeg | 2.9 | 22.2 | 23.9 | 25.2 |
| Regina | 1.6 | 17.1 | 19.2 | 16.9 |
| Calgary | 5.6 | 26.0 | 26.8 | 31.3 |
| Edmonton | 4.4 | 24.9 | 26.1 | 26.5 |
| Vancouver | 7.9 | 37.4 | 39.1 | 45.9 |
| Newfoundland and Labrador | 0.7 | 3.4 | 3.4 | 2.3 |
| Prince Edward Island | 1.0 | 3.1 | 3.3 | 4.2 |
| Nova Scotia | 1.3 | 9.1 | 10.2 | 5.8 |
| New Brunswick | 1.1 | 6.4 | 8.0 | 3.0 |
| Quebec | 2.6 | 15.9 | 16.4 | 12.1 |
| Ontario | 7.3 | 30.4 | 33.0 | 27.9 |
| Manitoba | 2.6 | 18.6 | 19.9 | 17.8 |
| Saskatchewan | 1.2 | 11.2 | 12.5 | 10.7 |
| Alberta | 4.0 | 22.1 | 23.2 | 22.3 |
| British Columbia | 6.2 | 29.8 | 30.4 | 29.2 |
| Yukon | 1.4 | 12.3 | 16.5 | 8.5 |
| Northwest Territories | 2.5 | 16.2 | 15.9 | 10.5 |
| Nunavut | N/A | 8.8 | 10.6 | 4.0 |
| Canada | 5.0 | 24.4 | 26.0 | 21.3 |
* Source: Statistics Canada, 2016 Census.
| Employment equity occupational group | 2019 representation | 2020 representation | 2016 availability (sector)* | 2019 attainment rate | 2020 attainment rate |
|---|---|---|---|---|---|
| Senior managers | 36.5 | 37.5 | 29.1 | 125.5 | 128.7 |
| Middle and other managers | 48.4 | 48.1 | 53.4 | 90.6 | 89.9 |
| Professionals | 47.0 | 46.5 | 44.9 | 104.6 | 103.5 |
| Semi-professionals and technicians | 32.2 | 32.3 | 40.2 | 80.2 | 80.4 |
| Supervisors | 70.4 | 70.2 | 70.9 | 99.3 | 98.9 |
| Supervisors: crafts and trades | 13.3 | 21.4 | 32.7 | 40.8 | 65.5 |
| Administrative and senior clerical personnel | 72.6 | 72.2 | 76.3 | 95.2 | 94.6 |
| Skilled sales and service personnel | 60.6 | 59.9 | 63.2 | 95.9 | 94.8 |
| Skilled crafts and trades workers | 12.5 | 6.7 | 10.3 | 121.4 | 64.8 |
| Clerical personnel | 65.8 | 66.0 | 76.0 | 86.5 | 86.9 |
| Intermediate sales and service personnel | 74.9 | 74.7 | 77.7 | 96.4 | 96.2 |
| Semi-skilled manual workers | 16.2 | 14.5 | 24.2 | 66.9 | 59.6 |
| Other sales and service personnel | 27.8 | 26.4 | 50.2 | 55.3 | 52.6 |
| Other manual workers | 100.0 | 100.0 | 26.6 | 375.9 | 375.9 |
| Total | 56.1 | 55.4 | 58.9 | 95.2 | 94.0 |
* Source: Statistics Canada, 2016 Census.
| Employment equity occupational group | 2019 representation | 2020 representation | 2016 availability (sector)* | 2019 attainment rate | 2020 attainment rate |
|---|---|---|---|---|---|
| Senior managers | 28.8 | 29.3 | 21.8 | 132.1 | 134.4 |
| Middle and other managers | 37.8 | 37.3 | 38.6 | 98.0 | 96.7 |
| Professionals | 38.4 | 39.1 | 44.7 | 85.8 | 87.5 |
| Semi-professionals and technicians | 27.5 | 27.0 | 31.4 | 87.6 | 86.1 |
| Supervisors | 43.9 | 45.3 | 57.7 | 76.2 | 78.6 |
| Supervisors: crafts and trades | 17.7 | 19.6 | 27.1 | 65.2 | 72.4 |
| Administrative and senior clerical personnel | 74.5 | 75.1 | 77.0 | 96.7 | 97.5 |
| Skilled sales and service personnel | 32.6 | 33.1 | 38.6 | 84.4 | 85.9 |
| Skilled crafts and trades workers | 5.1 | 5.8 | 6.6 | 78.1 | 87.4 |
| Clerical personnel | 65.3 | 64.0 | 78.0 | 83.7 | 82.1 |
| Intermediate sales and service personnel | 45.2 | 47.1 | 51.9 | 86.9 | 90.6 |
| Semi-skilled manual workers | 34.9 | 36.4 | 18.2 | 191.8 | 200.4 |
| Other sales and service personnel | 52.7 | 56.7 | 41.4 | 127.1 | 136.8 |
| Other manual workers | 0.0 | 0.0 | 17.3 | 0.0 | 0.0 |
| Total | 34.9 | 35.7 | 44.1 | 79.2 | 80.9 |
* Source: Statistics Canada, 2016 Census.
| Employment equity occupational group | 2019 representation | 2020 representation | 2016 availability (sector)* | 2019 attainment rate | 2020 attainment rate |
|---|---|---|---|---|---|
| Senior managers | 21.9 | 22.0 | 17.0 | 128.6 | 129.2 |
| Middle and other managers | 31.9 | 31.3 | 28.7 | 111.3 | 109.3 |
| Professionals | 40.1 | 40.5 | 39.2 | 102.3 | 103.1 |
| Semi-professionals and technicians | 11.5 | 12.0 | 14.2 | 80.6 | 84.0 |
| Supervisors | 53.2 | 51.7 | 45.1 | 118.0 | 114.8 |
| Supervisors: crafts and trades | 8.9 | 10.4 | 12.7 | 70.0 | 81.7 |
| Administrative and senior clerical personnel | 71.6 | 69.8 | 80.3 | 89.1 | 86.9 |
| Skilled sales and service personnel | 24.9 | 26.1 | 33.8 | 73.6 | 77.0 |
| Skilled crafts and trades workers | 4.0 | 4.2 | 3.2 | 126.2 | 130.4 |
| Clerical personnel | 46.5 | 46.0 | 48.8 | 95.2 | 94.2 |
| Intermediate sales and service personnel | 70.8 | 68.4 | 65.2 | 108.5 | 104.9 |
| Semi-skilled manual workers | 11.6 | 12.4 | 11.0 | 105.8 | 112.6 |
| Other sales and service personnel | 39.1 | 34.4 | 33.2 | 117.6 | 103.5 |
| Other manual workers | 12.5 | 15.4 | 24.7 | 50.6 | 62.6 |
| Total | 30.1 | 28.3 | 25.3 | 118.9 | 111.9 |
* Source: Statistics Canada, 2016 Census.
| Employment equity occupational group | 2019 representation | 2020 representation | 2016 availability (sector)* | 2019 attainment rate | 2020 attainment rate |
|---|---|---|---|---|---|
| Senior managers | 27.1 | 26.6 | 23.3 | 116.3 | 114.2 |
| Middle and other managers | 27.0 | 27.4 | 29.5 | 91.4 | 93.1 |
| Professionals | 39.2 | 39.8 | 41.6 | 94.3 | 95.7 |
| Semi-professionals and technicians | 25.0 | 24.3 | 36.8 | 68.1 | 66.0 |
| Supervisors | 44.4 | 44.9 | 44.8 | 99.0 | 100.0 |
| Supervisors: crafts and trades | 6.7 | 6.9 | 9.1 | 73.1 | 75.4 |
| Administrative and senior clerical personnel | 73.8 | 73.2 | 75.5 | 97.8 | 97.0 |
| Skilled sales and service personnel | 13.5 | 15.0 | 39.2 | 34.5 | 38.2 |
| Skilled crafts and trades workers | 6.5 | 6.9 | 3.4 | 194.7 | 206.1 |
| Clerical personnel | 70.6 | 70.0 | 71.0 | 99.4 | 98.5 |
| Intermediate sales and service personnel | 36.8 | 39.6 | 43.8 | 84.0 | 90.4 |
| Semi-skilled manual workers | 13.2 | 12.5 | 21.5 | 61.3 | 57.9 |
| Other sales and service personnel | 36.9 | 36.2 | 36.7 | 100.7 | 98.8 |
| Other manual workers | 12.0 | 12.9 | 22.1 | 54.2 | 58.6 |
| Total | 30.3 | 30.5 | 34.5 | 87.8 | 88.4 |
* Source: Statistics Canada, 2016 Census.
| Employment equity occupational group | 2019 representation | 2020 representation | 2016 availability (sector)* | 2019 attainment rate | 2020 attainment rate |
|---|---|---|---|---|---|
| Senior managers | 0.6 | 0.7 | 1.2 | 48.5 | 58.7 |
| Middle and other managers | 1.0 | 1.1 | 1.5 | 72.0 | 75.4 |
| Professionals | 0.9 | 1.0 | 1.1 | 87.0 | 95.5 |
| Semi-professionals and technicians | 1.2 | 1.7 | 1.6 | 75.5 | 106.7 |
| Supervisors | 1.5 | 1.9 | 2.4 | 61.8 | 79.6 |
| Supervisors: crafts and trades | 0.0 | 0.0 | 3.8 | 0.0 | 0.0 |
| Administrative and senior clerical personnel | 1.3 | 1.8 | 2.0 | 66.0 | 90.0 |
| Skilled sales and service personnel | 1.4 | 2.0 | 2.1 | 64.3 | 93.2 |
| Skilled crafts and trades workers | 6.3 | 6.7 | 5.9 | 106.3 | 113.3 |
| Clerical personnel | 1.5 | 1.5 | 2.0 | 74.9 | 75.8 |
| Intermediate sales and service personnel | 2.0 | 2.4 | 2.7 | 72.8 | 87.6 |
| Semi-skilled manual workers | 1.7 | 1.7 | 2.7 | 62.3 | 64.4 |
| Other sales and service personnel | 0.0 | 0.0 | 3.9 | 0.0 | 0.0 |
| Other manual workers | 0.0 | 0.0 | 7.3 | 0.0 | 0.0 |
| Total | 1.2 | 1.4 | 1.7 | 72.7 | 83.3 |
* Source: Statistics Canada, 2016 Census.
| Employment equity occupational group | 2019 representation | 2020 representation | 2016 availability (sector)* | 2019 attainment rate | 2020 attainment rate |
|---|---|---|---|---|---|
| Senior managers | 1.6 | 1.9 | 1.0 | 167.1 | 193.4 |
| Middle and other managers | 1.6 | 1.4 | 1.8 | 86.4 | 77.6 |
| Professionals | 1.9 | 1.9 | 1.6 | 119.8 | 117.1 |
| Semi-professionals and technicians | 2.2 | 2.1 | 3.5 | 64.6 | 61.1 |
| Supervisors | 2.2 | 2.2 | 1.0 | 211.3 | 215.4 |
| Supervisors: crafts and trades | 1.7 | 2.3 | 2.1 | 81.2 | 107.8 |
| Administrative and senior clerical personnel | 1.8 | 1.9 | 2.7 | 67.5 | 69.8 |
| Skilled sales and service personnel | 1.9 | 1.9 | 2.2 | 85.0 | 86.7 |
| Skilled crafts and trades workers | 2.8 | 3.5 | 3.1 | 92.1 | 113.3 |
| Clerical personnel | 2.3 | 2.3 | 2.9 | 78.6 | 79.9 |
| Intermediate sales and service personnel | 2.3 | 2.4 | 3.0 | 77.5 | 79.8 |
| Semi-skilled manual workers | 1.8 | 2.3 | 3.7 | 48.2 | 63.0 |
| Other sales and service personnel | 2.4 | 0.5 | 3.4 | 70.5 | 13.9 |
| Other manual workers | 0.0 | 0.0 | 5.5 | 0.0 | 0.0 |
| Total | 2.2 | 2.2 | 2.5 | 86.1 | 88.3 |
* Source: Statistics Canada, 2016 Census.
| Employment equity occupational group | 2019 representation | 2020 representation | 2016 availability (sector)* | 2019 attainment rate | 2020 attainment rate |
|---|---|---|---|---|---|
| Senior managers | 1.4 | 1.7 | 2.3 | 60.1 | 74.4 |
| Middle and other managers | 1.7 | 1.7 | 2.7 | 61.7 | 63.7 |
| Professionals | 1.6 | 1.5 | 1.6 | 97.9 | 93.8 |
| Semi-professionals and technicians | 2.5 | 2.7 | 3.7 | 67.2 | 71.8 |
| Supervisors | 3.0 | 3.0 | 3.6 | 83.1 | 83.1 |
| Supervisors: crafts and trades | 3.7 | 3.7 | 4.9 | 76.6 | 76.6 |
| Administrative and senior clerical personnel | 2.1 | 1.8 | 3.2 | 67.0 | 56.4 |
| Skilled sales and service personnel | 2.9 | 1.9 | 3.6 | 81.9 | 51.8 |
| Skilled crafts and trades workers | 4.1 | 4.2 | 4.7 | 86.8 | 90.1 |
| Clerical personnel | 2.4 | 2.3 | 3.5 | 69.2 | 67.1 |
| Intermediate sales and service personnel | 3.1 | 3.8 | 3.6 | 85.1 | 104.2 |
| Semi-skilled manual workers | 3.2 | 3.2 | 4.0 | 80.1 | 80.0 |
| Other sales and service personnel | 4.1 | 4.6 | 5.0 | 81.6 | 90.1 |
| Other manual workers | 5.6 | 3.9 | 9.5 | 58.5 | 40.5 |
| Total | 2.9 | 3.0 | 3.9 | 75.1 | 76.1 |
* Source: Statistics Canada, 2016 Census.
| Employment equity occupational group | 2019 representation | 2020 representation | 2016 availability (sector)* | 2019 attainment rate | 2020 attainment rate |
|---|---|---|---|---|---|
| Senior managers | 1.4 | 1.4 | 6.4 | 21.2 | 21.3 |
| Middle and other managers | 1.8 | 2.0 | 2.6 | 67.9 | 76.4 |
| Professionals | 2.2 | 2.3 | 2.4 | 91.1 | 95.3 |
| Semi-professionals and technicians | 4.7 | 4.7 | 4.2 | 111.3 | 109.6 |
| Supervisors | 2.3 | 2.3 | 4.5 | 50.0 | 50.7 |
| Supervisors: crafts and trades | 3.9 | 3.7 | 5.2 | 74.9 | 71.9 |
| Administrative and senior clerical personnel | 3.1 | 3.4 | 5.0 | 63.1 | 67.7 |
| Skilled sales and service personnel | 3.6 | 3.2 | 4.4 | 82.5 | 73.8 |
| Skilled crafts and trades workers | 7.0 | 7.2 | 5.5 | 125.6 | 130.1 |
| Clerical personnel | 4.7 | 4.9 | 6.3 | 74.7 | 78.0 |
| Intermediate sales and service personnel | 2.0 | 2.7 | 5.0 | 40.0 | 53.4 |
| Semi-skilled manual workers | 8.3 | 7.9 | 5.7 | 145.2 | 138.3 |
| Other sales and service personnel | 2.2 | 4.0 | 8.4 | 26.6 | 47.7 |
| Other manual workers | 6.8 | 6.5 | 8.7 | 78.2 | 74.5 |
| Total | 3.8 | 4.1 | 4.6 | 82.9 | 88.7 |
* Source: Statistics Canada, 2016 Census.
| Employment equity occupational group | 2019 representation | 2020 representation | 2016 availability (sector)* | 2019 attainment rate | 2020 attainment rate |
|---|---|---|---|---|---|
| Senior managers | 18.5 | 20.8 | 15.3 | 120.5 | 135.8 |
| Middle and other managers | 31.8 | 36.2 | 27.8 | 114.6 | 130.2 |
| Professionals | 37.2 | 40.9 | 34.9 | 106.5 | 117.3 |
| Semi-professionals and technicians | 40.9 | 44.3 | 35.7 | 114.3 | 124.0 |
| Supervisors | 31.9 | 37.1 | 25.1 | 127.0 | 147.7 |
| Supervisors: crafts and trades | 66.7 | 64.3 | 13.5 | 495.2 | 477.6 |
| Administrative and senior clerical personnel | 36.8 | 41.0 | 24.3 | 151.5 | 168.8 |
| Skilled sales and service personnel | 34.6 | 38.0 | 32.9 | 105.4 | 115.7 |
| Skilled crafts and trades workers | 6.3 | 13.3 | 13.2 | 47.2 | 100.7 |
| Clerical personnel | 39.9 | 44.1 | 33.6 | 118.5 | 131.2 |
| Intermediate sales and service personnel | 27.5 | 32.1 | 32.2 | 85.4 | 99.8 |
| Semi-skilled manual workers | 58.1 | 58.4 | 26.5 | 218.9 | 220.0 |
| Other sales and service personnel | 38.9 | 39.6 | 25.5 | 152.4 | 155.2 |
| Other manual workers | 0.0 | 0.0 | 25.7 | 0.0 | 0.0 |
| Total | 34.4 | 38.5 | 31.2 | 110.2 | 123.5 |
* Source: Statistics Canada, 2016 Census.
| Employment equity occupational group |
2019 representation |
2020 representation |
2016 availability (sector)* |
2019 attainment rate |
2020 attainment rate |
|---|---|---|---|---|---|
| Senior managers |
10.1 |
11.0 |
11.7 |
86.3 |
94.2 |
| Middle and other managers |
23.7 |
23.9 |
21.3 |
111.2 |
112.6 |
| Professionals |
27.0 |
28.0 |
27.2 |
99.3 |
103.2 |
| Semi-professionals and technicians |
18.3 |
18.7 |
21.4 |
85.5 |
87.3 |
| Supervisors |
23.1 |
24.4 |
27.5 |
84.1 |
88.7 |
| Supervisors: crafts and trades |
17.4 |
20.7 |
20.3 |
85.8 |
102.0 |
| Administrative and senior clerical personnel |
22.6 |
24.3 |
20.4 |
110.7 |
119.0 |
| Skilled sales and service personnel |
22.8 |
23.4 |
32.2 |
70.8 |
72.9 |
| Skilled crafts and trades workers |
18.2 |
18.7 |
20.6 |
88.6 |
91.1 |
| Clerical personnel |
23.2 |
23.5 |
20.9 |
111.0 |
112.4 |
| Intermediate sales and service personnel |
28.4 |
29.8 |
36.3 |
78.3 |
82.2 |
| Semi-skilled manual workers |
29.5 |
31.4 |
28.1 |
105.0 |
111.6 |
| Other sales and service personnel |
14.0 |
22.9 |
28.7 |
48.9 |
79.8 |
| Other manual workers |
0.0 |
0.0 |
20.9 |
0.0 |
0.0 |
| Total |
23.8 |
24.6 |
24.8 |
95.8 |
99.2 |
* Source: Statistics Canada, 2016 Census.
| Employment equity occupational group | 2019 representation | 2020 representation | 2016 availability (sector)* | 2019 attainment rate | 2020 attainment rate |
|---|---|---|---|---|---|
| Senior managers | 7.4 | 7.8 | 10.8 | 68.4 | 71.9 |
| Middle and other managers | 15.1 | 15.8 | 19.0 | 79.6 | 83.0 |
| Professionals | 26.5 | 27.7 | 31.3 | 84.6 | 88.5 |
| Semi-professionals and technicians | 9.9 | 9.9 | 12.9 | 76.8 | 76.6 |
| Supervisors | 13.9 | 14.1 | 22.8 | 61.2 | 61.8 |
| Supervisors: crafts and trades | 11.4 | 11.6 | 13.9 | 81.9 | 83.3 |
| Administrative and senior clerical personnel | 20.2 | 21.7 | 19.1 | 105.7 | 113.4 |
| Skilled sales and service personnel | 6.5 | 6.5 | 23.2 | 28.1 | 27.9 |
| Skilled crafts and trades workers | 14.2 | 13.6 | 13.8 | 102.5 | 98.7 |
| Clerical personnel | 21.6 | 22.1 | 24.7 | 87.3 | 89.3 |
| Intermediate sales and service personnel | 24.7 | 22.3 | 28.3 | 87.3 | 78.9 |
| Semi-skilled manual workers | 18.4 | 17.5 | 28.6 | 64.3 | 61.1 |
| Other sales and service personnel | 16.5 | 14.5 | 31.2 | 52.9 | 46.3 |
| Other manual workers | 12.7 | 10.6 | 20.6 | 61.7 | 51.3 |
| Total | 18.4 | 17.8 | 25.1 | 73.2 | 71.0 |
* Source: Statistics Canada, 2016 Census.
| Employment equity occupational group | 2019 representation | 2020 representation | 2016 availability (sector)* | 2019 attainment rate | 2020 attainment rate |
|---|---|---|---|---|---|
| Senior managers | 7.9 | 7.0 | 10.7 | 73.4 | 65.2 |
| Middle and other managers | 12.7 | 13.4 | 9.6 | 132.6 | 140.2 |
| Professionals | 22.8 | 23.7 | 23.6 | 96.6 | 100.3 |
| Semi-professionals and technicians | 10.5 | 10.9 | 16.0 | 65.6 | 67.9 |
| Supervisors | 10.1 | 9.3 | 17.5 | 57.8 | 53.1 |
| Supervisors: crafts and trades | 7.0 | 6.9 | 7.6 | 92.5 | 91.2 |
| Administrative and senior clerical personnel | 14.3 | 16.8 | 15.0 | 95.8 | 112.3 |
| Skilled sales and service personnel | 10.8 | 8.2 | 17.7 | 60.8 | 46.0 |
| Skilled crafts and trades workers | 12.7 | 12.1 | 9.2 | 137.6 | 130.5 |
| Clerical personnel | 15.2 | 15.9 | 17.9 | 85.0 | 88.6 |
| Intermediate sales and service personnel | 24.0 | 26.5 | 25.2 | 95.1 | 105.0 |
| Semi-skilled manual workers | 10.0 | 10.0 | 15.0 | 66.4 | 66.6 |
| Other sales and service personnel | 14.5 | 10.6 | 15.4 | 94.5 | 68.6 |
| Other manual workers | 9.7 | 10.8 | 16.2 | 59.6 | 66.8 |
| Total | 16.2 | 16.6 | 16.0 | 101.3 | 103.7 |
* Source: Statistics Canada, 2016 Census.
| Employment equity occupational group | 2019 representation | 2020 representation | 2016 availability (Canadian)* | 2019 attainment rate | 2020 attainment rate |
|---|---|---|---|---|---|
| Senior managers | 28.7 | 29.2 | 27.6 | 104.0 | 105.8 |
| Middle and other managers | 42.4 | 42.3 | 39.4 | 107.6 | 107.2 |
| Professionals | 43.9 | 43.9 | 55.0 | 79.8 | 79.9 |
| Semi-professionals and technicians | 19.1 | 19.7 | 53.5 | 35.7 | 36.7 |
| Supervisors | 58.7 | 58.2 | 55.5 | 105.8 | 104.9 |
| Supervisors: crafts and trades | 9.3 | 10.5 | 10.8 | 86.1 | 97.8 |
| Administrative and senior clerical personnel | 72.7 | 72.0 | 82.4 | 88.2 | 87.4 |
| Skilled sales and service personnel | 53.0 | 53.1 | 49.7 | 106.5 | 106.9 |
| Skilled crafts and trades workers | 4.7 | 5.0 | 4.0 | 117.7 | 125.9 |
| Clerical personnel | 53.5 | 53.0 | 68.7 | 77.8 | 77.1 |
| Intermediate sales and service personnel | 62.4 | 62.1 | 68.4 | 91.3 | 90.9 |
| Semi-skilled manual workers | 11.8 | 12.5 | 17.1 | 69.0 | 73.1 |
| Other sales and service personnel | 39.2 | 36.7 | 56.3 | 69.6 | 65.2 |
| Other manual workers | 12.3 | 14.7 | 22.1 | 55.6 | 66.3 |
| Total | 39.5 | 39.1 | 48.2 | 81.9 | 81.0 |
* Source: Statistics Canada, 2016 Census.
| Employment equity occupational group | 2019 representation | 2020 representation | 2016 availability (Canadian)* | 2019 attainment rate | 2020 attainment rate |
|---|---|---|---|---|---|
| Senior managers | 1.1 | 1.3 | 3.2 | 35.0 | 41.4 |
| Middle and other managers | 1.3 | 1.3 | 2.7 | 48.8 | 49.3 |
| Professionals | 1.3 | 1.3 | 2.4 | 54.4 | 56.1 |
| Semi-professionals and technicians | 2.6 | 2.7 | 4.2 | 63.4 | 65.2 |
| Supervisors | 2.3 | 2.5 | 3.9 | 58.7 | 63.5 |
| Supervisors: crafts and trades | 3.6 | 3.6 | 4.3 | 82.1 | 82.5 |
| Administrative and senior clerical personnel | 1.8 | 2.0 | 3.5 | 52.4 | 57.5 |
| Skilled sales and service personnel | 1.6 | 2.0 | 3.7 | 43.0 | 54.4 |
| Skilled crafts and trades workers | 4.0 | 4.4 | 5.2 | 76.7 | 83.8 |
| Clerical personnel | 2.2 | 2.2 | 4.2 | 53.2 | 52.5 |
| Intermediate sales and service personnel | 2.4 | 2.8 | 4.5 | 54.4 | 62.4 |
| Semi-skilled manual workers | 3.4 | 3.4 | 4.8 | 71.2 | 71.5 |
| Other sales and service personnel | 3.5 | 3.9 | 5.8 | 59.5 | 67.9 |
| Other manual workers | 6.0 | 4.7 | 6.8 | 88.1 | 68.6 |
| Total | 2.3 | 2.4 | 4.0 | 57.8 | 59.9 |
* Source: Statistics Canada, 2016 Census.
| Employment equity occupational group | 2019 representation | 2020 representation | 2017 availability (Canadian)* | 2019 attainment rate | 2020 attainment rate |
|---|---|---|---|---|---|
| Senior managers | 3.2 | 3.4 | 5.0 | 63.9 | 68.4 |
| Middle and other managers | 3.7 | 4.3 | 5.0 | 73.3 | 85.9 |
| Professionals | 3.8 | 4.5 | 8.9 | 42.1 | 50.0 |
| Semi-professionals and technicians | 2.5 | 2.7 | 7.6 | 33.1 | 35.7 |
| Supervisors | 4.0 | 4.7 | 27.5 | 14.7 | 17.3 |
| Supervisors: crafts and trades | 2.3 | 2.3 | 10.1 | 23.3 | 23.1 |
| Administrative and senior clerical personnel | 4.5 | 4.7 | 10.0 | 44.4 | 46.8 |
| Skilled sales and service personnel | 3.9 | 4.6 | 8.0 | 48.2 | 57.5 |
| Skilled crafts and trades workers | 2.3 | 2.7 | 7.8 | 29.8 | 34.6 |
| Clerical personnel | 4.6 | 4.8 | 9.3 | 49.4 | 51.5 |
| Intermediate sales and service personnel | 3.5 | 4.5 | 10.8 | 32.7 | 41.8 |
| Semi-skilled manual workers | 2.5 | 2.4 | 10.3 | 24.4 | 23.1 |
| Other sales and service personnel | 4.0 | 4.5 | 10.7 | 37.8 | 42.2 |
| Other manual workers | 2.4 | 2.3 | 6.8 | 35.6 | 34.4 |
| Total | 3.5 | 3.9 | 9.1 | 37.9 | 43.0 |
* Source: Statistics Canada, 2017 Canadian Survey on Disability.
| Employment equity occupational group | 2019 representation | 2020 representation | 2016 availability (Canadian)* | 2019 attainment rate | 2020 attainment rate |
|---|---|---|---|---|---|
| Senior managers | 11.9 | 13.0 | 11.5 | 103.5 | 113.4 |
| Middle and other managers | 26.3 | 29.4 | 17.6 | 149.5 | 166.9 |
| Professionals | 33.0 | 35.9 | 23.2 | 142.2 | 154.7 |
| Semi-professionals and technicians | 14.0 | 14.7 | 19.1 | 73.2 | 77.0 |
| Supervisors | 21.7 | 23.7 | 24.0 | 90.2 | 98.5 |
| Supervisors: crafts and trades | 11.1 | 11.5 | 11.1 | 99.5 | 103.2 |
| Administrative and senior clerical personnel | 27.4 | 30.4 | 16.4 | 167.7 | 185.5 |
| Skilled sales and service personnel | 30.7 | 33.6 | 27.7 | 110.9 | 121.3 |
| Skilled crafts and trades workers | 15.3 | 15.0 | 12.0 | 127.9 | 125.5 |
| Clerical personnel | 26.4 | 27.7 | 21.9 | 120.1 | 126.3 |
| Intermediate sales and service personnel | 26.3 | 28.2 | 25.4 | 103.6 | 111.2 |
| Semi-skilled manual workers | 18.2 | 17.3 | 22.4 | 81.3 | 77.1 |
| Other sales and service personnel | 16.2 | 14.5 | 26.5 | 61.0 | 54.8 |
| Other manual workers | 11.7 | 10.6 | 21.0 | 55.7 | 50.7 |
| Total | 24.4 | 26.0 | 21.3 | 114.5 | 122.1 |
* Source: Statistics Canada, 2016 Census.
| Employment equity occupational group | 2019 women distribution | 2019 men distribution | 2020 women distribution | 2020 men distribution |
|---|---|---|---|---|
| Senior managers | 0.6 | 1.0 | 0.7 | 1.1 |
| Middle and other managers | 12.2 | 10.9 | 12.7 | 11.1 |
| Professionals | 21.9 | 18.3 | 23.5 | 19.2 |
| Semi-professionals and technicians | 3.1 | 8.6 | 3.1 | 8.2 |
| Supervisors | 4.9 | 2.2 | 5.1 | 2.4 |
| Supervisors: crafts and trades | 0.3 | 2.2 | 0.4 | 2.4 |
| Administrative and senior clerical personnel | 4.9 | 1.2 | 4.8 | 1.2 |
| Skilled sales and service personnel | 4.3 | 2.5 | 5.0 | 2.8 |
| Skilled crafts and trades workers | 1.0 | 12.6 | 1.0 | 11.8 |
| Clerical personnel | 17.8 | 10.1 | 18.3 | 10.4 |
| Intermediate sales and service personnel | 24.2 | 9.5 | 20.3 | 7.9 |
| Semi-skilled manual workers | 3.9 | 19.1 | 4.4 | 19.9 |
| Other sales and service personnel | 0.4 | 0.4 | 0.3 | 0.3 |
| Other manual workers | 0.3 | 1.4 | 0.4 | 1.3 |
| Total | 100.0 | 100.0 | 100.0 | 100.0 |
| Employment equity occupational group | 2019 Aboriginal peoples distribution | 2019 non-Aboriginal peoples distribution | 2020 Aboriginal peoples distribution | 2020 non-Aboriginal peoples distribution |
|---|---|---|---|---|
| Senior managers | 0.4 | 0.9 | 0.5 | 0.9 |
| Middle and other managers | 6.4 | 11.5 | 6.4 | 11.8 |
| Professionals | 11.0 | 19.9 | 11.6 | 21.1 |
| Semi-professionals and technicians | 7.3 | 6.4 | 7.0 | 6.2 |
| Supervisors | 3.2 | 3.3 | 3.5 | 3.4 |
| Supervisors: crafts and trades | 2.3 | 1.5 | 2.4 | 1.6 |
| Administrative and senior clerical personnel | 2.1 | 2.7 | 2.2 | 2.6 |
| Skilled sales and service personnel | 2.2 | 3.2 | 3.1 | 3.7 |
| Skilled crafts and trades workers | 13.9 | 7.9 | 13.8 | 7.4 |
| Clerical personnel | 12.6 | 13.1 | 12.3 | 13.5 |
| Intermediate sales and service personnel | 16.1 | 15.3 | 14.8 | 12.7 |
| Semi-skilled manual workers | 19.3 | 12.9 | 19.8 | 13.7 |
| Other sales and service personnel | 0.7 | 0.4 | 0.6 | 0.3 |
| Other manual workers | 2.4 | 0.9 | 1.9 | 0.9 |
| Total | 100.0 | 100.0 | 100.0 | 100.0 |
| Employment equity occupational group | 2019 persons with disabilities distribution | 2019 persons without disabilities distribution | 2020 persons with disabilities distribution | 2020 persons without disabilities distribution |
|---|---|---|---|---|
| Senior managers | 0.8 | 0.9 | 0.8 | 0.9 |
| Middle and other managers | 12.1 | 11.4 | 12.8 | 11.7 |
| Professionals | 21.5 | 19.7 | 23.8 | 20.7 |
| Semi-professionals and technicians | 4.7 | 6.5 | 4.3 | 6.3 |
| Supervisors | 3.8 | 3.3 | 4.2 | 3.4 |
| Supervisors: crafts and trades | 1.0 | 1.5 | 1.0 | 1.6 |
| Administrative and senior clerical personnel | 3.4 | 2.6 | 3.1 | 2.6 |
| Skilled sales and service personnel | 3.6 | 3.2 | 4.4 | 3.7 |
| Skilled crafts and trades workers | 5.4 | 8.1 | 5.2 | 7.7 |
| Clerical personnel | 17.4 | 12.9 | 16.5 | 13.3 |
| Intermediate sales and service personnel | 15.6 | 15.3 | 14.6 | 12.7 |
| Semi-skilled manual workers | 9.5 | 13.2 | 8.4 | 14.1 |
| Other sales and service personnel | 0.5 | 0.4 | 0.4 | 0.3 |
| Other manual workers | 0.7 | 1.0 | 0.6 | 1.0 |
| Total | 100.0 | 100.0 | 100.0 | 100.0 |
| Employment equity occupational group | 2019 members of visible minorities distribution | 2019 non-members of visible minorities distribution | 2020 members of visible minorities distribution | 2020 non-members of visible minorities distribution |
|---|---|---|---|---|
| Senior managers | 0.4 | 1.0 | 0.5 | 1.1 |
| Middle and other managers | 12.3 | 11.1 | 13.2 | 11.2 |
| Professionals | 26.7 | 17.5 | 28.8 | 18.1 |
| Semi-professionals and technicians | 3.7 | 7.3 | 3.5 | 7.2 |
| Supervisors | 2.9 | 3.4 | 3.1 | 3.6 |
| Supervisors: crafts and trades | 0.7 | 1.7 | 0.7 | 1.9 |
| Administrative and senior clerical personnel | 3.0 | 2.6 | 3.1 | 2.5 |
| Skilled sales and service personnel | 4.0 | 2.9 | 4.8 | 3.3 |
| Skilled crafts and trades workers | 5.0 | 9.0 | 4.4 | 8.7 |
| Clerical personnel | 14.2 | 12.8 | 14.4 | 13.2 |
| Intermediate sales and service personnel | 16.6 | 14.9 | 13.8 | 12.4 |
| Semi-skilled manual workers | 9.8 | 14.1 | 9.2 | 15.5 |
| Other sales and service personnel | 0.3 | 0.5 | 0.2 | 0.4 |
| Other manual workers | 0.5 | 1.1 | 0.4 | 1.2 |
| Total | 100.0 | 100.0 | 100.0 | 100.0 |
| Designated groups | 2019 number of employees | 2020 number of employees | 2019 number of hires | 2020 number of hires | 2019 number of promotions | 2020 number of promotions | 2019 number of terminations | 2020 number of terminations | 2019 net effect* | 2020 net effect* |
|---|---|---|---|---|---|---|---|---|---|---|
| Women | 142,657 | 141,488 | 21,891 | 14,095 | 17,866 | 13,237 | 20,310 | 15,881 | 1,581 | -1,786 |
| Aboriginal peoples | 3,145 | 3,619 | 512 | 339 | 372 | 312 | 486 | 398 | 26 | -59 |
| Persons with disabilities | 12,520 | 14,891 | 1,402 | 910 | 1,335 | 1,155 | 1,844 | 1,536 | -442 | -626 |
| Members of visible minorities | 87,454 | 98,463 | 13,382 | 10,302 | 11,878 | 10,408 | 12,263 | 9,554 | 1,119 | 748 |
| All employees | 254,434 | 255,560 | 42,895 | 28,129 | 32,142 | 24,617 | 37,883 | 28,986 | 5,012 | -857 |
* The number of employees hired reduced by those terminated.
** The number of employees covers permanent full-time, permanent part-time and temporary employees. The data on hires, promotions, terminations and net effect covers only permanent full-time and permanent part-time employees.
| Designated groups | 2019 representation | 2020 representation | 2019 share of hires | 2020 share of hires | 2019 share of promotions | 2020 share of promotions | 2019 share of terminations | 2020 share of terminations |
|---|---|---|---|---|---|---|---|---|
| Women | 56.1 | 55.4 | 51.0 | 50.1 | 55.6 | 53.8 | 53.6 | 54.8 |
| Aboriginal peoples | 1.2 | 1.4 | 1.2 | 1.2 | 1.2 | 1.3 | 1.3 | 1.4 |
| Persons with disabilities | 4.9 | 5.8 | 3.3 | 3.2 | 4.2 | 4.7 | 4.9 | 5.3 |
| Members of visible minorities | 34.4 | 38.5 | 31.2 | 36.6 | 37.0 | 42.3 | 32.4 | 33.0 |
| All employees | 100.0 | 100.0 | 100.0 | 100.0 | 100.0 | 100.0 | 100.0 | 100.0 |
* The data on the representation of designated group employees covers permanent full-time, permanent part-time and temporary employees. The data on the shares of hires, promotions and terminations covers only permanent full-time and permanent part-time employees.
| Designated groups | 2019 number of employees | 2020 number of employees | 2019 number of hires | 2020 number of hires | 2019 number of promotions | 2020 number of promotions | 2019 number of terminations | 2020 number of terminations | 2019 net effect* | 2020 net effect* |
|---|---|---|---|---|---|---|---|---|---|---|
| Women | 45,204 | 42,406 | 6,523 | 3,661 | 2,560 | 1,918 | 7,176 | 6,222 | -653 | -2,561 |
| Aboriginal peoples | 2,786 | 2,625 | 289 | 143 | 139 | 107 | 397 | 354 | -108 | -211 |
| Persons with disabilities | 4,753 | 5,253 | 503 | 272 | 205 | 198 | 673 | 735 | -170 | -463 |
| Members of visible minorities | 30,738 | 29,262 | 4,614 | 2,512 | 1,828 | 1,369 | 5,000 | 4,419 | -386 | -1,907 |
| All employees | 129,398 | 118,905 | 17,737 | 9,297 | 6,406 | 5,023 | 20,270 | 18,090 | -2,533 | -8,793 |
* The number of employees hired reduced by those terminated.
** The number of employees covers permanent full-time, permanent part-time and temporary employees. The data on hires, promotions, terminations and net effect covers only permanent full-time and permanent part-time employees.
| Designated groups | 2019 representation | 2020 representation | 2019 share of hires | 2020 share of hires | 2019 share of promotions | 2020 share of promotions | 2019 share of terminations | 2020 share of terminations |
|---|---|---|---|---|---|---|---|---|
| Women | 34.9 | 35.7 | 36.8 | 39.4 | 40.0 | 38.2 | 35.4 | 34.4 |
| Aboriginal peoples | 2.2 | 2.2 | 1.6 | 1.5 | 2.2 | 2.1 | 2.0 | 2.0 |
| Persons with disabilities | 3.7 | 4.4 | 2.8 | 2.9 | 3.2 | 3.9 | 3.3 | 4.1 |
| Members of visible minorities | 23.8 | 24.6 | 26.0 | 27.0 | 28.5 | 27.3 | 24.7 | 24.4 |
| All employees | 100.0 | 100.0 | 100.0 | 100.0 | 100.0 | 100.0 | 100.0 | 100.0 |
* The data on the representation of designated group employees covers permanent full-time, permanent part-time and temporary employees. The data on the shares of hires, promotions and terminations covers only permanent full-time and permanent part-time employees.
| Designated groups | 2019 number of employees | 2020 number of employees | 2019 number of hires | 2020 number of hires | 2019 number of promotions | 2020 number of promotions | 2019 number of terminations | 2020 number of terminations | 2019 net effect* | 2020 net effect* | |
|---|---|---|---|---|---|---|---|---|---|---|---|
| Women | 99,069 | 85,767 | 18,411 | 13,370 | 3,802 | 2,885 | 17,331 | 17,746 | 1,080 | -4,376 | |
| Aboriginal peoples | 9,649 | 8,995 | 2,215 | 1,513 | 316 | 323 | 2,259 | 1,982 | -44 | -469 | |
| Persons with disabilities | 8,113 | 7,410 | 1,381 | 792 | 269 | 221 | 1,629 | 1,579 | -248 | -787 | |
| Members of visible minorities | 60,528 | 54,002 | 17,804 | 10,850 | 2,439 | 2,042 | 14,928 | 12,668 | 2,876 | -1,818 | |
| All employees | 329,240 | 303,071 | 70,878 | 56,838 | 12,556 | 9,779 | 69,712 | 66,292 | 1,166 | -9,454 |
* The number of employees hired reduced by those terminated.
** The number of employees covers permanent full-time, permanent part-time and temporary employees. The data on hires, promotions, terminations and net effect covers only permanent full-time and permanent part-time employees.
| Designated groups | 2019 representation | 2020 representation | 2019 share of hires | 2020 share of hires | 2019 share of promotions | 2020 share of promotions | 2019 share of terminations | 2020 share of terminations |
|---|---|---|---|---|---|---|---|---|
| Women | 30.1 | 28.3 | 26.0 | 23.5 | 30.3 | 29.5 | 24.9 | 26.8 |
| Aboriginal peoples | 2.9 | 3.0 | 3.1 | 2.7 | 2.5 | 3.3 | 3.2 | 3.0 |
| Persons with disabilities | 2.5 | 2.4 | 1.9 | 1.4 | 2.1 | 2.3 | 2.3 | 2.4 |
| Members of visible minorities | 18.4 | 17.8 | 25.1 | 19.1 | 19.4 | 20.9 | 21.4 | 19.1 |
| All employees | 100.0 | 100.0 | 100.0 | 100.0 | 100.0 | 100.0 | 100.0 | 100.0 |
* The data on the representation of designated group employees covers permanent full-time, permanent part-time and temporary employees. The data on the shares of hires, promotions and terminations covers only permanent full-time and permanent part-time employees.
| Designated groups | 2019 number of employees | 2020 number of employees | 2019 number of hires | 2020 number of hires | 2019 number of promotions | 2020 number of promotions | 2019 number of terminations | 2020 number of terminations | 2019 net effect* | 2020 net effect* |
|---|---|---|---|---|---|---|---|---|---|---|
| Women | 17,965 | 17,764 | 2,783 | 1,922 | 848 | 744 | 2,830 | 2,851 | -47 | -929 |
| Aboriginal peoples | 2,263 | 2,377 | 391 | 449 | 82 | 150 | 342 | 358 | 49 | 91 |
| Persons with disabilities | 1,287 | 1,257 | 116 | 92 | 53 | 40 | 179 | 169 | -63 | -77 |
| Members of visible minorities | 9,615 | 9,662 | 2,223 | 1,470 | 363 | 359 | 1,826 | 1,760 | 397 | -290 |
| All employees | 59,330 | 58,254 | 9,530 | 6,769 | 2,517 | 2,365 | 9,921 | 9,883 | -391 | -3,114 |
* The number of employees hired reduced by those terminated.
** The number of employees covers permanent full-time, permanent part-time and temporary employees. The data on hires, promotions, terminations and net effect covers only permanent full-time and permanent part-time employees.
| Designated groups | 2019 representation | 2020 representation | 2019 share of hires | 2020 share of hires | 2019 share of promotions | 2020 share of promotions | 2019 share of terminations | 2020 share of terminations |
|---|---|---|---|---|---|---|---|---|
| Women | 30.3 | 30.5 | 29.2 | 28.4 | 33.7 | 31.5 | 28.5 | 28.8 |
| Aboriginal peoples | 3.8 | 4.1 | 4.1 | 6.6 | 3.3 | 6.3 | 3.4 | 3.6 |
| Persons with disabilities | 2.2 | 2.2 | 1.2 | 1.4 | 2.1 | 1.7 | 1.8 | 1.7 |
| Members of visible minorities | 16.2 | 16.6 | 23.3 | 21.7 | 14.4 | 15.2 | 18.4 | 17.8 |
| All employees | 100.0 | 100.0 | 100.0 | 100.0 | 100.0 | 100.0 | 100.0 | 100.0 |
* The data on the representation of designated group employees covers permanent full-time, permanent part-time and temporary employees. The data on the shares of hires, promotions and terminations covers only permanent full-time and permanent part-time employees.
| Designated groups | 2019 number of employees | 2020 number of employees | 2019 number of hires | 2020 number of hires | 2019 number of promotions | 2020 number of promotions | 2019 number of terminations | 2020 number of terminations | 2019 net effect* | 2020 net effect* |
|---|---|---|---|---|---|---|---|---|---|---|
| Women | 304,895 | 287,425 | 49,608 | 33,048 | 25,076 | 18,784 | 47,647 | 42,700 | 1,961 | -9,652 |
| Aboriginal peoples | 17,843 | 17,616 | 3,407 | 2,444 | 909 | 892 | 3,484 | 3,092 | -77 | -648 |
| Persons with disabilities | 26,673 | 28,811 | 3,402 | 2,066 | 1,862 | 1,614 | 4,325 | 4,019 | -923 | -1,953 |
| Members of visible minorities | 188,335 | 191,389 | 38,023 | 25,134 | 16,508 | 14,178 | 34,017 | 28,401 | 4,006 | -3,267 |
| All employees | 772,402 | 735,790 | 141,040 | 101,033 | 53,621 | 41,784 | 137,786 | 123,251 | 3,254 | -22,218 |
* The number of employees hired reduced by those terminated.
** The number of employees covers permanent full-time, permanent part-time and temporary employees. The data on hires, promotions, terminations and net effect covers only permanent full-time and permanent part-time employees.
| Designated groups | 2019 representation | 2020 representation | 2019 share of hires | 2020 share of hires | 2019 share of promotions | 2020 share of promotions | 2019 share of terminations | 2020 share of terminations |
|---|---|---|---|---|---|---|---|---|
| Women | 39.5 | 39.1 | 35.2 | 32.7 | 46.8 | 45.0 | 34.6 | 34.6 |
| Aboriginal peoples | 2.3 | 2.4 | 2.4 | 2.4 | 1.7 | 2.1 | 2.5 | 2.5 |
| Persons with disabilities | 3.5 | 3.9 | 2.4 | 2.0 | 3.5 | 3.9 | 3.1 | 3.3 |
| Members of visible minorities | 24.4 | 26.0 | 27.0 | 24.9 | 30.8 | 33.9 | 24.7 | 23.0 |
| All employees | 100.0 | 100.0 | 100.0 | 100.0 | 100.0 | 100.0 | 100.0 | 100.0 |
* The data on the representation of designated group employees covers permanent full-time, permanent part-time and temporary employees. The data on the shares of hires, promotions and terminations covers only permanent full-time and permanent part-time employees.
| Salary range (in dollars) |
Number of all employees | Number of men | Representation of men (by percentage) | Number of Women | Representation of women (by percentage) |
|---|---|---|---|---|---|
| Under 15,000 | 5,193 | 3,887 | 74.9 | 1,306 | 25.1 |
| 15,000 to 19,999 | 1,628 | 1,175 | 72.2 | 453 | 27.8 |
| 20,000 to 24,999 | 2,309 | 1,473 | 63.8 | 836 | 36.2 |
| 25,000 to 29,999 | 5,186 | 3,027 | 58.4 | 2,159 | 41.6 |
| 30,000 to 34,999 | 11,983 | 6,675 | 55.7 | 5,308 | 44.3 |
| 35,000 to 37,499 | 13,188 | 7,444 | 56.4 | 5,744 | 43.6 |
| 37,500 to 39,999 | 14,258 | 7,270 | 51.0 | 6,988 | 49.0 |
| 40,000 to 44,999 | 36,117 | 18,346 | 50.8 | 17,771 | 49.2 |
| 45,000 to 49,999 | 40,772 | 21,333 | 52.3 | 19,439 | 47.7 |
| 50,000 to 59,999 | 95,583 | 53,937 | 56.4 | 41,646 | 43.6 |
| 60,000 to 69,999 | 95,119 | 59,440 | 62.5 | 35,679 | 37.5 |
| 70,000 to 84,999 | 97,147 | 62,903 | 64.8 | 34,244 | 35.2 |
| 85,000 to 99,999 | 72,467 | 48,236 | 66.6 | 24,231 | 33.4 |
| 100,000 and over | 150,842 | 107,143 | 71.0 | 43,699 | 29.0 |
| Total | 641,792 | 402,289 | 62.7 | 239,503 | 37.3 |
| Salary range (in dollars) |
Number of all employees | Number of Aboriginal peoples | Representation of Aboriginal peoples (by percentage) | Number of Aboriginal men | Number of Aboriginal women |
|---|---|---|---|---|---|
| Under 15,000 | 5,193 | 280 | 5.4 | 213 | 67 |
| 15,000 to 19,999 | 1,628 | 74 | 4.5 | 53 | 21 |
| 20,000 to 24,999 | 2,309 | 91 | 3.9 | 59 | 32 |
| 25,000 to 29,999 | 5,186 | 220 | 4.2 | 132 | 88 |
| 30,000 to 34,999 | 11,983 | 429 | 3.6 | 236 | 193 |
| 35,000 to 37,499 | 13,188 | 348 | 2.6 | 180 | 168 |
| 37,500 to 39,999 | 14,258 | 397 | 2.8 | 215 | 182 |
| 40,000 to 44,999 | 36,117 | 904 | 2.5 | 436 | 468 |
| 45,000 to 49,999 | 40,772 | 975 | 2.4 | 491 | 484 |
| 50,000 to 59,999 | 95,583 | 2,192 | 2.3 | 1,223 | 969 |
| 60,000 to 69,999 | 95,119 | 2,261 | 2.4 | 1,455 | 806 |
| 70,000 to 84,999 | 97,147 | 2,416 | 2.5 | 1,706 | 710 |
| 85,000 to 99,999 | 72,467 | 1,570 | 2.2 | 1,112 | 458 |
| 100,000 and over | 150,842 | 2,885 | 1.9 | 2,224 | 661 |
| Total | 641,792 | 15,042 | 2.3 | 9,735 | 5,307 |
| Salary range (in dollars) |
Number of all employees | Number of persons with disabilities | Representation of persons with disabilities (by percentage) | Number of men with disabilities | Number of women with disabilities |
|---|---|---|---|---|---|
| Under 15,000 | 5,193 | 148 | 2.8 | 106 | 42 |
| 15,000 to 19,999 | 1,628 | 43 | 2.6 | 27 | 16 |
| 20,000 to 24,999 | 2,309 | 76 | 3.3 | 43 | 33 |
| 25,000 to 29,999 | 5,186 | 150 | 2.9 | 74 | 76 |
| 30,000 to 34,999 | 11,983 | 429 | 3.6 | 199 | 230 |
| 35,000 to 37,499 | 13,188 | 468 | 3.5 | 192 | 276 |
| 37,500 to 39,999 | 14,258 | 708 | 5.0 | 294 | 414 |
| 40,000 to 44,999 | 36,117 | 1,738 | 4.8 | 717 | 1,021 |
| 45,000 to 49,999 | 40,772 | 1,730 | 4.2 | 748 | 982 |
| 50,000 to 59,999 | 95,583 | 4,043 | 4.2 | 1,832 | 2,211 |
| 60,000 to 69,999 | 95,119 | 3,758 | 4.0 | 1,929 | 1,829 |
| 70,000 to 84,999 | 97,147 | 3,767 | 3.9 | 2,104 | 1,663 |
| 85,000 to 99,999 | 72,467 | 2,874 | 4.0 | 1,659 | 1,215 |
| 100,000 and over | 150,842 | 5,138 | 3.4 | 3,197 | 1,941 |
| Total | 641,792 | 25,070 | 3.9 | 13,121 | 11,949 |
| Salary range (in dollars) |
Number of all employees | Number of members of visible minorities | Representation of members of visible minorities (by percentage) | Number of visible minority men | Number of visible minority women |
|---|---|---|---|---|---|
| Under 15,000 | 5,193 | 1,193 | 23.0 | 925 | 268 |
| 15,000 to 19,999 | 1,628 | 394 | 24.2 | 290 | 104 |
| 20,000 to 24,999 | 2,309 | 598 | 25.9 | 366 | 232 |
| 25,000 to 29,999 | 5,186 | 1,288 | 24.8 | 725 | 563 |
| 30,000 to 34,999 | 11,983 | 3,112 | 26.0 | 1,736 | 1,376 |
| 35,000 to 37,499 | 13,188 | 3,579 | 27.1 | 1,917 | 1,662 |
| 37,500 to 39,999 | 14,258 | 4,353 | 30.5 | 2,224 | 2,129 |
| 40,000 to 44,999 | 36,117 | 11,364 | 31.5 | 5,557 | 5,807 |
| 45,000 to 49,999 | 40,772 | 11,514 | 28.2 | 5,792 | 5,722 |
| 50,000 to 59,999 | 95,583 | 27,114 | 28.4 | 14,851 | 12,263 |
| 60,000 to 69,999 | 95,119 | 22,418 | 23.6 | 13,515 | 8,903 |
| 70,000 to 84,999 | 97,147 | 24,318 | 25.0 | 14,607 | 9,711 |
| 85,000 to 99,999 | 72,467 | 20,170 | 27.8 | 12,511 | 7,659 |
| 100,000 and over | 150,842 | 36,751 | 24.4 | 24,246 | 12,505 |
| Total | 641,792 | 168,166 | 26.2 | 99,262 | 68,904 |
| Salary range (in dollars) |
Number of all employees | Number of men | Representation of men (by percentage) | Number of Women | Representation of women (by percentage) |
|---|---|---|---|---|---|
| Under 5,000 | 3,311 | 2,028 | 61.3 | 1,283 | 38.7 |
| 5,000 to 7,499 | 1,819 | 913 | 50.2 | 906 | 49.8 |
| 7,500 to 9,999 | 1,821 | 1,029 | 56.5 | 792 | 43.5 |
| 10,000 to 12,499 | 2,610 | 1,362 | 52.2 | 1,248 | 47.8 |
| 12,500 to 14,999 | 6,122 | 2,964 | 48.4 | 3,158 | 51.6 |
| 15,000 to 17,499 | 10,982 | 6,251 | 56.9 | 4,731 | 43.1 |
| 17,500 to 19,999 | 6,926 | 3,559 | 51.4 | 3,367 | 48.6 |
| 20,000 to 22,499 | 6,104 | 2,806 | 46.0 | 3,298 | 54.0 |
| 22,500 to 24,999 | 5,360 | 2,229 | 41.6 | 3,131 | 58.4 |
| 25,000 to 29,999 | 13,613 | 6,513 | 47.8 | 7,100 | 52.2 |
| 30,000 to 34,999 | 9,169 | 3,656 | 39.9 | 5,513 | 60.1 |
| 35,000 to 39,999 | 6,656 | 2,899 | 43.6 | 3,757 | 56.4 |
| 40,000 to 49,999 | 6,682 | 2,927 | 43.8 | 3,755 | 56.2 |
| 50,000 and over | 7,487 | 3,694 | 49.3 | 3,793 | 50.7 |
| Total | 88,662 | 42,830 | 48.3 | 45,832 | 51.7 |
| Salary range (in dollars) |
Number of all employees | Number of Aboriginal peoples | Representation of Aboriginal peoples (by percentage) | Number of Aboriginal men | Number of Aboriginal women |
|---|---|---|---|---|---|
| Under 5,000 | 3,311 | 83 | 2.5 | 30 | 53 |
| 5,000 to 7,499 | 1,819 | 36 | 2.0 | 10 | 26 |
| 7,500 to 9,999 | 1,821 | 53 | 2.9 | 25 | 28 |
| 10,000 to 12,499 | 2,610 | 83 | 3.2 | 37 | 46 |
| 12,500 to 14,999 | 6,122 | 177 | 2.9 | 67 | 110 |
| 15,000 to 17,499 | 10,982 | 253 | 2.3 | 104 | 149 |
| 17,500 to 19,999 | 6,926 | 206 | 3.0 | 94 | 112 |
| 20,000 to 22,499 | 6,104 | 174 | 2.9 | 69 | 105 |
| 22,500 to 24,999 | 5,360 | 143 | 2.7 | 58 | 85 |
| 25,000 to 29,999 | 13,613 | 375 | 2.8 | 176 | 199 |
| 30,000 to 34,999 | 9,169 | 303 | 3.3 | 130 | 173 |
| 35,000 to 39,999 | 6,656 | 155 | 2.3 | 69 | 86 |
| 40,000 to 49,999 | 6,682 | 195 | 2.9 | 70 | 125 |
| 50,000 and over | 7,487 | 181 | 2.4 | 85 | 96 |
| Total | 88,662 | 2,417 | 2.7 | 1,024 | 1,393 |
| Salary range (in dollars) |
Number of all employees | Number of persons with disabilities | Representation of persons with disabilities (by percentage) | Number of men with disabilities | Number of women with disabilities |
|---|---|---|---|---|---|
| Under 5,000 | 3,311 | 101 | 3.1 | 47 | 54 |
| 5,000 to 7,499 | 1,819 | 41 | 2.3 | 18 | 23 |
| 7,500 to 9,999 | 1,821 | 55 | 3.0 | 26 | 29 |
| 10,000 to 12,499 | 2,610 | 103 | 3.9 | 41 | 62 |
| 12,500 to 14,999 | 6,122 | 255 | 4.2 | 77 | 178 |
| 15,000 to 17,499 | 10,982 | 264 | 2.4 | 120 | 144 |
| 17,500 to 19,999 | 6,926 | 292 | 4.2 | 103 | 189 |
| 20,000 to 22,499 | 6,104 | 255 | 4.2 | 91 | 164 |
| 22,500 to 24,999 | 5,360 | 243 | 4.5 | 78 | 165 |
| 25,000 to 29,999 | 13,613 | 661 | 4.9 | 253 | 408 |
| 30,000 to 34,999 | 9,169 | 445 | 4.9 | 135 | 310 |
| 35,000 to 39,999 | 6,656 | 341 | 5.1 | 118 | 223 |
| 40,000 to 49,999 | 6,682 | 306 | 4.6 | 96 | 210 |
| 50,000 and over | 7,487 | 287 | 3.8 | 116 | 171 |
| Total | 88,662 | 3,649 | 4.1 | 1,319 | 2,330 |
| Salary range (in dollars) |
Number of all employees | Number of members of visible minorities | Representation of members of visible minorities (by percentage) | Number of visible minority men | Number of visible minority women |
|---|---|---|---|---|---|
| Under 5,000 | 3,311 | 746 | 22.5 | 500 | 246 |
| 5,000 to 7,499 | 1,819 | 384 | 21.1 | 239 | 145 |
| 7,500 to 9,999 | 1,821 | 363 | 19.9 | 238 | 125 |
| 10,000 to 12,499 | 2,610 | 504 | 19.3 | 296 | 208 |
| 12,500 to 14,999 | 6,122 | 1,708 | 27.9 | 893 | 815 |
| 15,000 to 17,499 | 10,982 | 2,391 | 21.8 | 1,390 | 1,001 |
| 17,500 to 19,999 | 6,926 | 2,074 | 29.9 | 1,139 | 935 |
| 20,000 to 22,499 | 6,104 | 1,636 | 26.8 | 824 | 812 |
| 22,500 to 24,999 | 5,360 | 1,457 | 27.2 | 678 | 779 |
| 25,000 to 29,999 | 13,613 | 4,277 | 31.4 | 2,432 | 1,845 |
| 30,000 to 34,999 | 9,169 | 2,469 | 26.9 | 1,193 | 1,276 |
| 35,000 to 39,999 | 6,656 | 1,741 | 26.2 | 904 | 837 |
| 40,000 to 49,999 | 6,682 | 1,420 | 21.3 | 809 | 611 |
| 50,000 and over | 7,487 | 1,339 | 17.9 | 780 | 559 |
| Total | 88,662 | 22,509 | 25.4 | 12,315 | 10,194 |
Appendix B: Technical notes
Employers covered under the Employment Equity Act
The Act covers:
- organizations that employ 100 or more employees in the federally-regulated private sector, federal Crown corporations, other federal consolidated entities (namely, Canada Pension Plan Investment Board, Public Sector Pension Investment Board and St. Lawrence Seaway Management Corporation) and other federal government business enterprises (namely, Montreal Port Authority, PortsToronto and Vancouver Fraser Port Authority)
- core public administration organizations listed in Schedule I or IV of the Financial Administration Act (FAA) (federal government departments and agencies)
- separate employer organizations in the federal public sector with 100 or more employees, listed in Schedule V of the FAA (separate agencies), and
- other public-sector employer organizations with 100 or more employees, including the Canadian Forces (officers and non-commissioned members in the Regular and Reserve Forces) and the Royal Canadian Mounted Police (regular and civilian members, excluding federal public service employees)
Limitations of the employment equity data
This report provides the most recent information on employment equity data for the federally-regulated private sector, with the following limitations:
- to measure progress of the designated groups, their representation (that is, the number of designated group employees divided by the number of all employees) in the federally-regulated private sector is compared to their availability in the workforce population. Availability data is obtained from censuses or surveys conducted every 5 years by Statistics Canada. As a result, there is a time lag in measuring representation gaps. The current labour market availability (LMA) is based on the 2016 Census and the 2017 Canadian Survey on Disability. More information on LMA can be found in the 2016 Employment Equity Data Report
- the designated groups data is based on self-identification. Some individuals may not self-identify to their employer and/or to Statistics Canada. Therefore, the data on all designated group members may not be gathered by the employers and Statistics Canada
- data is received annually from employers; however, the number of employers may differ from one year to the next
- the Treasury Board of Canada Secretariat is responsible for reporting on employment equity in the federal departments and agencies that make up the core public administration. This information is available on the Employment Equity in the Public Service of Canada website. Other areas of the federal public sector are responsible for preparing their own reports on employment equity, which can be found on their respective websites or obtained upon request directly from the organizations
- federal contractors are not required to report annually
Page details
- Date modified: