
Employment Insurance Monitoring and Assessment Report for the fiscal year beginning April 1, 2017 and ending March 31, 2018
Chapter 3: Impact and effectiveness of Employment Benefits and Support Measures
From: Employment and Social Development Canada
On this page
Activities delivered under Part II of the Employment Insurance (EI) Act help individuals in Canada prepare for, find and maintain employment. Under the umbrella of Employment Benefits and Support Measures (EBSMs), these activities include programs delivered by provinces and territories under Labour Market Development Agreements (LMDAs), as well as the Government of Canada’s pan-Canadian programming and functions of the National Employment Service (NES).
This chapter presents program results for EBSMs achieved under Part II of the EI Act during the fiscal year beginning on April 1, 2017 and ending on March 31, 2018 (FY1718). Section 1 provides a national overview of EBSM-similar programming delivered under the LMDAs and by Aboriginal Skills and Employment Training Strategy (ASETS) agreement holders. Provincial and territorial employment programming activities are presented in Section 2, with a description of each jurisdiction’s labour market and employment priorities. Section 3 presents a national and international overview of service delivery models, issues, and best practices for active employment programs comparable to EBSMs. Section 4 discusses the results of Employment and Social Development Canada’s (ESDC) delivery of pan-Canadian activities, and the administration of certain NES functions.
Notes to readers
- The data used to analyze EBSM activities were collected from provinces, territories, and ASETS agreement holders. Governments continue to improve data quality and collection to ensure accurate, reliable, and consistent information. While all data sets are verified before publication, systems and operational changes may affect the comparability of data from year to year.
- Throughout this chapter, references to average levels of activity and to highs and lows generally use the 10-year period from FY0708 to FY1718 as a frame of reference.
- Statistics Canada’s Labour Force Survey (LFS) is the source of labour market data reported. Data for Canada and the provinces are fiscal-year averages, calculated using seasonally unadjusted monthly data, while monthly references are seasonally adjusted. Data for the Northwest Territories, Yukon and Nunavut are calculated using unadjusted three-month moving averages of monthly data. In discussions of employment trends by industry, standard industry titles are taken from the North American Industry Classification System (NAICS).
- Real GDP data and other non-LFS macroeconomic indicators are from Statistics Canada’s Economic accounts. Forecasts are based on published analyses from the Bank of Canada, the Conference Board of Canada, Canadian banks, Organisation for Economic Co-operation and Development and Statistics Canada, as well as on internal analysis, using information available as of January 2019.
1. National overview
1.1 Economic and labour market context
In FY1718, Canada’s labour force grew by 1.0% to a total of 19.7 million, while employment expanded at a faster pace (+1.8%), to a total of 18.5 million. This marked the eighth consecutive year of employment growth in Canada, with most of the jobs being in full-time employment. Employment growth was similar among women and men, increasing by 1.8% and 1.9%, respectively.
Canada’s overall unemployment rate edged down to 6.1%, compared to 6.9% in the previous fiscal year. The unemployment rate for both women and men dropped by varying degrees. Women’s unemployment rate registered at 5.7% (compared to 6.2% in the previous year), while men’s unemployment rate registered at 6.5% (compared to 7.5% in the previous year).
Among youth aged 15-24 years old, employment grew by 1.4% in FY1718. In turn, the youth unemployment rate declined from 13% in FY1617, to 11.2% in the recent year. This is the lowest unemployment rate among youth since FY0708. Canadians aged 55 or older saw their employment levels grow up by 4.1%, and their unemployment rate declined from 6.0% to 5.5%, year over year.
Employment levels increased or remained relatively stable in most provinces and territories. Prince Edward Island (+3.3%) and British Columbia (+3.2%) experienced the strongest employment growth, followed by Quebec (+2.1%) and Ontario (+1.9%). Moderate growth was registered in Manitoba (+1.5%) and Alberta (+1.6). In Nova Scotia (+0.8%) and New Brunswick (+0.1%) employment levels remained relatively stable. Employment declined only in Newfoundland and Labrador and Saskatchewan, by -3.3% and -0.3%, respectively. In the territories, Yukon’s employment levels increased by 2.1%, while in Northwest Territories and Nunavut employment dropped by -4.9% and -1.3%, respectively.
Canada’s overall labour market participation rate held steady at 65.7% in FY1718, with the labour population and labour force both growing at a nearly equal pace, +1.1% and +1.0%, respectively.
Statistics CanadaFootnote 1 reported 298,000 job vacancies across Canada in FY1718, compared to 221,000 in FY1617 (+35.2% increase year over year). The survey also reported 1.21 million unemployed workers in FY1718. Taken together—expressed as the unemployment-to-job vacancies ratio (U/V ratio) —for every job vacancy, 4.1 individuals were unemployed. In comparison, Canada’s U/V ratio stood at 6.1 in the previous year. Overall, this suggests Canada’s labour market tightened considerably in FY1718.
In 2017, Canada’s real gross domestic product (GDP) rose 3.0%, following a 1.1% increase in 2016. Real GDP increased in every province and territory, with Alberta's growth being the strongest among the provinces (+4.4%), rebounding from a 4.2% decline in the previous year. In the territories, real GDP growth ranged from 3.1% in Yukon, 3.7% in Northwest Territories, and 9.8% in Nunavut.
For 2018, Canada’s real GDP is forecasted to grow by approximately 2%, with economic expansion projected in most parts of the country, albeit at a more moderate pace than in 2017.
1.2 Main resultsFootnote 2
Decline in the number of EBSM clients and interventionsFootnote 3
In FY1718, the use of labour market programming declined throughout Canada. Under the Labour Market Development Agreements (LMDAs), provinces and territories served 695,911 clients, dropping by 5.2% compared to the previous year. Similarly, the number of LMDA interventions delivered to clients decreased by 6.5% year over year; to a total of 1,071,881 interventions.
With the addition of programs and services delivered by Indigenous organization through the Aboriginal Skills and Employment Training Strategy (ASETS), a grand total of 715,658 EBSM clients were served (-4.8%), and 1,107,740 EBSM interventions (-6.0%) were delivered in FY1718.
The overall client-to-intervention edged down to 1.55, compared to 1.57 in the previous year, as the number of interventions declined at a higher rate than the client totals.
Overall expenditures edged down by 0.6% to a total of $2.17 billion.
1.3 Client profile and participation
Terminology guide
A client is a person who has participated in programs or services that are funded by the LMDAs or by Indigenous organizations. See section 1.3 for details for client types.
An intervention is a discrete program or service that a client participates in. See Section 1.4 and 1.5 for the type of interventions available to clients.
Any reference to participants in this chapter is equal to the number of interventions, where information on designated groups is only collected at the intervention level.
In FY1718, 313,998 active EI claimants were served, decreasing by 10.6% year over year. Non-insured clients also declined by 6.3%. Former EI claimants were the only client type to increase, growing by 21.3% year over year. New provisions introduced in July 2016 expanded the definition of former claimants to those who completed an EI claim in the previous five years, compared to three years under old provisions.Footnote 4 As a result, the sudden growth among former claimants in FY1718 is largely attributable to the legislation changes. The decline in active claimants largely stems from overall declines in the usage of EI programming (see table 1 for details about the three types of clients).
| Client type | Total of client served | Year-over-Year Change (%) | Share of total clients |
|---|---|---|---|
| Active claimants | 313,998 | -10.6% | 43.9% |
| Former claimants | 115,927 | +21.3% | 16.2% |
| Non-insured clients: | 285,733 | -6.3% | 39.9% |
Active claimants are those who had an active EI Part I regular claim when they requested assistance under Part II of the Employment Insurance Act. Typically, they have stronger and more recent job attachment. They tend to be able to return to work more quickly than those with weaker ties to employment. Active claimants who are considered job-ready from an analytical point of view often seek out short-term interventions under EI Part II to find their next employment opportunity. Others require longer-term Employment Benefits to upgrade their skills, establish certification or refine their job search strategies.
Former claimants are those who completed an EI claim in the previous five years, or who began a parental or maternity claim in the last five years when they requested assistance under Part II. They are no longer eligible for EI Part I; however, they remain eligible for EI Part II under certain criteria.Footnote 5 Former claimants do not receive income support under Part I of the Employment Insurance Act while they complete an Employment Benefit intervention; however, they may receive Part II support while completing their return-to-work action plan.
Non-insured clients are unemployed individuals who are neither active nor former EI clients. Non-insured clients usually have little substantive or recent job attachment. They include new labour force participants and individuals who were formerly self-employed without paid employment earnings. While these clients are not eligible for Employment Benefits under EI Part II, they may access Employment Assistance Services.
Compared to FY0708, provinces, territories and Indigenous organizations served more total clients in FY1718 increasing from a total of 612,622 in FY0708, to 715,658, growing by 16.8% over the ten years. Active EI claimants declined from 337,148 in FY0708, to 313,998 in the most recent fiscal year, dropping by 6.9% over the period.
Former EI claimants and non-insured clients both increased over the ten-year period, by +29.8% and 53.5%, respectively. The growth among non-insured clients in the last ten years resulted in their shares among all clients increasing from 30.4% in FY0708 to 39.9% in the recent year.
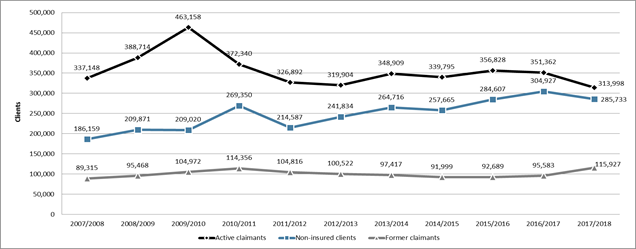
Chart 1 - Text version
| Active claimants | Non-insured clients | Former claimants | |
|---|---|---|---|
| 2006/2007 | 349,865 | 176,879 | 91,458 |
| 2007/2008 | 337,148 | 186,159 | 89,315 |
| 2008/2009 | 388,714 | 209,871 | 95,468 |
| 2009/2010 | 463,158 | 209,020 | 104,972 |
| 2010/2011 | 372,340 | 269,350 | 114,356 |
| 2011/2012 | 326,892 | 214,587 | 104,816 |
| 2012/2013 | 319,904 | 241,834 | 100,522 |
| 2013/2014 | 348,909 | 264,716 | 97,417 |
| 2014/2015 | 339,795 | 257,665 | 91,999 |
| 2015/2016 | 356,828 | 284,607 | 92,689 |
| 2016/2017 | 351,362 | 304,927 | 95,583 |
| 2017/2018 | 313,998 | 285,733 | 115,927 |
Over a number of years, provinces and territories have prioritized serving clients with barriers searching for employment, and individuals further removed from the labour market. This changing shift in focus has resulted in jurisdictions serving more clients who enter LMDA-funded programming as non-insured clients.
Age distributionFootnote 6
In FY1718, the majority (65.5%) of EBSM clients were in their core working years (25 to 54 years old), totalling 413,524 individuals. Youth – those aged 15-24 years old – represented 21.0% of all clients (132,814), and clients aged 55 or older were the remaining 13.4% of the shares (84,918 clients). Compared to the previous year, all three age groups declined: core-aged workers dropped by 6.1%, youth clients slid by 1.2%, and those aged 55 or older edged down by 0.2%.
| Client age group | Total clients served | Year-over-Year Change (%) | Share of total clients |
|---|---|---|---|
| Youth (15 to 24 years old) | 132,814 | -1.2% | 21.0% |
| Core-age (25 to 54 years old) | 413,524 | -6.1% | 65.5% |
| Workers aged 55+ | 84,918 | -0.2% | 13.4% |
Characteristics of youth EBSM clients and youth in the labour market in FY1718:
- Majority of youth are non-insured participants
- Represented 24% of Employment Benefit participants and 20% of EAS participants
- 14% of labour force
- 11.1% unemployment rate
- 63.8% participation rate
Characteristics of core-aged EBSM clients and cored-aged in the labour market in FY1718:
- Close to 80% were either EI active claimants or non-insured
- Represented roughly 2/3 among both Employment Benefit and EAS participants
- 65% of labour force
- 5.2% unemployment rate
- 86.9% participation rate
Characteristics of EBSM clients aged 55+ and workers aged 55 and older in the labour market in FY1718:
- Half of participants are EI active claimants
- Represented about 9% of Employment Benefit participants and 14% of EAS participants
- 21% of labour force
- 5.5% unemployment rate
- 38.0% participation rate
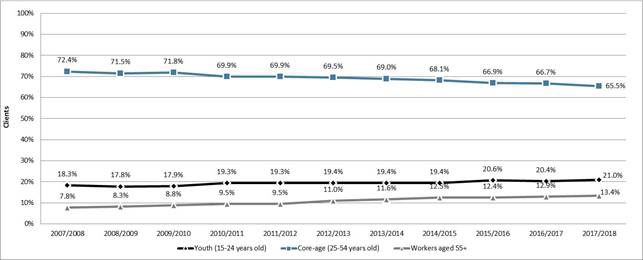
Chart 2 - Text version
| Youth (15-24 years old) | Core-age (25-54 years old) | Workers aged 55+ | |
|---|---|---|---|
| 2007/2008 | 18% | 72% | 8% |
| 2008/2009 | 18% | 72% | 8% |
| 2009/2010 | 18% | 72% | 9% |
| 2010/2011 | 19% | 70% | 9% |
| 2011/2012 | 19% | 70% | 9% |
| 2012/2013 | 19% | 70% | 11% |
| 2013/2014 | 19% | 69% | 12% |
| 2014/2015 | 19% | 68% | 12% |
| 2015/2016 | 21% | 67% | 12% |
| 2016/2017 | 20% | 67% | 13% |
| 2017/2018 | 21% | 66% | 13% |
In the context of an aging labour force, participation in labour market programming for clients aged 55 or older increased by 111.4% since FY0708, and their proportion among all clients has jumped from 7.8% in FY0708, to 13.4% in FY1718. This age cohort has more representation in the workforce than other cohorts, making up roughly 21.1% of the labour force.
Compared to FY0708, youth participation in labour market programming also increased (+41.2%). This age cohort now represents 21.0% of all clients, compared to 18.3% ten years ago. Youth make up about 14% of the labour force, meaning young Canadians are over-represented in labour market programming relative to their representation in the labour market. In recent years, provinces and territories prioritized serving youth, as a means of addressing an aging workforce, and developing and maintaining a competitive workforce.
Given the growth of both youth and clients aged 55 or older, the share of core-age workers (25-54 years old) declined over the last ten years. Core-age workers now represent 65.5% of all clients, compared to 72.4% in FY0708. The representation of this age group in labour market programming is proportional to their current shares in the labour force, which stood at 64.8% in FY1718.
Designated groupsFootnote 7
In support of employment equity principles, ESDC collects information on the EBSM participation of women, Indigenous peoples, members of visible minority groups and persons with disabilities. As participantsFootnote 8 voluntarily self-identify, as such, annual fluctuations may be due to changes in self-identification.
- Women participated in a total of 481,969 EBSM interventions in FY1718, a 2.4% decrease year-over-year (44.4% of all interventions delivered to Canadians). Women represented 44.2% of unemployed workers in FY1718. Women accessed EAS-only interventions (91.3%) at a higher rate than men (82.1%). Among participants who were women, 47.8% were non-insured clients, compared to 37.6% for men.
- In FY1718, a total of 140,688 participants self-identified as persons with disabilities, an increase of 1.2% year-over-year. Over ten years, the proportion of participants with disabilities has increased by over 150%. Among several factors, this can be attributed to workers aging into disability.Footnote 9 Persons with disabilities participated in 13.0% of all interventions delivered in FY1718. The vast majority (93.8%) participated in an EAS-only intervention, compared to 6.2% who participated in Employment Benefits. Just over half were non-insured clients (50.6%), followed by 27.2% who were active claimants, and 22.2% who were former claimants.
- Indigenous peoples participated in 87,519 interventions in FY1718, a slight increase of 0.9% year-over-year. As a share of all ESBM interventions delivered in Canada, Indigenous people participated in 7.9% of the total, including programming delivered through ASETS. As in previous years, most Indigenous participants relied on EAS-only interventions (94.7% of all interventions). However, Employment Benefits grew by almost 28%, and represented 5.3% of total interventions delivered to Indigenous participants.
- Members of visible minority groups participated in 77,719 interventions in FY1718, increasing by 10.0% year-over-year. As a proportion of all interventions delivered in Canada, members of visible minority groups represented 7.2% of all participants. The majority of interventions (95.4%) were EAS-only, compared to 4.6% for Employment Benefits.
Official languages
ESDC furthers the commitment of the Government of Canada to foster the full recognition and use of both English and French in Canadian society, by ensuring that labour market programs and services are delivered in both official languages. In this context, all LMDAs contain commitments by provinces and territories to have programs and services delivered in both official languages where there is significant demand.
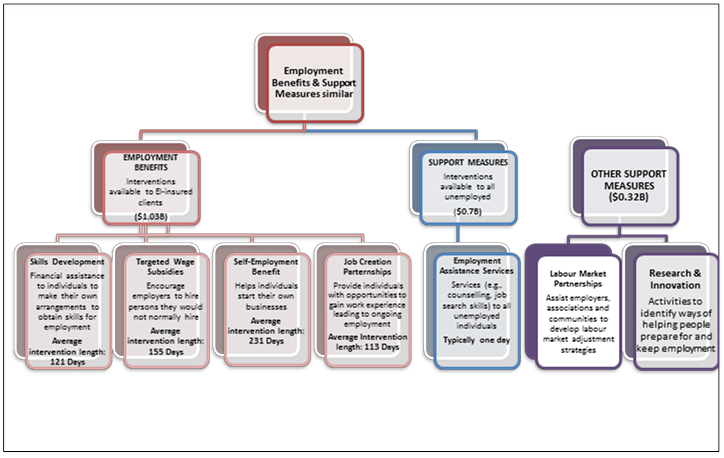
1.4 Interventions: Employment benefits
Employment Benefits consists of longer-term interventions focused on providing skills or work experience required to regain employment. Under the LMDAs, provinces and territories provide employment benefits similar to the following six benefits types outlined in the EI Act: Skills Development-Regular (SD-R); Skills Development-Apprentices (SD-A); Targeted Wage Subsidies (TWS); Self-Employment (SE); Job Creation Partnerships (JCPs); and Targeted Earnings Supplements (TES)Footnote 10.
In FY1718, Employment Benefits interventions totalled 141,722, decreasing by 3.6% compared to the previous reporting period. This can be attributed to the declining number of active claimants, usually the main beneficiaries of these types of interventions. The average length of an Employment Benefit intervention increased from 117 days in FY1617, to 125 days in FY1718. The increased duration of Employment Benefits suggests clients participating in labour market programming were served with more intensive supports.
SD-R interventions edged up by +5.2% to a total of 55,360, while SD-A interventions dropped by 9.3%, to a total of 62,277 in FY1718. Combined, Skills Development interventions made up 83.3% of all Employment Benefits, and Skills Development expenditures totalled $829.6 million, lower than the $855.3 million spent in FY1718.
In FY1718, TWS interventions dropped by 6.9% year-over-year, to 15,266, and represented 10.8% of all Employment Benefits. Expenditures on TWS programming totalled $109. 9 million, a decline of $11.1 million in spending compared to the previous fiscal year.
The number of SE interventions delivered decreased by 6.3%, to 5,749, with their shares among all Employment Benefits reaching 4.1%. However, SE expenditures increased in FY1718; going from $59.8 million in FY1617, to $61.6 million in the current reporting year.
Overall, JCP interventions declined to 3,070, sliding by 5.6% year over year. JCP expenditures dropped to $33.7 million, compared to $34.8 million in the previous year.
Text version
- Employment Benefits & Support Measures similar
- EMPLOYMENT BENEFITS: Interventions available to EI-insured clients ($1.03B)
- Skills Development: Financial assistance to individuals to make their own arrangements to obtain skills for employment. Average intervention length: 121 Days
- Targeted Wage Subsidies: Encourage employers to hire persons they would not normally hire. Average intervention length: 155 Days
- Self-Employment Benefit: Helps individuals start their own businesses. Average intervention length: 231 Days
- Job Creation Partnerships: Provide individuals with opportunities to gain work experience leading to ongoing employment. Average Intervention length: 113 Days
- EMPLOYMENT BENEFITS: Interventions available to EI-insured clients ($1.03B)
- SUPPORT MEASURES: Interventions available to all unemployed ($0.7B)
- Employment Assistance Services: Services (e.g., counselling, job search skills) to all unemployed individuals. Typically one day
- Other Support Measures ($0.32B)
- Labour Market Partnerships :Assist employers, associations and communities to develop labour market adjustment strategies
- Research & Innovation: Activities to identify ways of helping people prepare for and keep employment
| Employment benefits | Interventions | Share of Employment Benefits | Year-over-Year Change | Expenditures ($000s) | Estimated Cost Per Intervention |
|---|---|---|---|---|---|
| Targeted Wage Subsidies | 15,266 | 10.8% | -6.9% | $109.9 | $7,195 |
| Self-Employment | 5,749 | 4.1% | -6.3% | $61.6 | $10,713 |
| Job Creation Partnerships | 3,070 | 2.2% | -5.6% | $33.7 | $10,973 |
| Skills Development-Regular | 55,360 | 39.3% | +5.2% | $829.6 | $7,052 |
| Skills Development-Apprentice | 62,227 | 44.0% | -9.3% | ||
| Canada | 141,722 | 100% | -3.6% | $1,034.7 | $7,301 |
1.5 Interventions: Support measures
Part II of the Employment Insurance Act authorizes three support measures: Employment Assistance Services (EAS), Labour Market Partnerships (LMPs) and Research and Innovation (R&I). Through LMDAs, provinces and territories deliver these measures at regional and local levels, while ESDC retains responsibility for pan-Canadian delivery of LMPs and R&I (see section 4: Pan-Canadian Activities and the National Employment Services). In FY1718, Support Measures were available to all unemployed individuals in Canada, including non-insured clients. However, LMPs and R&I are generally not associated with direct client services and, therefore, counts on participants or interventions are not available. Delivered by the provinces and territories, the EAS component of Support Measures provides a full range of self-help and assisted services, such as support in determining career objectives through employment counselling, improving job search techniques, completing a return-to-work action plan, and accessing labour market information in support of career choices.
1.5.1 Employment Assistance Services
Provinces and territories design and deliver interventions similar to Employment Assistance Services (EAS), which in FY1718, were available to all unemployed people in Canada. In addition to helping EI-insured clients, EAS interventions provide crucial support to those who have been absent from the labour market for an extensive period or who have low job attachment. They may also support new immigrants or young people who are entering the Canadian labour market for the first time. These interventions are reported in one of the three following categories: Employment Services, Group Services, and Individual Counselling.
In FY1718, a total of 930,159 EAS interventions were delivered, decreasing by 7.0% year-over-year. Total expenditures on EAS dropped by 3.7%, to a total of $694.1 million, a decline of $26.1 million compared to the previous year.
Interventions similar to Employment Services continued to be the most common EAS intervention type, accounting for 57.7% of all EAS interventions in FY1718. A total of 537,032 Employment Services interventions were delivered, a decrease of 10.7% year-over-year. Group Services dropped by 28.2%, for a total of 21,764 interventions delivered. In turn, the share of Group Services among all EAS-type interventions dropped to 2.3%, compared to 2.5% in the previous year. Individual Counselling is particularly important when supporting clients who face barriers to employment, and often need action plans as a pathway to Employment Benefits. A total of 371,363 interventions were delivered in FY1718, dropping by 0.5% year-over-year.
1.5.2 Other support measures
The Labour Market Partnership (LMP) initiative facilitates collaboration between employers, employees and employer associations, as well as, community groups and communities to develop solutions to labour force imbalances, such as persistent high unemployment or skill shortages. In FY1718, LMP expenditures totalled $171.9 million, increasing by 7.2% year-over-year.
Research and Innovation (R&I) initiatives identify better ways of helping people prepare for, return to or maintain employment and participate productively in the labour force. In FY1718, R&I expenditures increased to $148.4 million, which is 27.4% higher than in the previous year.
| Interventions | Share of Employment Support Measures | Year-over-year Change | Expenditures ($000s) | Estimated cost per intervention | |
|---|---|---|---|---|---|
| Employment Assistance Services* | |||||
| Employment Services | 537,032 | 57.7% | -10.7% | $694.1 | $746 |
| Group Services | 21,764 | 2.3% | -13.9% | ||
| Individual Counselling | 371,363 | 39.9% | -0.5% | ||
| Total Employment Assistance Services | 930,159 | 100% | -7.0% | $694.1 | |
| Other Support Measures | |||||
| Labour Market Partnerships | n/a | n/a | n/a | $171.9 | n/a |
| Research & Innovation | n/a | n/a | n/a | $148.4 | n/a |
| Canada | 930,159 | 100% | -7.0% | $1,014.4 | n/a |
- *Expenditures for Employment Assistance Services are only reported at the aggregate level by most provinces and territories.
1.6 Expenditures
Total expenditures under Part II of the Employment Insurance Act were $2.17 billion in FY1718, which included EBSM programming, LMPs and R&I, as well as the pan-Canadian activities. This represented a slight decrease of 0.6% compared to the previous year.
Under the LMDAs, Employment Benefits remained the largest investment, at $1,034.7 billion, representing half of total expenditures by provinces and territories. Compared to FY1718, spending on Employment Benefits declined by over $35 million (-3.3%). Employment Assistance Services expenditures decreased as well, sliding by 3.7%, or $26.3 million, to a total $694.1 million. This decline in spending is largely attributable to decreasing interventions due to an improving economy, and fewer clients served by provinces and territories.
Expenditures towards LMPs and R&I measures increased, going from $277 million in FY1617, to $320.43 million in FY1718 (+15.7%).
Pan-Canadian expenditures edged up by 5.4%, increasing from $114.1 million in FY1617 to $120.2 million to FY1718. See Section 4 of this chapter for details on Pan-Canadian activities.
FY1718 Employment Benefits and Support Measures Key Facts
| EI Active & Former Clients (LMDA) | Non-Insured Clients (LMDA) | Pan-Canadian1 |
|---|---|---|
| 429,925 | 285,733 | 19,747 |
| Active Claimants | Former Claimants | Non-Insured |
|---|---|---|
| 43.9% | 16.2% | 39.9% |
| Youth clients (15–24)2 | Core Age clients (25–54)2 | Clients aged 55 or older2 |
| 21% | 65.5% | 13.4% |
| FY1718 | Year-over-Year Change | |
|---|---|---|
| Employment Benefits | 141,722 | 3.6% |
| Support Measures: EAS | 930,159 | 7.0% |
| Pan-Canadian | 35,859 | 13.0% |
| FY1718 | Year-over-Year Change (p.p.) | |
|---|---|---|
| Employment Benefits | 13.2% | 0.4 |
| Support Measures: EAS | 86.8% | 0.4 |
| FY1718 ($ Million) | Year-over-Year Change | |
|---|---|---|
| Employment Benefits | $1,034.7 | 3.3% |
| Support Measures: EAS | $694.1 | 3.7% |
| LMPs and R&I | $320.3 | 15.7% |
| Pan-Canadian | $120.2 | 5.4% |
| Total Expenditures | $2,169 | 0.6% |
| Indicator | Total | Year-over-Year Change |
|---|---|---|
| Active Claimants Served | 313,998 | 10.6% |
| Returns to Employment | 177,335 | 5.3% |
| Estimated Unpaid Benefits ($ Million) | $1,103.2 | 18.0% |
- 1 EI Part II Pan-Canadian services to individuals are through the Aboriginal Skills and Employment Training Strategy.
- 2 Age distribution does not equal 100%, as the “unknown” category is not reported here. Date of birth is not collected for clients in SD-Apprentices and Group Services.
- 3. Totals may not add up exactly due to rounding; accounting adjustments are not included.
1.7 Key Performance IndicatorsFootnote 11
ESDC monitors the results of EBSM-similar programming delivered by provinces and territories through three key performance indicators:
- the number of active EI claimants served;Footnote 12
- the number of EI clients who return to employment following an intervention;Footnote 13 and
- the amount of unpaid EI Part I benefits resulting from the returns to employment.
In the context of improving labour market and economic conditions in FY1718 throughout most parts of Canada, the number of active EI claimants served (313,998) dropped by 10.6% year-over-year. Returns to work edged down by 5.3% year-over-year, with a total of 177,335 clients finding employment within six months of completing their interventions. Stemming from the declines in active EI claimants and lower returns to work, unpaid EI Part I benefits totalled $1.103 billion, dropping by 18.0% compared to the previous year.
Table 5 presents supplementary performance indicators at the national and provincial/territorial level, contextualized with labour market aggregates. Since multiple factors can influence results at the individual, jurisdictional and national level, these indicators cannot be unequivocally attributed to LMDAs.
At the national level, 59.5% of active EI claimants began their first LMDA-funded intervention within 12 weeks after their Benefit Commencement Period (BPC). Compared to FY1617, this is an increase of 2.8 percentage points, where 56.7% of active claimants began within 12 weeks that year. At the provincial/territorial level, most jurisdictions registered an increase, as well, and results ranged from 74.8% in Quebec, to 20.2% in Newfoundland and Labrador.
In FY1718, Canada’s returns to work from interventions among active clients, expressed as a proportion of Canada’s labour force, was 0.9%. Five provinces and territories exceeded the national average. Secondly, unpaid EI regular benefits stemming from returns to work, expressed as a proportion of total EI regular benefits paid, was 8.7% at the national level. Quebec, Manitoba, Saskatchewan, Alberta, and British Columbia posted higher proportions than the national figure.
Only Quebec registered above the national average for the last two ratios. This suggests an effective and efficient balance between returning clients to work as soon as possible, while ensuring the necessary active employment services for employment success over a mid- to long-term horizon.
| Unemployment Rate (FY1718) | Job Vacancy Rate (FY1718) | EI Active Claimants (%) Beginning EI Part II within 12 Weeks Following their Part I Benefit Period Commencement* (FY1718) | Returns to Work Among Active EI Clients from EBSM Interventions, as a Proportion of the Labour Force (FY1718) | Estimated Unpaid EI Regular Benefits Resulting EBSM Interventions, as a Proportion of Part I Regular Benefits Paid (FY1718) | |
|---|---|---|---|---|---|
| Newfoundland & Labrador | 14.7% | 1.7 | 20.2% | 1.1% | 1.8% |
| Prince Edward Island | 8.2% | 2.7 | 60.1% | 2.7% | 4.1% |
| Nova Scotia | 8.3% | 2.5 | 36.1% | 1.1% | 3.7% |
| New Brunswick | 8.0% | 2.6 | 55.3% | 2.3% | 4.0% |
| Quebec | 5.9% | 2.5 | 74.8% | 1.5% | 10.8% |
| Ontario | 5.8% | 3.0 | 44.3% | 0.5% | 7.3% |
| Manitoba | 5.5% | 2.4 | 49.3% | 0.7% | 10.7% |
| Saskatchewan | 6.1% | 2.2 | 35.0% | 0.8% | 10.6% |
| Alberta | 7.4% | 2.6 | 38.4% | 0.8% | 12.9% |
| British Columbia | 5.0% | 4.1 | 41.7% | 0.8% | 11.4% |
| Northwest Territories | 6.9% | 2.8 | 34.4% | 0.6% | 6.3% |
| Yukon | 5.4% | 4.0 | 41.1% | 0.6% | 5.3% |
| Nunavut | 14.5% | 3.1 | 27.0% | 0.3% | 5.0% |
| Canada | 6.1% | 2.9 | 59.5% | 0.9% | 8.7% |
- Source: Labour Force Survey, Business Payroll Survey, and EI Administrative Data.
- *This includes a small percentage of clients who began EI Part II programming up to 2 weeks prior to their Part I Benefit Period Commencement. SD-A participants and those who were non-insured participants were excluded, if they had taken EAS in the previous year.
1.8 Online resources about LMDAs programs and services
Increasingly the internet is an important resource when seeking employment, or to learn about skills development and training supports that are available to Canadians.
In FY1718, the federal government reached out to provinces and territories to gain a better understanding of the tools and materials about the labour market programming on their respective websites. In many cases, these resources serve as the central point of access to information regarding employment and training initiatives, and most are funded by the provinces and territories. (See Annex 3.16 for a full list of websites.)
For more information about LMDA-funded programs and services in your province or territory, visit the following:
- Newfoundland and Labrador’s Department of Advanced Education, Skills and Labour
- Prince Edward Island’s Skills PEI Division
- Nova Scotia’s Labour and Advanced Education
- New Brunswick’s Post-Secondary Education, Training and Labour
- Quebec’s Ministry of Education and Social Solidarity
- Ontario’s Ministry of Training, Colleges and Universities
- Manitoba’s Entrepreneurship, Training and Trade
- Saskatchewan’s Ministry of the Economy
- Alberta’s Ministry of Human Services
- British Columbia’s Ministry of Social Development
- Northwest Territories’ Department of Education, Culture and Employment
- Yukon’s Department of Education
- Nunavut’s Department of Education
Newfoundland and Labrador
Newfoundland and Labrador delivers a range of employment and training programs and services through the province’s website. These online tools assist individuals to find employment, help employers to access the workers they need, and ensure that communities and regions throughout Newfoundland and Labrador are well equipped to respond to labour market opportunities and challenges. There are a number of online employment related workshops available to assist individuals in their career and employment planning process. As well, there are online workshops available to assist employers with a host of human resource related needs. Clients can also access computers and online resources through any of the community-based resource Employment Centres located across Newfoundland and Labrador. The province also uses the Labour Market Programs Support System (LaMPSS), an online application system for employers and community partners to apply for programs. This online resource provides information about program guidelines and offers a user guide for the application.
Prince Edward Island
Prince Edward Island’s SkillsPEI website and the provincially funded WorkPEI site connect job seekers with employers. These sites, in conjunction with JobBank, provide valuable information to job seekers about programs and services to assist them transition to employment as well as provide employers with information to assist them meet their workforce needs. Through the EAS program, service providers offer a variety of tools to support clients as they navigate the career assessment process and move along the path to sustainable employment. The Department of Workforce and Advanced Learning (WAL) launched a new provincially funded website in 2016, called WorkPEI.ca. WorkPEI provides job seekers and employers with a variety of job search tools including a job board, information on labour related programs and services available on PEI and labour market information. WorkPEI also enables employers to search the online resumes of registered job seekers. Using their own private dashboard, employers can manage job applications and contact applicants directly for any published vacancies or future opportunities. WorkPEI helps match labour supply with local labour demand through the centralized location of job vacancies in PEI, while also providing job seekers with greater access to the hidden job market.
Nova Scotia
Similarly, in Nova Scotia LMDA program information is posted to the Labour and Advanced Education website, which offers details on each program’s objective, eligibility criteria and program guidelines. Programs directed to employers also provide information and the means to apply on-line. Each EAS service provider also makes links to the LAE website on their own organisation’s web pages. Nova Scotia will also be launching a Virtual Careers portal. In FY1718, the province has developed the Request for Proposals for a vendor to design, create, and manage Nova Scotia’s virtual employment services presence on the Internet.
New Brunswick
In New Brunswick, the province’s NBjobs.ca site offers clients links to job postings, job search guides, labour market information, and resources for employers. The province is developing an online job fair platform, as a cost-effective way to connect employers with prospective candidates, and to communicate many provincial workforce strategies with the public. The site also promotes Employment and Continuous Learning Services, and a viable way to collect local LMI from employers and job seekers to feed into a regional/provincial database.
Quebec
Under the LMDA, Quebec has the exclusive responsibilities of government services for placement and labour market information in the province. These services, which are an integral part of the continuum of services, are intended for the public and for businesses. They are provided in different ways but are most often used online.
L’IMT en ligne provides relevant information to career exploration and choices as well as job reintegration. This site, which receives about three million visits annually, disseminates information on occupations, training programs, industries, and companies to help users make employment-related decisions.
Placement en ligne enables job seekers to post their applications and companies to advertise their vacant positions (regular jobs, student jobs, and internships). Due to the breadth of information made available to the public (over 900,000 vacant positions per year from more than 40,000 companies) and the matching mechanisms associated with it, Placement en ligne’s website receives several million visits every year.
Ontario
The redesigned Employment Ontario website gives job seekers information on training, skills building, or assistance finding a job. Through the website, users are also able to request an appointment with a counsellor to help them develop career goals, prepare for interviews, or get ready for a new job. The website’s new live chat option supports users with job search advice, and offers details on training and hiring supports. An important part of the website redesign included the addition of real-time labour market information, acquired through the collection and analysis of job posting data. These data provide Ontarians with more timely, local, and specific information compared to traditional sources of labour market information. In addition to Ontario’s own online resources, the Career Ready Fund and Skills Catalyst Fund (funded as Research and Innovation) support a range of organizations to offer digital tools that help jobseekers, students, as well as, recent graduates connect and collaborate with employers to develop their skills.
Manitoba
Manitoba’s website provides information on a wide range of provincial labour market programming including LMDA, WDA and provincially funded services including directory of where to obtain these services. The website provides Manitobans with links to Apprenticeship Manitoba, Job Bank website, youth services, Adult Literacy Programs, Adult Learning Centres, Manitoba Student Aid, Post Secondary Education and career development resources.
Saskatchewan
Saskatchewan’s website provides links and information on labour market development programs, tools, and services to assist clients return to work. In addition, community-based organizations and training institutions also provide information about programs and services they deliver. These organizations may also use social networking sites to promote their programs and services. For employers, SaskJobs is an effective tool to find potential workers.
Alberta
ALIS is Alberta’s gateway to career, learning, employment and workplace information and resources, helps Albertans make informed decisions necessary to succeed in the labour market. ALIS provides support to a broad audience including junior high, senior high and post-secondary students, newcomers and influencers such as parents, educators, counsellors and career practitioners. ALIS is used by front-line delivery staff, educators and parents to support students in career planning, as well as by third-party agencies supporting Albertans with barriers to the labour market. ALIS provides Albertans with tools to help them through the career planning process and information related to résumé and cover letter writing, preparing for an interview, who to provide as references, and how to find work opportunities. ALIS also includes a series of work books to help individuals with low-literacy enter the workforce. The series cover topics such as making job choices, deciding on a job, finding a job, keeping a job, and training for work. ALIS is partially supported with LMDA funding: these funds support the development of some of contents and tools, and provides ongoing maintenance for some of the resources. The contents and articles on ALIS are updated regularly.
British Columbia
British Columbia provides extensive online resources to help potential clients learn about programs and services, research career paths, and learn about local labour market conditions. In addition to detailed information about WorkBC employment services, online resources for potential clients include BC’s Career Guide for Indigenous People 2018; Blueprint Builder ‐ an online career planning tool; and WorkBC's Career Trek videos. In addition to tools for potential clients, WorkBC’s Online Employment Services (OES) system provides clients with 24/7 access to ministry information and services via an online channel. Among the many online functionalities, clients and service providers can access an online application portal for Apprenticeship programs and services; an Intake Management application for service providers to manage applications; and a Targeted Referral and Feedback (TRF) functionality for service providers to receive prospective clients from Service Canada. Additionally, providers can complete and submit Community Employment Partnerships (CEP).
WorkBC also provides multiple online resources to connect employers with potential workers. This site contains the most comprehensive database of B.C. job postings, an interactive map of WorkBC Employment Services Centres across the province, and features a live chat for instant help with using the website and finding information. The Government of BC Service Design team within the Government Digital Experience Division is changing how citizens access government services by bringing innovation and a human‐centred approach. The role of service design is to put human experience and need in the forefront of the design thinking process. Empathizing, asking questions and testing ideas can help create better innovations and services relevant to the people who use them. The WorkBC Online Employment Service Portal will continue to leverage this Service Design approach and client experience analytics to continually improve the citizen experience.
Northwest Territories
In Northwest Territories, the territory’s website offers information about the suite of labour market programming, labour market information, and information about in-demand occupations, as well as, links various job boards, including Job Bank. Moving forward, the territory intends to develop an Interactive Labour Market Information Portal that targets youth and students, providing relevant, accurate, and timely labour market information to make informed and evidence-based educational, career and business decisions.
Yukon Territories
Yukon’s online resources for employment benefits and support measures are delivered through the territory’s website. Skills Development, Apprenticeship, EAS, and Labour Market Partnerships are currently centrally located through Yukon Government's website.
2. Provincial and territorial EBSM activities
This section analyzes the provincial and territorial economic environment and EBSM-similar activities in FY1718; linking trends in clients served, interventions, and expenditures to local labour market conditions, and employment programming priorities.
2.1 Context
Under the LMDAs, provinces and territories received funding to support the delivery of programs and services, similar to the EBSMs established under Part II of the Employment Insurance Act.Footnote 14 To address unique labour market challenges, provinces and territories delivered employment programming under LMDAs, which were individually negotiated with the Government of Canada. Provinces and territories designed and delivered all EI-funded active employment programming, except for pan-Canadian activities, discussed in Section 4 of this chapter.
Broad-based consultations were held in FY1617 with provinces, territories and stakeholders to identify ways to improve labour market transfer agreements and guide future investments to strengthen labour market programming. Comments received indicated a desire for agreements to be more flexible and responsive to the needs of employers and Canadians, especially those who are underrepresented in the workforce.
Budget 2017 announced new measures to rationalize and expand the existing bilateral labour market transfer agreements with provinces and territories, including the LMDAs. This included amending the EI Act to expand eligibility for Employment Benefits to also include unemployed individuals who have made minimum Employment Insurance premium contributions in at least five of the last ten years. Eligibility for Employment Assistance Services was broadened to include both the unemployed and employed. Provinces and territories were also provided with increased flexibility to support employer-sponsored training under the Labour Market Partnerships Support Measure. These changes took effect on April 1, 2018 and were reflected in amending agreements signed with provinces and territories. These amendments can be found through the LMDA’s website.
In addition, the amended LMDAs require provinces and territories to consult with employer and employee organizations and stakeholders representing Official Language minority communities as part of their annual planning process, as well as to provide ESDC with lists of stakeholders consulted, key priorities coming out of the consultations and linkages with labour market programming priorities.
Budget 2017 also announced an additional $1.8 billion investment in the LMDAs over six years (2017-2018 to 2022-2023), to help more Canadians access EI-funded skills training and employment supports.
Overall, Canada’s economy and labour market performed well in FY1718, resulting in a decline in the number of clients served and LMDA-funded interventions delivered in most provinces and territories. The economy grew in all provinces and territories, and employment levels increased in all but two provinces. Despite varying economic and labour market outcomes, all jurisdictions prioritized improving the labour market attachment of underrepresented groups, such as persons with disabilities, Indigenous persons, recent immigrants, youth, and older workers; as well as ensuring that employers can readily access a skilled workforce. An aging workforce and out-migration remains a particular labour market challenge for Atlantic region, where the provinces worked with communities and regional stakeholders to ensure labour market programming responds to the demographic pressures.
The Managing for Results section for each provincial and territorial summary highlights innovative approaches to improve outcomes for clients. These include:
- Employer engagement in program priorities and design,
- Strategies to deliver active employment supports earlier for EI claimants and,
- Approaches in the use of the Research and Innovation support measure in some jurisdictions.
2.2 Newfoundland and LabradorFootnote 15
In 2017, Newfoundland and Labrador’s real GDP rose by 0.9%, the lowest growth rate among all provinces and territories. The province’s economic growth is forecasted to further soften in 2018, as construction on large scale projects such as the Hebron oilfield and Muskrat Falls dam continue to wind down.
Newfoundland and Labrador: EBSM Key Facts
| EI Clients | Non-Insured Clients |
|---|---|
| 11,760 |
1,107 |
| Interventions Type | 2017/2018 | Year-over-Year Change |
|---|---|---|
| Employment Benefits | 8,037 | 5.6% |
| Support Measures: EAS | 18,627 | 3.9% |
| Interventions Type | 2017/2018 | Year-over-Year Change(pp) |
|---|---|---|
| Employment Benefits | 30.1% | 2.1 |
| Support Measures: EAS | 69.9% | 2.1 |
| Total Expenditures | 2017/2018 ($ million) | Year-over-Year Change |
|---|---|---|
| Employment Benefits | $112.3 | 4.0% |
| Support Measures: EAS | $6.8 | 9.3% |
| LMPs and R&I | $9.7 | 201.6% |
| Total Expenditures1 | $128.9 | 1.9% |
| 2016/2017 | 2017/2018 | Year-over-Year Change |
|---|---|---|
| $23.23 | $17.47 | 24.8% |
- 1 Totals may not add up due to rounding; does not include accounting adjustments.
Labour market conditions in Newfoundland and Labrador continued to deteriorate in FY1718. Employment declined by 3.4% to 223,600, representing a setback for a fifth consecutive year. Employment in the goods-producing sector decreased from 49,600 to 47,200 (-4.9%), with significant losses in forestry, fishing, mining, oil and gas (-2,000, -14.3%) and in construction (-1,000; -4.6%), only partially offset by gains in agriculture (+400; +26.7%) and utilities (+100; +5.2%). Following the same trend, employment in the services-producing sector weakened (-5,400; -2.9%), with the largest losses recorded in information, culture and recreation (-1,100; -14.9%); finance, insurance, real estate, rental and leasing (-1,000; -13.9%); professional, scientific and technical services (-1,100; -10.1%); trade (-2,800; -6.6%); and other services (-700; -5.5%).
Changes in the economy, technology and an aging population are the main driving forces shaping labour market conditions in Newfoundland and Labrador. To create a provincial climate conducive to economic growth and job creation, in partnership with communities and various local and regional stakeholders, the province identified the following key investment priorities in FY1718:
- strengthening access to flexible, responsive and innovative labour market programming;
- developing a responsive and adaptive workforce, through effective employment and skills training programming, with a focus on underrepresented groups; and,
- commencing the development of a comprehensive human resources plan to support sector diversification and the development of a productive and knowledge-intensive economy.
2.2.1 Managing for results
The Government of Newfoundland and Labrador, through the Cabinet Committee on Jobs, has initiated a number of activities in recent years to support sector growth and diversification. These include:
- bringing a wide range of stakeholders (industry, education and training providers, as well as government) together to discuss sector challenges and determine actions to address these challenges (to date, with agriculture, aquaculture, technology, forestry, community and mining sector);
- sector-specific research activities related to human resources (e.g., occupation-related research in aquaculture, agriculture, and oil and gas);
- greater career exploration programming within the primary and secondary educational system to more closely align with future industry demands;
- initiatives related to immigration, education and literacy, to increase and strengthen the province’s labour supply for future sector requirements; and,
- actions to build upon the quality, availability and benefits of labour market information.
2.2.2 Clients, interventions and expenditures
Compared to the previous fiscal year, the total number of clients served in Newfoundland and Labrador during FY1718 increased from 12,352 to 12,867, a growth of 4.2% year-over-year. While the number of active claimants (+82; +0.9%) and former claimants (+558; +30.8%) expanded, non-insured clients (-125; -10.1%) weakened.
With respect to their shares of the total number of clients served, active claimants (73.0%) and non-insured clients (8.6%) fell by 2.4 and 1.4 percentage points respectively, whereas former claimants (18.4%) climbed by 3.7 percentage points.
For a fourth consecutive year, the total number of EBSM-similar interventions in Newfoundland and Labrador grew, reaching 26,664 (+0.9%) in FY1718. The Employment Benefits’ share of all EBSM-similar interventions declined from 32.2% to 30.1%. A total of 2,795 (-24.4%) EI clients returned to employment after participating in an EBSM-similar program. Unpaid benefits (-24.8%) fell from $23.23 million to $17.47 million. EBSM total expenditures reached $128.9 million (+1.9 %), including $4.6 million from the province’s share of the additional $125 million LMDA investment announced in Budget 2017.
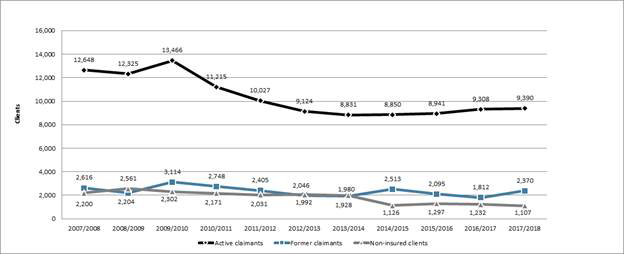
Chart 3 - Text version
| Active claimants | Former claimants | Non-insured clients | |
|---|---|---|---|
| 2007/2008 | 12,648 | 2,616 | 2,200 |
| 2008/2009 | 12,325 | 2,204 | 2,561 |
| 2009/2010 | 13,466 | 3,114 | 2,302 |
| 2010/2011 | 11,215 | 2,748 | 2,171 |
| 2011/2012 | 10,027 | 2,405 | 2,031 |
| 2012/2013 | 9,124 | 1,992 | 2,046 |
| 2013/2014 | 8,831 | 1,928 | 1,980 |
| 2014/2015 | 8,850 | 2,513 | 1,126 |
| 2015/2016 | 8,941 | 2,095 | 1,297 |
| 2016/2017 | 9,308 | 1,812 | 1,232 |
| 2017/2018 | 9,390 | 2,370 | 1,107 |
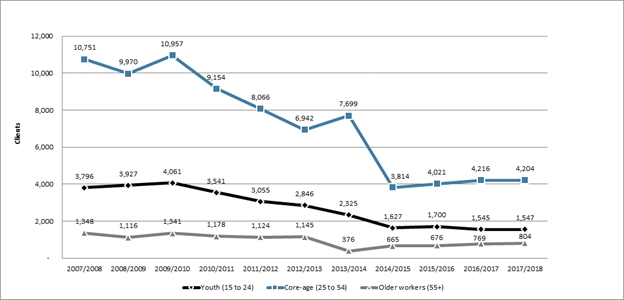
Chart 4 - Text version
| Youth (15 to 24) | Core-age (25 to 54) | Older workers (55+) | |
|---|---|---|---|
| 2007/2008 | 3,796 | 10,751 | 1,348 |
| 2008/2009 | 3,927 | 9,970 | 1,116 |
| 2009/2010 | 4,061 | 10,957 | 1,341 |
| 2010/2011 | 3,541 | 9,154 | 1,178 |
| 2011/2012 | 3,055 | 8,066 | 1,124 |
| 2012/2013 | 2,846 | 6,942 | 1,145 |
| 2013/2014 | 2,325 | 7,699 | 376 |
| 2014/2015 | 1,627 | 3,814 | 665 |
| 2015/2016 | 1,700 | 4,021 | 676 |
| 2016/2017 | 1,545 | 4,216 | 769 |
| 2017/2018 | 1,547 | 4,204 | 804 |
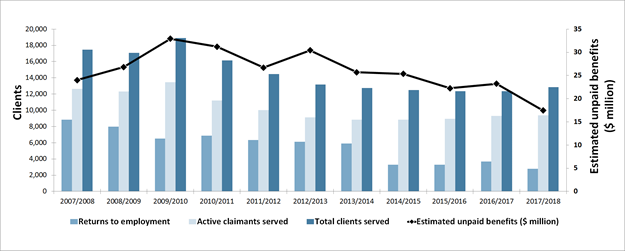
Chart 5 - Text version
| Returns to employment | Active claimants served | Total clients served | Estimated unpaid benefits ($ million) | |
|---|---|---|---|---|
| 2007/2008 | 8,856 | 12,648 | 17,464 | $24.00 |
| 2008/2009 | 7,995 | 12,325 | 17,090 | $26.83 |
| 2009/2010 | 6,526 | 13,466 | 18,882 | $32.94 |
| 2010/2011 | 6,857 | 11,215 | 16,134 | $31.20 |
| 2011/2012 | 6,335 | 10,027 | 14,463 | $26.71 |
| 2012/2013 | 6,114 | 9,124 | 13,162 | $30.42 |
| 2013/2014 | 5,918 | 8,831 | 12,739 | $25.69 |
| 2014/2015 | 3,298 | 8,850 | 12,489 | $25.35 |
| 2015/2016 | 3,306 | 8,941 | 12,333 | $22.25 |
| 2016/2017 | 3,696 | 9,308 | 12,352 | $23.23 |
| 2017/2018 | 2,795 | 9,390 | 12,867 | $17.47 |
Table 7 – Newfoundland and Labrador: EBSM-similar programming, 2017/2018
| Interventions | Year-over-Year Change | Expenditures ($ 000s) | ||
|---|---|---|---|---|
| Employment Benefits | ||||
| SD-R | Newfoundland and Labrador Skills Development | 3,608 | +12.5% | 90,748 |
| SD-A | Newfoundland and Labrador Skills Development | 2,012 | -26.4% | |
| TWS | Newfoundland and Labrador Wage Subsidies | 820 | +1.0% | 5,752 |
| SE | Newfoundland and Labrador Self-Employment Assistance | 286 | +21.2% | 7,314 |
| JCPs | Newfoundland and Labrador Job Creation Partnerships | 1,311 | -14.0% | 8,497 |
| Support Measures | ||||
| EAS | Newfoundland and Labrador Employment Assistance Services | 18,627 | +3.9% | 6,835 |
| LMPs | Newfoundland and Labrador Labour Market Partnerships | n/a | n/a | 4,485 |
| R&I | Research and Innovation | n/a | n/a | 5,229 |
2.2.3 Employment benefits
In FY1718, Newfoundland and Labrador delivered 8,037 Employment Benefits interventions, a 5.6% year-over-year decrease. Significant declines were recorded in SD-A (-722; -26.4%) and JCP (-213; -14.0%). On the other hand, SE (+50) and SD-R (+402) increased by 21.2% and 12.5%, respectively. The province spent $112.3 million (-4.0%) on Employment Benefits.
2.2.4 Support measures: EAS
For a fourth consecutive year, Newfoundland and Labrador delivered a growing total number of EAS interventions, reaching 18,627 (+3.9%) in FY1718. While Group Services (-259; -6.6%) dropped, Employment Services (+388; +4.8%) and Individual Counselling (+572; +9.5%) both grew. EAS total expenditures increased by 9.3% to $6.8 million.
The Province has increased its capacity to provide EAS to the larger urban centres in the province by contracting a third party service provider, Employment Options, to provide employment counselling and case management services to EI eligible clients in the larger communities; St. John’s, Corner Brook and Grand Falls. This increase in capacity and expansion aligns with the vision and goals of the Workforce Innovation Centre, designed to support innovations and impact employability, entrepreneurship, and attachment to the workforce in Newfoundland and Labrador. The focus is to identify ways to better help people prepare for, find, return to, or maintain sustainable employment. Employment Assistance Services will still be available at the Department’s employment centres across the province and assist EI eligible individuals with job searches, resume writing, labour market information, as well as career and employment needs assessments.
2.2.5 Other support measures: LMPs and R&I
In FY1718, total funding for LMPs ($4.5 million) and R&I ($5.2 million) rose significantly, by $1.6 million and $4.9 million, respectively. It should be noted that R&I was delivered for the second time in FY1718, after having been introduced in FY1617.
A Workforce Innovation Centre was established at College of the North Atlantic in February 2017. The Centre’s goal is to support research, testing and sharing of ideas and models of innovation in workforce development that will positively impact employability, entrepreneurship and job attachment in Newfoundland and Labrador.
During FY1718, the Workforce Innovation Centre funded eight multi-year initiatives, totaling over $3.1 million, to support applied research projects that test innovative approaches to address labour market issues and improve employment outcomes. Two examples of such projects include $588,000 over three years to Hospitality Newfoundland and Labrador, to support rural Newfoundlanders and Labradorians who wish to transition to work in the tourism sector, and close to $500,000 over three years for the Genesis Centre of Memorial University, to explore ways to increase entrepreneurship among women and immigrants in the technology sector.
Newfoundland and Labrador Workforce Innovation Centre (NLWIC) supporting sector innovation
With support under the Canada-Newfoundland and Labrador Labour Market Development Agreement, the NLWIC is helping set a new path of discovery. By fostering and establishing partnerships such as the Genesis Project, the NLWIC is supporting a spirit of innovation through initiatives that demonstrate innovation and identify methods to better support workforce development.
The Genesis Project is designed to explore ways to foster innovation in technology entrepreneurship through increased female participation and immigration initiatives. This project will reduce the barriers to entry for under-represented groups in the technology sector, and therefore increase the number of companies with women and/or immigrant founders in Newfoundland and Labrador.
2.3 Prince Edward Island
Following a 1.8% expansion in 2016, Prince Edward Island’s real GDP increased by 3.5% in 2017. The province’s economic growth is expected to have moderated to around 2% in 2018, according to forecasts from the major banks.
Prince Edward Island: EBSM Key Facts
| EI Clients | Non-Insured Clients |
|---|---|
| 4,271 |
1,852 |
| Interventions Type | 2017/2018 | Year-over-Year Change |
|---|---|---|
| Employment Benefits | 3,292 | 35.2% |
| Support Measures: EAS | 6,592 | 8.8% |
| Interventions Type | 2017/2018 | Year-over-Year Change(pp) |
|---|---|---|
| Employment Benefits | 33.3% | 4.6 |
| Support Measures: EAS | 66.7% | 4.6 |
| Total Expenditures | 2017/2018 ($ million) | Year-over-Year Change |
|---|---|---|
| Employment Benefits | $18.8 | 11.3% |
| Support Measures: EAS | $5.1 | 47.9% |
| LMPs and R&I | $1.7 | 17.3% |
| Total Expenditures1 | $25.6 | 1.8% |
| 2016/2017 | 2017/2018 | Year-over-Year Change |
|---|---|---|
| $7.14 | $7.13 | 0.27% |
- 1 Totals may not add up due to rounding; does not include accounting adjustments.
Compared to the previous fiscal year, Prince Edward Island’s labour market conditions in FY1718 improved, since employment (74,300) increased by 3.3% (+2,400) and the unemployment rate edged down by 0.7 percentage points, to 9.9%.
Employment growth was mostly realized in full-time employment (+2,100; +3.6%), while part-time employment (+300; +1.9%) only slightly increased.
In FY1718, employment growth in the good-producing sector (+1,500; +9.3%) was led by gains in construction (+700; +14.4%) and manufacturing (+600; +9.7%).
As for the more modest employment growth in the services-producing sector (+800; +1.5%), gains in trade (+1,000; +9.4%), as well as in health care and social assistance (+400; +3.7%), were partially offset by losses in business, building and other support services (-500; -20.3%) and accommodation and food services (-300; -5.3%).
In FY1718, Prince Edward Island continued to face demographic pressures such as an aging population and the out-migration of the working age population. To address those, the province released its population strategy titled ‘Recruit, Retain, Repatriate – A Population Action Plan for Prince Edward Island’. This strategy will create opportunities to repatriate skilled workers and entrepreneurs, and encourage people worldwide to immigrate to Prince Edward Island. In addition, this action plan sets out a course to grow the population and expand the skills and opportunities of all Islanders.
To ensure employers can access talented, work-ready individuals, the province identified the following labour market priorities for FY1718:
- assist Islanders in developing the necessary skills to prepare for, find and keep employment;
- provide employers access to a skilled workforce;
- ensure communities in Prince Edward Island are able to respond effectively to labour market opportunities and challenges;
- provide financial assistance to non-profit community organizations for short term projects, that provide unemployed individuals with a valuable work experience to develop new skills and increase the potential for long term employment in the labour market;
- invest in supports that provide unemployed individuals with financial and entrepreneurial assistance to launch a new business;
- provide short term funding to encourage partners to develop activities or strategies that will assist individuals or employers who are impacted by labour market challenges in a community or an industry;
- provide funding to external service providers across the province to deliver employment assistance services to assist unemployed Islanders connect to the labour force; and,
- support research and innovative projects aimed at strengthening the ability of the province to respond to emerging labour market realities.
2.3.1 Managing for Results
Throughout FY1718, Workforce and Advanced Learning met both formally and informally with employers, industry associations, chambers of commerce, community based organizations, post-secondary institutions and individuals to learn more about the labour market issues of importance to them, as well as of relevance to job seekers. This collaborative effort ensured programs and services were responsive, timely, relevant and aligned with the labour force needs of PEI’s key economic sectors. As well, ongoing engagement through program delivery provided opportunities for the department to understand the needs, wants and expectations of key stakeholders across the province.
The department supported a number of activities including community outreach, participation in joint tables with federal colleagues and representatives of the Indigenous and Francophone communities along with other key partners. Through this process, the province received valuable feedback and input that informed their design and delivery of the programs and services.
2.3.2 Clients, Interventions and Expenditures
In FY1718, for a third consecutive year, Prince Edward Island served a growing number of clients, totalling 6,123 (+13.4%). While the numbers of both active (+689; +24.6%) and former claimants (+75; +10.6%) rose, non-insured clients (-41; -2.2%) experienced a drop. With respect to their shares of total number of clients served, active claimants (56.9%) advanced by 5.1 percentage points, while the shares of former claimants (12.8%) and non-insured clients (30.2%) decreased by 0.3 and 4.8 percentage points, respectively.
The province delivered, for a fourth consecutive year, a growing number of interventions, reaching 9,884 (+16.4%) in FY1718. The share of EAS relative to the total number of interventions continued to decline, totalling 66.7% (-4.6 percentage points) of all interventions in FY1718.
A total number of 2,202 (+5.8%) EI clients returned to employment after participating in EBSM-similar programming. Unpaid benefits remained stable at $7.13 million (-0.3%). Prince Edward Island spent $25.6 million (-1.8%) for EBSM expenditures, including $1.1 million from the additional LMDA funding announced in the Budget 2017.
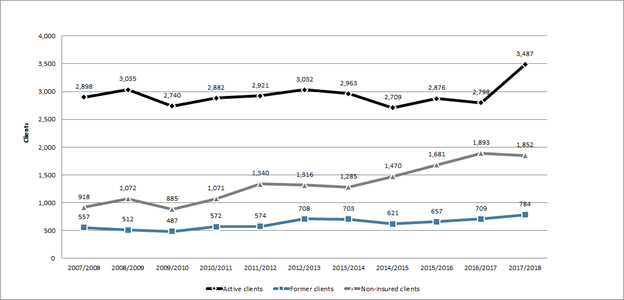
Chart 6 - Text version
| Active clients | Former clients | Non-insured clients | |
|---|---|---|---|
| 2007/2008 | 2,898 | 557 | 918 |
| 2008/2009 | 3,035 | 512 | 1,072 |
| 2009/2010 | 2,740 | 487 | 885 |
| 2010/2011 | 2,882 | 572 | 1,071 |
| 2011/2012 | 2,921 | 574 | 1,340 |
| 2012/2013 | 3,032 | 708 | 1,316 |
| 2013/2014 | 2,963 | 703 | 1,285 |
| 2014/2015 | 2,709 | 621 | 1,470 |
| 2015/2016 | 2,876 | 657 | 1,681 |
| 2016/2017 | 2,798 | 709 | 1,893 |
| 2017/2018 | 3,487 | 784 | 1,852 |

Chart 7 - Text version
| Youth (15 to 24) | Core-age (25 to 54) | Older workers (55+) | |
|---|---|---|---|
| 2007/2008 | 1,003 | 2,645 | 323 |
| 2008/2009 | 1,060 | 2,784 | 323 |
| 2009/2010 | 950 | 2,504 | 275 |
| 2010/2011 | 1,124 | 2,705 | 312 |
| 2011/2012 | 1,202 | 2,937 | 364 |
| 2012/2013 | 1,265 | 3,023 | 446 |
| 2013/2014 | 1,259 | 2,920 | 463 |
| 2014/2015 | 1,276 | 2,776 | 438 |
| 2015/2016 | 1,456 | 2,954 | 508 |
| 2016/2017 | 1,542 | 3,137 | 458 |
| 2017/2018 | 2,309 | 3,072 | 499 |

Chart 8 - Text version
| Returns to employment | Active claimants served | Total clients served | Estimated unpaid benefits ($ million) | |
|---|---|---|---|---|
| 2007/2008 | 2,148 | 2,898 | 4,373 | $7.10 |
| 2008/2009 | 2,186 | 3,035 | 4,619 | $7.69 |
| 2009/2010 | 1,839 | 2,740 | 4,112 | $8.92 |
| 2010/2011 | 2,159 | 2,882 | 4,525 | $9.07 |
| 2011/2012 | 2,034 | 2,921 | 4,835 | $8.16 |
| 2012/2013 | 1,939 | 3,032 | 5,056 | $7.53 |
| 2013/2014 | 2,194 | 2,963 | 4,951 | $7.19 |
| 2014/2015 | 1,934 | 2,709 | 4,800 | $6.52 |
| 2015/2016 | 1,997 | 2,876 | 5,214 | $6.99 |
| 2016/2017 | 2,081 | 2,798 | 5,400 | $7.14 |
| 2017/2018 | 2,202 | 3,487 | 6,123 | $7.13 |
| Interventions | Year-over-Year Change | Expenditures ($ 000s) | ||
|---|---|---|---|---|
| Employment Benefits | ||||
| SD-R | Training PEI—Individual | 2,123 | +98.4% | 12,501 |
| SD-A | Training PEI—Apprentice | 267 | -9.5% | |
| TWS | Employ PEI | 696 | -16.3% | 3,512 |
| SE | Self-Employ PEI | 146 | -14.1% | 2,061 |
| JCPs | Work Experience PEI | 60 | -11.8% | 692 |
| Support Measures | ||||
| EAS | Employment Assistance Services | 6,592 | +8.8% | 5,120 |
| LMPs | Labour Market Partnerships | N/A | N/A | 1,721 |
| R&I | Research & Innovation | N/A | N/A | 0 |
2.3.3 Employment benefits
In FY1718, for a third consecutive year, the number of Employment Benefits interventions grew, totaling 3,292 (+35.2%). With the exception of SD-R (+1,053; +98.4%), all other benefit-types dropped: TWS (-136; -16.3%), SE (-24; -14.1%), JCP (-8; -11.8%) and SD-A (-28; -9.5%). The significant increase in Skills Development – Regular interventions can be attributed to the implementation of the Career Connect program in FY1718. Career Connect provides unemployed workers, who qualify for Employment Insurance (EI) benefits, an opportunity to continue to receive those benefits while attending full-time, post-secondary training within Canada for the duration of their claim. Employment Benefits expenditures went down, from to $21.1 million to $18.8 million, representing a year-over-year decrease of 11.3%.
The province used its share of the additional LMDA funding announced in the Budget of 2017 to support various priorities, including employment services for unemployed individuals, address sectoral employment challenges through industry associations and sector councils, develop incentives to hire and train unemployed workers and recent graduates, as well as to support new business start-ups.
2.3.4 Support measures: EAS
In FY1718, EAS interventions in Prince Edward Island rose by 8.8% to 6,592. Employment Services (+623, +12.7%) advanced, while Individual Counselling (-90; -7.7%) dropped. EAS total expenditures reached $5.1 million (+47.9%).
2.3.5 Other support measures: LMPs and R&I
In FY1718, LMPs expenditures (+28.1%) grew from $1.3 million to $1.7 million. There were no reported expenditures under R&I for FY1718.
Jenna’s journey to sustainable employment
Jenna was interested in exploring new career options in trades and increasing her employability skills. She was able to find her dream job by progressing along a path to sustainable employment which included:
1) Career exploration via a program offered by the Women’s Network PEI;
2) Training to develop skills needed to succeed in the workforce by enrolling in and graduating from the Heritage Retrofit Carpentry program; and
3) An opportunity to bridge education with work experience through the Graduate Mentorship program.
With a lot of perseverance and support from the province, Jenna developed new skills and abilities that will contribute to the success of the renovations at the historic Province House in Charlottetown.
2.4 Nova Scotia
For the second year in a row, Nova Scotia’s real GDP growth in 2017 was 1.5%. It was the fourth consecutive year with economic growth. Real GDP growth is expected to have eased in 2018 to about 1%.
Nova Scotia: EBSM Key Facts
| EI Clients | Non-Insured Clients |
|---|---|
| 11,549 |
4,337 |
| Interventions Type | 2017/2018 | Year-over-Year Change |
|---|---|---|
| Employment Benefits | 4,138 | 7.0% |
| Support Measures: EAS | 26,653 | 6.9% |
| Interventions Type | 2017/2018 | Year-over-Year Change(pp) |
|---|---|---|
| Employment Benefits | 13.4% | 0.1 |
| Support Measures: EAS | 86.6% | 0.1 |
| Total Expenditures | 2017/2018 ($ million) | Year-over-Year Change |
|---|---|---|
| Employment Benefits | $51.3 | 6.1% |
| Support Measures: EAS | $29.0 | 9.7% |
| LMPs and R&I | $2.3 | 18.8% |
| Total Expenditures1 | $82.6 | 0.8% |
| 2016/2017 | 2017/2018 | Year-over-Year Change |
|---|---|---|
| $24.02 | $23.91 | 0.5% |
- 1 Totals may not add up due to rounding; does not include accounting adjustments.
After four consecutive years of decline, employment levels in Nova Scotia improved in FY1718, rising by 3,500 (+0.8%). During the same period, the unemployment rate rose from 8.1% to 8.3%, as more Nova Scotians joined the labour force.
Employment grew in the goods-producing sector (+1,300; 1.6%), particularly in utilities (+500; +14.4%) and manufacturing (+3,200; +11.4%). However, these gains were partially offset by employment losses in forestry, fishing, mining, oil and gas (-1,700; -15.1%). Employment in the services-producing sector (+2,100; +0.6%) also improved year-over-year, most notably in accommodation and foodservices (+1,800; +6.1%); public administration (+1,600; +5.6%); and information, culture and recreation (+700; +4.6%). This expansion was partially offset by losses in health care and social assistance (-4,700; -6.2%) and in other services (-800; -4.0%).
To address labour market challenges related to an aging population, shrinking workforce and shifting industrial composition, Nova Scotia engaged multiple stakeholders to develop program and service priorities. Accordingly, the province invested in high-skill training, with the goal to develop and maintain a competitive workforce. In addition, the province continued to support the integration of underrepresented groups, by reducing barriers to employment, with the view of stimulating economic growth and enhancing the labour market.
2.4.1 Managing for results
Nova Scotia is in its second year of implementation of a transformed employment services system, which includes a common branding of all employment service centres as Nova Scotia Works. Eighteen third-party, community-based organizations have agreements with the province to deliver a common and consistent suite of services to all Nova Scotians. The transformation of the employment services system in Nova Scotia has resulted in the implementation of a performance management approach that focuses on outcome measures, monitoring through regular collection and reporting to track progress, evaluation of achieving desired outcomes and incorporating learnings gleaned through monitoring and evaluation into program design decisions.
Innovation and evidence-based approaches to client service delivery and programming are beginning to be fostered through a newly created Centre for Employment Innovation. Diversity and inclusion - meeting the needs of all Nova Scotians – is a focus of the transformed system which now provides specialized services behind ‘one door’ versus multiple employment services doors providing certain specialized services. Nova Scotians and service providers have responded well to the new structures and focus on client outcomes is increasing over time.
2.4.2 Clients, interventions and expenditures
Nova Scotia served fewer clients in FY1718 compared to FY1617, for a total of 15,886 clients (-3.8%). Both active claimants (9,152) and non-insured clients (4,337) fell by 5.2% and 8.1%, respectively, while former claimants (2,397) rose by 12.0%. Following the same trends, all client-types’ shares of the total number of clients served moved in the same direction, with active claimants (57.6%) and non-insured clients (27.3%) decreasing by 0.8 and 1.3 percentage points, respectively; while former claimants (15.1%) advanced by 2.1 percentage points.
In FY1718, the province delivered 30,791 (-6.9%) interventions. At 86.6%, the share of EAS continued to remain the largest of all EBSM-similar interventions. A total of 5,624 (+9.1%) individuals returned to employment following participation in the programs. Unpaid benefits decreased from $24.02 million to $23.91 million (-0.5%). EBSM total expenditures declined, reaching $82.6 million (-0.8% year-over-year). This amount includes Nova Scotia’s portion of the additional $125 million in LMDA investments announced in Budget 2017. This represents $4.6 million for FY1718. About $2.3 million of this funding has been directed to the delivery of employment services to individuals who are job-ready but face significant employment barriers in order to integrate them into employment through pre-employment and employment services focused on personal, academic and work skill development. This program is delivered in partnership with the Department of Community Services and provincial funding support.
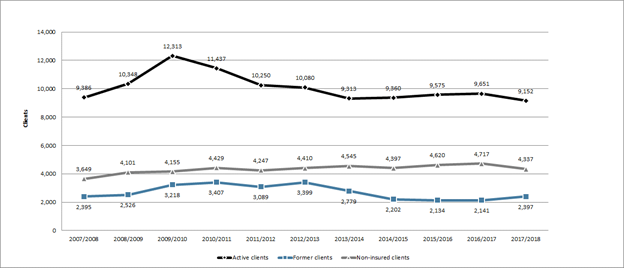
Chart 9 - Text version
| Active clients | Former clients | Non-insured clients | |
|---|---|---|---|
| 2007/2008 | 9,386 | 2,395 | 3,649 |
| 2008/2009 | 10,348 | 2,526 | 4,101 |
| 2009/2010 | 12,313 | 3,218 | 4,155 |
| 2010/2011 | 11,437 | 3,407 | 4,429 |
| 2011/2012 | 10,250 | 3,089 | 4,247 |
| 2012/2013 | 10,080 | 3,399 | 4,410 |
| 2013/2014 | 9,313 | 2,779 | 4,545 |
| 2014/2015 | 9,360 | 2,202 | 4,397 |
| 2015/2016 | 9,575 | 2,134 | 4,620 |
| 2016/2017 | 9,651 | 2,141 | 4,717 |
| 2017/2018 | 9,152 | 2,397 | 4,337 |
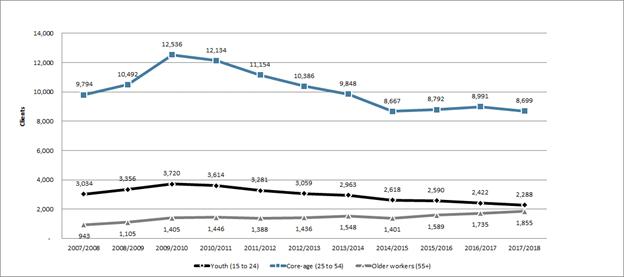
Chart 10 - Text version
| Youth (15 to 24) | Core-age (25 to 54) | Older workers (55+) | |
|---|---|---|---|
| 2007/2008 | 3,034 | 9,794 | 943 |
| 2008/2009 | 3,356 | 10,492 | 1,105 |
| 2009/2010 | 3,720 | 12,536 | 1,405 |
| 2010/2011 | 3,614 | 12,134 | 1,446 |
| 2011/2012 | 3,281 | 11,154 | 1,388 |
| 2012/2013 | 3,059 | 10,386 | 1,436 |
| 2013/2014 | 2,963 | 9,848 | 1,548 |
| 2014/2015 | 2,618 | 8,667 | 1,401 |
| 2015/2016 | 2,590 | 8,792 | 1,589 |
| 2016/2017 | 2,422 | 8,991 | 1,735 |
| 2017/2018 | 2,288 | 8,699 | 1,855 |
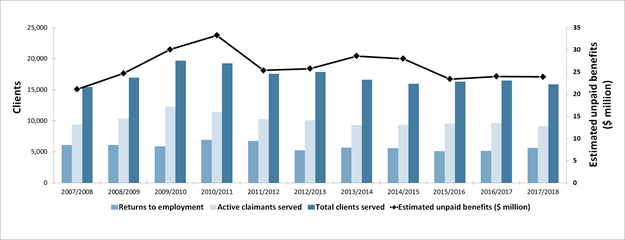
Chart 11 - Text version
| Returns to employment | Active claimants served | Total clients served | Estimated unpaid benefits ($ million) | |
|---|---|---|---|---|
| 2007/2008 | 6,105 | 9,386 | 15,430 | $21.10 |
| 2008/2009 | 6,100 | 10,348 | 16,975 | $24.71 |
| 2009/2010 | 5,908 | 12,313 | 19,686 | $30.09 |
| 2010/2011 | 6,942 | 11,437 | 19,273 | $33.28 |
| 2011/2012 | 6,734 | 10,250 | 17,586 | $25.38 |
| 2012/2013 | 5,259 | 10,080 | 17,889 | $25.75 |
| 2013/2014 | 5,680 | 9,313 | 16,637 | $28.60 |
| 2014/2015 | 5,608 | 9,360 | 15,959 | $28.00 |
| 2015/2016 | 5,100 | 9,575 | 16,329 | $23.39 |
| 2016/2017 | 5,153 | 9,651 | 16,509 | $24.02 |
| 2017/2018 | 5,624 | 9,152 | 15,886 | $23.91 |
| Interventions | Year-over-Year Change | Expenditures ($ 000s) | ||
|---|---|---|---|---|
| Employment Benefits | ||||
| SD-R | Nova Scotia Skills Development | 1,140 | -20.4% | 39,565 |
| SD-A | Nova Scotia Skills Development | 1,527 | +3.4% | |
| TWS | START | 809 | -2.2% | 3,974 |
| SE | Nova Scotia Self-Employment Benefit | 555 | -2.3% | 6,477 |
| JCPs | Nova Scotia Job Creation Partnerships | 107 | -26.7% | 1,271 |
| Support Measures | ||||
| EAS | Nova Scotia Employment Assistance Services | 26,653 | -6.9% | 28,972 |
| LMPs | Nova Scotia Labour Market Partnerships | n/a | n/a | 1,991 |
| R and I | Research and Innovation | n/a | n/a | 348 |
2.4.3 Employment benefits
In Nova Scotia, Employment Benefits interventions declined by 7.0% to 4,138 in FY1718. With the exception of SD-A (+50; +3.4%), all other benefit-types dropped: TWS (-18; -2.2%), SE (-13; -2.3%), JCP (-39; -26.7%) and SD-R (-292; -20.4%). Employment Benefits expenditures totalled $51.3 million (+6.1%).
From the Budget 2017 LMDA additional funding, $1.5 million was directed to the NS Apprenticeship Agency to help meet the rising demand for technical training programs in the province. The number of participants in apprenticeship programs has doubled over the past ten years. Over 2,600 apprentices were trained in skilled trades in FY1718.
2.4.4 Support measures: EAS
After two consecutive years of growth, EAS interventions (26,653) in Nova Scotia decreased by 6.9% in FY1718. Both Group Services (1,682) and Individual Counselling (2,260) contracted by 19.0% and 43.6%, respectively, whereas Employment Service (22,711) rose somewhat, by 0.8%. Total EAS expenditures reached $29.0 million (-9.7%) in FY1718.
2.4.5 Other support measures: LMPs and R&I
Compared to FY1617, Nova Scotia’s total funding for LMPs and R&I decreased significantly in FY1718, by 18.8% to $2.3 million. The province spent $2.0 million (+0.2%) for LMPs and $348,365 (-61.0%) for R&I. It should be noted that R&I was delivered for the first time in FY1617.
Under LMPs, Nova Scotia continues to support various industrial sector councils that represent small and medium sized businesses to develop and enrich human resource development, workforce development planning (attract, retain, train), help address skills shortages, and increase competitiveness. The outcomes also help inform training curriculum development and increase opportunities for under represented groups.
In FY1718, $600,000 of Nova Scotia’s Budget 2017 additional LMDA funding was directed to the Nova Scotia School for Adult Learning (NSSAL) review, involving extensive consultation and engagement with the NSSAL Advisory Committee, learning partners and government colleagues. The multi-phased review was designed to identify gaps in the current learning system, better understand challenges and opportunities and develop a strategic plan. Some of the issues identified include programming consistency across the province, coordinating planning and delivery with community partners to better leverage limited resources, need for improved data collection and reporting to better assess learner progress, performance measurement and best use of resources.
EAS Case Management and Skills Development
Melanie, who is hard of hearing, began her re-employment journey with our TEAM Work Nova Scotia Works office in June 2015. She was on long-term disability (LTD) due to her physical issues after working eight years at a post-secondary institution as a custodian. Following her doctor and occupational therapist’s recommendation to change careers, Melanie began taking workshops with the TEAM Work along with Career Cruising where we came up with a couple of positions that interested her: Business Accounting and Business Administration. We reviewed them, researched Labour Market Information to confirm that employment prospects were good, and whether duties might include the requirement for phone interaction due to her hearing loss. There were a few interesting possibilities that required some skills training. Melanie had a meeting with Academy of Learning (AOL) and felt the program suited her needs because she can communicate verbally well one on one and does not use American Sign Language (ASL) interpreters. AOL provides support one on one as opposed to a classroom like other educational institutions. We applied to Employment Nova Scotia for Skills Development (SD) funding, which Melanie was approved for.
Melanie began her SD in late October 2016 until September 2017 and then had an extension for three months due to challenges with her studies. We also supported Melanie for an assistive device for her hearing to help with her studies. In November 2017, there was an opening for a Deposit Monitor Officer position with a Canadian financial institution. With the assistance of our information resource specialist to update her resume and cover letter, learn interview skills, and practice mock interviews, Melanie applied to the opening and was successful at the interview. A few weeks later, she completed her SD in December 2017. On her last day of class, Melanie was offered a part-time position with the financial institution starting in January 2018. After about three months, she received an offer for a full-time permanent position. Melanie appreciated all the hard work TEAM Work has done for her.
2.5 New Brunswick
Following a 1.4% increase in 2016, New Brunswick’s real GDP rose by 1.8% in 2017. The economic growth is likely to have expanded by approximately 1% in 2018.
New Brunswick : EBSM Key Facts
| EI Clients | Non-Insured Clients |
|---|---|
| 14,418 |
8,410 |
| Interventions Type | 2017/2018 | Year-over-Year Change |
|---|---|---|
| Employment Benefits | 11,692 | 5.2% |
| Support Measures: EAS | 32,615 | 3.2% |
| Interventions Type | 2017/2018 | Year-over-Year Change(pp) |
|---|---|---|
| Employment Benefits | 26.4% | 1.6 |
| Support Measures: EAS | 73.6% | 1.6 |
| Total Expenditures | 2017/2018 ($ million) | Year-over-Year Change |
|---|---|---|
| Employment Benefits | $74.4 | 1.2% |
| Support Measures: EAS | $10.5 | 4.1% |
| LMPs and R&I | $9.6 | 0.6% |
| Total Expenditures1 | $94.5 | 0.5% |
| 2016/2017 | 2017/2018 | Year-over-Year Change |
|---|---|---|
| $30.01 | $29.14 | 2.9% |
- 1 Totals may not add up due to rounding; does not include accounting adjustments.
For a third consecutive year, the unemployment rate in New Brunswick declined, reaching 8.0% (-1.2 percentage points) in FY1718. Employment remained stable (+200; +0.1%). In the goods-producing sector (+400; +0.5%), employment declines in agriculture (-500; -9.5%); forestry, fishing, mining, oil and gas (-1,200; -13.0%) and utilities (-600; -16.0%) were more than offset by gains in manufacturing (+1,900; +6.2%) and construction (+800; +3.5%). Employment in the services-producing sector (-200; -0.1%) remained relative stable, despite declines in information, culture and recreation (-2,000; -15.9%); other services (-1,400; -8.6%); transportation and warehousing (-900; -4.7%); as well as finance, insurance, real estate, rental and leasing (-800; -4.6%). These losses were offset by gains in health care and social assistance (+4,800; +8.8%); as well as in accommodation and food services (+1,500; +6.7%).
In FY1718, New Brunswick’s economy and labour market continued to face multiple challenges such as the aging of its workforce as well as the out-migration of youth and skilled workers. Therefore, to continue to attract, retain and educate a highly skilled workforce, New Brunswick is focusing on the following priorities:
- collaborating with employers and workers to address their workforce and training needs;
- promoting and increasing adult literacy, essential skills and continuous learning;
- increasing participation in post-secondary education;
- increasing the size, skill level and productivity of New Brunswick’s work force;
- improving access to and dissemination of relevant labour market information; and,
- investing in innovative programs and services.
2.5.1 Managing for results
The Government of New Brunswick is working on an internal redesign to enhance program and service delivery to clients and employers. Several themes brought forward during numerous stakeholder consultations, which have informed this redesign, include:
- flexibility to serve a broader range of clients including international students;
- collaboration between government and training institutions;
- need for government to be able to quickly respond to labour market needs;
- increasing the continuum of support to include pre-employment training and on-the-job mentorship;
- need for employers to be able to access programming to upskill existing employees’ technical and soft skills; and
- support and mentorship for youth.
In addition to New Brunswick’s ongoing regular program evaluations, the province has been reviewing the effectiveness of its third-party service delivery providers. Implementation is underway on both the new Performance Measurement Strategy for tracking the progress of LMDA clients and for reporting on results achieved, as well as the targeting, referral and feedback system to target EI applicants in order to direct them to relevant job opportunities or programs and services.
2.5.2 Clients, interventions and expenditures
For a third consecutive year, New Brunswick served a growing number of clients, reaching 22,828 (+1.0%) in FY1718. While active claimants (11,302) declined slightly by 0.7%, former claimants (3,116) increased significantly by 9.0%, and non-insured clients (8,410) edged up by 0.8%.
As for their share of total clients served, former claimants (13.6%) advanced by 1.0 percentage point, whereas both active claimants (49.5%) and non-insured clients (36.8%) dropped, by 0.9 and 0.1 percentage point respectively.
The province delivered a total number of 44,307 interventions, a decline of 1.1% compared to FY1617. The proportions of both Employment Benefits and EAS interventions of the total number of interventions remained stable at 26.4% and 73.6%, respectively. The number of EI clients returning to employment reached 8,800 in FY1718, representing an increase of 6.0% year-over-year. Unpaid benefits dropped by 2.9%, from $30.01 million to $29.14 million. Total expenditures for the EBSMs totalled $94.5 million (-0.5%).
The additional LMDA funding ($4.9 million), announced in Budget 2017, was invested in Employment Assistance Services, Training and Skills Development programs, as well as Labour Market Research and Analysis (LMRA). LMRA is used to improve the capacity to deal with human resources requirements (i.e. labour force imbalances) through means such as human resource planning and research. LMRA typically provides assistance to associations representing sectors or a group of companies that are involved in the analysis of human resource supply and demand, the identification of trends and emerging issues, and the identification of skills gaps and barriers to hiring and retaining appropriate human resources within a given sector or group of companies. The program objective is to identify new and better tools and approaches that are designed to help persons prepare for, return to, or keep employment and become productive participants in the labour force.
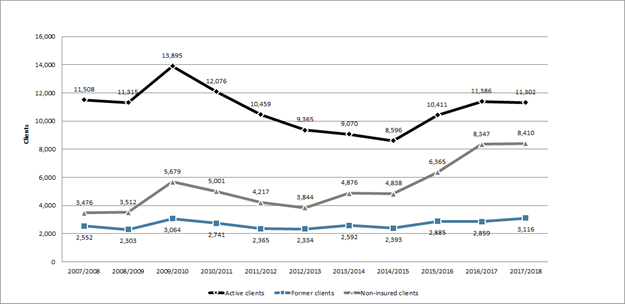
Chart 12 - Text version
| Active clients | Former clients | Non-insured clients | |
|---|---|---|---|
| 2007/2008 | 11,508 | 2,552 | 3,476 |
| 2008/2009 | 11,315 | 2,303 | 3,512 |
| 2009/2010 | 13,895 | 3,064 | 5,679 |
| 2010/2011 | 12,076 | 2,741 | 5,001 |
| 2011/2012 | 10,459 | 2,365 | 4,217 |
| 2012/2013 | 9,365 | 2,334 | 3,844 |
| 2013/2014 | 9,070 | 2,592 | 4,876 |
| 2014/2015 | 8,596 | 2,393 | 4,838 |
| 2015/2016 | 10,411 | 2,885 | 6,365 |
| 2016/2017 | 11,386 | 2,859 | 8,347 |
| 2017/2018 | 11,302 | 3,116 | 8,410 |
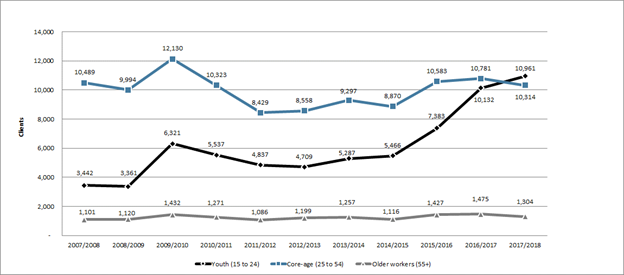
Chart 13 - Text version
| Youth (15 to 24) | Core-age (25 to 54) | Older workers (55+) | |
|---|---|---|---|
| 2007/2008 | 3,442 | 10,489 | 1,101 |
| 2008/2009 | 3,361 | 9,994 | 1,120 |
| 2009/2010 | 6,321 | 12,130 | 1,432 |
| 2010/2011 | 5,537 | 10,323 | 1,271 |
| 2011/2012 | 4,837 | 8,429 | 1,086 |
| 2012/2013 | 4,709 | 8,558 | 1,199 |
| 2013/2014 | 5,287 | 9,297 | 1,257 |
| 2014/2015 | 5,466 | 8,870 | 1,116 |
| 2015/2016 | 7,383 | 10,583 | 1,427 |
| 2016/2017 | 10,132 | 10,781 | 1,475 |
| 2017/2018 | 10,961 | 10,314 | 1,304 |
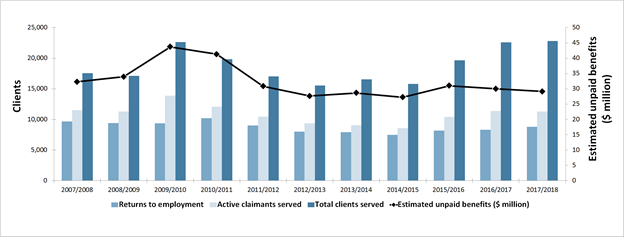
Chart 14 - Text version
| Returns to employment | Active claimants served | Total clients served | Estimated unpaid benefits ($ million) | |
|---|---|---|---|---|
| 2007/2008 | 9,680 | 11,508 | 17,536 | $32.30 |
| 2008/2009 | 9,422 | 11,315 | 17,130 | $33.95 |
| 2009/2010 | 9,367 | 13,895 | 22,638 | $43.73 |
| 2010/2011 | 10,193 | 12,076 | 19,818 | $41.33 |
| 2011/2012 | 9,017 | 10,459 | 17,041 | $30.85 |
| 2012/2013 | 8,015 | 9,365 | 15,543 | $27.65 |
| 2013/2014 | 7,927 | 9,070 | 16,538 | $28.67 |
| 2014/2015 | 7,471 | 8,596 | 15,827 | $27.25 |
| 2015/2016 | 8,179 | 10,411 | 19,661 | $31.02 |
| 2016/2017 | 8,300 | 11,386 | 22,592 | $30.01 |
| 2017/2018 | 8,800 | 11,302 | 22,828 | $29.14 |
| Interventions | Year-over-Year Change | Expenditures ($ 000s) | ||
|---|---|---|---|---|
| Employment Benefits | ||||
| SD-R | Training and Skills Development Program | 6,877 | +9.2% | 57,232 |
| SD-A | Training and Skills Development Program | 2,207 | +10.7% | |
| TWS | Workforce Expansion—Employer Wage Subsidy | 2,293 | -6.8% | 12,395 |
| SE | Workforce Expansion—Self-Employment Benefit | 315 | -13.0% | 4,741 |
| Support Measures | ||||
| EAS | Employment Assistance Services | 32,615 | -3.2% | 10,543 |
| LMPs | Adjustment Services | n/a | n/a | 8,944 |
| R&I | Research and Innovation | n/a | n/a | 628 |
2.5.3 Employment benefits
In New Brunswick, Employment Benefits interventions grew for a fourth consecutive year, totalling 11,692 (+5.2%) in FY1718. Both SD-R (6,877) and SD-A (2,207) rose by 9.2% and 10.7%, respectively. On the other hand, TWS (-6.8%) and SE (-13.0%) both declined by 168 and 47 interventions, respectively.
The province spent $74.4 million (-1.2%) for Employment Benefits.
2.5.4 Support measures: EAS
Compared to the previous fiscal year, EAS interventions declined from 33,684 to 32,615, representing a year-over-year decrease of 3.2%. Both EAS-types Employment Services (9,819) and Individual Counselling (22,796) contracted, by 5.8% and 2.0% respectively.
Total EAS expenditures advanced from $10.1 million to $10.5 million, a year-over-year increase of 4.1%.
2.5.5 Other support measures: LMPs and R&I
In FY1718, New Brunswick’s total funding for LMPs and R&I increased, reaching $9.6 million (+0.6%). The province’s expenditures for LMPs rose by 3.0% to $8.9 million. For a second consecutive year, R&I’s expenditures dropped, amounting to $628,000 (-24.5%) in FY1718. Examples of two R&I projects completed in FY1718 include:
- Research and development of a new online approach to the training and professional development of career and employment service providers across the Province and of new courses (in English and French) that can be delivered multiple times and/or adapted to support a longer-term provincial delivery strategy. The goals were to extend accessibility to quality career development training, promote professionalization and certification and reduce longer-term costs associated with training delivery across New Brunswick. Moving to online delivery widens access and meets an immediate need.
- A project to research micro-entrepreneurism as a viable option for self-employment for persons with a disability. The project explored the different information available in regards to the micro-entrepreneurism and documented the prevalence of this trend throughout Canada. The goal was to combine all pertinent information on this designated topic to provide Employment Assistance Services providers the necessary training to become educated on the subject matter. The development of a step-by-step guide was completed, and a half-day workshop was provided at the annual Employment Assistance Network conference.
Success Story – Myriam
Myriam obtained a diploma in public school special education and faced many challenges. In addition to receiving employment counselling services, this client used many of our programs and services throughout her action plan, including Career counseling, job search services, employment supports and training services for people with disabilities, etc. Through our programs, she also participated in an initiative that allowed her to gain work experience, where she discovered her interest in beauty care and massage therapy.
Today, Myriam is autonomous, trained in massage therapy, and works full time. She received financial aid from the Training and Skills Development Program (TSDP) to undergo academic upgrading, obtain her adult secondary school diploma (DESPA), and complete a two-year post-secondary program at the Atlantic College of Therapeutic Massage.
2.6 Quebec
In 2017, Quebec’s real GDP rose by 2.8% (+1.4 percentage points compared to 2016), its strongest growth since 2002. For 2018, the economic forecast is a growth of about 2.4%. This economic growth is due notably to a 3.2% increase in household spending, as well as a 5.1% increase in gross physical capital formation. Furthermore, investments in residential buildings recorded an increase of 7.3% from 2016. All in all, Quebec’s exports and imports increased by 1.2% and 3.9%, respectively.
Quebec: EBSM Key Facts
| EI clients | Non-insured clients |
|---|---|
| 160,579 |
79,764 |
| Interventions type | 2017/2018 | Year-over-Year Change |
|---|---|---|
| Employment Benefits | 30,939 | 10.2% |
| Support Measures: EAS | 274,754 | 3.0% |
| Interventions type | 2017/2018 | Year-over-Year Change (pp) |
|---|---|---|
| Employment Benefits | 10.1% | 0.7 |
| Support Measures: EAS | 89.9% | 0.7 |
| Total Expenditures | 2017/2018 ($ million) | Year-over-Year Change |
|---|---|---|
| Employment Benefits | $323.8 | 5.7% |
| Support Measures: EAS | $148.8 | 4.9% |
| LMPs and R&I | $110.4 | 1.9% |
| Total Expenditures1 | $583.0 | 4.8% |
| 2016/2017 | 2017/2018 | Year-over-Year Change |
|---|---|---|
| $334.28 | $327.62 | 2.0% |
- 1 Totals may not add up due to rounding; does not include accounting adjustments.
During FY1718, the main economic indicators all followed a positive trend. Employment (+85,700 or +2.1%) sharply increased, with significant growth in full-time employment (+84,500 or +2.5%) and some stability in part-time employment (+1,200 or +0.2%). In total, the number of unemployed declined by 39,600 people, bringing the unemployment rate to 5.9%, a decrease of 0.9 percentage points.
The improvement in employment over FY1718 was driven by gains in the goods sector (+16,200 or +1.9%) and the services sector (+69,600 or +2.1%). For the goods sector, the increase in jobs was mostly generated by the forestry, fishing, and mining, oil, and gas extraction industries (+4,100 or +12.6%). However, significant losses were recorded in public services (-2,300 or -8.6%). The growth of employment in the services sector was supported primarily by three industries, namely transport and storage services (+15,500 or +7.9%); financial, insurance, real estate, and rental services (+14,800 or +6.7%); and professional, scientific, and technical services (+19,100 or +6.1%). Conversely, significant decreases were noted in accommodation and food services (-11,900 or -4.2%).
Like the previous fiscal year, the labour market’s good performance reduced the number of people available to enter into the labour market. Thus, companies in Quebec faced a labour shortage in FY1718, which exacerbated the challenge of matching training, competencies, and jobs. Consequently, companies have had difficulty recruiting qualified workers for available jobs. Furthermore, improving the skills of the workforce is becoming a necessity, in that many workers still do not have specialized or basic skills needed for a sustainable integration into employment. The other major issue remains the continuous improvement of public employment services, based on client needs, in collaboration with labour market partners, which include representatives of employers, unions, academia, and community organizations.
To resolve these challenges, the Ministère du Travail, de l’Emploi et de la Solidarité sociale (MTESS) developed a policy to intervene in workforce and employment matters focused on six strategic orientations:
- Expand knowledge of qualitative and quantitative labour market imbalances;
- Contribute to improving workforce skills;
- Accelerate employment integration for people ready to enter the labour market;
- Work with clients of social assistance programs, including those benefiting from the “Objectif Emploi” program to support them towards gaining employment;
- Encourage the hiring of people who are part of groups underrepresented in the labour market;
- Contribute to structuring and adapting human resources management in companies, encouraging them to improve productivity;
Through these orientations, the MTESS seeks to contribute to improving the employment rate by hiring people who are unemployed as well as by improving companies’ productivity and ability to adapt.
2.6.1 Managing for results
Through the MTESS, Quebec continues to rely on its targeting, referral, and feedback (TRF) system, which enables it to undertake early and proactive intervention with Employment Insurance applicants. Set up jointly with the federal government and used since 1999, the TRF system has proven its effectiveness, and is currently being implemented in other provinces and territories. Under the new LMDAs, these provinces and territories are committed to implementing the TRF system before April 1, 2020.
Quebec also works closely with labour market partners to optimize services and appropriately and quickly respond to the labour market’s needs. As an example, in the matter of planning, the Commission des partenaires du marché du travail, which includes representatives of employers, unions, academia, and community organizations, works with the Ministère du Travail, de l’Emploi et de la Solidarité sociale to orient public job services to meet the needs expressed by the partners. This collaboration results in the development of an annual plan of action relating to public job services.
2.6.2 Clients, interventions and expenditures
Quebec served a total of 240,343 clients (-4.0%) during FY1718. The number of active claimants (127,614) and non-insured clients (79,764) decreased by 8.0% and 5.8%, respectively. The number of former claimants (32,965) rose by 22.3%. Although declining compared to the previous fiscal year (-2.3 percentage points), the proportion of active clients (53.1%) compared to the total number of clients served remained the highest of all the EBSM. This was followed by non-insured clients (33.2%), which remained more or less stable (-0.7 percentage points). The share of former claimants (13.7%) rose sharply, up by 3.0 percentage points.
During FY1718, a total number of 305,693 interventions (-3.8%) were delivered in Quebec. At 89.9%, the proportion of EAS compared to the total number of interventions remained stable from one year to the next, while that of Employment Benefits decreased slightly to 10.1%.
In total, 68,794 employment insurance clients found work after participating in a program similar to EBSM. This number is an increase of 3.4% compared to the previous fiscal year. Unpaid EI benefits decreased by 2.0% to $327.62 million. The total EBSM expenditures dropped by 4.8% to $583.0 million in FY1718.Footnote 16
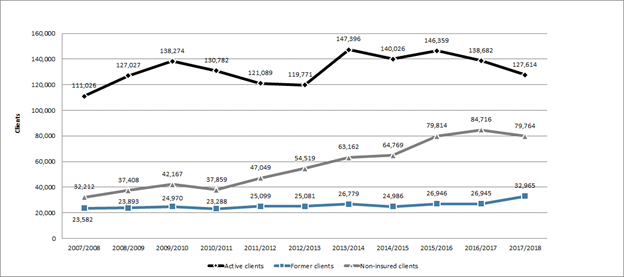
Chart 15 - Text version
| Active clients | Former clients | Non-insured clients | |
|---|---|---|---|
| 2007/2008 | 111,026 | 23,582 | 32,212 |
| 2008/2009 | 127,027 | 23,893 | 37,408 |
| 2009/2010 | 138,274 | 24,970 | 42,167 |
| 2010/2011 | 130,782 | 23,288 | 37,859 |
| 2011/2012 | 121,089 | 25,099 | 47,049 |
| 2012/2013 | 119,771 | 25,081 | 54,519 |
| 2013/2014 | 147,396 | 26,779 | 63,162 |
| 2014/2015 | 140,026 | 24,986 | 64,769 |
| 2015/2016 | 146,359 | 26,946 | 79,814 |
| 2016/2017 | 138,682 | 26,945 | 84,716 |
| 2017/2018 | 127,614 | 32,965 | 79,764 |
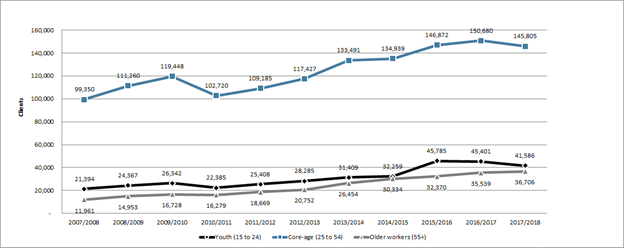
Chart 16 - Text version
| Youth (15 to 24) | Core-age (25 to 54) | Older workers (55+) | |
|---|---|---|---|
| 2007/2008 | 21,394 | 99,350 | 11,961 |
| 2008/2009 | 24,367 | 111,260 | 14,953 |
| 2009/2010 | 26,342 | 119,448 | 16,728 |
| 2010/2011 | 22,385 | 102,720 | 16,279 |
| 2011/2012 | 25,408 | 109,185 | 18,669 |
| 2012/2013 | 28,285 | 117,427 | 20,752 |
| 2013/2014 | 31,409 | 133,491 | 26,454 |
| 2014/2015 | 32,259 | 134,939 | 30,334 |
| 2015/2016 | 45,785 | 146,872 | 32,370 |
| 2016/2017 | 45,401 | 150,680 | 35,539 |
| 2017/2018 | 41,586 | 145,805 | 36,706 |
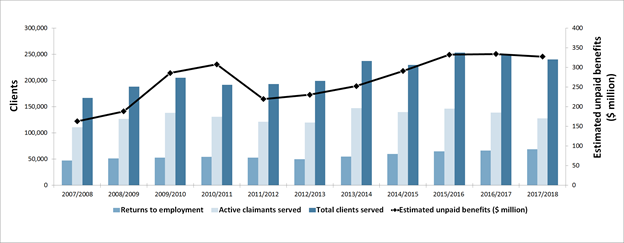
Chart 17 - Text version
| Returns to employment | Active claimants served | Total clients served | Estimated unpaid benefits ($ million) | |
|---|---|---|---|---|
| 2007/2008 | 47,313 | 111,026 | 166,820 | $162.80 |
| 2008/2009 | 51,383 | 127,027 | 188,328 | $188.26 |
| 2009/2010 | 53,081 | 138,274 | 205,411 | $285.80 |
| 2010/2011 | 54,239 | 130,782 | 191,929 | $307.80 |
| 2011/2012 | 52,872 | 121,089 | 193,237 | $219.42 |
| 2012/2013 | 49,757 | 119,771 | 199,371 | $230.49 |
| 2013/2014 | 55,043 | 147,396 | 237,337 | $252.38 |
| 2014/2015 | 59,949 | 140,026 | 229,781 | $290.84 |
| 2015/2016 | 64,697 | 146,359 | 253,119 | $332.31 |
| 2016/2017 | 66,502 | 138,682 | 250,343 | $334.28 |
| 2017/2018 | 68,794 | 127,614 | 240,343 | $327.62 |
| Interventions | Year-over-Year Change | Expenditures ($ 000s) | ||
|---|---|---|---|---|
| Employment Benefits | ||||
| SD | Manpower Training Measure Job Readiness | 22,894 | -12.1% | 231,736 |
| TWS | Wage Subsidies | 6,452 | -3.1% | 69,231 |
| SE | Support for Self-Employment Measure | 1,593 | -10.2% | 22,850 |
| TES | Return to Work Supplement | 0 | 0 | 0 |
| Support Measures | ||||
| EAS | Labour Market Information Job Placement Job Research and Assistance Services | 274,754 | -3.0% | 148,782 |
| LMPs | Job Cooperation Services Manpower Training Measure for Enterprises | N/A | N/A | 102,854 |
| R&I | Research and Innovation Strategy | N/A | N/A | 7,556 |
2.6.3 Employment benefits
Quebec delivered a total of 30,939 interventions in terms of Employment Benefits, a decrease of 10.2% from one year to the next. This decrease is attributable to the drops recorded in all types of employment benefits. Skills Development-Regular (SD-R) (22,894), Self-Employment (SE) (1,593), as well as Targeted Wage Subsidies (TWS) (6,452) decreased by 12.1%, 10.2%, and 3.1%, respectively. In total, the province spent $323.8 million (-5.7%) on employment benefits.
For FY1718, an LMDA additional funding of $8.2 million was granted to the lumber industry. Quebec invested almost $11 million into this sector in FY1718 as a proactive step against the challenges created by the countervailing duties imposed by the US. The expenditures are split into $3.5 million for specific funding (Economic Projects and Major Projects, Targeted Initiative for Older Workers, Silviculture, and Self-Employment Support) and $7.3 million for ongoing measures, particularly to fund workplace workforce training initiatives. This workplace training helps workers to continue being part of the labour force, acquire relevant skills, and meet the needs of the community and their employer.
2.6.4 Support measures: employment assistance services (EAS)
During FY1718, the number of EAS interventions decreased by 3.0% to 274,754. While interventions relating to employment services (186,529) and group services (15,985) decreased by 5.2% and 13.0% respectively, interventions relating to one-on-one counselling (72,240) increased by 5.9%. Quebec spent a total of $148.8 million (-4.9%) on EAS.
2.6.5 Other support measures: LMPs and R&I
Over the course of FY1718, Quebec spent a total of $110.4 million on LMPs and R&I, a 1.9% decrease compared to the previous fiscal year. While the sum accorded to LMPs ($102.9 million) decreased by 7.9%, the sum given to R&I, a total of $7.6 dollars, experienced an exponential increase of 848.0%, which reflects the public job service’s need to adapt its services to the needs of people and companies.
Patricia can work thanks to specialized and adapted support for her disability.
Because of her disability, Patricia needs support to start her path to employment. After talking with an officer from the Services Québec office, she made the decision to meet with a member from an organization specializing in employing people with disabilities in her region. Together, they agreed on an action plan adapted to her needs and realities to give her the tools she needed to obtain and retain employment in a field in which she wants to work. After participating in various activities to improve her skills—enabling her to find and obtain a job—Patricia obtained an interview with a local employer. After hiring her, the employer received financial support from the Ministère du Travail, de l’Emploi et de la Solidarité sociale to compensate the effect Patricia’s disability had on her performance and to make changes needed for her position at work. This support, combined with the necessary support from her worker, helped her acquire and retain her job.
2.7 Ontario
In 2017, Ontario’s real GDP grew by 2.8% after rising by 2.3% in 2016. The province’s economic growth is projected to have moderated to about 2.1% in 2018, according to the average of private-sector forecasts.
Ontario: EBSM Key Facts
| EI Clients | Non-Insured Clients |
|---|---|
| 86,186 |
106,483 |
| Interventions Type | 2017/2018 | Year-over-Year Change |
|---|---|---|
| Employment Benefits | 22,254 | 13.1% |
| Support Measures: EAS | 192,092 | 2.1% |
| Interventions Type | 2017/2018 | Year-over-Year Change(pp) |
|---|---|---|
| Employment Benefits | 10.4% | 1.6 |
| Support Measures: EAS | 89.6% | 1.6 |
| Total Expenditures | 2017/2018 ($ million) | Year-over-Year Change |
|---|---|---|
| Employment Benefits | $146.7 | 14.1% |
| Support Measures: EAS | $324.5 | 3.4% |
| LMPs and R&I | $143.8 | 26.4% |
| Total Expenditures1 | $615.1 | 0.9% |
| 2016/2017 | 2017/2018 | Year-over-Year Change |
|---|---|---|
| $262.66 | $233.15 | 11.2% |
- 1 Totals may not add up due to rounding; does not include accounting adjustments.
Ontario experienced favourable labour market conditions in FY1718, with employment growing by 131,100 (+1.9%) and the unemployment rate dropping from 6.4% to 5.8%, representing a year-over-year decrease of 0.6 percentage points. Employment growth in the goods-producing sector (+26,100; +1.8%) was led by gains in manufacturing (+25,000; +3.3%) and construction (+10,100; +2.0%), while employment contracted in the following industries: utilities (-2,100; -4.1%) and agriculture (-7,500; -10.0%). Employment gains in the services-producing sector (+105,000; +1.9%), employment gains were concentrated in transportation and warehousing (+22,900; +7.0%); professional, scientific and technical services (+36,700; +6.2%); and trade (+46,900; +4.5%); while in business, building and other support services (-11,800; -3.6%) and Information, culture and recreation (-5,000; -1.6%) recorded notable employment losses.
In FY1718, the Ontario labour market faced growing demand in high-skilled occupations at the apprenticeship, college and university levels. This was reflected in higher job vacancy rates in finance and insurance; professional, scientific and technical services; and health care and social assistance, and job growth in the manufacturing and construction sectors.
The changing labour market landscape caused by the growing automation of routine tasks, other technical advancements and jobs that are in demand present opportunities to ensure that the right supports are available to maintain a strong and highly skilled workforce and improve programs.
To support an innovative, skilled and inclusive economy, the province has worked collaboratively with public sector partners to create a more seamless, cohesive client-focused employment and training system to improve the experience for workers and job seekers, and to help Ontarians prepare for the jobs of the future. Initiatives included a focus on youth employment, an employment strategy for people with disabilities, and addressing local workforce challenges to help employers find the workers with the skills they need. The province has also focused on building system-wide capacity and enhancing the existing suite of employment and training programs and services to support further modernization of Ontario’s employment and skills training system.
2.7.1 Managing for results
In FY1718, Ontario met with groups supporting or prioritizing workforce development that represent employer communities. These engagements included the provincial Planning and Partnership Table, a forum of employers, post-secondary education, education, labour, government and others to discuss specific approaches to common issues on skills and talent development.
Ontario also met with employer-specific groups like the Ontario Chamber of Commerce and local chambers, such as the Toronto Region Board of Trade, to discuss their priorities around talent, workforce development and new approaches to sharing perspectives. Input from these engagements help inform policy and program development in the province.
To inform the design and development of Ontario’s labour market website, the Ontario government held focus groups and usability testing sessions with high school and postsecondary education students. These in-person engagements provided valuable insights on the type of information students need when preparing for work.
The redesigned labour market information website hosts an online survey that solicits feedback directly from real users of the website. This survey has enabled the Ontario government to gather demographic information from users of the site, while also using their feedback to identify and prioritize the development of new features, data and functionality through continuous updates to the website.
2.7.2 Clients, interventions and expenditures
For a third consecutive year, Ontario served a growing number of clients, totalling 192,669 in FY1718, a 1.1% year-over-year increase. The decline in the number of active claimants (-5,855; -9.4%) was more than offset by an increase of former claimants (+4,906; +19.8%) and non-insured clients (+3,081; +3.0%). The share of each client-type relative to the total number of clients served moved in similar direction, with active claimants (29.3%) dropping by 3.4 percentage points, former claimants (15.4%) and non-insured clients climbing (55.3%) by 2.4 and 1.0 percentage points, respectively.
In FY1718, a total of 214,346 (-0.3%) EBSM-similar interventions were delivered in Ontario. For a sixth consecutive year, the share of EAS relative to the total number of EBSM-similar interventions continued to expand, reaching 89.6% (+1.6 percentage point). Overall, a total of 39,678 (+7.1%) EI clients returned to employment, and unpaid benefits (-11.2%) declined from $262.66 million to $233.15 million. At $615.1 million, Ontario’s total EBSMs expenditures remained relatively stable (-0.9%) year-over-year. This amount includes $40.1 million received by the province from the $125 million additional LMDA funding announced in Budget 2017.
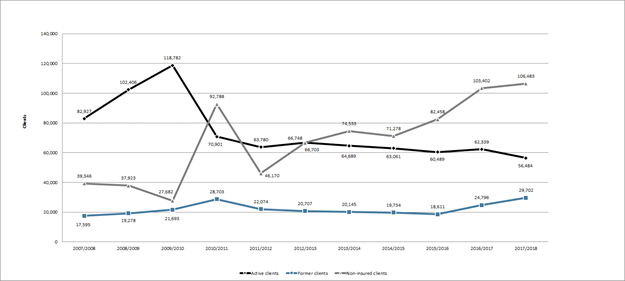
Chart 18 - Text version
| Active clients | Former clients | Non-insured clients | |
|---|---|---|---|
| 2007/2008 | 82,927 | 17,595 | 39,346 |
| 2008/2009 | 102,406 | 19,278 | 37,923 |
| 2009/2010 | 118,782 | 21,693 | 27,682 |
| 2010/2011 | 70,901 | 28,703 | 92,788 |
| 2011/2012 | 63,780 | 22,074 | 46,170 |
| 2012/2013 | 66,748 | 20,707 | 66,703 |
| 2013/2014 | 64,689 | 20,145 | 74,533 |
| 2014/2015 | 63,061 | 19,734 | 71,278 |
| 2015/2016 | 60,489 | 18,611 | 82,458 |
| 2016/2017 | 62,339 | 24,796 | 103,402 |
| 2017/2018 | 56,484 | 29,702 | 106,483 |
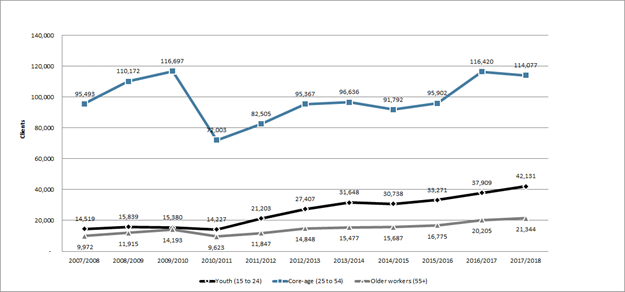
Chart 19 - Text version
| Youth (15 to 24) | Core-age (25 to 54) | Older workers (55+) | |
|---|---|---|---|
| 2007/2008 | 14,519 | 95,493 | 9,972 |
| 2008/2009 | 15,839 | 110,172 | 11,915 |
| 2009/2010 | 15,380 | 116,697 | 14,193 |
| 2010/2011 | 14,227 | 72,003 | 9,623 |
| 2011/2012 | 21,203 | 82,505 | 11,847 |
| 2012/2013 | 27,407 | 95,367 | 14,848 |
| 2013/2014 | 31,648 | 96,636 | 15,477 |
| 2014/2015 | 30,738 | 91,792 | 15,687 |
| 2015/2016 | 33,271 | 95,902 | 16,775 |
| 2016/2017 | 37,909 | 116,420 | 20,205 |
| 2017/2018 | 42,131 | 114,077 | 21,344 |

Chart 20 - Text version
| Returns to employment | Active claimants served | Total clients served | Estimated unpaid benefits ($ million) | |
|---|---|---|---|---|
| 2007/2008 | 53,962 | 82,927 | 139,868 | $217.10 |
| 2008/2009 | 56,562 | 102,406 | 159,607 | $264.44 |
| 2009/2010 | 58,333 | 118,782 | 168,157 | $408.52 |
| 2010/2011 | 73,855 | 70,901 | 192,392 | $315.75 |
| 2011/2012 | 33,347 | 63,780 | 132,024 | $221.48 |
| 2012/2013 | 36,111 | 66,748 | 154,158 | $227.71 |
| 2013/2014 | 36,018 | 64,689 | 159,367 | $237.59 |
| 2014/2015 | 36,166 | 63,061 | 154,073 | $240.22 |
| 2015/2016 | 35,625 | 60,489 | 161,558 | $236.05 |
| 2016/2017 | 37,044 | 62,339 | 190,537 | $262.66 |
| 2017/2018 | 39,678 | 56,484 | 192,669 | $233.15 |
| Interventions | Year-over-Year Change | Expenditures ($ 000s) | ||
|---|---|---|---|---|
| Employment Benefits | ||||
| SD-R | Second Career | 4,694 | -25.9% | 141,494 |
| SD-A | Skills Development–Apprenticeship | 15,360 | -6.3% | |
| TWS | Job Placement with Incentive | 2,039 | -23.1% | 3,429 |
| SE | Ontario Self-Employment Benefit | 0 | n/a | 0 |
| JCPs | Ontario Job Creation Partnerships | 161 | -30.6% | 1,825 |
| Support Measures | ||||
| EAS | Ontario Employment Assistance Services/ Employment Service | 192,092 | +2.1% | 324,522 |
| LMPs | Ontario Labour Market Partnerships | n/a | n/a | 28,295 |
| R&I | Research and Innovation | n/a | n/a | 115,488 |
2.7.3 Employment benefits
For a seventh consecutive year, the number of Employment Benefits interventions in Ontario went down, totalling 22,254 (-13.1%) in FY1718. All benefit-types fell: TWS (-613; -23.1%), JCP (-71; -30.6%), SD-R (-1,643; -25.9%), and SD-A (-1,034; -6.3%). In addition, SE was not delivered for a second consecutive year. With a proportion of 90.1% of all Employment Benefits, skills development remained the most used benefit-type. However, the share of SD-R relative to the total number of Employment Benefits interventions contracted by 3.6 percentage points to 21.1%, while that of SD-A (69.0%) grew by 5.0%. Ontario spent $146.7 million for Employment Benefits, a year-over-year decline of 14.1%, largely stemming for a decline in SD-R programming.
2.7.4 Support measures: EAS
For a third consecutive year, the number of EAS interventions increased in Ontario, amounting to 192,092 (+2.1%) in FY1718. Individual Counselling remained the sole delivered EAS type. EAS total expenditures fell from $336.0 million to $324.5 million, representing a 3.4% year-over-year drop.
2.7.5 Other support measures
For a sixth consecutive year, R&I’s funding expanded, totalling $115.5 million (+20.7%) in FY1718. In addition, total expenditures for LMPs grew by 57.0% to $28.3 million.
Ontario used additional funding to expand R&I activities directed at identifying better ways to help jobseekers prepare for and keep employment and to participate productively in the labour force.
In FY1718, Ontario introduced a number of time-limited initiatives and pilot projects under the R&I support measure. This included activities to:
- enhance opportunities for experiential learning through Career Ready Fund (profiled in Q1) and Experiential Learning for Adults Projects;
- improve access and availability of labour market information by making improvements to Ontario’s labour market website and filling the gaps in the analysis of occupations, labour market demands, as well as emerging skills requirements;
- align skills development, in addition to training, with the demands of the economy. For example:
- the Skills Catalyst Fund supports new and existing high-impact projects/pilots addressing Highly Skilled Workforce priorities for up to two years through an open, competitive Call for Proposals;
- the Contextualized Essential Skills Pilot tests a model for integrating basic skills training with occupation-specific technical training;
- the Mitacs Accelerate and TalentEdge projects emphasize career development through new research connections, experience, and professional skills training;
- the Lynda.com pilot project post-secondary education students, faculty and staff free access to an online learning platform to help them learn business, software, technology and creative skills to achieve personal and professional goals.
- provide customized training to meet the workforce development needs of employers and supporting workers through the Aboriginal Skills Advancement Program, Canada-Ontario Job Grant, as well as SkillsAdvance Ontario.
Key Program Innovation – Career Ready Fund
Launched in 2017-18, the Career Ready Fund helps employers, publicly-assisted colleges and universities and other organizations (such as industry associations and not-for-profits) create experiential learning opportunities for postsecondary students and recent graduates.
Experiential learning is “hands-on learning” in a real or simulated workplace that helps prepare students and recent graduates for the transition to work, while helping employers connect to new talent with the skills they need to hit the ground running.
Projects supported through the program’s multiple streams address the following priorities:
- Developing and expanding innovative and sustainable partnerships among employers, colleges and universities and other organizations that create new experiential learning opportunities
- Supporting new graduates with internships or similar experiences, the creation of curriculum to develop job-ready skills, or outreach to employers to create work opportunities
- Building capacity at publicly-assisted colleges and universities to create new experiential opportunities, with a significant focus on employer engagement.
In its first two years, the program is expected to create more than 70,000 net new opportunities for students and recent graduates, in a wide range of formats such as co-ops and field placements, industry-sponsored and capstone projects, bootcamps and incubators, as well as on-campus work, work simulations, and preparatory programming within postsecondary coursework. At the institutional level, significant focus is being placed on employer outreach and support, and the creation of co-curricular records that allow students to build a portfolio of experiences and promote their skills to employers.
At the same time, the fund is supporting several industry and employer-driven projects. For example, the Greater Kitchener-Waterloo Chamber of Commerce is collaborating with small businesses to create work opportunities in manufacturing, the Information and Communications Technology Council is creating work placements that will expose graduates to cyber security, cloud computing and fintech, and the Ontario Bioscience Innovation Organization is creating opportunities to give STEM graduates experience in a business environment to build management skills.
Success Story – Apprenticeship Seat Purchase
Hi I’m Bailey,
I’m a 5th year plumbing apprentice with local 46. I’d like to talk a bit about what got me into plumbing. Like a lot of people I have family in the trades but it wasn’t my dad or uncles influence that got me interested. It was my sister who is a licensed steamfitter that encouraged me that not only could I physically do the job, I may find I love it doing it. I joined my union in the summer of 2011. After a week of safety training I was sent to work in the high rise sector. I was the first woman to work for the company so naturally I had a lot of obstacles. I made it my goal to change the preconceptions some of the guys had about women in construction. With a lot of hard work, determination and support from other trades women I felt like I had achieved my goal.
I go to school at our local 46 training facility. I’ve had some really intelligent instructors and mentors over the years that truly care about our industry and are invested in our members being as well trained as possible. They’ve been a part of incredible projects that have shaped Toronto into the beautiful city it is today. In the short time I’ve been an apprentice, I’ve worked on two hospitals, BMO Field, Union station, the [Ontario Provincial Police] headquarters and so many other awesome projects. I’ve met so many amazing people and learned so many valuable lessons along the way. With my high-quality education in trade school and the knowledge and experience our journeymen, foreman and instructors have, they’ve given me the confidence and skills to know this is without a doubt my passion.
2.8 Manitoba
Manitoba’s real GDP growth reached 3.2% in 2017, after rising by 1.6% in 2016. The provincial economy is forecast to grow by around 2.0% in 2018.
Manitoba: EBSM Key Facts
| EI Clients | Non-Insured Clients |
|---|---|
| 12,521 |
12,279 |
| Interventions Type | 2017/2018 | Year-over-Year Change |
|---|---|---|
| Employment Benefits | 6,226 | 3.8% |
| Support Measures: EAS | 53,244 | 2.6% |
| Interventions Type | 2017/2018 | Year-over-Year Change(pp) |
|---|---|---|
| Employment Benefits | 10.5% | 0.6 |
| Support Measures: EAS | 89.5% | 0.6 |
| Total Expenditures | 2017/2018 ($ million) | Year-over-Year Change |
|---|---|---|
| Employment Benefits | $28.8 | 1.8% |
| Support Measures: EAS | $9.8 | 15.9% |
| LMPs and R&I | $7.8 | 23.3% |
| Total Expenditures1 | $46.4 | 0.3% |
| 2016/2017 | 2017/2018 | Year-over-Year Change |
|---|---|---|
| $46.59 | 41.31$ | 11.3% |
- 1 Totals may not add up due to rounding; does not include accounting adjustments.
In FY1718, the unemployment rate in Manitoba declined by 0.6 percentage points year-over-year to 5.5%. Compared to FY1617, employment in the province increased by 9,800. While employment slightly declined in the goods-producing sector (-900; -0.6%), led by losses in utilities (-1,400; -13.8%), employment in the services-producing sector rebounded from FY1617 (+10,700; +2.2%), with gains in all industries but public administration.
In FY1718, Manitoba continued its efforts to improve the participation of those who are more distant from the labour market, especially for Indigenous peoples, persons living with disabilities, newcomers, youth transitioning out of care and individuals at-risk of long-term dependence on social assistance. Manitoba has advanced this work through several programs that provide essential and soft skills training, as well as literacy, education, occupational skills training and employment supports. Another labour market challenge and priority the province wishes to address is ensuring that employers’ needs are met by a skilled labour supply. Employers have identified essential skills training as a necessary first step that prepares employees for the workplace by acquiring interpersonal and communication skills, work ethic, job etiquette and a series of other employability skills that will result in increased productivity. This is echoed in the response to a Manitoba Bureau of Statistics' Business and Labour Conditions Survey. When asked about responding to specific Workforce related challenges, 55.6% of businesses stated they had recruitment of skilled labour challenges.
2.8.1 Managing for results
In January 2018, Education and Training hosted a three-day Summit on Literacy and Numeracy that attracted over 700 Manitobans from across the province. Registered participants included members from the business community in addition to other stakeholder groups including early childhood learning, K-12 education, post secondary institutions, community groups and government.
The department hosted a series of full-day Indigenous education roundtables across the province with the aim of strengthening outcomes for Indigenous youth and adults. Each roundtable discussion included representatives from a variety of stakeholder groups including parents, educators, employers, community-based organizations and others with a vested interest in the education and employment outcomes of Indigenous families and communities in Manitoba.
The purpose of Manitoba’s Research and Innovations program is to bridge the gap between research and practice, supporting the basis for developing new policies, programs and services, and revising existing ones. This focus provides a basis for constantly improving Manitoba’s understanding of what works and for whom, and for continuous innovation in program design and delivery.
The objectives of Manitoba’s Research and Innovations program are:
- To support activities that address policy and program issues or research questions related to Manitoba’s priorities.
- To research and/or design projects that are practical and that identify innovative and better ways of helping individuals prepare for, find or return to, or maintain sustainable employment.
- To strengthen and promote province-wide or regional labour market development.
Manitoba uses the R&I Program to fund research studies, information and/or data development, and program/project evaluations. Below are examples of Manitoba’s strategies/approaches using the Research and Innovation (R&I) support measure.
- Determinants for Mental Well-Being of Refugees and Newcomers: Considerations for Economic and Social Integration.
- Development of training manuals and guides to be used by other service providers.
- Evaluation of Manitoba Works! a model that combines intensive employability development with on-the-job work experience. The longitudinal evaluation findings suggests that the use of social assistance decreases significantly among Manitoba Works! participants compared to participants accessing generic employment services.
- Evaluation of Motivational Interviewing, an innovative client-centric approach that focuses on building motivation to facilitate individual changes and transitions to employment. Research findings are positive and indicate that Motivational Interviewing is an effective tool for supporting clients more distant from the labour market.
- Validation of Manitoba’s new Employment and Training Assessment tool to determine a client’s readiness to proceed with skills development and employment.
Over the past few years, Manitoba has implemented a new common assessment framework anchored by the standardized Employment and Training Readiness Assessment intake tool. Manitoba has incorporated an Essential Skills lens into its assessment framework to identify critical information about an individual’s client service needs. This service response is designed to better identify participant strengths, work readiness, and service needs prior to the development of an employment plan, therefore improving the delivery of a continuum of services.
In March 2018, Manitoba piloted the new Email Communication Management System (ECMS). This system allows caseworkers to communicate directly with clients via email. Once a client’s email is validated and activated in ECMS, they receive email communications from their caseworkers including Electronic Payment Advice (saving Manitoba thousands of dollars in paper and stamps) and a digital case closure form. This digital case closure form mirrors the follow up information required to close a client’s case in Manitoba’s Integrated Case Management System. Clients can now submit their case closure information to their caseworker via email and let them know if they require additional services from a Manitoba Jobs and Skills Development Centre.
2.8.2 Clients, interventions and expenditures
In FY1718, Manitoba served a total number of 24,800 clients, a 4.3% year-over-year decrease. Active claimants (8,792) and non-insured clients (12,279) declined by 11.6% and 5.3%, respectively, while former claimants (3,729) increased by 23.8%.
As for their share relative to all clients, active claimants (35.5%; -2.9 percentage points) and non-insured clients (49.5%; -0.5 percentage points) experienced a drop, while there was a gain on the former claimant side (15.0%; +3.4percentage points).
Overall, Manitoba delivered a total of 59,470 interventions in FY1718, an increase of 1.9% from FY1617. Employment benefits represented 10.5% of all interventions for a year over year decrease of 0.6 percentage points (11.1% in FY1617). In addition, 4,505 EI clients returned to employment, a decrease of 31.4% year-over-year. Unpaid benefits totalled $41.3 million (year over year decrease of 11.3%). EBSM total expenditures ($46.4 million) remained relatively stable (+0.3%) year-over-year, and includes the $3.6 million envelope the province received from the $125 million LMDA additional funding announced in Budget 2017.
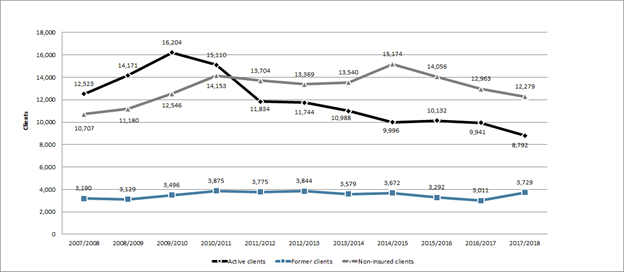
Chart 21 - Text version
| Active clients | Former clients | Non-insured clients | |
|---|---|---|---|
| 2007/2008 | 12,523 | 3,190 | 10,707 |
| 2008/2009 | 14,171 | 3,129 | 11,180 |
| 2009/2010 | 16,204 | 3,496 | 12,546 |
| 2010/2011 | 15,110 | 3,875 | 14,153 |
| 2011/2012 | 11,834 | 3,775 | 13,704 |
| 2012/2013 | 11,744 | 3,844 | 13,369 |
| 2013/2014 | 10,988 | 3,579 | 13,540 |
| 2014/2015 | 9,996 | 3,672 | 15,174 |
| 2015/2016 | 10,132 | 3,292 | 14,056 |
| 2016/2017 | 9,941 | 3,011 | 12,963 |
| 2017/2018 | 8,792 | 3,729 | 12,279 |
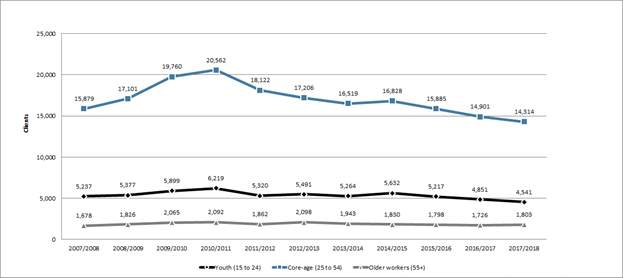
Chart 22 - Text version
| Youth (15 to 24) | Core-age (25 to 54) | Older workers (55+) | |
|---|---|---|---|
| 2007/2008 | 5,237 | 15,879 | 1,678 |
| 2008/2009 | 5,377 | 17,101 | 1,826 |
| 2009/2010 | 5,899 | 19,760 | 2,065 |
| 2010/2011 | 6,219 | 20,562 | 2,092 |
| 2011/2012 | 5,320 | 18,122 | 1,862 |
| 2012/2013 | 5,491 | 17,206 | 2,098 |
| 2013/2014 | 5,264 | 16,519 | 1,943 |
| 2014/2015 | 5,632 | 16,828 | 1,830 |
| 2015/2016 | 5,217 | 15,885 | 1,798 |
| 2016/2017 | 4,851 | 14,901 | 1,726 |
| 2017/2018 | 4,541 | 14,314 | 1,803 |
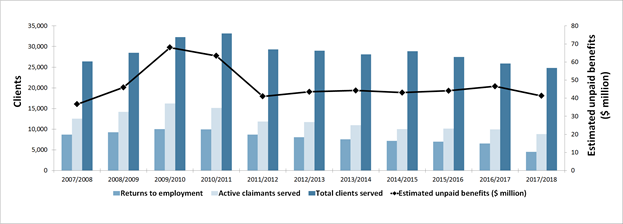
Chart 23 - Text version
| Returns to employment | Active claimants served | Total clients served | Estimated unpaid benefits ($ million) | |
|---|---|---|---|---|
| 2007/2008 | 8,715 | 12,523 | 26,420 | $36.70 |
| 2008/2009 | 9,256 | 14,171 | 28,480 | $46.00 |
| 2009/2010 | 10,043 | 16,204 | 32,246 | $68.03 |
| 2010/2011 | 9,950 | 15,110 | 33,138 | $63.38 |
| 2011/2012 | 8,714 | 11,834 | 29,313 | $40.97 |
| 2012/2013 | 8,056 | 11,744 | 28,957 | $43.51 |
| 2013/2014 | 7,526 | 10,988 | 28,107 | $44.28 |
| 2014/2015 | 7,156 | 9,996 | 28,842 | $43.09 |
| 2015/2016 | 6,957 | 10,132 | 27,480 | $44.14 |
| 2016/2017 | 6,565 | 9,941 | 25,915 | $46.59 |
| 2017/2018 | 4,505 | 8,792 | 24,800 | $41.31 |
| Interventions | Year-over-Year Change | Expenditures ($ 000s) | ||
|---|---|---|---|---|
| Employment Benefits | ||||
| SD-R | Skills Development | 1,978 | -3.2% | 25,972 |
| SD-A | Skills Development-Apprenticeship | 3,901 | -6.4% | |
| TWS | Wage Subsidies | 36 | +20.0% | 209 |
| SE | Self-Employment | 133 | +1.5% | 1,341 |
| JCPs | Employment Partnerships | 178 | +72.8% | 1,260 |
| Support Measures | ||||
| EAS | Employment Assistance Services | 53,244 | +2.6% | 9,776 |
| LMPs | Labour Market Partnerships | n/a | n/a | 5,680 |
| R&I | Research and Innovation | n/a | n/a | 2,165 |
2.8.3 Employment benefits
Employment benefits interventions in Manitoba declined by 3.8% to 6,226 in FY1718, due to the drop experienced in both SD-R (-65; -3.2%) and SD-A (-265; -6.4%). On the other hand, TWS (+6), SE (+2) and JCP (+75) grew by 20.0%, 1.5% and 72.8%, respectively. Manitoba spent a total of $28.8 million (+1.8%) for Employment Benefits.
2.8.4 Support measures: EAS
EAS interventions in Manitoba increased year-over-year by 2.6% to 53,244 in FY1718. Employment Services, which represented the largest proportion of all EAS interventions (64.1%), increased by 4.5% to 34,140, while Individual Counselling (-81; -0.4%) remained relatively stable. EAS total expenditures fell from $11.6 million to $9.8 million, representing a year-over-year decrease of 15.9%.
2.8.5 Other support measures: LMPs and R&I
In FY1718, Manitoba’s total funding for LMPs and R&I increased by 23.3% to $7.8 million. The province’s expenditures for LMPs ($5.7 million) and R&I ($2.2 million) rose by 8.2% and 93.9%, respectively.
Manitoba’s Skills Development Program supports eligible individuals while participating in upgrading and skill training required to secure employment.
Marie is an internationally educated professional who came to the Manitoba Jobs and Skills Development Centre in April 2017 seeking financial assistance to allow her to complete her studies and gain Canadian work experience. During her studies, she worked in a number of transitional jobs and gained her Canadian work experience through an unpaid internship. She passed the various exams required to become a licensed pharmacist in Manitoba. Marie became a licensed Pharmacist in September 2018!
Manitoba’s Employment Partnerships Program supports industry sectors, employers, community and other organizations to address labour force development needs while assisting eligible individuals to secure sustainable employment.
Jasmine, a single mom of three, was working a minimum wage job in a restaurant while completing high school as a mature student. After encouragement from family members who were in trades, she engaged with the Winnipeg Industrial Skills Training Centre. From the very beginning, it was apparent that Jasmine was fully invested in making her training opportunity into a successful venture. She earned a 96% GPA in welding and a 91% GPA in fabrication. After only the first two days of her work experience, she was offered full-time employment at a metal fabrication company.
2.9 Saskatchewan
In 2017, Saskatchewan’s real GDP increased by 2.2%, following two consecutive annual drops (-0.4% in 2016 and -0.9% in 2015). Rising oil and gas production largely contributed to the 2017 growth. In 2018, real GDP is expected to have grown at a rate of 1.8%.
Saskatchewan: EBSM Key Facts
| EI Clients | Non-Insured Clients |
|---|---|
| 13,598 |
5,035 |
| Interventions Type | 2017/2018 | Year-over-Year Change |
|---|---|---|
| Employment Benefits | 12,438 | 83.5% |
| Support Measures: EAS | 11,369 | 14.8% |
| Interventions Type | 2017/2018 | Year-over-Year Change(pp) |
|---|---|---|
| Employment Benefits | 52.2% | 18.5 |
| Support Measures: EAS | 47.8% | 18.5 |
| Total Expenditures | 2017/2018 ($ million) | Year-over-Year Change |
|---|---|---|
| Employment Benefits | $31.1 | 1.7% |
| Support Measures: EAS | $5.4 | 25.0% |
| LMPs and R&I | $1.9 | 18.4% |
| Total Expenditures1 | $38.4 | 2.2% |
| 2016/2017 | 2017/2018 | Year-over-Year Change |
|---|---|---|
| $74.73 | $50.38 | 32.6% |
- 1 Totals may not add up due to rounding; does not include accounting adjustments.
Employment in Saskatchewan remained relatively stable (-1,800; -0.3%), even though the unemployment rate dropped from 6.4% to 6.1%, stemming from a decline in labour market participation. Overall, the goods-producing sector (-3,200; -2.2%) experienced losses in all industries except manufacturing (+1,700; +6.2%), while employment in the services-producing sector registered a gain of 1,400 (+0.3%).
In FY1718, some sectors and regions in Saskatchewan continued to face challenges to find workers with the skills, abilities and/or educational qualifications necessary for certain positions. This mismatch between training and labour demand, in part caused by technological advancement impacting the relevancy of current and future skillsets, can deter companies from investing and expanding in the province. In addition, specific groups (ex: First Nations, Métis individuals, persons with disabilities, older workers, women, recent immigrants, and youth) are underrepresented in Saskatchewan’s labour force, often facing barriers to employment. The provincial labour market continued to face challenges from a net out-migration of people to other provinces, especially among high-skilled workers. To address those challenges, Saskatchewan’s labour market development approach involves three overarching priorities:
- align skills development investments with the needs of the economy by funding skills training opportunities that are responsive to the needs of employers; by collaborating with the training sector to develop and implement a sector planning framework; and developing a labour supply and demand model to inform planning and decision-making;
- attract skilled workers to Saskatchewan’s workforce by working with employers and community partners to improve the employment rate of groups who are underrepresented in the workforce; by modernizing client service delivery through citizen-centred service design; by providing employers and potential investors with tools and supports for strategic and inclusive workforce planning; and by working with economic ministries/agencies to promote investment opportunities to immigrant entrepreneurs; and
- retain skilled workers by increasing employer-sponsored training to support career growth and productivity; collaborating with other human services ministries to make it easier for clients to find the programs and services they need. In addition, continuing to work with the Ministries of Advanced Education and Education to create work placement opportunities for youth and adults to gain experience and exposure to careers in Saskatchewan to support graduate retention; and by investing in settlement programs and services to ensure immigrants participate in the workforce to their fullest potential.
2.9.1 Managing for results
To make employment supports available to EI claimants earlier in their claim, Saskatchewan deployed Canada-Saskatchewan Rapid Response Teams, which stems from a partnership between the Ministry of Immigration and Career Training (ICT), the Ministry of Labour Relations and Workplace Safety (Employment Standards) and Service Canada. Rapid Response Teams provided support services for businesses and workers affected by production slowdowns or layoffs. The Ministry partners ensured that each Rapid Response Team had the expertise and skills to address the particular needs of the employer and affected workers. Rapid Response Teams ensured that employers could access the programs, services, benefits and information they needed through difficult times. When necessary, ICT contracted other community-based organizations or community resources to provide additional programs and services to workers and employers impacted by lay offs. ICT is also working on plans to pilot the Targeted Referral and Feedback (TRF) system. Through this system, Saskatchewan expects to refer more EI applicants into labour market programs and services to get them the training they need to rejoin the workforce.
In FY1718, Saskatchewan examined the effectiveness of its current information/data system for meeting the program monitoring and reporting needs of ICT. The Ministry is pursuing a new IT system for improving program and service delivery. Among other benefits, this system will capture more complete, accurate and sound data. It will also have analytics capabilities to maximize the rich source of data contained in the system.
2.9.2 Clients, interventions and expenditures
For a fifth consecutive year, the total number of clients in Saskatchewan increased, reaching 18,633 (+21.6%) in FY1718. With the exception of active claimants (-2,100; -18.2%), both former claimants (+1,414; +51.6%) and non-insured clients (+3,995; +384.1%) increased. The shares of all client-types relative to the total number of clients served followed the same direction as their numbers, with active claimants dropping by 24.6 percentage points to 50.7%, while former claimants and non-insured clients advanced by 4.4 and 20.2 percentage points, respectively.
For a third consecutive year, the province delivered a growing number of interventions, totalling 23,807 (+18.3) in FY1718. Although, EAS represented the most used EBSM-similar interventions, its share of all interventions dropped significantly from 66.3% to 47.8%, a year-over-year decline of 18.5 percentage points. The total number of EI clients returning to employment following participation in an EBSM-similar program declined by 27.4%, to a total of 4,879. Much of this decline may be due to the weaker labour market conditions. Total expenditures moved up by 2.2% to $38.4 million. From the additional $125 million LMDA investment announced in Budget 2017, Saskatchewan spent its portion ($3.2 million) on improving its suite of Workforce Development programs to respond strategically to labour market challenges.

Chart 24 - Text version
| Active clients | Former clients | Non-insured clients | |
|---|---|---|---|
| 2007/2008 | 7,556 | 1,773 | 338 |
| 2008/2009 | 8,724 | 5,773 | 351 |
| 2009/2010 | 11,406 | 2,663 | 640 |
| 2010/2011 | 10,414 | 2,471 | 577 |
| 2011/2012 | 10,624 | 3,268 | 870 |
| 2012/2013 | 10,161 | 2,788 | 748 |
| 2013/2014 | 10,308 | 2,687 | 798 |
| 2014/2015 | 10,503 | 2,565 | 813 |
| 2015/2016 | 11,362 | 2,667 | 799 |
| 2016/2017 | 11,542 | 2,742 | 1,040 |
| 2017/2018 | 9,442 | 4,156 | 5,035 |
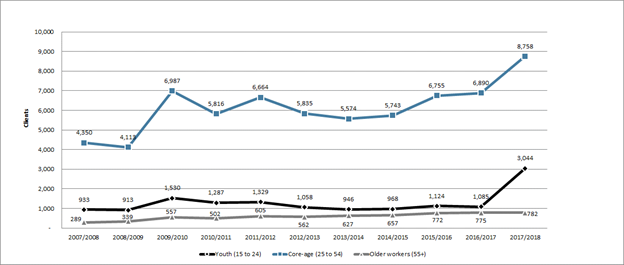
Chart 25 - Text version
| Youth (15 to 24) | Core-age (25 to 54) | Older workers (55+) | |
|---|---|---|---|
| 2007/2008 | 933 | 4,350 | 289 |
| 2008/2009 | 913 | 4,113 | 339 |
| 2009/2010 | 1,530 | 6,987 | 557 |
| 2010/2011 | 1,287 | 5,816 | 502 |
| 2011/2012 | 1,329 | 6,664 | 605 |
| 2012/2013 | 1,058 | 5,835 | 562 |
| 2013/2014 | 946 | 5,574 | 627 |
| 2014/2015 | 968 | 5,743 | 657 |
| 2015/2016 | 1,124 | 6,755 | 772 |
| 2016/2017 | 1,085 | 6,890 | 775 |
| 2017/2018 | 3,044 | 8,758 | 782 |
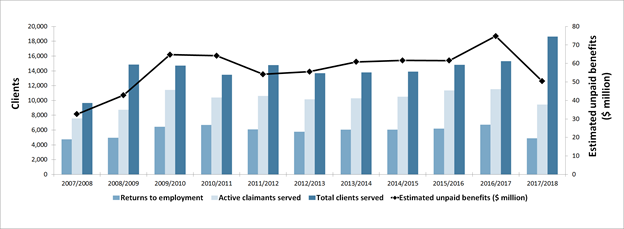
Chart 26 - Text version
| Returns to employment | Active claimants served | Total clients served | Estimated unpaid benefits ($ million) | |
|---|---|---|---|---|
| 2007/2008 | 4,754 | 7,556 | 9,667 | $32.60 |
| 2008/2009 | 4,956 | 8,724 | 14,848 | $42.80 |
| 2009/2010 | 6,432 | 11,406 | 14,709 | $64.70 |
| 2010/2011 | 6,692 | 10,414 | 13,462 | $64.15 |
| 2011/2012 | 6,083 | 10,624 | 14,762 | $54.13 |
| 2012/2013 | 5,784 | 10,161 | 13,697 | $55.56 |
| 2013/2014 | 6,038 | 10,308 | 13,793 | $60.81 |
| 2014/2015 | 6,038 | 10,503 | 13,881 | $61.60 |
| 2015/2016 | 6,204 | 11,362 | 14,828 | $61.55 |
| 2016/2017 | 6,716 | 11,542 | 15,324 | $74.73 |
| 2017/2018 | 4,879 | 9,442 | 18,633 | $50.38 |
| Interventions | Year-over-Year Change | Expenditures ($ 000s) | ||
|---|---|---|---|---|
| Employment Benefits | ||||
| SD-R | Skills Training | Provincial Training Allowance | 6,962 | +1,844.7% | 30,823 |
| SD-A | Apprenticeship Training | 5,406 | -14.8% | |
| TWS | Skills Training Allocation | 0 | n/a | 0 |
| SE | Self-Employment Program | 70 | -6.7% | 272 |
| JCPs | Employment Programs | 0 | n/a | 0 |
| Support Measures | ||||
| EAS | Workforce Development | 11,369 | -14.8% | 5,417 |
| LMPs | Regional Planning and Employer Partnerships | 0 | 0 | 1,418 |
| R&I | Research and Innovation | 0 | 0 | 454 |
2.9.3 Employment benefits
Compared to the last fiscal year, Employment Benefits interventions grew from 6,777 to 12,438, a significant increase of 83.5% year-over-year. While SE (-5; -6.7%) and SD-A (-938; -14.8%) experienced a drop, SD-R spiked by 6,604 interventions, from 358 in the previous year. This increase is partially as a result of changes in the scope of eligible programs Saskatchewan attributed to SD-R. Saskatchewan has experienced a decline in apprenticeship due to the softened labour market. As a result, SD-A interventions decreased. After three consecutive years of growth, total expenditures for Employment Benefits fell slightly by 1.7% to $31.1 million in FY1718.
2.9.4 Support measures (EAS)
After three consecutive years of growth, the number of EAS interventions in Saskatchewan decreased by 14.8% to 11,369 in FY1718. All EAS-types fell: Employment Services (-409; -6.4%), Group Services (-344; -47.1%), and Individual Counselling (-1,219; -19.5%). EAS total expenditures increased from $4.3 million to $5.4 million (+25.0%).
2.9.5 Other support measures: LMPs and R&I
After three consecutive years of decline, total LMPs and R&I funding rose by 18.4% to $1.9 million in FY1718. Both LMPs and R&I total funding advanced to $1.4 million (+16.3%) and $454,000 (+25.4%), respectively.
Journeyperson Carpenter – Apprenticeship program
After completing a B.Sc. in Kinesiology, Cassandra found limited job opportunities in that field. The jobs she could find did not pay enough to repay her student loan, so she left her job at a physiotherapy clinic to work for a home building company. Within three weeks of working with the building company, Cassandra got a raise and earned more in construction than she was at the physiotherapist clinic. As well, she discovered that she really enjoyed carpentry, so she decided to do the four-year apprenticeship program. As a woman, Cassandra faced challenges in a traditionally male trade, but she persevered. She received her Journeyperson certification and was also awarded the Wendy Davis Memorial Scholarship for the female achieving the highest mark in the exam in a traditionally male trade.
2.10 Alberta
In 2017, Alberta's economy experienced the fastest growth among provinces (+4.4%), following declines in 2016 (-4.2%) and 2015 (-3.7%). In 2018, the province’s real GDP growth is expected to have slowed down to about 2.4%, mainly due to the drop in oil prices.
Alberta: EBSM Key Facts
| EI Clients | Non-Insured Clients |
|---|---|
| 50,957 |
38,909 |
| Interventions Type | 2017/2018 | Year-over-Year Change |
|---|---|---|
| Employment Benefits | 20,328 | 15.1% |
| Support Measures: EAS | 147,055 | 23.2% |
| Interventions Type | 2017/2018 | Year-over-Year Change(pp) |
|---|---|---|
| Employment Benefits | 12.1% | 1.0 |
| Support Measures: EAS | 87.9% | 1.0 |
| Total Expenditures | 2017/2018 ($ million) | Year-over-Year Change |
|---|---|---|
| Employment Benefits | $78.8 | 5.0% |
| Support Measures: EAS | $49.5 | 15.8% |
| LMPs and R&I | $3.3 | 1.5% |
| Total Expenditures1 | $131.6 | 8.6% |
| 2016/2017 | 2017/2018 | Year-over-Year Change |
|---|---|---|
| $384.91 | $233.42 | 39.4% |
- 1 Totals may not add up due to rounding; does not include accounting adjustments.
In FY1718, labour market conditions in Alberta improved compared to the previous fiscal year. Employment grew by 1.5% to 2,298,400, with full-time employment (+2.5%) rising from 1,836,300 to 1,882,500, and part-time employment (-2.6%), declining from 427,000 to 415,800. For the first time since FY1314, the province’s unemployment rate dropped, registering at 7.4% (-1.0 percentage point). Employment growth in both goods-producing (+17,200; +3.0%) and services-producing sectors (+17,900; +1.1%) contributed to the labour market improvement. Among the goods-producing industries, the largest employment gains were recorded in utilities (+1,600; +7.9%) and manufacturing (+11,700; +10.4%), while construction (-7,400; -3.0%) was the only industry to experience a drop. Services-producing industries saw significant employment increases from transportation and warehousing (+6,800; +5.1%) and public administration (+4,700; +4.8%), but other services (-9,200; -7.5%) weakened.
In FY1718, Alberta’s economy continued to be affected by the drop in oil prices. As a result, the province invested significantly in specific labour market programs such as Targeted Wage Subsidies, Self-Employment and Job Creation Partnerships/Integrated Training. Despite these recent challenges, Alberta expects a labour shortage of approximatively 49,000 workers over the next 10 years. With the involvement of key stakeholders, the province is addressing this situation by increasing training for work programs, with an emphasis on individual-focused training and work experiences. The government also prioritized supports to immigrants; according to Statistics Canada, the immigrant participation rate in the labour force is increasing, reaching 70.9% in FY1718.
2.10.1 Managing for results
In January 2018, Alberta implemented the Targeting, Referral and Feedback (TRF) system as a pilot in three urban centres – Calgary, Edmonton and Red Deer. Currently, TRF is used by program providers to connect recently unemployed Albertans with work or short-term training.
Alberta continues to see increased demand for foundational learning programs. These programs allow unemployed Albertans the opportunity to gain the necessary competencies to enhance their skills through further education. A streamlined service delivery model was made available to all foundational learners in October 2017. This service enhancement simplified the program intake process and enabled learners to pre-determine their admission qualifications against the institution’s administrations criteria upon applying for learner funding.
Alberta continually assesses and monitors Labour Market Development Agreement (LMDA) funded programs and services to ensure they meet the changing needs of Albertans. For example, a monthly division metrics report tracks program usage and outcomes of EI clients participating in training programs and services. As well, data collected to monitor contract use and client outcomes are considered in amending service provider contracts and in planning for new tenders.
The programs funded under the LMDA have improved the capture and use of data to ensure program efficiency and effectiveness. For example, the Labour Market Partnership (LMP) Program created and incorporated a SharePoint Tracker to streamline the processes for LMDA funded grants. In addition, client outcomes are consistently measured through client follow up surveys, and program outputs are monitored monthly through the metrics report.
2.10.2 Clients, interventions and expenditures
The total number of clients served in Alberta declined significantly for a second consecutive year, reaching 89,866 (-23.9%) in FY1718. While former clients (15,856) advanced by 12.6% (+1,769), active (35,101) and non-insured clients (38,909) dropped by 29.4% (-14,619) and 28.3% (-15,349), respectively. Similarly, the shares of the client-types relative to the total number of clients served shifted in the same direction—both active (39.1%) and non-insured (43.3%) decreased by 3.1 and 2.7 percentage points, respectively, whereas the share of former clients (17.6%) expanded by 5.7 percentage points.
Similar to last year, the number of interventions delivered in Alberta dropped in FY1718, totalling 167,383 (-22.3%). The share of Employment Benefits among all interventions climbed by 1 percentage point to 12.1%, and that of EAS dropped for a seventh consecutive year, amounting to a total of 87.9% (-1 percentage point) in FY1718. Returns to employment fell significantly with 18,726 EI clients returning to work following participation in EBSM programming (-36.9%), compared to last year’s total of 29,671. Unpaid benefits (-39.4%) decreased from $384.91 million to $233.42 million, and the province’s expenditure amounted to $131.6 million (+8.6%).
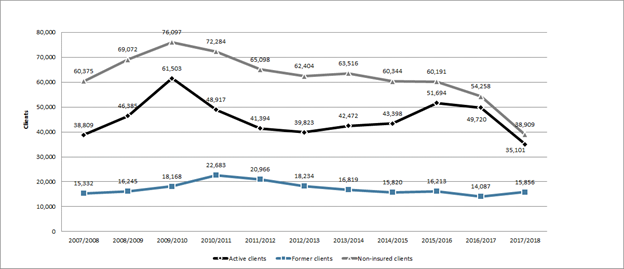
Chart 27 - Text version
| Active clients | Former clients | Non-insured clients | |
|---|---|---|---|
| 2007/2008 | 38,809 | 15,332 | 60,375 |
| 2008/2009 | 46,385 | 16,245 | 69,072 |
| 2009/2010 | 61,503 | 18,168 | 76,097 |
| 2010/2011 | 48,917 | 22,683 | 72,284 |
| 2011/2012 | 41,394 | 20,966 | 65,098 |
| 2012/2013 | 39,823 | 18,234 | 62,404 |
| 2013/2014 | 42,472 | 16,819 | 63,516 |
| 2014/2015 | 43,398 | 15,820 | 60,344 |
| 2015/2016 | 51,694 | 16,213 | 60,191 |
| 2016/2017 | 49,720 | 14,087 | 54,258 |
| 2017/2018 | 35,101 | 15,856 | 38,909 |

Chart 28 - Text version
| Youth (15 to 24) | Core-age (25 to 54) | Older workers (55+) | |
|---|---|---|---|
| 2007/2008 | 23,766 | 62,021 | 5,767 |
| 2008/2009 | 26,931 | 71,068 | 7,026 |
| 2009/2010 | 32,150 | 88,918 | 9,519 |
| 2010/2011 | 30,937 | 83,924 | 10,077 |
| 2011/2012 | 26,419 | 74,821 | 9,980 |
| 2012/2013 | 23,368 | 70,296 | 9,467 |
| 2013/2014 | 22,398 | 72,087 | 10,204 |
| 2014/2015 | 20,752 | 68,930 | 10,157 |
| 2015/2016 | 19,931 | 73,572 | 11,755 |
| 2016/2017 | 18,010 | 66,665 | 11,212 |
| 2017/2018 | 14,010 | 48,749 | 8,766 |
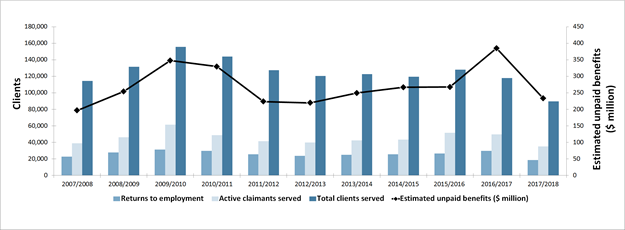
Chart 29 - Text version
| Returns to employment | Active claimants served | Total clients served | Estimated unpaid benefits ($ million) | |
|---|---|---|---|---|
| 2007/2008 | 22,920 | 38,809 | 114,516 | $196.70 |
| 2008/2009 | 27,869 | 46,385 | 131,702 | $254.39 |
| 2009/2010 | 31,341 | 61,503 | 155,768 | $347.95 |
| 2010/2011 | 29,890 | 48,917 | 143,884 | $329.59 |
| 2011/2012 | 25,776 | 41,394 | 127,458 | $223.61 |
| 2012/2013 | 23,686 | 39,823 | 120,461 | $219.63 |
| 2013/2014 | 25,092 | 42,472 | 122,807 | $249.34 |
| 2014/2015 | 25,745 | 43,398 | 119,562 | $266.98 |
| 2015/2016 | 26,525 | 51,694 | 128,098 | $267.88 |
| 2016/2017 | 29,671 | 49,720 | 118,065 | $384.91 |
| 2017/2018 | 18,726 | 35,101 | 89,866 | $233.42 |
| Interventions | Year-over-Year Change | Expenditures ($ 000s) | ||
|---|---|---|---|---|
| Employment Benefits | ||||
| SD-R | Occupational Training Work Foundations | 1,150 | -9.4% | 63,554 |
| SD-A | Skills Development-Apprenticeship | 17,723 | -17.8% | |
| TWS | Workplace Training | 127 | +225.6% | 1,114 |
| SE | Self-Employment | 302 | +33.6% | 2,038 |
| JCPs | Integrated Training | 1,026 | +19.7% | 12,089 |
| Support Measures | ||||
| EAS | Career Information | 147,055 | -23.2% | 49,501 |
| LMPs | Workforce Partnerships | n/a | n/a | 3,322 |
2.10.3 Employment benefits
In Alberta, Employment Benefits interventions dropped for a second consecutive year, reaching 20,328 (-15.1%) in FY1718. Of all benefit types, only SD-R (-120; -9.4%) and SD-A (-3,831; -17.8%) dropped. Conversely, TWS (+88; +225.6%), SE (+76; +33.6%) and JCP (+169; +19.7%) increased significantly. Employment Benefits expenditures totalled $78.8 million, a year-over-year increase of 5.0%.
2.10.4 Support measures: Employment Assistance Services (EAS)Footnote 17
In FY1718, EAS interventions declined from 191,515 to 147,055, representing a significant variation of 23.2% year-over-year.
In response to the recent recession, as well as increased demand for active employment programs and services, additional funding was allocated to EAS to increase the province’s capacity to serve the growing needs of diverse job seekers and career changers. Funding was also provided to enhance the delivery of career and employment services to rural communities. New programs and services were expanded to 17 rural communities that were previously underserved. In addition, services focusing on career transition and skill transferability into new sectors were targeted to support high-skilled unemployed Albertans, including engineers and geologists from the oil and gas sector. EAS total expenditures am ounted to $49.5 million, a year-over-year increase of 15.8%.
2.10.5 Other support measures: Labour Market Partnerships (LMP)
In FY1718, funding for LMPs decreased by 1.5% to $3.3 million. In Alberta, LMDA funding supports LMP grants that focus on getting unemployed Albertans, including those affected by the recession and downturn in the energy sector, back to work and assisting employers to address workforce adjustment situations. Examples include:
- a regional labour market strategy to help businesses increase their ability to attract and retain skilled talent and improve economic development as well as strategic planning; and,
- an Employee Resource Fair that provided an opportunity for employees impacted by the phase-out of coal-fired power plants to access essential transition resources and supports to assist them in obtaining other employment. Workforce adjustment resources included information on training, financial supports and community connections.
Cindy’s new career in dental administration – Targeted Wage Subsidies
After working in the oil and gas industry for more than 15 years, Cindy, like many thousands of Albertans, was laid off during the recession. For the first time since starting her career, Cindy found herself looking for a new job in a tough labour market. After applying for more than 300 jobs and 12 unsuccessful interviews, she learned about the Project Hire – Workplace Training program, and decided to sign up. She was matched with a local dental office, which provided her on-the-job training. Cindy learned new skills in office operations, finance and budget, technology, human resources, and others. Cindy was able to successfully make the transition from the oil field to dental administration. She now manages her employer’s dental offices, bringing her initiative, innovative ideas and technical abilities to her new job.
Lloyd receives assistance finding a new job – EAS
Before he was laid off, Lloyd had spent over 30 years fixing robots as a maintenance technician. He needed help updating his resume, practicing his interview skills, and learning new job search techniques. Lloyd received help from a career and employment program that helps people with work experience who are having trouble securing new employment. The program offers a skills assessment, help identifying and applying to jobs and opportunities to network with potential employers. Through the program, Lloyd developed strategies to approach employers and after much hard work, landed a job with an Alberta-based fertilizer company that will utilize his transferable skills.
2.11 British Columbia
After an increase of 3.2% in 2016, British Columbia’s real GDP continued to grow in 2017, expanding by 3.8%. However, economic growth is expected to have slowed down in 2018 to about 2.1%.
British Columbia: EBSM Key Facts
| EI Clients | Non-Insured Clients |
|---|---|
| 43,090 |
25,883 |
| Interventions Type | 2017/2018 | Year-over-Year Change |
|---|---|---|
| Employment Benefits | 21,498 | 4.3% |
| Support Measures: EAS | 163,778 | 10.4% |
| Interventions Type | 2017/2018 | Year-over-Year Change(pp) |
|---|---|---|
| Employment Benefits | 11.6% | 0.7 |
| Support Measures: EAS | 88.4% | 0.7 |
| Total Expenditures | 2017/2018 ($ million) | Year-over-Year Change |
|---|---|---|
| Employment Benefits | $163.5 | 5.7% |
| Support Measures: EAS | $101.8 | 6.2% |
| LMPs and R&I | $29.1 | 7.4% |
| Total Expenditures1 | $294.4 | 1.4% |
| 2016/2017 | 2017/2018 | Year-over-Year Change |
|---|---|---|
| $152.70 | $136.56 | 10.6% |
- 1 Totals may not add up due to rounding; does not include accounting adjustments.
For an eighth consecutive year, employment increased in British Columbia, reaching 2,477,600 (+3.2%) in FY1718, with full-time (+57,100) and part-time work (+19,100) growing by 3,0% and 3.7%, respectively. Both goods-producing (+24,900; +5.3%) and services-producing industries (+51,300; +2.7%) contributed to employment growth. Similar to the previous fiscal year, construction (+17,900; +8.3%) and finance, insurance, real estate, rental and leasing (+16,900; +12.0%) recorded strong employment growth rates in British Columbia. In addition, health care and social assistance (+20,600; +7.1%), as well as other services (+7,300; +6.8%), also experienced significant growth in FY1718. However, the following industries showed significant employments losses: business, building and other support services (-6,200; -5.8%); transportation and warehousing (-4,300; -3.1%) and public administration (-3,800; -3.6%).
In line with the strong economic performance in the province, the unemployment rate in British Columbia fell to 5.0% in FY1718, a year-over-year drop of 0.8 percentage point. This is lowest unemployment rate since the 2008/2009 recession.
In FY1718, British Columbia’s Labour Market Priorities focussed on:
- investing in relevant skills training and supports, through WorkBC Employment Services, to better align British Columbians with sustainable job opportunities and to meet employer demands;
- continual development of strategies to engage all British Columbians, including underrepresented groups, through province-wide engagement sessions to understand the needs of individuals and communities, and in turn to increase awareness of WorkBC Centres located across the province and the services and supports they could provide;
- continue to work with local communities and organizations to further develop and increase community-based partnerships across the province; and,
- continue to leverage and enhance labour market information and knowledge to inform the management and improvement of the Ministry of Social Development and Poverty Reduction’s services.
2.11.1 Managing for results
Targeting, Referral and Feedback Initiative
The Targeting, Referral and Feedback (TRF) initiative was implemented by British Columbia, in partnership with the Government of Canada, to proactively engage EI applicants and assist them to return to employment more quickly. TRF connects new EI applicants to their local WorkBC Centre, where they can access employment information, services and supports while matching their existing skills with local labour market needs. Information about the resulting client experience is shared with the Government of Canada to help shape future TRF enhancements and inform policy development.
First introduced as a pilot project in the fall of 2016, TRF was fully implemented across the province in FY1718 and quickly started making a meaningful impact on the number of EI applicants accessing employment services. As of March 2018, over 27,000 individuals were proactively contacted through TRF by WorkBC Centres staff to provide them with information about employment services available to them. Furthermore, 74% of TRF clients who received case management services returned to employment through working with their local WorkBC Centre case manager.
WorkBC Program Renewal
Contracts for the delivery of employment services through WorkBC Centres across BC expire on March 31, 2019. The Province is taking this opportunity to make changes to the WorkBC structure, incorporating outcomes and feedback from stakeholder engagement conducted throughout the years, and recommendations from the independent, third‐party Program Evaluation concluded in 2016.
Program renewal activities, including drafting of new contracts, procurement, systems design, cost analysis, and training have been a focus for BC in FY1718. Key changes to the program will allow BC to better align skills training with employer demands, focus on sustainable outcomes, and achieve consistency in services available to British Columbians across the province.
One of the key changes to the program introduces a new service delivery model for Apprentice and Assistive Technology services, to be delivered by one province‐wide contractor for each service type, allowing for consistent service levels throughout the province, including for clients in underrepresented groups and rural communities.
Employment Services will be delivered under the WorkBC brand through regional contracts, while new regional definitions will remove boundaries for service to clients and align with economic regions to leverage and enhance local labour market knowledge.
Recent EI amendments expanded the ability of previously ineligible clients to access LMDA‐funded programs and services. The new program design will allow for enhanced services to some of the most vulnerable segments of the EI client population. Expanded EI reachback eligibility will include individuals who paid EI premiums in at least five of previous ten years, and allow individuals with unstable or unsustainable employment, many of whom are working poor, to access employment services to assist them in improving their employment situation.
2.11.2 Clients, interventions and expenditures
In FY1718, British Columbia served 68,973 clients, a decrease of 8.1% year over year. Both active claimants (-2,391; -6.8%) and non-insured clients (-5,190; -16.7%) declined, while former claimants jumped by 1,476 clients (+16.9%).
As for their shares of the total number of clients served, active claimants (47.7%) remained relatively stable (+0.7 percentage point), and former claimants (14.8%) advanced by 3.2 percentage points. In contrast, the share of non-insured clients (37.5%) decreased by 3.9 percentage points.
British Columbia delivered 185,276 interventions (-9.8%) in FY1718. At 88.4%, EAS continued to represent the largest share of all EBSM-similar interventions. The number of EI clients returning to employment (20,997) remained steady year over year (-0.3%), representing 96.5% of the province’s annual target of 21,750. Compared to the previous fiscal year, unpaid benefits declined from $152.70 million to $136.56 million, a year-over-year drop of 10.6%. EBSM total expenditure grew from $290.3 million in FY1617, to $294.4 million, representing a 1.4% year-over-year increase. This amount includes $13.6 million British Columbia received from the $125 million LMDA additional funding announced in Budget 2017 as well as $6.8 million to address the impact on the communities affected by tariffs imposed by the United States on Canadian softwood exports.

Chart 30 - Text version
| Active clients | Former clients | Non-insured clients | |
|---|---|---|---|
| 2007/2008 | 39,046 | 10,767 | 32,035 |
| 2008/2009 | 43,636 | 10,652 | 41,736 |
| 2009/2010 | 64,197 | 14,720 | 35,795 |
| 2010/2011 | 51,433 | 16,828 | 38,415 |
| 2011/2012 | 36,889 | 12,984 | 29,068 |
| 2012/2013 | 31,953 | 13,303 | 31,522 |
| 2013/2014 | 34,612 | 11,336 | 35,680 |
| 2014/2015 | 34,937 | 9,502 | 32,365 |
| 2015/2016 | 35,891 | 9,007 | 31,706 |
| 2016/2017 | 35,272 | 8,733 | 31,073 |
| 2017/2018 | 32,881 | 10,209 | 25,883 |
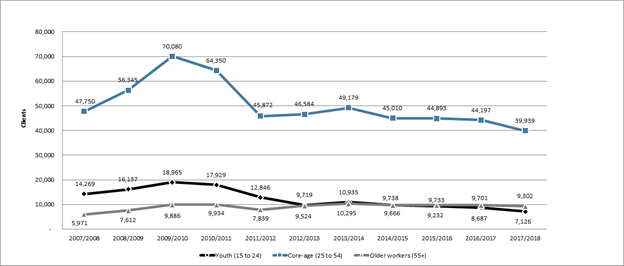
Chart 31 - Text version
| Youth (15 to 24) | Core-age (25 to 54) | Older workers (55+) | |
|---|---|---|---|
| 2007/2008 | 14,269 | 47,750 | 5,971 |
| 2008/2009 | 16,137 | 56,345 | 7,612 |
| 2009/2010 | 18,965 | 70,080 | 9,886 |
| 2010/2011 | 17,929 | 64,350 | 9,934 |
| 2011/2012 | 12,846 | 45,872 | 7,839 |
| 2012/2013 | 9,719 | 46,584 | 9,524 |
| 2013/2014 | 10,935 | 49,179 | 10,295 |
| 2014/2015 | 9,666 | 45,010 | 9,738 |
| 2015/2016 | 9,232 | 44,893 | 9,733 |
| 2016/2017 | 8,687 | 44,197 | 9,701 |
| 2017/2018 | 7,126 | 39,939 | 9,302 |
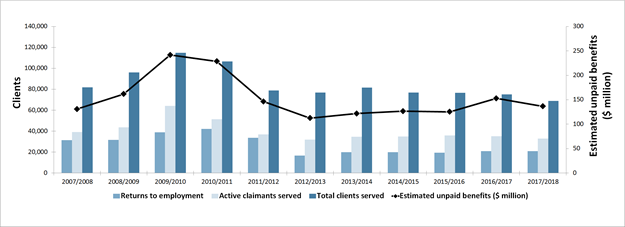
Chart 32 - Text version
| Returns to employment | Active claimants served | Total clients served | Estimated unpaid benefits ($ million) | |
|---|---|---|---|---|
| 2007/2008 | 31,427 | 39,046 | 81,848 | $131.00 |
| 2008/2009 | 31,607 | 43,636 | 96,024 | $161.76 |
| 2009/2010 | 38,931 | 64,197 | 114,712 | $241.66 |
| 2010/2011 | 42,082 | 51,433 | 106,676 | $228.44 |
| 2011/2012 | 33,580 | 36,889 | 78,941 | $146.43 |
| 2012/2013 | 16,777 | 31,953 | 76,778 | $112.51 |
| 2013/2014 | 20,040 | 34,612 | 81,628 | $121.85 |
| 2014/2015 | 19,818 | 34,937 | 76,804 | $126.47 |
| 2015/2016 | 19,552 | 35,891 | 76,604 | $125.29 |
| 2016/2017 | 21,050 | 35,272 | 75,078 | $152.70 |
| 2017/2018 | 20,997 | 32,881 | 68,973 | $136.56 |
| Interventions | Year-over-Year Change | Expenditures ($ 000s) | ||
|---|---|---|---|---|
| Employment Benefits | ||||
| SD-R | Skills Development Employment Benefit | 3,496 | -16.6% | 131,659 |
| SD-A | Skills Development Employment Benefit – Apprenticeship | 13,560 | +1.6% | |
| TWS | Wage Subsidies | 1,897 | -8.5% | 9,480 |
| SE | Self-Employment | 2,328 | -9.4% | 14,272 |
| JCPs | Job Creation Partnerships | 217 | -27.2% | 8,053 |
| Support Measures | ||||
| EAS | Employment Assistance Services | 163,778 | -10.4% | 101,810 |
| LMPs | Labour Market Partnerships Employer Sponsored Training | n/a | n/a | 12,764 |
| R&I | Research and Innovation | n/a | n/a | 16,373 |
2.11.3 Employment benefits
In FY1718, British Columbia provided a total of 21,498 Employment Benefits interventions, which was 977 fewer interventions (-4.3%) compared to FY1617. With the exception SD-A (+218; +1.6%), all other benefits types dropped significantly: JCP (-81; -27.2%), SD-R (-697; -16.6%), SE (-241; -9.4%), and TWS (-176; -8.5%). The Employment Benefits’ total expenditures reached $163.5 million (+5.7%) in FY1718.
In June 2017, ESDC announced $6.8 million in financial support to BC over FY1718 to address the impact on the communities affected by tariffs imposed by the United States on Canadian softwood exports.
The Ministry targeted this additional funding to communities and workers impacted by the tariffs, with a focus on supports such as retraining, provided through WorkBC Employment Services, including an investment of over $1.45 million in Community and Employer Partnership (CEP) projects to provide skills training and work experience to help impacted workers transition to in-demand occupations.
Fourteen CEP projects provided training and work experience to 86 clients in communities affected by the tariffs in FY1718. CEP also engaged with communities to increase awareness of funding streams and to identify the specific needs of that community which funding can support. The Ministry worked with WorkBC Centres to ensure there is adequate funding to support laid-off or job threatened workers with skills-based retraining.
2.11.4 Employment Assistance Services
For a fourth consecutive year, EAS interventions declined in British Columbia, reaching 163,778 (-10.4%) in FY1718. All EAS types declined, with Employment Services (-11,512), Individual Counselling (-7,461) and Group Services (-121), contracting by 9.1%, 13.4%, and 65.8%, respectively. EAS total expenditures weakened by 6.2% to $101.8 million.
2.11.5 Other support measures: LMPs and R&I
In FY1718, LMPs and R&I funding increased by 7.4% to $29.1 million. Both LMPs ($12.8 million) and R&I ($16.4 million) funding advanced by 15.7% and 1.7%, respectively.
Spotlight on: Skills Training
Rick has been a commercial meat cutter for 17 years, when a shoulder surgery and an arthritis diagnosis left him unable to work in his profession any longer. After moving to Oliver, hoping a warmer climate would alleviate his arthritis condition, Rick came into the local WorkBC Centre and found out about case management services offered by WorkBC.
Rick was insecure about his computer skills and was looking for help with creating a resume and applying to jobs online. His case manager directed him to a workshop that focused on developing job search skills, learning about the local labour market, accessing online resources, and applying for jobs online. Through completing in the workshop, Rick developed a new resume and cover letter, and practiced interviewing techniques and responses.
Rick received Career and Skills assessments to identify his transferable skills and develop employment goals suitable for the Oliver labour market. A Disability Related Needs Assessment also helped him understand how his arthritis will affect his ability to perform some tasks, and to identify a labour market goal that would not aggravate his condition.
Together with his Case Manager, Rick explored employment options that would suit his temperament, his skills and his physical abilities. He was interested in opportunities at the new Okanagan Correctional Center, about to open near Oliver that year. Rick’s case manager researched companies that were contracted to provide services to the Correctional Center and leveraged local employer contacts developed by the WorkBC Centre to help Rick find suitable opportunities. Rick submitted a resume, attended an interview, and ultimately successfully secured full time employment with Evergreen Maintenance, a contractor supplying services to the Correctional Center, achieving his employment goal.
2.12 Northwest Territories
Following a 1.1% increase in 2016, real GDP in the Northwest Territories rose by 3.7% in 2017, with a contraction expected in 2018. The slowdown in 2018 likely stems from weaker investment in the mining sector, with diamond production reaching its peak.
Northwest Territories: EBSM Key Facts
| EI Clients | Non-Insured Clients |
|---|---|
| 676 |
793 |
| Interventions Type | 2017/2018 | Year-over-Year Change |
|---|---|---|
| Employment Benefits | 264 | 11.4% |
| Support Measures: EAS | 1,907 | 25.4% |
| Interventions Type | 2017/2018 | Year-over-Year Change(pp) |
|---|---|---|
| Employment Benefits | 12.2% | 4.2 |
| Support Measures: EAS | 87.8% | 4.2 |
| Total Expenditures | 2017/2018 ($ million) | Year-over-Year Change |
|---|---|---|
| Employment Benefits | $1.5 | 2.1% |
| Support Measures: EAS | $1.2 | 0.8% |
| LMPs and R&I | $0.2 | 32.3% |
| Total Expenditures1 | $2.9 | 4.0% |
| 2016/2017 | 2017/2018 | Year-over-Year Change |
|---|---|---|
| $2.04 | $1.30 | 36.3% |
- 1 Totals may not add up due to rounding; does not include accounting adjustments.
Compared to the last fiscal year, employment declined in the Northwest Territories, totalling 21,200 (-1,100; -4.8%) in FY1718, while the territory’s unemployment rate edged up from 7.1% to 7.2% year over year.
Similar to the previous fiscal year, the Northwest Territories continued to work with stakeholders on the Skills 4 Success Framework. The framework was launched in FY1617, with the view of responding to labour market challenges brought upon by the changing nature of work and growing skills mismatches. The territory’s priorities in FY1718 included:
- providing enhanced access to programs for Employment Insurance (EI) clients, in order to enhance their skills and increase their likelihood of returning to the labour force quickly;
- developing the tools to identify EI clients earlier in their claim in order to offer them relevant programming;
- providing quality career development resources and services through Regional Education, Culture and Employment (ECE) Service Centres; and,
- assessing current programs and work with regional partners, to identify new programs and services in order to improve the employment potential of EI eligible clients.
2.12.1 Managing for results
Over the course of FY1718, The Government of Northwest Territories’ (GNWT) Department of Education, Culture and Employment (ECE) engaged with employers, organizations and community stakeholders to identify key labour market barriers and opportunities for Northern residents, and adjusted priorities and focus as required. In spring 2017, ECE conducted an external engagement process with partners and stakeholders; including Indigenous Governments, communities, employers, residents, GNWT departments and Aurora College, to inform the development of a strategy aimed at enhancing employment opportunities and outcomes in small NWT communities. In total, 411 stakeholders, from 31 of the 33 NWT communities participated, which included interviews, focus group discussions, and a public survey.
During these consultations, ECE received extensive feedback to inform a redesign of its suite of labour market programs, which resulted in streamlined and more client-focused programming, as well as user-friendly application processes. Supported by and coinciding with the signing of new Labour Market Transfer Agreements (LMTAs), ECE’s new suite of labour market programs launched in April 2018.
Informed by client, business and stakeholder engagements, as well as input from ECE Regional Service Center program delivery staff, in 2017, ECE initiated a significant redesign of its LMTA-supported labour market programs. This included streamlining program offerings from 24 to eight offerings to eliminate overlap and duplication. Programs were renamed and rebranded, making them more intuitive and client-focused. ECE also revised program forms and internal administration processes to enhance accountability and support easier access by clients.
The result is a suite of programs that ensures more equitable supports and services to both EI and non-EI-eligible clients, as most programs can be supported through LMDA and WDA funding streams, depending on client circumstances. These programs are described below.
2.12.2 Clients, interventions and expenditures
In FY1718, the total number of clients served in the Northwest Territories grew from 1,035 to 1,469, a significant year-over-year growth of 41.9%. All client-types advanced, with active claimants (+27), former claimants (+187), and non-insured clients (+220) increasing by 8.8%, 119.9% and 38.4%, respectively. Contrary to their numbers, the share of active claimants (22.7%) decreased by 6.9 percentage points, that of non-insured clients (54.0%) by 1.4 percentage points, while the proportion of former clients (23.3%) progressed by 8.3 percentage points.
For a third consecutive year, the total number of interventions delivered in the Northwest Territories rose, reaching 2,171 (+19.4%) in FY1718. At 87.8%, EAS kept the largest share of all EBSMs interventions. The number of EI clients returning to employment declined from 177 to 142 in FY1718, representing a drop of 19.8% year over year. Unpaid benefits ($1.30 million) fell by 36.3%. The provincial total EBSMs expenditures dropped by 4.0% to $2.9 million. This amount includes Northwest Territories’ share ($161,675) of the additional $125 million in LMDA funding announced in Budget 2017.
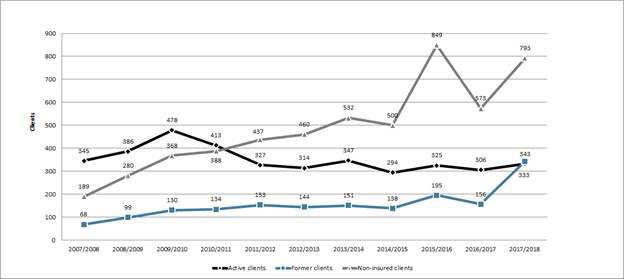
Chart 33 - Text version
| Active clients | Former clients | Non-insured clients | |
|---|---|---|---|
| 2007/2008 | 345 | 68 | 189 |
| 2008/2009 | 386 | 99 | 280 |
| 2009/2010 | 478 | 130 | 368 |
| 2010/2011 | 413 | 134 | 388 |
| 2011/2012 | 327 | 153 | 437 |
| 2012/2013 | 314 | 144 | 460 |
| 2013/2014 | 347 | 151 | 532 |
| 2014/2015 | 294 | 138 | 500 |
| 2015/2016 | 325 | 195 | 849 |
| 2016/2017 | 306 | 156 | 573 |
| 2017/2018 | 333 | 343 | 793 |
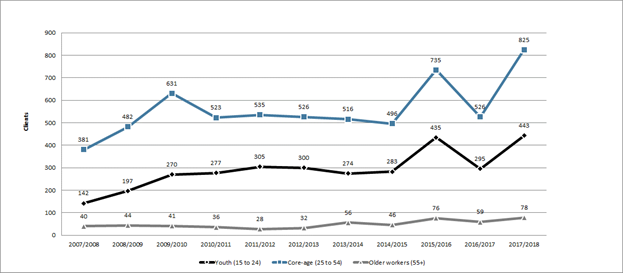
Chart 34 - Text version
| Youth (15 to 24) | Core-age (25 to 54) | Older workers (55+) | |
|---|---|---|---|
| 2007/2008 | 142 | 381 | 40 |
| 2008/2009 | 197 | 482 | 44 |
| 2009/2010 | 270 | 631 | 41 |
| 2010/2011 | 277 | 523 | 36 |
| 2011/2012 | 305 | 535 | 28 |
| 2012/2013 | 300 | 526 | 32 |
| 2013/2014 | 274 | 516 | 56 |
| 2014/2015 | 283 | 496 | 46 |
| 2015/2016 | 435 | 735 | 76 |
| 2016/2017 | 295 | 526 | 59 |
| 2017/2018 | 443 | 825 | 78 |

Chart 35 - Text version
| Returns to employment | Active claimants served | Total clients served | Estimated unpaid benefits ($ million) | |
|---|---|---|---|---|
| 2007/2008 | 214 | 345 | 602 | $2.50 |
| 2008/2009 | 208 | 386 | 765 | $2.68 |
| 2009/2010 | 278 | 478 | 976 | $4.05 |
| 2010/2011 | 263 | 413 | 935 | $3.51 |
| 2011/2012 | 202 | 327 | 917 | $2.34 |
| 2012/2013 | 185 | 314 | 918 | $2.16 |
| 2013/2014 | 200 | 347 | 1,030 | $2.33 |
| 2014/2015 | 193 | 294 | 932 | $2.35 |
| 2015/2016 | 173 | 325 | 1,369 | $1.82 |
| 2016/2017 | 177 | 306 | 1,035 | $2.04 |
| 2017/2018 | 142 | 333 | 1,469 | $1.30 |
| Interventions | Year-over-Year Change | Expenditures ($ 000s) | ||
|---|---|---|---|---|
| Employment Benefits | ||||
| SD-R | Building Essential Skills | 55 | -32.9% | 995 |
| SD-A | Building Essential Skills-Apprenticeship | 125 | -18.8% | |
| TWS | Wage Subsidies | 60 | +275.0% | 323 |
| SE | Self-Employment Option | 14 | -33.3% | 203 |
| JCPs | Job Creation Partnerships | 10 | -60.0% | 0 |
| Support Measures | ||||
| EAS | Employment Assistance Services | 1,907 | 25.4% | 1,180 |
| LMPs | Labour Market Partnerships | 0 | 0 | 128 |
| R&I | Research and Innovation | 0 | 0 | 80 |
2.12.3 Employment benefits
Employment Benefits interventions in the Northwest Territories fell for a second consecutive year, totalling 264 (-11.4%) in FY1718. With the exception of TWS (+44; +275.0%), all other benefit-types declined: SE (-7; -33.3%), JCP (-15; -60.0%), SD-R (-27; -32.9%) and SD-A (-29; -18.8%). Total expenditures for Employment Benefits edged down from $1.6 million to $1.5 million, a 2.1% year-over-year decrease.
2.12.4 Support measures: EAS
In the Northwest Territories, EAS interventions, delivered solely as Individual Counselling interventions, grew for a third consecutive year, totalling 1,907 (+25.4%) in FY1718. EAS total expenditures grew by 0.8% to $1.2 million.
2.12.5 Other support measures: LMPs and R&Is
Total funding for LMPs and R&I dropped from $307,000 to $208,000, a significant year-over-year decrease of 32.3%. Both R&I’s ($80,000) and LMPs’ expenditures ($128,000) declined by 33.4% and 31.6%, respectively.
The GNWT did not invest in Research and Innovation measures in FY1718. However, the Territory plans to implement a new R&I measure in FY1819, by piloting an innovative approach to working with students in Grades 9 to 12, and with youth aged 18 to 24, to help them make informed decisions that improve their education and employment outcomes. The introduction of Career and Education Advisor positions will ensure that residents, particularly students and youth, are prepared for in-demand job opportunities.
Gerald’s Diamond Determination
Gerald is a 29-year-old Indigenous man without a high school diploma. He is currently living in Yellowknife with his young family. He has spent the last couple of years working in temporary/seasonal positions, primarily as a labourer. In November of 2017, he accessed funding under LMDA Building Essential Skills for a 6-week Introduction to Mining Industry course in Yellowknife sponsored by the Mine Training Society. He then went on to complete the 14-week Surface Miner Program in Fort Smith. Shortly after completing the program he was offered a full-time, permanent position at Diavik Diamond Mine where he now works as a Surface Miner.
Blazing a Trail (Skills Development)
Tom became a registered apprentice Electrician in June 2010. He worked for two electrical companies in Yellowknife during his apprenticeship. He accessed the LMDA Building Essential Skills Apprenticeship program funding to attend all four levels of technical training while an apprentice (2010-2014). He completed his apprenticeship and was awarded journeyperson certification and Red Seal certification in May 2014. Unfortunately, he was laid-off from his Electrician job so became interested in starting his own business. Tom was counselled by a Career Development Officer and was referred to the LMDA Self-Employment Option (SEO) Program. He has been very successful with the SEO Program and started his own business. He is now looking to hire an apprentice for his business. It is anticipated that Tom will be able to guide his new employee through the Apprenticeship program with support from ECE’s new LMDA Skills Development Program.
2.13 Yukon
Yukon’s real GDP rose by 3.1% in 2017, following a 6.9% increase in 2016. This was mainly due to the increase in exports. In 2018, the economic growth rate is projected to have strengthened by about 4.6%.
Yukon: EBSM Key Facts
| EI Clients | Non-Insured Clients |
|---|---|
| 252 |
108 |
| Interventions Type | 2017/2018 | Year-over-Year Change |
|---|---|---|
| Employment Benefits | 180 | 9.1% |
| Support Measures: EAS | 273 | 24.7% |
| Interventions Type | 2017/2018 | Year-over-Year Change(pp) |
|---|---|---|
| Employment Benefits | 39.7% | 3.3 |
| Support Measures: EAS | 60.3% | 3.3 |
| Total Expenditures | 2017/2018 ($ million) | Year-over-Year Change |
|---|---|---|
| Employment Benefits | $1.8 | 17.2% |
| Support Measures: EAS | $1.4 | 9.6% |
| LMPs and R&I | $0.2 | 27.2% |
| Total Expenditures1 | $3.5 | 0.9% |
| 2016/2017 | 2017/2018 | Year-over-Year Change |
|---|---|---|
| 1.50$ | 1.01$ | 32.7% |
- 1 Totals may not add up due to rounding; does not include accounting adjustments.
Similar to FY1617, Yukon’s labour market continued to perform well in FY1718, with growth in employment levels (+500; +2.4%), driving the employment rate to 73.3%, compared to 73.0% a year earlier. This was Yukon’s highest rate since Statistics Canada started publishing labour force survey estimates for the Territories in FY9293. As for the unemployment rate, it decreased by 2.1 percentage points to 3.2% in the recent fiscal year, the lowest rate during the previous ten fiscal years.
In a constantly improving economic environment, Yukon needs high skilled individuals ready for the labour market requirements. With a view to matching employers’ needs with those of a qualified labour force, since FY0910, the territory has developed a ten-year labour market development plan with key labour market stakeholders. The plan includes:
- a comprehensive Skills and Trades Training Strategy;
- an Immigration Strategy;
- a Labour Market Information Strategy; and,
- Recruitment and Employee Retention Strategies.
In addition, Yukon continued to focus on opportunities for targeted groups (e.g.: social assistance recipients, persons with disabilities, older workers, youth, first nations, women in trades and immigrants) who tend to face the most significant labour market challenges.
2.13.1 Managing for results
Following a national stakeholders’ consultation, which ended in September 2016, and the signature of the amended LMDA in March 2018, Yukon expects to introduce a more streamlined, simplified and inclusive program suite in April 2019. While the territory continues to prioritize SD-A and EAS to serve the fast population growth and development of construction trades workforce, Yukon’s labour market still experiences a shortage of workers. Also, a significant proportion of its population remain under-represented in the labour market, including First Nations, youth and persons with disabilities. To address those needs, Yukon intends to increasingly prioritize:
- those further away from the labour market;
- services targeting employers, to help them engage those from under-represented groups; and
- increased support for innovation in program design and delivery.
To that end, Yukon Education will release a new suite of programming that will take advantage of the new flexibilities found in the LMDA, reduce the administrative burden on Yukon’s Government, and allow the community to more easily access supports. The new programming, designed based on the nature of the applicant, will fall within one of the following categories:
- Working UP: Services and supports for individuals seeking to become self-sufficient in the labour market;
- Staffing UP: Services and supports for employers seeking to improve their recruitment and retention rates and practices and to train current and future employees to meet their needs; and
- Building UP: Funding support for organizations developing and delivering services to individuals and employers, or for activities intended to strengthen the labour market.
2.13.2 Clients, interventions and expenditures
In FY1718, Yukon served a total number of 360 clients, a 12.5% year-over-year increase. All client-types grew: active claimant (+7; +3.5%), former claimants (+10; +29.4%) and non-insured clients (+23; +27.1%). While the proportion of active claimants (57.8%) of all clients declined by 5.0 percentage points, that of former claimants (12.2%) and non-insured clients (30.0%) rose by 1.6 and 3.4 percentage points, respectively.
Yukon delivered 453 EBSM-similar interventions in FY1718, representing a growth of 18.0% year-over-year. At 60.3% (+3.3 percentage points) of all interventions, EAS remained the most common delivered intervention. Overall, a total of 141 (-19.9%) individuals returned to employment after participating in EBSM-similar programming. Unpaid benefits went down, from $1.50 million to $1.01 million, a year-over-year decline of 32.7%. Total EBSM expenditures reached $3.5 million (+0.9%) in FY1718.
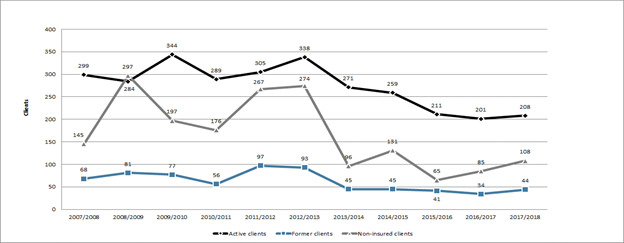
Chart 36 - Text version
| Active clients | Former clients | Non-insured clients | |
|---|---|---|---|
| 2007/2008 | 299 | 68 | 145 |
| 2008/2009 | 284 | 81 | 297 |
| 2009/2010 | 344 | 77 | 197 |
| 2010/2011 | 289 | 56 | 176 |
| 2011/2012 | 305 | 97 | 267 |
| 2012/2013 | 338 | 93 | 274 |
| 2013/2014 | 271 | 45 | 96 |
| 2014/2015 | 259 | 45 | 131 |
| 2015/2016 | 211 | 41 | 65 |
| 2016/2017 | 201 | 34 | 85 |
| 2017/2018 | 208 | 44 | 108 |
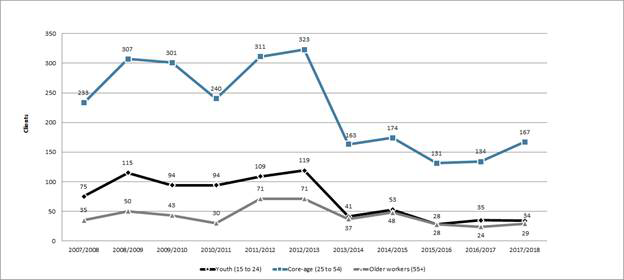
Chart 37 - Text version
| Youth (15 to 24) | Core-age (25 to 54) | Older workers (55+) | |
|---|---|---|---|
| 2007/2008 | 75 | 233 | 35 |
| 2008/2009 | 115 | 307 | 50 |
| 2009/2010 | 94 | 301 | 43 |
| 2010/2011 | 94 | 240 | 30 |
| 2011/2012 | 109 | 311 | 71 |
| 2012/2013 | 119 | 323 | 71 |
| 2013/2014 | 41 | 163 | 37 |
| 2014/2015 | 53 | 174 | 48 |
| 2015/2016 | 28 | 131 | 28 |
| 2016/2017 | 35 | 134 | 24 |
| 2017/2018 | 34 | 167 | 29 |
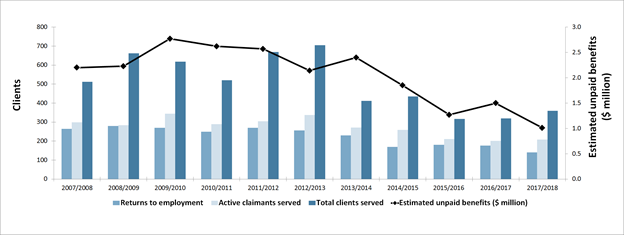
Chart 38 - Text version
| Returns to employment | Active claimants served | Total clients served | Estimated unpaid benefits ($ million) | |
|---|---|---|---|---|
| 2007/2008 | 264 | 299 | 512 | $2.20 |
| 2008/2009 | 279 | 284 | 662 | $2.23 |
| 2009/2010 | 270 | 344 | 618 | $2.77 |
| 2010/2011 | 250 | 289 | 521 | $2.62 |
| 2011/2012 | 270 | 305 | 669 | $2.57 |
| 2012/2013 | 256 | 338 | 705 | $2.14 |
| 2013/2014 | 230 | 271 | 412 | $2.40 |
| 2014/2015 | 170 | 259 | 435 | $1.85 |
| 2015/2016 | 180 | 211 | 317 | $1.27 |
| 2016/2017 | 176 | 201 | 320 | $1.50 |
| 2017/2018 | 141 | 208 | 360 | $1.01 |
| Interventions | Year-over-Year Change | Expenditures ($ 000s) | ||
|---|---|---|---|---|
| Employment Benefits | ||||
| SD-R | Skills Development Employment Benefit | 27 | +17.4% | 1,793 |
| SD-A | Skills Development Employment Benefit - Apprenticeship | 150 | +9.5% | |
| TWS | Targeted Wage Subsidies | 3 | -40.0% | 26 |
| SE | Self-Employment | 0 | 0 | 0 |
| JCPs | Employment Programs | 0 | 0 | 0 |
| Support Measures | ||||
| EAS | Employment Assistance Services | 273 | +24.7% | 1,445 |
| LMPs | Labour Market Partnerships Employer Sponsored Training | 0 | 0 | 124 |
| R&I | Research and Innovation | 0 | 0 | 95 |
2.13.3 Employment benefits
After a fourth consecutive year of decline, Employment Benefits interventions in Yukon rose by 9.1% to 180 in FY1718. With the exception of TWS (-2; -40.0%), all benefit-types grew, with both SD-R (+4) and SD-A (+13) expanding by 17.4% and 9.5%, respectively. For a third consecutive year, Yukon did not offer SE. Compared to the previous fiscal year, Yukon’s total expenditures for Employment Benefits in FY1718 increased by 17.2% to $1.8 million.
2.13.4 Support measures: EAS
In FY1718, Yukon delivered a total of 273 EAS interventions, a year-over-year increase of 24.7%. Employment Service was the sole delivered EAS-type. The provincial EAS total expenditure fell from $1.6 million to $1.4 million, representing a year-over-year decrease of 9.6%.
2.13.5 Other support measures: LMPs and R&I
In FY1718, Yukon’s total funding for R&I and LMPs declined from $302,000 to $219,000 (-27.2%). While total expenditure for LMPs increased (+8.7%), from $114,000 to $124,000, total expenditure for R&I dropped significantly by 49.2% to $95,000.
LMDA-funded assistance supports Daniel’s journey to become a carpenter
Daniel failed his Carpentry Level 1 exam three times and was ready to give up. His results were concerning as his feedback from his employer had always been satisfactory. After working closely with an apprentice case manager and a labour market project officer, Daniel was funded to go for a psychological assessment to determine what supports and accommodations he may require to be successful. When the assessment recommendations were received, it was clear he suffered from severe anxiety. After he gained this insight, the college put accommodations into place and noise-cancelling headphones were purchased for his use. Shortly after this, Daniel passed his next Carpentry Level 1 exam with a mark of 82%! Since then, Daniel is well on his way to obtaining his journeyman ticket, having proudly passed his Carpentry Level 3 exam this past April. We look forward to seeing him obtain his journeyman ticket this coming May 2019.
2.14 Nunavut
In 2017, Nunavut’s real GDP growth was the highest among all provinces and territories, reaching 9.8%, far above the national average of 3.0%. This can be attributed to the expansion of the mining sector. Such high growth rates are expected to continue over the next few years.
Nunavut: EBSM Key Facts
| EI Clients | Non-Insured Clients |
|---|---|
| 321 |
773 |
| Interventions Type | 2017/2018 | Year-over-Year Change |
|---|---|---|
| Employment Benefits | 436 | 33.3% |
| Support Measures: EAS | 1,200 | 45.3% |
| Interventions Type | 2017/2018 | Year-over-Year Change(pp) |
|---|---|---|
| Employment Benefits | 26.7% | 1.7 |
| Support Measures: EAS | 73.3% | 1.7 |
| Total Expenditures | 2017/2018 ($ million) | Year-over-Year Change |
|---|---|---|
| Employment Benefits | $1.9 | 1.2% |
| Support Measures: EAS | $0.2 | 0.0% |
| LMPs and R&I | $0.2 | 305.8% |
| Total Expenditures1 | $2.2 | 5.0% |
| 2016/2017 | 2017/2018 | Year-over-Year Change |
|---|---|---|
| $1.15 | $0.78 | 32.1% |
- 1 Totals may not add up due to rounding; does not include accounting adjustments.
Compared to the previous fiscal year, Nunavut’s labour market weakened in FY1718. Employment (-200; -1.3%) dropped from 13,500 to 13,400, with full-time employment declining by 3.0% to 11,400, and part-time employment increasing by 12.7% to 2,000. At 14.0%, the territory’s unemployment rate decreased year-over-year from 14.3%, but remained well above Canada’s average.
Persistent high unemployment rate among the Inuit population was the main challenge faced by Nunavut in FY1718. In addition, insufficient skills upgrading or work-readiness training contributed to their lower employability. Accordingly, the territory’s priorities remained preparing the labour force to meet the needs of a growing and transitioning economy. This included encouraging greater employer involvement in training to ensure that skills are aligned with current and future job opportunities, helping Nunavummiut develop the essential skills to succeed in finding and keeping employment, and connecting Nunavummiut job seekers with job opportunities through accurate, timely and comprehensive labour market information. Nunavut is also engaging with community leaders, community organizations, municipalities, Inuit organizations and other levels of government to leverage partnership opportunities.
2.14.1 Managing for results
To increase client participation in its EBSM-similar programming, Nunavut improves client service by monitoring and adjusting its service delivery model on a regular basis. To ensure all clients receive the best results from EAS, the Territory is developing an ongoing professional development program for its front-line staff. As well, the case management system is being evaluated to identify measures to more effectively meet client needs. These improvements are driving the creation of new information sources and tools to inform practice and policy.
2.14.2 Clients, interventions and expenditures
In FY1718, Nunavut served 1,094 (+30.4%) clients. All client-types contributed to this increase: active claimants (+37; +31.9%), former claimants (+73; +76.8%) and non-insured clients (+145; +23.1%). As for their shares to the total number of clients served, active (14.0%) and former claimants (15.4%) increased by 0.2 and 4.0 percentage points, respectively, while non-insured (70.7%) dropped by 4.2 percentage points.
The territory delivered a total number of 1,636 EBSM-similar interventions, representing a significant year-over-year increase of 41.9%. At 73.3% of all interventions (+1.7 percentage points), EAS-interventions remained the most used intervention-type. After participating in an EBSM-similar programming, a total of 52 individuals returned to employment compared to 75 in the previous year. As a result, unpaid benefits (-32.1%) fell from $1.15 million to $0.78 million, year over year. Total EBSM expenditures in FY1718 increased 5.0% over the previous year to $2.2 millionFootnote 18.

Chart 39 - Text version
| Active clients | Former clients | Non-insured clients | |
|---|---|---|---|
| 2006/2007 | 161 | 112 | 204 |
| 2007/2008 | 152 | 124 | 326 |
| 2008/2009 | 136 | 95 | 276 |
| 2009/2010 | 179 | 160 | 507 |
| 2010/2011 | 109 | 73 | 38 |
| 2011/2012 | 107 | 80 | 89 |
| 2012/2013 | 100 | 113 | 219 |
| 2013/2014 | 98 | 128 | 173 |
| 2014/2015 | 110 | 126 | 460 |
| 2015/2016 | 126 | 154 | 706 |
| 2016/2017 | 116 | 95 | 628 |
| 2017/2018 | 153 | 168 | 773 |
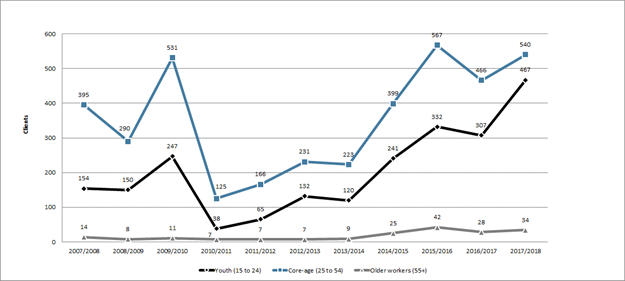
Chart 40 - Text version
| Youth (15 to 24) | Core-age (25 to 54) | Older workers (55+) | |
|---|---|---|---|
| 2006/2007 | 122 | 310 | 6 |
| 2007/2008 | 154 | 395 | 14 |
| 2008/2009 | 150 | 290 | 8 |
| 2009/2010 | 247 | 531 | 11 |
| 2010/2011 | 38 | 125 | 7 |
| 2011/2012 | 65 | 166 | 7 |
| 2012/2013 | 132 | 231 | 7 |
| 2013/2014 | 120 | 223 | 9 |
| 2014/2015 | 241 | 399 | 25 |
| 2015/2016 | 332 | 567 | 42 |
| 2016/2017 | 307 | 466 | 28 |
| 2017/2018 | 467 | 540 | 34 |
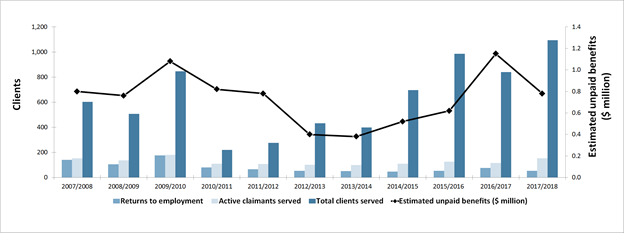
Chart 41 - Text version
| Returns to employment | Active claimants served | Total clients served | Estimated unpaid benefits ($ million) | |
|---|---|---|---|---|
| 2005/2006 | 99 | 155 | 512 | $0.48 |
| 2006/2007 | 129 | 161 | 477 | $0.70 |
| 2007/2008 | 140 | 152 | 602 | $0.80 |
| 2008/2009 | 104 | 136 | 507 | $0.76 |
| 2009/2010 | 175 | 179 | 846 | $1.08 |
| 2010/2011 | 80 | 109 | 220 | $0.82 |
| 2011/2012 | 65 | 107 | 276 | $0.78 |
| 2012/2013 | 53 | 100 | 432 | $0.40 |
| 2013/2014 | 50 | 98 | 399 | $0.38 |
| 2014/2015 | 47 | 110 | 696 | $0.52 |
| 2015/2016 | 53 | 126 | 986 | $0.62 |
| 2016/2017 | 75 | 116 | 839 | $1.15 |
| 2017/2018 | 52 | 153 | 1,094 | $0.78 |
| Interventions | Year-over-Year Change | Expenditures ($ 000s) | ||
|---|---|---|---|---|
| Employment Benefits | ||||
| SD-R | Adult Learning and Training Supports | 356 | +27.1% | 1,501 |
| SD-A | Adult Learning and Training Supports - Apprenticeship | 39 | -7.1% | |
| TWS | Training on the Job | 34 | n/a | 400 |
| SE | Nunavut Entrepreneurship Incentive | 7 | +40% | 18 |
| Support Measures | ||||
| EAS | Employment Assistance Services | 1,200 | +45.3% | 150 |
| LMPs | Target Training Initiatives | n/a | n/a | 172 |
| R&I | Research and Innovation | n/a | n/a | n/a |
2.14.3 Employment benefits
Compared to the previous fiscal year, Employment Benefits interventions in FY1718 expanded significantly by 33.3%, to 436 interventions. Both SE (+2; +40.0%) and SD-R (+76; +27.1%) experienced a growth, while SD-A (-3; -7.1%) dropped. Nunavut also delivered TWS (34 interventions) for the first time since FY1415. Total employment benefit expenditures have decreased by 1.2% to $1.9 million.
2.14.4 Support measures: EAS
In FY1718, EAS interventions, delivered solely through Employment Services (i.e. Nunavut did not offer Group Services and Individual Counselling), increased by 45.3% to 1,200. Total EAS expenditures remained stable at $150,000.
2.14.5 Other support measures: LMPs and R&I
In FY1718, LMPs expenditures grew from $43,000 to $172,000. Nunavut did not include R&I as part of its active employment programming in FY1718.
3. Evaluation of Employment Benefits and Support Measures (EBSMs) and an overview of service delivery models
This section presents results from LMDA evaluations and monitoring between 2012 to 2017 and an overview of national and international best practices in service delivery models for employment benefits. The first part of the section summarises the results of recent LMDA evaluations. The second part presents an overview of service delivery models.
3.1 LMDA evaluation results from 2012 to 2017
Between 2012 and 2017, Employment and Social Development Canada worked jointly with 12 provinces and territories to evaluate the Employment Benefits and Support Measures that are delivered under the LMDAs. Results were not produced for Quebec since the Quebec Government is responsible for evaluating its LMDAFootnote 19.
Building on lessons learned and best practices from previous LMDA evaluations, the second cycle of evaluations produced high quality evidence about the effectiveness and efficiency of the EBSMs-similar programming designed and delivered by provinces and territories. Evaluations became more timely and relevant to program and policy development, producing high quality evidence, using a cost-effective approach. Cycle II confirms that:
- LMDA program participants benefited from improved employment and earnings, as well as reduced dependence on Employment Insurance and Social Assistance.
- Providing Employment Assistance Services, which include counselling and job search assistance, earlier in an EI claim (during first 4 weeks) had more impact on earnings and employment, and facilitated earlier returns to work.
- Cost-benefit analysis demonstrated that, from a social perspective, the benefits for participants exceed the cost of investments for most interventions.
See Annex 3.16 for incremental impacts of EBSMs at the national and provincial levels. Complete national, provincial and territorial Synthesis Reports of the Evaluation of the LMDAs have been released in 2017 and 2018 and can be accessed on the ESDC Evaluation website: https://www.canada.ca/en/employment-social-development/corporate/reports/evaluations.html
3.2 Service delivery models for employment benefits and support measures
This section presents a summary from recent literature reviews covering best practices in national and international service delivery methods for active employment programs. The first part of the section provides an overview and evolution of international service delivery methods and reforms. The second part describes the service delivery models currently used by province and territories. The final section summarizes a series of consultations and interviews with service providers in three provinces, and identifies gaps as well as best practices.
3.2.1 Context
For nearly forty years, governments around the world have been testing and developing approaches or models for the delivery of employment services that are cost effective and efficient, yet at the same time responsive to the needs of jobseekers, employers, industry sectors and communities. This summary of best practices will help inform policy design in terms of service delivery related decisions by provinces and territories, in the context of increasing labour and skill shortages.
In recent years, governments around the world have been experimenting with outsourcing the delivery of active employment programs. While this remains a popular method of service delivery, many jurisdictions found no viable cost-savings, or encountered issues with market management or monitoring. Therefore, many of them have reversed contracts and re-internalized services. As service delivery models continue to evolve, many jurisdictions still experiment and innovate with various mixes of public and private delivery methods.
One example of such innovation is Job Services Australia’s Star Ratings. To mitigate problems with service delivery, transparency and performance measurement, these ratings give clients the chance to choose their service providers, while providing rigorous, transparent performance measurement to both the government and providers. It also addressed problems, such as “parking” jobseekers with complex needs or serving only those who are job-ready with a greater likelihood of employment success.
In Canada, the Forum of Labour Market Ministers Career Development Services Working Group has recently commissioned a series of interviews and consultations with employment program providers from three provinces. The resulting report was a response to an earlier study on gaps in the delivery of EBSMs. It focussed on gaps and best practices in intake and assessment methods, Employment Assistance Services, Skills development and labour market transition. The recommendations from this report can contribute to the design of effective and efficient service delivery models.
3.2.2 International overview of service delivery methods for employment programs
Since the 1980s, many countries have experimented with outsourcing public services, insourcing previously outsourced services, or mixing their employment services delivery. Outsourcing services has remained a popular method for service delivery reform, as efficiencies gained from competitive tendering resulted in significant cost savings for governments. Additionally, the introduction of competition in a traditionally monopolistic structure has led to innovations and improvements, which enhanced standards and performance.
However, these gains did not come without a cost, namely negative effects on employment, wage reductions and worsening labour conditions in outsourced areas. Therefore, many governments reversed their outsourcing decisions (insourcing) when there were no viable cost-savings, or experienced issues with market management or monitoring. Another driver for the trend towards insourcing was change in the political climate. In the continued evolution to improve service delivery for active employment benefits, some countries opt for “concurrent sourcing,” or other mixes of public and private delivery methods.
Outsourcing
Since the 1980’s, outsourcing public services has been a popular method of service delivery reform. This trend originated from increased financial constraints on government budgets, as well as a focus on savings and efficiencies. Domberger and Jensen (1997) make the distinction between contracting out (competitive tendering) versus privatization. While privatization involves the sale of public assets, contracting out opens up government services for competition while retaining ownership of assets. This report follows the Domberger and a Jensen definition, the term “outsourcing” refers interchangeably with contracting out or competitive tendering (Domberger & Jensen, 1997, p. 68).
While cost savings sustain the popularity of outsourcing, it is important to evaluate the actual costs associated with competitive tendering. There are costs associated with writing conditions and contracts, assessing the bids, negotiating the final contract and other administration related activities. It is also important to consider contractual incompleteness, the impossibility of accounting for every contingency or unforeseen event in the life of the contract. There are also intangible elements, such as “quality,” that are difficult to define in a contract (Domberger & Jensen, 1997, pp. 70-71).
In contrast to cost-savings, there are concerns with outsourcing. According to “quality-shading hypothesis” (Domberger & Jensen, 1997, p. 71), cost-reductions are assumed to also reduce quality. As private contractors have a stronger incentive to reduce costs than do public service providers, this may override the incentive to maintain or improve service quality. However, when a contract fails to produce the desired outcome, it is important to evaluate whether this is due to poor contract design, or problems with performance management (Domberger & Jensen, 1997, p. 71). Additionally, there are difficulties conducting cost comparisons for outsourced services, as there is a lack of data, and empirical evidence may be “politically charged. It may also be intertwined with policy developments” (Domberger & Jensen, 1997, p. 72).
Issues have been raised about the “loss of public-sector accountability” (Domberger & Jensen, 1997, p. 76). However, contracting can enhance accountability by prompting reviews of standards and service requirements, introducing rigorous performance monitoring and setting up mechanisms for redress for individuals or organizations who suffered loss or damage (Domberger & Jensen, 1997, p. 76). While there are overall, substantial savings generated by outsourcing public services, questions remain about the overall impact. The “bulk of public expenditure is from transfer payments (social security, unemployment benefits, pensions, etc.). Expenditure on transfer payments cannot be reduced by competitive tendering and contracting, since it does not involve the production of services where efficiency gains might be obtained” (Domberger & Jensen, 1997, p. 77).
Because of these issues, there has been an impetus to improve performance monitoring. An Australian Industry Commission (1996) study showed that a clear focus on service led to quality improvements after competitive tendering. If quality deteriorates after tendering, there may be a problem with contract design or implementation (Domberger & Jensen, 1997, p. 73).
It is important to note that government services are a natural monopoly, due to its “unique resources and high-cost structure” (Kenton, W., 2018, The Positives and Negatives of Natural Monopolies section, para. 2). This does not imply a lack of efficiency, as the market cannot sustain a large number of providers for public services. One of the biggest arguments for outsourcing states that the public sector falls behind due to a lack of efficiencies from market forces. However, when comparing like-to-like, private sector monopolies do not outperform public ones. The key to improving performance is to enhance competition. Domberger & Jensen (1997) reports cases where in-house teams won bids against private contractors, and had similar levels of savings as private contractors. “The effect of ownership (private versus public) on both price and quality was negligible relative to that of competition” (Domberger & Jensen, 1997). As long as competition or the threat of competition is maintained, there should be efficiencies.
Further to the economic arguments, there are other broader considerations to bear in mind. Historically, outsourcing negatively affects employment in government entities responsible for the delivery of active employment programs. Immediate, short-term effects include reducing staff, reducing wages, and worsening employment conditions within the contracting firm. While there is increased flexibility in the work place, this is a result of more casual or part-time labour. Longer-term effects for public service workers, who have had their positions outsourced, include redeployment to other agencies, transfer to the contractor, or redundancy (Domberger & Jensen, 1997).
Best practices: Job Services Australia
For more than 20 years, Australia has been experimenting with their employment services model. The model evolved from employment services provided mainly by the government, to a fully outsourced employment service (Job Network), to the current reforms of Job Services Australia. This iterative approach has resulted in the creation of a fully outsourced employment services system, with a viable network of both for-profit and not-for-profit employment service providers. Through its evolution, there were some issues along the way, (problems of “parking” jobseekers who required more supports, manipulation of the system by some providers, and attempts by the government to mitigate these problems that resulted in less flexibility, and increased costs and demands for administration, compliance and transactions). However, these lessons learned formed the base for the continual refinement and development of the system (Finn, D., 2011).
Some best practices from Job Services Australia include integrating multiple outsourced services into one contract, with four streams of service, where Stream 1 is for the most job-ready, and Stream 4 for those with the most complex barriers to employment. Service providers receive differential service fees and payments for job outcomes, with most of the funding targeted for Streams 3 and 4. Upon completion of a stream, individuals are either moved up another stream, or transition to work. This model allows more flexibility with service design, and the differential payments encourage providers to work with those harder to place. In addition to rewards for providers who transition participants to jobs, the system “recognises and rewards ‘pathway outcomes’ that involve reduced incentive payments to providers if they place participants in part-time employment or if they place youth in full-time education” (Finn, 2011)Footnote 20.
Third party service providers and non-profit organizations play a major role in delivering programs to jobseekers. In Australia, religious organizations deliver the majority of employment programs, but smaller, secular voluntary or community organizations remain critical, as they deliver services to areas that are not attractive to larger, for-profit organizations, such as in remote locations, or for particular characteristics of the client group. Specialist organizations are well-suited for participants who require particular skill sets, and there is a wider role for non-profits to provide work experience for jobseekers. While the relationship between non-profits and government had issues with regards to values and social mission, versus constraints of contract delivery, the non-profits advocated on behalf of disadvantaged groups, and could be openly critical of program design, sanctions, and the impact of contract changes on viability and service provision. They are an important dimension of public debate, encouraged accountability and made important contributions from the sector.
An important innovation from Australia’s service delivery experiments is their star ratings. To mitigate problems with service delivery, transparency and performance measurement, Australia introduced star ratings in 1999 to inform user’s choices for service providers, and “drive provider performance” (Finn, D., 2011, p. 9). These ratings were developed to compare labour market conditions and participant characteristics for a more rigorous comparison of local provider performance. These ratings enabled clients to choose their service providers, and provided rigorous, transparent performance measurement to both the government and providers. It also addressed problems, such as “parking” jobseekers with complex needs or “creaming”, serving only those who are job-ready who have greater likelihood of employment success (see Definitions).
Jobseekers used star ratings to assess the comparative performance of providers in their local area. Providers used the ratings to measure their contractual performance, and the Australian government used them to drive improved performance and allocate business share to providers. Contracts for providers were allocated by market share (80% to 120%), not guaranteed number of participants. As jobseekers had a choice over their providers, jobseeker flows were increasingly allocated on relative performance measured through star ratings.
Service providers are rated from 5 stars (best) to 1 star (worst). Aggregated ratings are weighted, in consideration of the increased time and resources necessary for interventions that are more complex. Individual performances are measured against the national average, and stars are allocated based on measurements above or below the national average (Job Services Australia, 2015).
Within two years of reliable star ratings, 13-week employment for jobseekers increased from 15% to 35%, and service providers could easily access data to compare local performance. As well, Job Services Australia could conduct bi-monthly performance reviews, and put low-performing contracts out to tender (Finn, 2011).
Insourcing and mixed delivery methods
As frequently as governments outsource services, there is an opposing trend of reverse-contracting, or insourcing. These decisions are made when there are no viable cost-savings, concerns arise with market management or monitoring, or there are political changes. While outsourcing is effective for mitigating the high-cost of services from efficiencies created through competition, public service delivery follows a monopolistic structure. This means that the risks and costs are higher, with less competition (Warner and Hefetz, 2012).
In a study on municipal insourcing in the United States, Warner and Hefetz (2012) reported six reasons governments reversed private contracts. These included poor quality service delivery and/or lack of cost savings from contractors, upgrades in government service provision, change in political priorities, or issues with monitoring or contract specification. “Contracting is a dynamic process.” (Warner and Hefetz, 2012, p. 323), the success of outsourcing shifts with markets, public perception, and changing needs. Governments should retain capacity to “re-internalize previously contracted work to ensure failsafe delivery and responsiveness to citizen interests” (Warner and Hefetz, 2012, p, 323).
As well, in combination with insourcing and outsourcing, concurrent sourcing, or mixing public and private delivery methods, is heavily promoted as an alternative to competitive tendering. Concurrent sourcing is a practice where “governments both make and buy the same public service” (Porcher, S. 2016, pp. 800). This strategy involves a government outsourcing part of their service, while providing the remainder. While these partnerships are considered more flexible approaches, issues remain as it can lock-in partners, undermine competition, and raise accountability risks. A possible solution, is insourcing in conjunction with outsourcing. This creates a dynamic approach that “maintains the discipline of markets and arms’ length contracts needed for monitoring and accountability” (Warner and Hefetz, 2012, p. 323).
3.2.3 Overview of provincial/territorial service delivery models
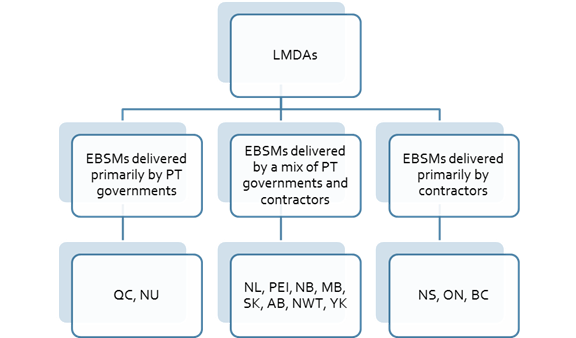
Text version
- LMDAs
- EBSMs delivered primarily by PT governments
- QC, NU
- EBSMs delivered by a mix of PT governments and contractors
- NL, PEI, NB, MB, SK, AB, NWT, YK
- EBSMs delivered primarily by contractors
- NS, ON, BC
- EBSMs delivered primarily by PT governments
In Canada, there are three main models of service delivery for EBSMs used by the provinces and territories. Most provinces and territories combine government services with outsourcing (Newfoundland and Labrador, Prince Edward Island, New Brunswick, Manitoba, Saskatchewan, Alberta, Northwest Territories, and Yukon). Other jurisdictions (Nova Scotia, Ontario, and British Columbia), mainly transferred services to third party providers, while Quebec and Nunavut retained service delivery of EBSMs within the government. In the continual evolution of service delivery methods, some provinces/territories have shifted their delivery models. In 2013/2014, Newfoundland and Labrador implemented a new case management system, ended Employment Services contracts with external service providers, and re-instituted their network of provincial counsellors. However, in 2017/2018, this system grew again, and both Newfoundland and Labrador and third party service providers now deliver EBSMs.
3.2.4 Gaps and best practices in delivery of employment benefits and support measures
In 2011, Social Research and Demonstration Corporation (SRDC) conducted a series of consultations and interviews with providers of Employment Services and Skills Development in three provinces (Nova Scotia, Manitoba, and British Columbia)Footnote 21. This study was organized by the Forum of Labour Market Ministers, Career Development Services Working Group (FLMM-CDSWG), in response to issues in the delivery of employment programs identified by an earlier project. This study identified gaps and best practices on intake and assessment methods, delivery models for employment assistance services, implementation of skills development programs, and labour market transition (Myers, K., Smith-Fowler, H., Leonard, D., Conte, N. and Gyarmati, D. (2011)).
Gaps
Intake and assessment
As intake and assessment is the first step towards any active employment program, a proper fit between the client and eligible programs and services is critically important to ensuring a successful transition to meaningful, long-term employment. Service providers reported that the narrow focus and rigid application of assessment tools resulted in inaccurate predictions of employment readiness, and excluded certain client groups. Service providers also reported that eligibility rules can be inflexible and complex, with narrow and short-sighted program objectives. Moreover, services and supports for clients with complex needs may not be readily available or accessibleFootnote 22. There was a patchwork of assessment processes across the provinces evaluated, and some training providers conducted their own assessments on an ad hoc basis. Many providers reported a need for more inclusive approaches to assessment “with other community service providers to deliver wrap-around supports” (Myers, et al., 2011, p. 16). In addition to enabling a more successful labour market transition for clients yet to be “job-ready,” it also maintained positive relationships with employers. Traditional assessment tools were also not culturally appropriate for some client groups, including Indigenous peoples and immigrants, and were not responsive to clients with low-literacy or language barriersFootnote 23 (Myers, et al., 2011).
Employment Assistance Services
EAS providers indicated that their roles shifted as the scope of services broadened and grew in complexity. Their duties changed from determining eligibility and managing program funds, to intensive employment counselling. Many staff felt they lacked training and experience, or time and resources, to manage this transition. At the same time, many jurisdictions restricted funding, which resulted in compromised services, including less follow-up, delayed access to employment counselling for jobseekers, or no client referrals. Particularly in rural and northern areas, this disproportionate service delivery further widened the gap between meeting the needs of the local community and available programsFootnote 24. As remote communities have smaller populations and less funding, programs were not delivered in a timely fashion, or there was not enough funding to address challenges such as travel expenses for participants (Myers, et al., 2011).
Current EAS delivery models have a “one-size-fits-all” approach. While suitable for self-reliant clients, this method lacked flexibility for individuals who required more supports. Particularly for clients with essential skills gaps, there was a need for assistance to navigate the systemFootnote 25. There was also a greater need for transferable skills options, to help jobseekers identify their existing skills, and apply them to new careers. Peer-assisted services and other collaborative, community approaches have shown success for groups of interest, such as within First Nations communities, with at-risk-youth, or with people with disabilities (Myers, et al., 2011).
A further issue with existing program design and delivery are objectives that are oriented towards short-term jobs, and not long-term career development and learning. Employment centres are rewarded for quick turn-around routes to employment, which leads to a revolving door effect. “The focus of employment at the expense of skills and career development may not allow enough time to assess and address barriers, and may result in clients returning to the system” (Myers, et al., 2011, p. 19).
Skills Development and labour market transition
There is a disconnect between various adult education programs and employment services. Service providers indicated a demand for short-term, accredited programs to fill specific skills gaps to address the needs of local employers and sectors. In addition, current program design does not accommodate adult learners who must prioritize between education, work, and family. The gap between programs for skills upgrades, and formal diploma or certificate programs, prevents students from transferring to the next educational level. Options, such as multiple entry and exit points, and recognized certification at each exit point, can address this discrepancy, and increase employability and career developmentFootnote 26. Additionally, funding decisions for training are frequently made outside of communities, without knowledge of local or client needs. Particularly in rural areas, the mismatch between Skills Development funding, and availability of local training programs, results in program delays or cancellations. Clients face hurdles registering or remaining in programs, and some participants may take unsustainable financial burdens, as SD funding does not cover the actual time and expense for training activities (Myers et al., 2011).
Outside of program design, Myers, et al. (2011) reported on issues of questionable training, from both private and public providers. Issues include credentials or certificates not recognized by employers or industry, or were missing elements of accredited certification. Other examples include certificates offered for non-existent occupations, unrecognized “certificates of completion” for learners with disabilities who completed two years of a training program, or non-accredited schools offering academic upgrading by distance education to clients. Multiple provinces reported sub-standard training programs with no industry linkages or relevant curriculum, or instructors without experience in the field. Additional concerns include training for low-demand or saturated occupationsFootnote 27 (Myers, et al., 2011).
Service providersalso reported that restrictions against providing service to employersFootnote 28 hinder network building, making it difficult to leverage job opportunities for clients. This lack of employer engagement negatively affects program participation, and leads to misconceptions about “administrative burdens.” In addition to training, reliable employer networks are crucial for jobseekers who are changing sectors. Improved networks do double-duty, as they inform employers about benefit programs, like wage subsidy programs or job creation programs, while they start the dialogue for hiring employment benefits participants. Strong relationships with employers can lead to education and sharing of best practices for supporting employees with needs. This enables better follow-up with new hires. Particularly for clients with barriers, continued support helps build resiliency, increases job retention, and skills building (Myers et al., 2011).
Best practices
Intake and assessment
According to employment benefit providers in three provinces, the best approaches to intake and assessments regarded this as a process, which utilized “a comprehensive set of approaches, tools and practices” (Myers, et al., 2011, p. 24). Outlined below are the most promising assessment approaches.
The “strengths based approach” (Myers, et al., 2011, p. 24) assesses clients on their assets, strengths, and potential, especially in relation to ESDC’s Essential Skills framework. Counsellors and clients work together to evaluate prior work, education, volunteer, and life experiences to determine how to apply their skills to jobs. Clients change how they view their abilities and the types of jobs they are capable of doing. Manitoba is increasingly using a form of this approach, Prior Learning Assessment and Recognition (PLAR), in post-secondary institutions, adult learning, and employment centres. This approach is also included in Indigenous education and training strategies, and as well as in some industries and regulatory bodiesFootnote 29 (Myers, et al., 2011).
The “transferable skills approach” (Myers, et al., 2011, p. 24) differentiates skills from specific jobs, and examines where else they may be applied. Service providers in Manitoba use this approach to help workers transition from one industry to another. It is also successful for Indigenous clients or immigrants, to identify how their existing skills correspond with labour market needs (Myers, et al., 2011).
Systemic barriers and other life factors can negatively affect job-readiness. More comprehensive assessment and counselling methods which recognize these issues can better assign the supports and accommodations that meets clients’ needs. This model has been implemented in Nova Scotia and Manitoba, and has empowered people with disabilities and Indigenous clients to find and retain meaningful employment (Myers, et al., 2011).
Flexible assessment approaches use a variety of tools (narrative assessment, self-assessment, a portfolio approach to transferable skills, and facilitated assessment – breaking up skills testing to smaller blocks of time) to evaluate clients’ needsFootnote 30. This approach benefits individuals with low literacy and low essential skills, or those who may have had negative experiences in the education system. In Manitoba, these approaches resulted in a 95% assessment process completion rate for long-term unemployed and social assistance recipients, who then transitioned to jobs or training in greater than expected rates (Myers, et al., 2011).
Employment services
Employment service providers from Nova Scotia, Manitoba and British Columbia identified five approaches for successful outcomes for career ds velopment programs. These include using a “multi-pronged approach” (Myers, et al., 2011, p. 26) to address the wide-ranging effects that contribute to joblessness; flexible program delivery customized to clients’ specific needs; client referrals based on need rather than eligibility requirements; partnerships to ensure program relevance of training programs; and human capital investment (Myers, et al., 2011).
To address the wide-ranging effects that contribute to joblessness, employment services providers from Nova Scotia, Manitoba and British Columbia advise taking a “multi-pronged approach” when counselling clients (Myers, et al., 2011). This necessitates having an in-depth understanding of all levels of the labour market (national, provincial and local), networks with employers, and knowledge of higher wage sectors. As well, counsellors with knowledge of local education and training systems can provide better options to clients, leading to better employment outcomes. This approach requires a strong emphasis on assessment and counselling, to help support and motivate clients, and help them navigate complex challenges. To succeed, this method requires other community factors to be in place, such as a strong economy, a variety of training options, and strong community-based resources and infrastructure: affordable housing, transportation, childcare, etc. (Myers, et al., 2011).
Career development programs are more effective when there is enough flexibility to customize to clients’ specific needs. While online options are effective for clients who are self-directed to build their own career development programs, these tools are not suitable for clients with complex barriers to employment, who require services that are more intensive. For this group, “change is often a gradual and progressive process,” (Myers, et al., 2011, p. 27). As an example, a former provincial program from BC provided long-term Income Assistance recipients with 10 months of intensive services, which emphasized life skills along with specific skill building. As well, this program built connections between clients and the community. An evaluation of this program showed that 53% of clients maintained employment for 4 years after the program, with an estimated $22 million return for the community (Myers, et al., 2011).
Partnerships with a variety of for-profit and not-for-profit organizations ensure the relevance of training programs and the success of projects for individuals with barriers to employmentFootnote 31. This type of collaboration is particularly effective for clients with complex barriers, or for projects in remote regions (Myers, et al., 2011).
Partnership models can take many different forms. With coordinated employment supports, employment centres provide regular career counselling, but community-based providers deliver pre-employment supports (resume writing, interview coaching, etc.). More intensive counselling, or “wrap-around support,” can be coordinated between various groups. As well, co-location of services, placing housing employment services and community supports closely together, created efficiencies and reduced stigma (Myers, et al., 2011).
Other progressive approaches include pooling financial resources for providers within a region. In Nova Scotia, the Community Coordinator Model provides an “envelope” of money to a designated Community Coordinator agency, which acts as a hub for other local employment support providers for specific regional training programs. Program availability and access are improved, as providers share resources, and plans and decisions are kept at the local level (Myers, et al., 2011).
Another promising model from Nova Scotia is the Collaborative Partnership Network. This formal network of non-profit organizations provides a continuum of employment services and employer connections for people with disabilities. Expertise and best practices are compiled to determine which tools are best suited for their clients. Member organizations work in regional clusters and coordinate projects themselves. The network moves funds to partners as required (Myers, et al., 2011).
The “investment focus” model (Myers, et al., 2011, p. 29) takes a human capital investment approach to improving client outcomes. Unlike traditional employment assistance approaches, clients are not fast-tracked to dead-end jobs (which results in cycling back to the system). This method, instead, provides clients with skills and experience in the knowledge economy to ensure long-term success (Myers, et al., 2011).
Skills Development, training and labour market transitions
Similar to the best practices identified for employment services, Skills Development and Training programs benefit from a wider range of integrated learning options tailored to the needs of adult learners. These options include more flexible delivery, scheduling, and training solutions that address specific needs and interests of adult learners. As well, recognition of credits from short-term training courses by formal education programs gives adult learners the possibility of developing their career goals incrementally while balancing work and family obligations (Myers, et al., 2011).
Service providers reported positive results with programs that integrated various types of training. An example is essential skills training given in conjunction with diploma courses or industry-specific courses. Programs that integrate workplace training into the curricula assist not only jobseekers, but employers and industries as wellFootnote 32. Other examples of successful training programs customized technical and essential skills projects with a work component, or occupational programs that combined high school credits and literacy benchmarks (Myers, et al., 2011).
Effective employment training programs are adapted to the realities of adult learners, who must prioritize between employment, family responsibilities, and education. Particularly for clients with low essential skills, learning options need to be concrete and relevant, with opportunities for occupation-specific training led by trained instructors with industry experience. The combination of work experience and education is key to the successful transition to employment. Clients need work experience in the occupation/industry where they are training, and workplace mentoringFootnote 33 and networking reinforces their training. The Construction Technology program from Red River College in Manitoba successfully adapted to adult learners by incorporating multiple entry and exit points in a Bachelor of Technology degree. Within the four-year program, there are an additional three exit points, as each additional year grants students a stand-alone, industry-recognized certificate or diploma (Myers, et al., 2011).
Many employment service and training providers took a “dual customer approach” (Myers, et al., 2011, p. 31), informally linked employers to service providers and other key institutions to identify and create employment opportunities. This network educated employers on available programs and supports that could increase their competitiveness, while enhancing the quality of employment opportunities for jobseekers. As an example, the Collaborative Partnerships Networks in Nova Scotia provided job coaching and retention supports for people with disabilities. A counsellor met regularly with the client, and visited the employer to discuss the worker’s needs. As retention supports are essential for the success of programs for specialized client groups, many service and training providers have expressed an interest in offering supports for employers who manage clients with diverse needs, and to existing clients who have found jobsFootnote 34 (Myers, et al., 2011).
3.2.5 Conclusion
Provinces and territories in Canada are in line with international trends of service delivery methods for employment programs. Close to two-thirds of provinces and territories deliver programs through a mix of government services and outsourcing to contract providers. An internal review of international practices suggest an evolution towards mixed delivery models that allow governments to maintain accountability, oversight, and monitoring, while labour market programs benefit from competition, efficiencies and innovations from the private sector.
From the interviews and consultations commissioned by the Forum of Labour Market Ministers Career Development Services Working Group, the recommendations and best practices from Nova Scotia, Manitoba and British Columbia inform the continual evolution of program and policy design for delivery of EBSMs. Service providers indicated that comprehensive approaches to client assessment are needed to better determine job-readiness. These approaches recognize issues around systematic barriers and other life-factors, and better assign supports and accommodations that meet clients’ needs. As well, service providers identified approaches for successful outcomes for career development programs, skills development and individuals’ transitions into the labour market. One highlighted method included the “dual customer approach.” This method informally linked employers to service providers and other key institutions to identify and create employment opportunities. This network educated employers on available programs and supports that could increase their competitiveness, while enhancing the quality of employment opportunities for jobseekers.
Canada is not unique in facing labour and skills shortages created by rapid changes in industries and sectors, as well as by an aging population. To help offset the consequences of a possible future economic downturn and remain competitive, there is a need for more workers to capitalize on new opportunities in emerging job markets. In that context, innovative, flexible and comprehensive approaches to service delivery of active employment programs will help sustain long-term economic growth.
3.2.6 Definitions
Contracting out (competitive tendering): “Opening up to competition a set of economic activities which were previously immune from it. The distinctive feature of contracting out is the element of ex-ante competition—competition for the market as opposed to competition in it” (Domberger, S. and Jensen, P., 1997).
Creaming: Priority given to job seekers who are considered work-ready. As these clients require fewer supports, are cheaper to manage, and are employed quicker, they will release outcome payments faster to the provider. This creates a problem in the long-run where clients who require more resources to return to the labour force are ignored. This results in job seekers either spending more time on, or exhausting, government support payments (Carter, E. and Whitworth, A., 2015).
Insourcing: contracting back in previously contracted services (Warner and Hefetz, 2012).
Natural monopoly: “A natural monopoly is a type of monopoly that exists due to the high fixed or start-up costs of conducting a business in a specific industry. Additionally, natural monopolies can arise in industries that require unique raw materials, technology or similar factors to operate. Since it is economically sensible to have some monopolies like these, governments allow them to exist, but provide regulation, ensuring consumers get a fair deal. Since natural monopolies use an industry's limited resources efficiently to offer the lowest unit price to consumers, it is advantageous in many situations to have a natural monopoly. In fact, a successful natural monopoly, such as a railroad company, becomes so efficient it is actually in a government's best interest to help it flourish. Further, often an industry cannot support two or more major players, and a highly competitive market with unique resources and a high-cost structure is unsustainable” (Kenton, W., 2018).
Parking: Describes behaviour when providers deliberately neglect clients with multiple barriers and fail to supply resources, time or energy. These clients are considered “unlikely to move into paid work and/or require considerable, expensive supports” (Carter, E. and Whitworth, A., 2015).
Privatization: “Transfer of ownership of physical assets from public to private ownership” (Domberger, S. and Jensen, P., 1997).
3.2.7 References
Adams, J., Chow, K., & Rose, D. (2018, October 31). Assessing Active Labour-Market Programs: How Effective Is Ontario Works? SSRN Electronic Journal, 1-12. doi:10.2139/ssrn.3276081
Australia, Job Services Australia. (2018, September 3). Job Services Australia Star Ratings Methodology from July 2012 to June 2015. Retrieved September 5, 2018, from https://www.jobs.gov.au/job-services-australia-provider-performance-star-ratings
Canada, Province of British Columbia, BC Centre for Employment Excellence. (2014). Accessible Services for Specialized Populations in One-Stop Employment Models: Learning from Other Jurisdictions (pp. 56-57). Vancouver, BC: BC Centre for Employment Excellence. Retrieved May 31, 2018, from http://www.cfeebc.org/news_item/accessible-services-specialized-populations-one-stop-employment-models-learning-jurisdictions/
Carter, E., & Whitworth, A. (2015). Creaming and Parking in Quasi-Marketised Welfare-to-Work Schemes: Designed Out Of or Designed In to the UK Work Programme?. Journal of social policy, 44(2), 277-296. Retrieved from https://www.ncbi.nlm.nih.gov/pmc/articles/PMC4413869/
Domberger, S., & Jensen, P. (1997). Contracting out by the public sector: Theory, evidence, prospects. Oxford Review of Economic Policy, 13(4), 67-78. doi:10.1093/oxrep/13.4.67
Employment and Social Development Canada, Social Research Division, Strategic & Service Policy Branch (2016). Work Integration Social Enterprises (WISE): a ‘Meta-Innovation system’ Skills Link 2016 Social Innovation Stream.
The Canadian CED Network (2014). Success Themes in Supportive Employment: How Social Enterprise Connects People with Jobs & Jobs with People. Retrieved from https://ccednet-rcdec.ca/en/toolbox/success-themes-supportive-employment-how-social-enterprise-0
Finn, D. (2011). Job Services Australia: design and implementation lessons for the British context. Department for Work and Pensions, Research Report No 752, Government of the United Kingdom. ISBN: 978 1 84712 986 4. Retrieved from http://research.dwp.gov.uk/asd/asd5/rrs-index.asp.
Flemming, J., and Oppenheimer, P. (1996), ‘Are Government Spending and Taxes Too High (or Too Low)?’ National Institute Economic Review, July, 58–76.
Industry Commission (1996), Competitive Tendering and Contracting by Public Sector Agencies, Report No. 48, January, Melbourne, Australian Government Publishing Service.
Kenton, W. (2018, December 13). Natural Monopoly. Retrieved January 4, 2019, from https://www.investopedia.com/terms/n/natural_monopoly.asp
Myers, K., Smith-Fowler, H., Leonard, D., Conte, N., and Gyarmati, D. (2011). Employment Assistance Services and Skills Development Programs: Gaps, Innovations, and Opportunities. Social Research and Demonstration Corporation (SRDC), Human Resources and Skills Development Canada Policy Research Directorate (PRD). Retrieved from https://www.google.com/url?sa=t&rct=j&q=&esrc=s&source=web&cd=2&ved=2ahUKEwiNtpaM8crgAhVMYK0KHdg_AVEQFjABegQIBBAC&url=http%3A%2F%2Fwww.srdc.org%2Fuploads%2Fcds_report_en.pdf&usg=AOvVaw2j3ma2VuLdUUEajsUCN-TW
Porcher, S. (2016). Neither Market Nor Hierarchy: Concurrent Sourcing in Water Public Services. Journal of Public Administration Research and Theory, 26(4), 800-812. doi:10.1093/jopart/muw037
Shahmash, S. (2010). ‘Social Enterprises: Creating Jobs and Community Wellness One Small Business at a Time’, ISIS Research Centre, Sauder School of Business, UBC. Source: https://www.sauder.ubc.ca/Search_Results.aspx?cx=000498844487840236444:zgpzs-kcrna&cof=FORID3A11&ie=UTF-8&q=Social20Enterprises:20Creating20Jobs20and20Community20Wellness20One20Small20Business20at20a20Time
Social Research and Demonstration Corporation. (2016, September). Federal-Provincial/Territorial Consultations on the Labour Market Transfer Agreements – What We Heard Summary Report. Retrieved February 21, 2019, from http://www.srdc.org/media/199961/final-lmta-consultation-summary-report-en.pdf
Social Research and Demonstration Corporation. (2017, October). Pay for Success Final Report. Retrieved February 21, 2019, from http://www.srdc.org/publications/Pay-for-Success-Final-Report-details.aspx
Warner, M. E., & Hefetz, A. (2012). Insourcing and Outsourcing. Journal Of The American Planning Association, 78(3), 313-327. doi:10.1080/01944363.2012.715552
4. Pan-Canadian activities and the National Employment Service
This section analyzes pan-Canadian activities that ESDC supports and delivers using EI Part II funds.
4.1 Context
The Government of Canada plays a leadership role in EI Part II by establishing objectives with provinces and territories through the LMDAs that develop active labour market policies and ensure accountability and evaluation of LMDA programming. In addition, the federal government plays a primary role in responding to challenges that extend beyond local and regional labour markets by delivering pan-Canadian activities.
Pan-Canadian activities fulfill three primary objectives:
- Promoting an efficient and integrated national labour market, while preserving and enhancing the Canadian economic union;
- Helping to address common labour market challenges and priorities of international or national scope that transcend provincial and territorial borders; and
- Promoting equal opportunity for all Canadians, with emphasis on helping underrepresented groups reach their full potential, in the Canadian labour market.
Pan-Canadian funding is focused on three streams of investment:
- Indigenous Programming;
- Enhancing Investments in Workplace Skills and Labour Market Information; and
- Supporting Agreements with Provinces, Territories and Indigenous Organizations.
In FY1718, expenditures on pan-Canadian activities totalled $120.2 million, up 5.4% from FY1617. Pan-Canadian programming delivered through the Aboriginal Skills and Employment Training Strategy (ASETS) increased by 8.5% to $100.9 million, while expenditures on Labour Market Partnerships (LMP) ($13.9 million) and Research and Innovation (R&I) ($5.4 million) declined year-over-year by 7.3% and 10.5%, respectively.
4.2 Indigenous programmingFootnote 35
Pan-Canadian funding is delivered through ASETS and its objective is to improve Indigenous people’s participation in the Canadian workforce, ensuring that First Nations, Inuit and Métis have the skills and training for sustainable, meaningful employment. It also supports the development of a skilled Indigenous labour force, which is one of the objectives of the Federal Framework for Aboriginal Economic Development.
Pan-Canadian programming in action: Kativik Regional Government
The Kativik Regional Government (KRG) helps Indigenous people prepare for, acquire and maintain successful employment by providing demand-driven education, training and employment opportunities through partnerships with community, educational institutions, business/industry and government. KRG works with public and private partners in different priority economic sectors such as but not limited to: construction, information and technology, childcare services, community services, health and social services and tourism.
KRG provides a full range of employment and training services and programs to residents of the Kativik region including:
- pre-employment training;
- life and work skills;
- academic background training for employment;
- specific training for a job;
- information and employment services in each community;
- encouraging youth to stay in or return to school;
- entrepreneurial skills training; and
- youth and persons with disabilities programs.
In FY1718, KRG’s success rate was 79%. Among the 1,997 clients served, 969 obtained a job and 606 returned to school. Since the launch of ASETS, KRG has served over 16,000 clients, of which 7,816 obtained a job and more than 5,279 returned to school.
ASETS was introduced in 2010 and is funded at $292 million annually, including $94.2 million from EI Part II funds. The program was extended to March 31, 2019, ensuring a one-year transition to support the implementation of the new program to begin on April 1, 2019. The new ISET Program will include four distinct labour market strategies with separate funding envelopes for each group: First Nations, Inuit, Métis and Urban/Non-affiliated. With Indigenous partners, the Government is advancing reconciliation by creating more job training opportunities for Indigenous people. ASETS funds a network of 85 Indigenous service delivery organizations (agreement holders), with over 600 points of service across Canada. This network assists Indigenous people to prepare for, find, and retain high-demand jobs. This network of Indigenous organizations designs and delivers labour market programming to meet needs identified in their communities, in large part by working with employers and Indigenous individuals to ensure skills development and job training adequately respond to local labour demand.
ASETS funds Indigenous service delivery organizations to focus on demand-driven skills development, and fostering partnerships with other Indigenous service delivery organizations, provinces and territories and the private sector. ASETS emphasizes increased accountability and improved results for its related activities. Through ASETS funding, Indigenous youth are helped to make a successful transition from school to work or to return to school.
In FY1718, ASETS served 51,272 clients, including 19,747 EI clients. Out of the total number of clients served, 20,374 found a job, including 9,553 EI clients, and a total of 10,158 clients served returned to school.
4.3 Enhancing investments in workplace skills and labour market information
This investment stream helps the federal government ensure that Canada’s labour market functions as an integrated national system by:
- Removing barriers and impediments to labour mobility;
- Building capacity among workplace partners to improve skills development as a key factor in increasing productivity;
- Leveraging investment in, and ownership of, skills issues, especially in addressing skills and labour shortages; as well as
- Supporting efforts to ensure Canada’s learning system responds to employers’ skills requirements.
Sectoral Initiatives Program (SIP)
Launched in April 2013, the Sectoral Initiatives Program (SIP) aims at addressing current and future skills shortages, by supporting the development and dissemination of sector-specific labour market intelligence, national occupational standards (NOS) and skills certification and/or accreditation systems. The SIP is the department’s primary, demand-focused program instrument for producing complementary, relevant and timely sectoral labour market intelligence to help employers, unions, job seekers, students, workers and educational institutions respond to labour market conditions, and to be proactive in preventing as well as addressing skills shortages so that Canadians fill available jobs.
SIP supports an efficient, inclusive labour market, where supply and demand is balanced, and Canadians have access to information, skills training and employment opportunities. More specifically, demand-driven labour market intelligence equips Canadians to access job opportunities by providing them with access to industry-specific information, including occupational and skills requirements, employment, as well as career development opportunities. SIP-supported sectoral intelligence is also critical in helping ensure that Canadian workers get good quality jobs through better alignment of post-secondary education and training offerings, with employer needs.
Some SIP projects are funded through the LMP Support Measure of EI Part II. These enable contribution recipients to document much in-demand labour market supply and demand data, allowing key industry sectors in Canada to address their needs for workforce development.
As SIP partners are representative organizations, including employer and employee organizations, training institutions and various levels of government, there is significant investment (e.g. cash and in-kind contributions from employers) and buy-in from key stakeholders into whole-industry solutions that help prevent skills shortages and mismatches, and enable employers to adopt better workforce development strategies. As such, demand-driven labour market intelligence serves as a preventive tool to unemployment or under-employment, as it communicates real workforce needs to current and future employees.
Accordingly, SIP is uniquely positioned to provide a cohesive, comprehensive and consensual employer perspective on labour market and skills issues, and constitutes an essential part of the pan-Canadian framework for labour market information.
SIP-funded products in FY1617
"MiHR has emerged as a thought leader on mining LMI and has been leading the conversations around hiring challenges in Canada’s mining industry. MiHR’s research reports have helped to formulate policy initiatives around training and educational needs. During the last fiscal period, the British Columbia Mining Labour Market report has helped the provincial government (Ministry of Jobs, Tourism and Skills Training), and industry associations (Mining Association of British Columbia and the Association of Mineral Exploration) to identify the key challenges in the mining sector so that a long-term training strategy can be developed.”—MiHR
“The existence of the NOS is critical to ECO Canada… as it allows us to focus on the employment sector of interest to us. The NOS are a unique avenue to students and job seekers to gain insight into how to equip themselves for future jobs and careers. The NOS provide a window to project ahead and allow the workers and future workers to prepare. Finally, with the growing interest in environmental education at the post-secondary level, the NOS give program developers a starting point to develop course materials.”—ECO Canada
“The Environmental Careers Organization of Canada (ECO Canada)’s Recognizing Environmental Expertise: Professional Certification and Program Accreditation was released in 2016-17. This led to the creation of an Honours Bachelor of Arts and Science in Environmental Sustainability program at Lakehead University.”
In FY1718, the SIP was funding 33 multi-year agreements for projects related to the development and dissemination of labour market intelligence, NOS and certification and/or accreditation programs in high-demand sectors. These agreements were being implemented with various stakeholders representing different industry sectors, for the development of the following products: labour market information and/or forecasting systems (79%); NOS (12%); and certification and accreditation (9% combined). Among them, in FY1718, the SIP was funding several cross-sectoral projects, as well as projects for the construction, environment, tourism, mining, transportation, oil and gas, manufacturing, agriculture, aerospace and information technology sectors. The dialogue box above provides an example of products that were developed and disseminated using SIP funding in FY1617.
While FY1718 survey data are not yet available, in FY1617, a total of 205 labour market research reports and seven forecasting systems were developed or updated, and released through SIP agreements, in sectors such as agriculture, construction, information and communications technology, forestry, manufacturing, oil and gas, and mining. Twenty-eight (28) NOS were created or updated, and the SIP contributed to the development or the update of 15 certification programs, as well as two accreditation programs, that were completed and made available in FY1617. Some of the projects had not yet achieved their ultimate objectives as they are multi-year projects.
According to program survey data on FY1617 product users, 42% of respondents reported more than 239,802 users of SIP products. However, some recipients reported only users to whom they directly distributed LMI products, and they did not report referrals to others or use of the products by members of other organizations. Thus, the number of users is likely underestimated.
Furthermore, in FY1617, the program recipients succeeded in leveraging $7.75 million or about 43% of program expenditures from the private sector and other stakeholders.
As for work completed toward SIP priorities:
- SIP continued to develop expertise on strategic sectors experiencing labour market tightness.
- SIP continued to engage industry on emerging skills gaps, to share information and serve as a platform for Government-Industry/Employer Collaboration.
- SIP launched a call for proposals, assessed, and recommended various proposals, which began late in FY1718 or early in FY1819.
- SIP contributed to the launched of the Canada-Alberta Labour Market Pilot Project (e.g., in collaboration with the Province of Alberta), which sunsets in March 2020, to help employers address skills shortages and access available talent.
- SIP continued to collaborate with funding recipients to improve stakeholder awareness and use of SIP funded products, and to increase the integration of the sectoral labour market intelligence into programs and activities.
- SIP adjusted its data collection survey, collected and validated data on available outputs and outcomes from FY1617, and responded to the early observations of the program evaluation by establishing a management action plan to increase dissemination of products and further streamline performance measurement while increasing data validity.
National Essential Skills Initiative
The National Essential Skills Initiative (NESI) helps Canadians improve their essential skills so that they can better prepare for, get and keep a job, as well as adapt and succeed at work. This is aligned with the Government of Canada’s overarching goal of helping Canadians develop the skills they need for good quality jobs.
NESI provides catalytic funding for projects that develop and expand literacy and essential skills training. Projects funded focused on replicating and scaling up proven approaches to skills upgrading, as well as improving the quality of employment and training supports that are responsive to job seekers’, workers’ and employers’ needs. Particular emphasis is placed on supporting individuals with low skills and facing multiple barriers to employment such as Indigenous people, newcomers, youth, and official language minority communities (OLMCs).
In FY1415, the program was reoriented to focus efforts on the integration of literacy and essential skills into employment and training supports. Accordingly, the Office of Literacy and Essential Skills continues to work closely with other government departments and agencies, provincial and territorial governments and other key stakeholders, such as post-secondary institutions, employers and labour organizations to provide broader public access to quality employment training.
The program reorientation led to an open call for proposals to solicit projects that develop, test and evaluate innovative training models that can be replicated and/or scaled-up through large-scale federal-provincial/territorial programs. Projects began in Fall 2017 and NESI funds are planned to be fully spent.
Moving forward, funding provided under NESI continues to support the integration of essential skills into employment programs such as ASETS, the Skills and Partnership Fund, the Youth Employment Strategy, the Opportunities Fund for Persons with Disabilities and the labour market transfer agreements. The program will also continue to pilot Social Finance initiatives such as pay for performance and social impact bonds to find innovative ways to improve essential skills programming for Canadians.
Skilled trades and apprenticeship and Red Seal Program
Apprenticeships are essential to building a highly skilled trades workforce that supports Canadian competitiveness. The Interprovincial Standards Red Seal Program sets common standards for assessing the skills of tradespeople across Canada and provides a vehicle to promote harmonization across the country.
2017 Red Seal Program fast facts
- More than 26,000 Red Seal endorsements were issued to apprenticeship completers and trade qualifiers.
- Top five Red Seal trades by number of endorsements issued include: Construction Electrician, Automotive Service Technician, Welder, Truck and Transport Mechanic, and Plumber.
- More than 200 subject matter experts have participated in ESDC organized workshops to develop Red Seal products.
- Approximately 200 industry representatives and training providers have participated in national webinars to harmonize apprenticeship training.
- 43,766 Red Seal examinations were written.
- The Red Seal Program’s website counted approximately 418,000 visitors.
- Source: Canadian Council of Directors of Apprenticeship, Red Seal Program administrative data 2017. Statistics are compiled on a calendar year basis.
The Program is well established at developing common interprovincial standards used to harmonize apprenticeship training in provinces and territories, to provide the public with up-to-date descriptions of trades in Canada, and to serve as the basis for assessment. Under this Program, experienced tradespeople and apprentices who have completed their training may take the interprovincial Red Seal examination. If successful, they receive a Red Seal endorsement on their provincial or territorial certificate of qualification, indicating they have met both the provincial/territorial requirements and have demonstrated the knowledge required for the national standard in that trade. In most provinces and territories, the Red Seal examination has been adopted as the final examination for certification for Red Seal trades.
The Red Seal endorsement is a nationally recognized standard for skilled trades workers in Canada. In 2017, 43,766 Red Seal examinations were written by completing apprentices and experienced tradespeople from across Canada and over 26,000 Red Seals were issued.
The Canadian Council of Directors of Apprenticeship (CCDA) is responsible for the Red Seal Program. All provinces and territories and the federal government participate as members of the CCDA. ESDC sponsors a Red Seal Secretariat to provide strategic and secretariat support to the CCDA and the Red Seal Program.
The Red Seal Program currently covers 56 skilled trades, encompassing 78% of registered apprentices.Footnote 36 ESDC works closely with industry experts and apprenticeship authorities to coordinate the development of high-quality Red Seal products, including occupational standards and interprovincial examinations. These products are updated regularly to reflect evolving labour market needs. Because each province and territory needs standards and examinations to certify thousands of apprentices and experienced tradespersons each year, the collaboration involved in developing interprovincial Red Seal standards and examinations results in significant economies of scale for governments.
The core of the Red Seal Program lies in quality interprovincial standards for industry, against which tradespeople can be trained and assessed. With ESDC support, the CCDA collaborates to build these standards with industry from across Canada. The Program also encourages the harmonization of apprenticeship training outcomes through common standards, which provinces and territories use to develop their respective in-school portion of apprenticeship training.
The Red Seal Program continuously evolves to reflect the needs of the Canadian labour market and Government of Canada priorities. In recent years, the NOS and its associated development process have undergone significant enhancements. Where appropriate, the standards are now being developed as Red Seal Occupational Standards (RSOS), with broader input from stakeholders (including tradespeople, instructors and employers) and include industry-defined performance expectations, evidence of skills attainment, learning objectives and outcomes, as well as essential skills to encourage greater harmonized training and certification across the country. The RSOS has the capacity to generate several products that are geared to users’ needs such as assessment, training and career information.
Because of the additional stakeholder engagement and enhanced content, fewer trades undergo a complete revision of their standards each year. However, the ability to make revisions and corrections based on input is also possible between cycles. In FY1718, six new occupational standards were completed. In this period, there were 27 Red Seal examinations released for nine trades.
To further reduce barriers to certification in the skilled trades in Canada and increase opportunities for apprentices, the Government of Canada continues to work closely with provinces and territories and industry through the CCDA to facilitate the harmonization of apprenticeship training requirements in targeted Red Seal trades. Harmonization will facilitate greater labour mobility across the country and help more apprentices complete their training. In October 2016, the Forum of Labour Market Ministers (FLMM) reaffirmed its commitment to harmonize 30 Red Seal trades by 2020 in most jurisdictions, with an effort to harmonize training for two-thirds of Red Seal apprentices by 2017 (outside of QuebecFootnote 37)Footnote 38Footnote 39.
As of September 2017, implementation for harmonization was completed or underway for 22 trades covering Phases one through three. Industry consultations also took place for Phase four and five trades. The CCDA is ahead of schedule in achieving the FLMM goal of harmonizing apprenticeship training in most jurisdictions for 30 Red Seal trades representing 90% of apprentices by 2020.
The effectiveness of achieving consensus between industry stakeholders on harmonized training across Canada has been greatly enhanced by aligning the process with the development of the RSOS. Since the standards development process brings together the same key stakeholders that are involved in apprenticeship training development, they are able to share best practices, and provide a rationale for creating the best possible training for apprentices across Canada. This aligned process also ensures long-term sustainability of harmonized training, while keeping training content as up-to-date as the standard.
With ESDC’s support, CCDA representatives meet annually with national apprenticeship stakeholder groups to provide updates and seek input on key initiatives. At the CCDA’s 2017 meeting, approximately 35 national stakeholders confirmed their support for the work underway on the CCDA’s strategic priorities such as continuing progress on harmonization.
ESDC also continues to work with provinces and territories to increase employer engagement in apprenticeship. In October 2016, the FLMM agreed to explore innovative approaches to increase employer engagement for improved job opportunities and outcomes for apprentices. ESDC has provided funding to support employer consortia pilot projects in four provinces (British Columbia, Manitoba, Nova Scotia and Ontario).
Flexibility and innovation in apprenticeship technical training
The Government of Canada also invested to expand the use of innovative approaches for apprentice technical training through the Flexibility and Innovation in Apprenticeship Technical Training (FIATT) Pilot. The Pilot consisted of ten training institutions located across Canada that tested alternative delivery approaches to apprenticeship technical training such as e-learning, blended learning, in-class simulation and technical learning in workplaces and other locations apart from the traditional classroom. The Pilot gathered evidence on whether these projects can improve access to apprenticeship training, raise the level of employer engagement in apprenticeship training, improve apprenticeship completion rates and increase the overall efficiency of apprenticeship training systems. A final report that will include Pilot findings and recommendations for alternate delivery will be shared with apprenticeship stakeholders and policymakers. The Pilot will end in FY1819.
Research Project “The Registered Apprenticeship Information System (RAIS)”
The Registered Apprenticeship Information System (RAIS) is an annual mandatory survey conducted by Statistics Canada. The survey compiles data from provinces and territories on the number of registered apprentices taking in-class and on-the-job training in trades that are either Red Seal or non-Red Seal.
The latest 2016 RAIS results showed that there were 333,750 continuing apprentices, 78% of which were in Red Seal trades. There were 71,994 new registrations, 78% of which were in Red Seal trades. There were 39,477 apprenticeship completions, 80% of which were in Red Seal trades.
Beginning in 2016, Statistics Canada and ESDC undertook a review of the wording, data elements, and documentation of the RAIS to strengthen and improve data consistency across jurisdictions and enhance the reliability of its data. Results and recommendations informing an action plan were completed in March 2017. Statistics Canada and ESDC are currently working with jurisdictions to finalize an implementation strategy.
ESDC and Statistics Canada successfully completed the RAIS Longitudinal Pilot project in March 2017. The purpose of the study was to explore the potential of linking RAIS data with other data sources (e.g. taxation). The pilot involved Alberta, New Brunswick and Nova Scotia, and was designed to produce statistics on apprenticeship pathways, earnings, and mobility. The project has since been expanded to all jurisdictions.
The RAIS is part of the new Education and Labour Market Longitudinal Platform (ELMLP), announced in Budget 2018 with an investment of $5.5 million per year ongoing starting in FY1819. The Platform will provide up-to-date labour market information Canadians need to make informed career decisions. The core foundation systems linked to the Platform are the RAIS, the Post-Secondary Information System, and Canada Revenue Agency’s T1 Family File.
National Apprenticeship Survey (NAS)
The National Apprenticeship Survey (NAS), conducted by Statistics Canada on behalf of ESDC, is Canada’s most comprehensive source of data on the experience of apprenticeship, collected from apprentices.
Funded by ESDC with an investment of $6.8 million, the 2015 NAS Canada Overview Report was released in March 2017. The survey presents an overall positive picture of apprenticeship. For example, apprentices who complete their programs have better outcomes – they are more likely to be employed, to hold a permanent job, and to have higher earnings. About nine in ten apprentices see apprenticeship as the best way to learn a trade. Approximately 60% of apprentices were aware of the Apprenticeship Grants, and more than half of apprentices applied for EI benefits while on technical training.
In October 2018, ESDC released more focused reports from the 2015 NAS data: “Profile of Indigenous, Women, and Immigrant Apprentices” and “Analysis of Financial Supports available to Canadian apprentices.”
National Occupational Classification (NOC)
The National Occupational Classification (NOC) provides a standard taxonomy for dialogue on the world of work and a national Canadian framework for collecting, analyzing and disseminating occupational data for Labour Market Information (LMI) and employment-related program administration. It describes job titles, functions, tasks and duties, employment requirements, responsibilities and qualifications.
The NOC is updated on a regular basis, to reflect changes in Canadian workplaces and occupational dynamics. Minor updates, on job titles, job descriptions and main duties for instance, take place on an annual basis, while structural changes, such as creating or removing an occupation, occur every ten years. The current version was released in December 2017 and updated minor information associated with job titles.
Research is also underway for the next structural revision of the NOC, which will be published in 2021. The current version of the NOC gathers more than 35,000 job titles into 500 Unit Groups (groups of occupations that have similar main duties, employment requirements, skill levels and skill types).
Labour market surveys, research, analysis and reports are usually based on the NOC. Employment-based programming, such as EI, the Temporary Foreign Worker Program, as well as programming for the integration of injured workers and persons with disabilities, relies on the NOC to analyze labour market conditions for strategic considerations, policy development, program design and service delivery.
The NOC enables job seekers to connect with employers seeking workers, students to make informed educational and career choices and governments and other organizations to design and deliver programming in support of an efficient labour market.
Official Language Minority Communities Signature Projects
Launched in 2005, the Enabling Fund for Official Language Minority Communities (OLMCs) represents a sustained effort to enable community-wide economic development and to grow the economic advantages of linguistic duality. The Enabling Fund is an important part of a broad horizontal Government of Canada strategy for linguistic duality, as described in the Roadmap for Canada’s Official Languages 2013-2018: Education, Immigration, Communities.Footnote 40
Signature Projects are aligned with the ESDC vision “to build a stronger and more competitive Canada, to support Canadians in making choices that help them live productive and rewarding lives, and to improve Canadians’ quality of life.” They also enable a number of partnering federal departments, agencies and external stakeholders (e.g. employers, learning institutions) to provide a coordinated response to existing and emerging OLMCs economic development issues and opportunities.
Specifically, Signature Projects:
- Expand on an existing well-established project (e.g. best practices) or bridge a gap between existing projects;
- Have national, regional or multi-regional scope and/or impact;
- Support the development and/or deepening of co-operation and partnership across sectors;
- Help identify and test better ways of helping persons prepare for, return to or keep employment and be productive participants in the labour force;
- Have significant learning implications for multiple stakeholders;
- Respond to a demonstrated priority or are a solution to a problem identified by communities that is not being addressed through normal programming; and
- Support an OLMC thematic/sectoral priority area (e.g. sector studies).
The Government of Canada has prioritized a number of mechanisms to overcome mismatches between skills supply and demand, while reducing unemployment by using national levers to support labour mobility (e.g. Labour Market Information). For OLMCs, however, the migration of skilled people out of their communities can negatively impact their overall competitiveness and exacerbate challenges in attracting new opportunities and strengthening their community’s vitality. Signature Projects help implement commitments made by the Government of Canada as they relate to Canada’s linguistic duality, and help the department develop meaningful collaborative relationships, while engaging in dialogue and active outreach with new partners in the implementation of Signature Projects.
Signature Projects also provide ESDC with a clear response to the 2014 House of Commons Standing Committee on Official Languages study on the economic situation of Canada’s OLMCs. The study underscored the importance of planning and leadership for OLMC economic development and recommended that ESDC, in collaboration with Innovation, Science and Economic Development (ISED), work to better align their programming. ISED and the Regional Development Agencies are key partners in the Economic Action Network (EAN), the governance structure of Signature Projects, for OLMCs.
The EAN is a cross governmental and multi-stakeholder platform that oversees the coordination, design, monitoring and assessment of projects. The delivery of Signature Projects is undertaken by well-established OLMC economic and human resources development organizations across the country (including the Réseau de développement économique et d’employabilité (RDÉE Canada), in collaboration with 12 Francophone provincial and territorial organizations outside Quebec, as well as the Community Economic Development and Employability Corporation (CEDEC) for the English-speaking minority in Quebec).
ESDC investments, funded through the Research and Innovation Support Measure of EI Part II, contribute to advancing priority areas as identified in the 2015-2020 Canadian Plan for Economic Development (CPED) of Official Language Minority Communities, including the development of sectoral studies, pursuing synergies, developing tools and supports for employers in addition to collaboratively resolving concrete challenges and problems in communities. The funding provides opportunities for government, private sector, OLMCs, as well as other stakeholders, to collaborate on economic development and employment priorities, an important determinant for the vitality of OLMCs.
Signature Projects were community-driven initiatives built on existing good practices and designed to test innovative approaches with the potential for scaling-up in OLMCs across the country (e.g. from local to multi-regional).
In FY1718, Signatures Projects focused on:
- Supporting OLMCs across the country by providing youth and women with a series of opportunities within their communities to develop employability and entrepreneurial skills; and
- Strengthening communities by attracting new or returning OLMC members.
In addition to responding to objectives of OLMCs, Signature Projects were designed to:
- Test innovative collaborative approaches; and
- Generate lessons on outcomes related to the scalability of those projects which, once tested, can be integrated to activities delivered through the Enabling Fund program.
In FY1718, a total of four projects received support through pan-Canadian funds. All supported government priorities related to enhancing engagement and innovation in improving skills and training, contributing to opportunities for Canadians in addition to the vitality of OLMCs.
The following describes examples of Signature Projects that were implemented in FY1718 and how they aligned with Government of Canada priorities:
- Address the successful transfer of businesses by increasing understanding of the value of a robust business transfer strategy and providing the skills and tools so that young entrepreneurs can build and maintain one;
- Promote women in non-traditional trades where skilled labour is in demand by highlighting eight women who have entered non-traditional trades with success through the creation of promotional products and videos;
- Support youth entrepreneurship in OLMCs by offering skills development and guidance with practical hands-on experience in backing their entrepreneurial ideas or business project, in collaboration with the Association of World Trade Centre Winnipeg, the Fédération de la jeunesse canadienne-française, the Association des collèges et universités de la francophonie canadienne (ACUFC) and the Réseau de développement économique et d'employabilité du Canada.
- Develop a multi-year strategy to recruit international francophone/bilingual students, support them and eventually retain them in OLMCs once they have completed their studies. The strategy could include support to enter the labour market in their field of studies, and help with immigration processes.
These projects met objectives related to the advancement of new partnerships, leveraging of resources, as well as expertise and delivery of practical initiatives in communities. Initiatives have supported OLMCs job seekers, businesses and communities. The projects contributed to enhancing OLMCs capacity and expand client reach in addition to visibility of services. Moreover, this led to the sharing of best practices across the country, which had benefited other jurisdictions. Given the positive impacts, a number of the small-scale tested projects are now being replicated in other regions and lessons learned are being applied. There is significant demand and interest from community stakeholders to expand this initiative.
Work Integration Social Enterprises research
The Work Integration Social Enterprises (WISE) research program comprises a five-year longitudinal study, composed of six main projects to measure the impact of social enterprises on labour market outcomes for vulnerable populations, including persons with disabilities, youth, recent immigrants, homeless or individuals at-risk of homelessness and Indigenous people. Social enterprises focus on improving employment prospects for those who are further from the labour market through work-based opportunities. Together, this series of research projects will help determine:
- The effectiveness of WISE in promoting the social and labour market integration of vulnerable individuals;
- Optimal WISE models and type of training programs; as well as
- The return on investment for government.
These six research projects recommended for funding include one project based on a quasi-experimental design and five projects based on multi-sites case studies. The projects are located in Ontario (four projects), Quebec (one project) and British Columbia (one project). These research projects will survey over 60 social enterprises to measure their effectiveness at integrating approximately 670 participants. The research focuses on different at risk groups, WISE modes of labour market integration and training programs. Some of these projects build on previous case study research. Almost all projects include cost benefit analysis and/or Social Return on Investment (SROI) of their WISE interventions.
ESDC has been monitoring the implementation and progress of all six research projects funded under the R&I Support Measure of EI Part II.
Contingent on continued funding, the WISE research projects will recruit additional participants during the subsequent fiscal year and monitor the experience of these WISE participants for three full years. Interim research reports, as well as an annual webinar, will occur in each upcoming fiscal year and final research reports are expected in March 31, 2022.
ESDC is also exploring, through a feasibility study, the creation of an interactive outcomes database which will include, among others, the results of this series as well as various relevant best practices. The database program will work directly with the six WISE research projects to gather data on participants’ immediate and longer-term labour market and relevant social outcomes, characteristics of the participants themselves, the social enterprises involved and the nature of the interventions. Data collection will be done in accordance with the Government of Canada's privacy protection policies and legal requirements.
To complement the longitudinal WISE research program, ESDC is developing an internal research agenda focused on the analysis of its Grants and Contributions database to estimate how many of these social enterprises are being funded via ESDC’s programs. ESDC will also explore the feasibility of using its program administration data to estimate the relative short-term effectiveness of WISE in promoting the labour market integration of vulnerable individuals, compared to the effects achieved by other types of interventions. ESDC is also developing a geo-mapping pilot to visualize the size, scope, nature and social impact of the WISE sector in Canada.
This five-year research program will provide valuable evidence to support the achievement of Government of Canada and ESDC objectives to create a skilled, adaptable and inclusive workforce, as well as an efficient labour market. This evidence will guide policy and program funding decisions for Government of Canada investments in these areas. These objectives are partially facilitated through the emphasis on the collaboration with the not-for-profit sector and private business on the implementation of innovative ideas, social partnerships and social finance approaches. As such, the approach undertaken for the research program itself is an example of this type of collaboration.
This research strategy directly aligns with the Government’s Social Innovation and Social Finance Strategy. It also aligns with long-standing initiatives by various governments to support social enterprise as a key business model. Social enterprises are primary examples of community organizations developing innovative solutions for our society’s most difficult problems, as well as adopting new sources of revenue and financing to become more sustainable and achieve greater impact. Thus, social enterprises can help stimulate inclusive economic growth since they create jobs and develop the human capital of groups that are under-represented in the labour market.
WISE may have the capacity to (re)integrate vulnerable populations into existing labour markets, or to create long-term new jobs and, more broadly, to increase the employability of disadvantaged populations. However, the lack of empirical data on the direct labour market impact, as well as other relevant social outcomes of social enterprises for different vulnerable populations in Canada, presents a barrier to evidence-based policy and program development aimed at supporting the growth of labour force participation for individuals facing multiple complex challenges.
The WISE research program has the potential to advance the Government of Canada’s understanding of innovative approaches to support the training, skills development, labour market integration and job retention for individuals facing multiple complex barriers to labour market integration in Canada. The results will inform policy and program development to support vulnerable populations by generating knowledge to fill significant information gaps. The results will also help inform future policy and program development of ESDC’s suite of integrated labour market programs and initiatives and the department’s overall support for social enterprises, under the Social Innovation and Social Finance Strategy.
Achievements for WISE Research Projects in FY1718:
- In Fall 2017, contribution agreements for the six projects were signed and research activities were launched.
- Academic research teams and WISE practitioners have established partnerships for the development and implementation of the research projects located at multiple sites across the country. These partnerships between researchers and practitioners are facilitating project activities and the recruitment of participants.
- Data collection plans, instruments and evaluation frameworks have been developed by each of the research teams. These involved undertaking a literature review informing the development of logic models based on theory of change and the identification of potential quantitative (hard) and qualitative (soft) outcomes to be capture in each of these multi-sites studies. Based on these preliminary lists of outcomes, each of the research team has been able to identify potential validated instruments and other metrics to be used for data collection.
The conceptualization of the WISE Outcomes Database is planned for FY1819. The estimated notional budget for the entire research program over five years is $2.2 million.
Labour Market Information (LMI)
ESDC implements a National Work Plan for labour market information (LMI) services in support of the National Employment Service and to ensure consistency in the delivery of LMI across Canada. In doing so, ESDC delivers LMI to individuals and employers to help them make informed labour market decisions.
LMI helps workers manage their careers and search for jobs by providing occupational and skills information. This information is disseminated via the core LMI products such as the National Occupational Classification (NOC) and its ‘counseling’ component, the Career Handbook (CH). The NOC information assists employers in recruiting, training and retaining workers. It also supports business and investment decisions by providing information on wages, labour supply and demand, as well as influencing educational programs. The CH helps define worker and work characteristics and other indicators that are important for career exploration and informed career decision making.
LMI helps the labour market function as an integrated national system. In addition, it contributes to:
- Aligning human capital investments with the needs of the economy;
- Facilitating job searches and improving job fit for individuals;
- Helping employers find or train required staff; and,
- Improving the effectiveness of public policies at all levels of government.
ESDC is responsible for determining the employment outlooks and wages for detailed occupations at the NOC 4-digit level (500 occupations), at the provincial, territorial and economic region levels, where data permits. ESDC updated wages in September 2017 and disseminated employment outlooks on the Job Bank website in December 2017.
Job vacancies information, weekly Labour Market News, monthly, quarterly and annual Labour Market Bulletins, Sectoral Outlooks, as well as annual and/or semi-annual Environmental Scans, were also made available on the Job Bank website for all regions of the country, along with the education and skill requirements for in-demand occupations, to support a more informed, skilled, competitive and mobile Canadian labour force. In addition, ESDC developed a beta interactive tool, LMI Explore, which was released on July 24, 2018. The tool provides an alternative way to access LMI.
Furthermore, ESDC worked with the LMI Council and provincial/territorial governments via a committee to align key parameters of the occupational employment outlooks produced by each jurisdiction and develop options for a common tool to disseminate LMI.
National employment service initiatives
Departmental operating funds also support online national employment services administered by ESDC, to help Canadians find suitable employment and help employers find suitable workers. These free, bilingual online services connect job seekers with employers, and help individuals prepare and carry out their return-to-work action plans. Job Bank is designed to improve the way information about jobs and the labour market is disseminated by reducing duplication, improving the quality of information, as well as making online LMI more accessible and easier to use.
In partnership with provinces and territories, ESDC maintains the Job Bank website, which offers an electronic labour exchange service to connect job seekers and employers as part of the National Employment Service. Job Bank provides workers with a listing of employment opportunities across Canada, to assist them with their job search. Employers can also use Job Bank to post their job vacancies online in order to find qualified candidates.
Job Bank completed a number of online service enhancements in FY1718, including the development of a mobile application. The Job Bank mobile app provides a new channel for accessing its job posting content which enhances client experience by leveraging mobile device features such as geolocation and notifications. Also, Job Alerts was improved to make it easier for EI claimants to subscribe to this service. As of December 2017, if an applicant for EI regular or fishing benefits provides an email address on their EI benefits application, they can complete their subscription to Job Alerts by simply confirming their email address with one click.
Lastly, Job Bank added feeds from Career Beacon and Jobillico to increase the diversity and coverage of jobs available through its website.
During FY1718, Job Bank received more than 52 million visits and displayed more than 1.4 million job postings from over 135,000 employers, including those from provincial, territorial and private job boards. More than 147 million alerts were sent to over 811,000 subscribers throughout the fiscal year.
4.4 Supporting agreements with provinces, territories and Indigenous organizations
Implementation of the modernized LMDA data systems continued in FY1718, with the expansion of the Targeting, Referral, and Feedback (TRF) tool in the Province of British Columbia and a successful launch in the Province of Alberta. The TRF allows the provinces and territories to receive information on EI applicants immediately following their application for EI based on individual predefined criteria. Provinces and territories then follow-up with these applicants to offer services and supports to help with their return to work.
Provinces and territories and Indigenous organizations are also making excellent use of the Employment Insurance Benefits Information System (EIBIS) launched in January 2014, which added new tools related to validating eligibility of potential clients for Part II benefits. Following an initial enquiry, users receive Alerts whenever an individual’s EI eligibility status changes. The P/Ts are also making good use of the “Notice of Intent” in EIBIS to flag to Service Canada the intention of referring an individual to training once their EI claim is active.
Refinements to the EI Part II data warehouse environment continued including the development of reports to inform program management and policy development.