
Greenhouse gas and air pollutant emissions projections – 2025

Download the alternative format
(PDF format, 4.67 MB, 181 pages)
Executive Summary
ES.1 Context
This report presents Canada’s updated projections of greenhouse gas (GHG) and air pollutant emissions through 2035 under two core scenarios: With Measures (WM) and With Additional Measures (WAM). It includes historical emissions data, projected trends by sector and gas type, and the accounting contribution from land-use, land-use change and forestry (LULUCF), nature-based climate solutions (NBCS), and agriculture measures. The report also provides sensitivity, uncertainty, emissions embodied in trade, and individual policy analyses, methodological details, and a comprehensive list of policies and measures included in each scenario.
Canada’s legislative foundation for these projections is the Canadian Net-Zero Emissions Accountability Act, which commits Canada to net-zero emissions by 2050. The Act sets interim targets for 2030, 2035, 2040, and 2045, and mandates the development of Emissions Reduction Plans for each of the milestone years and oversight by an independent advisory body. Canada’s 2030 Emissions Reduction Plan, released in 2022, targeted a 40% to 45% reduction below 2005 levels by 2030. The Plan also included several economy-wide and sector-specific measures to reach the 2030 target.
Canada’s international climate and air pollutant emissions commitments also shape its emissions reduction efforts. Under the United Nations Framework Convention on Climate Change (UNFCCC) and Paris Agreement, Canada has pledged to reduce GHG emissions. For air pollutants such as sulphur dioxide (SO2), nitrogen oxides (NOX), volatile organic compounds (VOCs), fine particulate matter (PM2.5), and black carbon, Canada has taken on emission reduction commitments in several international fora including under the United Nations Economic Commission for Europe’s (UNECE) Air Convention, the Arctic Council and the Canada–United States Air Quality Agreement. Canada has established commitments under the Gothenburg Protocol and supports the Arctic Council’s black carbon reduction goals, while continuing to align with evolving international standards.
Building on these legislative and international frameworks, the report models future emissions using the WM and WAM scenarios. The WM scenario reflects current legislative, regulatory and financial conditions as of November 2025, while the WAM scenario includes additional announced initiatives not yet fully implemented, along with NBCS and agriculture measures. Both scenarios incorporate the LULUCF accounting contribution.
To develop these projections, Environment and Climate Change Canada (ECCC) uses the Energy, Emissions and Economy Model for Canada (E3MC). This integrated modelling framework combines ENERGY 2020 and the North America Economic Model to simulate energy supply and demand, macroeconomic activity, and policy impacts. E3MC draws on data from Statistics Canada, the Canada Energy Regulator (CER), Natural Resources Canada (NRCan), and ECCC’s National Inventory Report (NIR). Projections are updated annually using the latest historical data and input from federal, provincial, and territorial partners.
Results are organized by economic sector and gas type, as well as aligned with Intergovernmental Panel on Climate Change (IPCC) categories for international reporting. This report includes historical data for 1990, 2005, and 2023, along with projections for 2026, 2030 and 2035. Energy model data span 1990 to 2023 historically, and 2024 to 2035 for projections, while macroeconomic historical estimates extend to 2024 with projections starting in 2025. Complete time series data are available through the Government of Canada’s open data portal, and interactive visualizations can be accessed via Canada’s Greenhouse Gas Emissions Projections website.
The report is organized into three main sections and two annexes:
- section 1 outlines the legislative and policy context, including Canada’s international commitments
- it also describes the methodological framework used to develop the projections and defines the WM and WAM scenarios
- section 2 presents detailed GHG emissions projections under the WM and WAM scenarios
- it includes sensitivity analyses that examine the effects of varying economic and energy assumptions such as gross domestic product (GDP), growth, population trends, and oil and gas prices
- it also includes uncertainty analysis around WM estimates and the individual impacts of selected key policies
- section 3 provides projections of air pollutant emissions under both scenarios
- annex 1 contains technical details on the modelling approach, assumptions, and data sources used throughout the report
- annex 2 contains a detailed list of policies and measures included in the projections
ES.2 Greenhouse gas emissions projections
Between 2005 and 2023, Canada’s total GHG emissions (excluding the LULUCF accounting contribution) declined by 8.5%, reaching 694 megatonnes (Mt) of carbon dioxide equivalents (CO2 eq) in 2023. The Electricity sector had the largest decline, as electricity emissions fell by 58% due to the phase out of coal and increased reliance on non-emitting sources. Emissions from the Oil and Gas sector increased modestly since 2005 but have declined from their 2014 peak. Emissions intensity, GHG emissions per unit of GDP, has dropped by 44% since 1990. This reflects improvements in energy efficiency and a shift towards cleaner energy sources.
Under the WM scenario, GHG emissions are projected to decline to 625 Mt in 2030. Including the LULUCF sector accounting contribution, 2030 emissions are projected to be 600 Mt in the WM scenario. Post-2030, emissions projected in the WM scenario continue to decline, reaching 577 Mt in 2035, including the LULUCF accounting contribution.
Under the WAM scenario, emissions in 2030 decline to 546 Mt, including LULUCF, NBCS, and agriculture measures. Post-2030, emissions projected in the WAM scenario (including LULUCF, NBCS, and agriculture measures) continue to decline, reaching 513 Mt in 2035.
Both the WM and WAM scenarios project continued reductions in emissions across all major sectors:
- Oil and Gas:
- Despite continued increases in production, emissions are expected to stay flat in the WM scenario with methane regulations, industrial carbon pricing, clean fuel requirements, and increased deployment of carbon capture and storage (CCS) technologies.
- The WAM scenario includes further reductions through the Enhanced Oil and Gas Methane Regulations , announced CCS projects, and increases in efficiency.
- Transportation:
- Emissions will decrease as zero-emission vehicles become more prevalent, supported by Electric Vehicle Availability Standards for light-duty vehicles.
- Light-duty and medium and heavy-duty vehicle standards continue to lead to declines in projected emissions over time.
- Electricity:
- The sector will continue to decarbonise, with the Clean Electricity Regulations and increasing adoption of renewable generation and storage technologies.
- By 2035, wind energy is projected to account for up to 24% of generation.
- Heavy Industry:
- Emissions will decline through fuel switching, electrification, CCS, and modernization of facilities.
- Buildings:
- Emissions are projected to fall due to electrification, heat pump adoption, and more stringent building codes.
- Despite growth in residential and commercial space, efficiency gains will drive reductions.
- Agriculture:
- Emissions remain stable in the WM scenario and decline slightly in WAM due to improved land-use practices and nitrogen management.
- NBCS and agriculture measures are projected to contribute up to 12 Mt CO2 eq in annual reductions by 2035.
- Waste and Others:
- GHG emissions in the Waste and Others sector remain near 2023 levels in the WM scenario with a slight post-2030 increase from light manufacturing.
- The WAM scenario achieves deeper reductions, especially in solid waste and light manufacturing, through measures like the Landfill Methane Regulations and carbon revenue returns, keeping emissions below or equal to 2023 levels.
| Sector | 1990 | 2005 | 2023 | 2026Footnote a | 2030Footnote a | 2035Footnote a | 2026Footnote b | 2030Footnote b | 2035Footnote b |
|---|---|---|---|---|---|---|---|---|---|
| Oil and Gas | 117 | 194 | 208 | 209 | 207 | 209 | 208 | 175 | 177 |
| Electricity | 94 | 116 | 49 | 38 | 23 | 14 | 39 | 26 | 14 |
| Transportation | 118 | 156 | 157 | 146 | 137 | 124 | 147 | 138 | 125 |
| Heavy Industry | 97 | 88 | 78 | 67 | 61 | 60 | 67 | 59 | 57 |
| Buildings | 72 | 85 | 83 | 80 | 78 | 78 | 79 | 76 | 69 |
| AgricultureFootnote * | 51 | 66 | 69 | 69 | 69 | 69 | 69 | 68 | 69 |
| Waste and Others | 57 | 54 | 50 | 48 | 50 | 51 | 48 | 41 | 42 |
| Subtotal | 606 | 759 | 694 | 656 | 625 | 606 | 656 | 583 | 554 |
| LULUCF Accounting Contribution | 27 | 0 | -39 | -21 | -25 | -30 | -21 | -25 | -30 |
| NBCS and Agriculture Measures | NA | NA | NA | NA | NA | NA | NA | -12 | -12 |
| Total | 633 | 759 | 655 | 635 | 600 | 577 | 636 | 546 | 513 |
| WCI CreditsFootnote ** | NA | NA | -10 | NA | NA | NA | -6 | -4 | 0 |
Note: Totals may not match due to rounding. Historical data up to 2023 are sourced from NIR2025. Data from 2024 to 2035 are modelled projections developed using ECCC’s analytical framework. Access more data on the open data portal .

Note: *Historical emissions include data from NIR2023 and NIR2025, and also include LULUCF accounting contribution. Access more data on the open data portal.
- WM25: Current With Measures scenario.
- WAM25: Current With Additional Measures scenario.
- WM23: With Measures scenario published in the 2023 Emissions Projections Report (EPR 2023).
- WAM23: With Additional Measures scenario published in EPR2023 in 2023.
Long description
| Year | 2023 NIR* | WM23 | WAM23 (incl. NBCS + Ag. Measures) | 2025 NIR* | 2025 WM | 2025 WAM | 2025 WAM (incl. NBCS/Ag Measures) |
|---|---|---|---|---|---|---|---|
| 2005 | 732 | - | - | 759 | - | - | - |
| 2006 | 722 | - | - | 752 | - | - | - |
| 2007 | 751 | - | - | 778 | - | - | - |
| 2008 | 733 | - | - | 760 | - | - | - |
| 2009 | 675 | - | - | 700 | - | - | - |
| 2010 | 712 | - | - | 738 | - | - | - |
| 2011 | 727 | - | - | 755 | - | - | - |
| 2012 | 719 | - | - | 742 | - | - | - |
| 2013 | 719 | - | - | 747 | - | - | - |
| 2014 | 692 | - | - | 721 | - | - | - |
| 2015 | 725 | - | - | 746 | - | - | - |
| 2016 | 695 | - | - | 715 | - | - | - |
| 2017 | 693 | - | - | 719 | - | - | - |
| 2018 | 707 | - | - | 730 | - | - | - |
| 2019 | 697 | - | - | 722 | - | - | - |
| 2020 | 629 | - | - | 660 | - | - | - |
| 2021 | 637 | 637 | 637 | 665 | - | - | - |
| 2022 | - | 688 | 686 | 709 | - | - | - |
| 2023 | - | 637 | 632 | 655 | 655 | 655 | - |
| 2024 | - | 630 | 616 | - | 667 | 667 | - |
| 2025 | - | 624 | 602 | - | 642 | 642 | - |
| 2026 | - | 615 | 577 | - | 635 | 636 | - |
| 2027 | - | 608 | 554 | - | 632 | 633 | - |
| 2028 | - | 590 | 528 | - | 621 | 609 | - |
| 2029 | - | 577 | 506 | - | 618 | 602 | - |
| 2030 | - | 560 | 468 | - | 600 | 558 | 546 |
| 2031 | - | 556 | 457 | - | 592 | 551 | 539 |
| 2032 | - | 550 | 448 | - | 586 | 541 | 529 |
| 2033 | - | 548 | 442 | - | 584 | 538 | 527 |
| 2034 | - | 544 | 435 | - | 580 | 530 | 518 |
| 2035 | - | 541 | 423 | - | 577 | 525 | 513 |
ES.3 Air pollutant emissions projections
Canada’s air pollutant reporting is guided by its commitments (including voluntary) under international agreements and national environmental policies, as outlined in Section 1. Air pollutant emissions projections for NOX, SOX, VOCs, particulate matter, black carbon, carbon monoxide, mercury, and ammonia through 2035 are available by pollutant under both the WM and WAM scenarios. These projections are based on historical data from 1990 to 2023. Historical data are reported in Canada's Air Pollutant Emissions Inventory Report 2025 (APEI2025) and Canada's Black Carbon Inventory Report 2025.
The projections indicate that Canada remains on track to meet its international air emissions reduction commitments under both scenarios, driven by cleaner fuels, electrification, and regulatory improvements. This underscores the country’s leadership in environmental stewardship and cross-border collaboration.
Table ES.2 summarises historical and projected emissions by pollutant. Open data Tables A37 through A46 provide detailed national emissions data by economic sector and pollutant.
| Pollutant | 1990 | 2005 | 2023 | 2026 Footnote a | 2030 Footnote a | 2035 Footnote a | 2026 Footnote b | 2030 Footnote b | 2035 Footnote b |
|---|---|---|---|---|---|---|---|---|---|
| Nitrogen Oxides | 2 236 | 2 259 | 1 228 | 1 006 | 963 | 950 | 1 004 | 960 | 944 |
| Sulphur Oxides | 3 010 | 2 095 | 608 | 544 | 443 | 458 | 542 | 442 | 451 |
| Volatile Organic Compounds | 2 200 | 2 256 | 1 368 | 1 174 | 1 184 | 1 202 | 1 174 | 989 | 1 000 |
| Total Particulate MatterFootnote * (excl. Open SourcesFootnote †) | 1 080 | 633 | 528 | 500 | 497 | 507 | 499 | 494 | 499 |
| Total Particulate MatterFootnote * (incl. Open SourcesFootnote †) | 19 976 | 21 161 | 26 804 | 28 550 | 31 508 | 33 946 | 28 575 | 31 455 | 33 961 |
| PM10Footnote ** (excl. Open SourcesFootnote †) | 640 | 386 | 278 | 262 | 258 | 260 | 262 | 256 | 254 |
| PM10Footnote ** (incl. Open SourcesFootnote †) | 6 528 | 6 809 | 8 172 | 8 650 | 9 477 | 10 158 | 8 656 | 9 461 | 10 159 |
| PM2.5Footnote *** (excl. Open SourcesFootnote †) | 458 | 271 | 160 | 149 | 144 | 142 | 149 | 142 | 136 |
| PM2.5Footnote *** (incl. Open SourcesFootnote †) | 1 609 | 1 364 | 1 370 | 1 415 | 1 515 | 1 597 | 1 416 | 1 510 | 1 592 |
| Carbon Monoxide | 13 082 | 9 006 | 4 518 | 4 320 | 4 276 | 4 202 | 4 322 | 4 264 | 4 112 |
| Mercury (Kilograms) | 33 541 | 7 947 | 3 131 | 2 713 | 2 482 | 2 531 | 2 707 | 2 470 | 2 507 |
| Ammonia | 395 | 490 | 495 | 490 | 520 | 550 | 490 | 520 | 551 |
| Black Carbon | NA | NA | 21.6 | 19.8 | 18.4 | 17.9 | 19.7 | 18.3 | 17.4 |
Note: Historical data up to 2023 are sourced from APEI2025 and Canada's Black Carbon Inventory Report 2025. Data from 2024 to 2035 are modelled projections developed using ECCC’s analytical framework. Access more data on the open data portal. Following international reporting standards, emissions from international aviation at cruise altitude and international marine navigation are excluded from national totals.
Acknowledgments
The Analysis and Modelling Division (AMD) of Environment and Climate Change Canada wishes to acknowledge the individuals and organisations that contributed to the Canada's Greenhouse Gas and Air Pollutant Emissions Projections Report 2025. Although the list of all organisations and individuals who provided technical support is too long to include here, the Division would like to highlight the contributions of the following authors and reviewers.
Overall coordination of Canada's Greenhouse Gas and Air Pollutant Emissions Projections Report 2025 was led by Alexandre Dumas with Glasha Obrekht providing overall direction, and with support from Shuvo Barman, Brock Batey, Elise Coffey, Noah Conrad, Thomas Dandres, Doruk Kaymak, Richard Laferrière, Michelle Lasota, Matthew Lewis, Yang Li, Izu Maduekwe, Ata Malfuzi, Levi Mitchell, Milad Naeimi, Howard Park, Bryn Parsons, Serena Rawn, Frédéric Roy-Vigneault, Benjamin Sas Trakinsky, John St-Laurent O'Connor, Timothy Timothy, Jocelyn Tong, Robert Sand Ty, Alice Umuhoza, Marshal Wang, Samantha Wiedrich, Robin White, and Robert Xu. Development of the projections also benefited from support from Systematic Solutions, Inc and Oxford Economics.
AMD acknowledges the valuable contributions of its federal partners, whose input was essential to the development of these projections. The following departments provided key data and expertise:
- Agriculture and Agri-Food Canada (AAFC)
- Canada Energy Regulator (CER)
- Environment and Climate Change Canada (ECCC)
- Finance Canada
- Natural Resources Canada (NRCan)
- Statistics Canada
- Transport Canada
Details on each group’s contribution are provided in Annex 1.
1 Context
This section provides the context for Canada’s 2025 greenhouse gas (GHG) and air pollutant emissions projections. It outlines the legislative and policy framework established by the Canadian Net-Zero Emissions Accountability Act, details Canada’s international climate and air pollutant emissions commitments, and explains the country’s domestic and international reporting obligations.
It also introduces the emissions scenarios used throughout the report and describes the assumptions, scope, and rationale behind their development. These scenarios are developed using a consistent, transparent modelling framework that integrates the latest economic, energy, and policy data to estimate future emissions trajectories. Together, these elements establish the basis for the projections presented in subsequent sections.
1.1 Purpose and scope of the report
The purpose of this report is to present Canada’s updated projections of GHG and air pollutant emissions through 2035. The projections fall under two main policy scenarios: the With Measures (WM) scenario and the With Additional Measures (WAM) scenario. These projections are developed by Environment and Climate Change Canada (ECCC), using the Energy, Emissions, and Economy Model for Canada (E3MC), in alignment with international reporting standards and domestic legislative requirements.
The report aims to:
- provide a comprehensive overview of Canada’s expected emissions trajectory under current and announced climate policies
- inform policy development and decision-making at federal, provincial, and territorial levels
- support Canada’s commitment to transparency and accountability under the Canadian Net-Zero Emissions Accountability Act
- contribute to the country’s obligations under the United Nations Framework Convention on Climate Change (UNFCCC)
- uphold international obligations under agreements such as the Gothenburg Protocol and the Canada–United States Air Quality Agreement (AQA)
- facilitate stakeholder engagement and public understanding of Canada’s climate and air quality policy framework
- highlight methodological improvements and updates to modelling frameworks and assumptions since the previous report
The projections presented in this report reflect the most recent historical data available as of November 2025 and incorporate input from extensive consultations with federal, provincial, and territorial partners. They should not be viewed as forecasts of expected outcomes, but rather scenario-based projections that illustrate potential outcomes under defined assumptions and policies.
This report is organized to provide a comprehensive and transparent overview of Canada’s GHG and air pollutant emissions projections through 2035. It is structured to support both technical analysis and policy development, while ensuring accessibility for a broad range of stakeholders.
All data tables referenced in this report are available through the Government of Canada’s open data portal, which also provides additional tables covering the full range of historical and projection years included in the report. Annex tables are identified by the prefix “A.” While tables A1 to A16 are printed in this document, tables A17 to A46 are only accessible through the open data portal. Links to the open data portal are provided throughout the document.
The report is divided into the following main sections:
- section 1: context
- introduces the legislative and policy framework guiding Canada’s climate and air pollutant emissions commitments, including international agreements and reporting obligations
- it also defines the emissions scenarios used throughout the report
- section 2: greenhouse gas emissions projections
- presents detailed GHG emissions projections by economic sector, Intergovernmental Panel on Climate Change (IPCC) category, and gas type
- it includes historical trends, comparisons to previous projections, decomposition analyses, and assessments of key mitigation measures
- emissions from land use, land-use change, and forestry (LULUCF), nature-based climate solutions (NBCS), and agriculture measures (Ag. Measures) are reported separately
- section 3: air pollutant emissions projections
- provides projections for key air pollutants under the WM and WAM scenarios
- it includes sectoral breakdowns and evaluates Canada’s progress toward international air emissions reduction targets
- annex 1
- provides detailed information on the modelling framework, key assumptions, data sources, and methodological improvements
- it also includes projections, uncertainty analyses, as well as detailed results
- annex 2
- provides a detailed list of all modelled policies
Supporting materials such as the Executive Summary, the List of Figures, the List of Tables, the List of Abbreviations, and the List of Chemical Formulas and Units provide additional context and facilitate navigation of the report.
1.2 Legislative framework
The Canadian Net-Zero Emissions Accountability Act, enacted in June 2021, legally enshrines Canada’s commitment to achieve net-zero GHG emissions by 2050.
The Act establishes a framework for accountability and transparency and mandates the Government of Canada to:
- set emissions reduction targets for 2030, 2035, 2040, and 2045
- develop and table Emissions Reduction Plans for each target year
- report on progress through biennial progress reports and final assessment reports
- establish an independent advisory body to provide expert advice and engage Canadians on pathways to net-zero
- table progress reports and final assessments in Parliament, ensuring public accountability
Canada’s 2030 Emissions Reduction Plan, released in March 2022, is the first climate plan developed under the Act. It outlines a sector-by-sector roadmap to reduce GHG emissions by 40% to 45% below 2005 levels by 2030. The 2030 Emissions Reduction Plan includes:
- an interim objective of a 20% reduction by 2026
- detailed measures across all major economic sectors
- commitments to transparency in modelling and analytical approaches
In addition to domestic legislation, Canada’s climate strategy is shaped by its participation in international agreements, detailed in the following sections.
In 2023, ECCC published the first progress report on the Emissions Reduction Plan, which included:
- updates on emissions trends and progress toward the 2030 target
- a status update on each federal climate measure
- findings from an expert review of ECCC’s modelling framework, the Action Plan and the status update on progress made to address proposed recommendations
Annex 1 includes an update to the progress made in implementing the Independent Modelling Review Action Plan since the last progress update, which was released in 2024 as part of Canada’s First Biennial Transparency Report under the Paris Agreement (BTR1).
1.3 International climate and air pollution reduction commitments
Canada’s international climate and air pollution reduction commitments are grounded in a series of multilateral agreements and protocols. While reducing GHG emissions is central to Canada’s climate strategy, improving air quality remains a parallel priority, both for public health and environmental protection. The following sections outline Canada’s obligations and actions related to GHG emissions and air pollutant emissions under these frameworks.
1.3.1 Greenhouse gas emissions
Canada has been actively engaged in international climate action since signing the UNFCCC in 1992. The country set its first national GHG emissions target in 2000 and has since strengthened its commitments through successive agreements. In 2016, Canada ratified the Paris Agreement, and in 2021, it submitted an enhanced 2030 emissions reduction target. That same year, Canada passed the
1.3.2 Air pollutant emissions
Air quality is important and influences the daily life of all Canadians. It affects not only human health, but also the delicate balance of the natural environment, the integrity of buildings and infrastructure, crop production, and the overall state of the economy. Projections of air pollutant emissions play a pivotal role in guiding both domestic and international efforts aimed at improving air quality.
Canada actively collaborates with other countries to address transboundary air pollution, recognizing its significant impact on national air quality. Canada is party to three major international agreements: the Canada–United States Air Quality Agreement, the Arctic Council’s Framework for Action on Enhanced Black Carbon and Methane Emissions Reductions, and the United Nations Economic Commission for Europe’s Convention on Long-range Transboundary Air Pollution (CLRTAP or Air Convention), and its Gothenburg Protocol. Negotiations to revise the Gothenburg Protocol are underway, and expected to continue over the near-term, while negotiations to revise the AQA and develop a new goal for black carbon under the Arctic Council may resume in the coming years. These updates aim to incorporate evolving scientific knowledge, technological advancements, and policy developments.
The Gothenburg Protocol is the most active of the eight protocols under the Air Convention. It targets pollutants that contribute to acidification, eutrophication, and ground-level ozone. In 2012, the Protocol was amended to include fine particulate matter (PM2.5) and updated emissions reduction commitments to be met in 2020 and maintained. Canada ratified the amended Gothenburg Protocol in November 2017, and it entered into force domestically in October 2018. Under this agreement, Canada committed to specific emission reductions for key pollutants.
| Pollutant | 2010 Emissions Ceiling (kt) | 2020 Commitment (% below 2005) | 2020 Commitment Level (kt)Footnote * |
|---|---|---|---|
| Sulphur dioxide (SO2) | 1 450 | 55% | 943 |
| Nitrogen oxides (NOX) | 2 250 | 35% | 1 468 |
| Volatile organic compounds (VOCS) | 2 100 | 20% | 1 805 |
| Fine particulate matter, excluding emissions from open sources (PM2.5) | NA | 25% | 203 |
In addition to its Air Convention commitments, Canada also has commitments under the AQA, which focus on reducing emissions of SO₂, NOₓ, and VOCs to control transboundary air pollution.
Black carbon is an air pollutant and a short-lived climate pollutant with significant warming potential and health impacts. Under the Arctic Council’s Framework for Action on Enhanced Black Carbon and Methane Emissions Reductions, Canada and other Arctic States agreed to an aspirational goal of reducing collective emissions of black carbon by 25% to 33% below 2013 levels by 2025.
Canada has met its emissions reduction commitments under the Gothenburg Protocol and the AQA, and has reduced its black carbon emissions in line with the Arctic Council’s collective black carbon goal. Section 3 discusses how Canada is expected to continue meeting, or even exceeding, its Gothenburg Protocol obligations through 2035.
1.4 Reporting obligations and methodological overview
ECCC plays a central role in fulfilling Canada’s climate reporting obligations under both domestic legislation and international agreements. These reporting activities promote transparency, accountability, and align with global best practices.
Canada’s emissions projections are developed in accordance with the Modalities, Procedures and Guidelines adopted by the UNFCCC. To ensure consistency with international reporting, Canada has adopted the UNFCCC naming convention for emissions scenarios. As of this report, the scenarios previously referred to as the “Reference Case” and “Additional Measures Scenario” in previous domestic reports are now called the WM and WAM scenarios, respectively. While the modelling approaches remain unchanged, this terminology shift improves comparability across reporting platforms.
ECCC develops GHG and air pollutant emissions projections using E3MC, a comprehensive modelling framework that integrates two core components: ENERGY 2020 and the North America Economic Model (NAEM). ENERGY 2020 simulates energy supply, demand, and pricing across sectors and regions while NAEM captures macroeconomic activity and its interaction with energy use. Together, these models enable a market-based analysis of energy and emissions, balancing supply and demand and reflecting policy, price, and technology dynamics. E3MC incorporates data from authoritative sources such as Statistics Canada, the Canada Energy Regulator (CER), Natural Resources Canada (NRCan), and ECCC’s National Inventory Report (NIR), and supports both forecasting and analysis. It produces detailed outputs on energy consumption, production, prices, and macroeconomic indicators including gross domestic product (GDP) and employment, ensuring consistency with international reporting standards and enabling robust scenario analysis. More information about E3MC is available in Annex 1.
Projections are updated annually to reflect the most recent historical data and current economic and energy market trends. These projections represent potential outcomes that may vary year to year depending on economic, social, and policy developments.
ECCC collaborates with other federal government departments, provinces, and territories to develop the data and assumptions used in emissions modelling. Through comprehensive consultations, most recently completed in August 2025, ECCC ensures that the projections reflect a wide range of policies and measures across all orders of government.
The current projections are based on data available as of November 2025, including the most recent historical data from Canada’s National Inventory Report 1990–2023: Greenhouse Gas Sources and Sinks in Canada 2025 (NIR2025). Projections extend from 2024 through 2035.
Since 2011, ECCC has published annual GHG emissions projections through various platforms including:
- federal climate plans and Progress Reports:
- Pan-Canadian Framework on Clean Growth and Climate Change (2015)
- Canada's Strengthened Climate Plan (2020)
- Canada’s 2030 Emissions Reduction Plan (2022)
- 2023 Progress Report on the 2030 Emissions Reduction Plan (2023)
- biennial submissions to the UNFCCC:
- Canada's Sixth National Report on Climate Change (2013)
- Canada's Second Biennial Report on Climate Change (2015)
- Canada's Seventh National Communication and Third Biennial Report on Climate Change (2017)
- Canada's Fourth Biennial Report on Climate Change (2019)
- Canada's Eight National Communication and Fifth Biennial Report (2022)
- Canada's First Biennial Transparency Report under the Paris Agreement (2024)
- standalone domestic reports:
- Canada's Emissions Trends (2011)
- Canada's Emissions Trends (2012)
- Canada's Emissions Trends (2014)
- Canada's 2016 Greenhouse Gas Emissions Reference Case (2016)
- Canada's Greenhouse Gas and Air Pollutant Emissions Projections (2018)
- Canada's Greenhouse Gas and Air Pollutant Emissions Projections (2020)
- Canada's Greenhouse Gas and Air Pollutant Emissions Projections (2023)
Canada’s emissions projections follow a consistent and transparent approach aligned with international reporting standards. Projections are presented by both sector and gas type, with and without the accounting contribution from the LULUCF sector and emissions reduction from NBCS and agriculture measures. For domestic policy analysis, emissions are classified by economic sector rather than by IPCC categories. This reclassification does not alter the total emissions reported under UNFCCC guidelines but provides a more practical framework for domestic analysis. Unless otherwise noted, the term “sector” in this report refers to these economic sectors. While most results are organized using this economic sector framework, Section 2.3 also presents projections by IPCC category and explains how these align with Canada’s classifications.
To support transparency and IPCC reporting requirements, all projections are presented relative to historical inventory data using both graphical and tabular formats. Historical data are shown for 1990, 2005, and 2023 (except for black carbon, available from 2013 onward). Projections are provided for 2026, 2030, and 2035. Some tables and figures also compare current projections with those from previous reports. Complete time series data are available through the Government of Canada’s open data portal, and interactive visualizations can be accessed via Canada’s Greenhouse Gas Emissions Projections website.
This report presents two primary GHG and air pollutant emissions scenarios, the WM and WAM scenarios. These scenarios provide insight into Canada’s expected emissions trajectory under current and anticipated climate policies. GHG emissions projections are presented in Section 2, while air pollutant projections appear in Section 3.
1.5 Continuous modelling excellence and continuous updates improvements
The Government of Canada possesses long-standing and comprehensive modelling capacity that supports the development of GHG emissions projections. These projections adhere to internationally recognized best practices and rigorous methodologies, aligned with reporting requirements under the UNFCCC. As mentioned in Section 1.4, ECCC employs E3MC, an integrated framework combining ENERGY 2020 and NAEM to simulate energy supply, demand, pricing, and macroeconomic interactions. This approach ensures consistency with international reporting standards and enables robust scenario analysis.
The modelling process draws on authoritative data sources, including Statistics Canada, the CER, NRCan, and ECCC’s NIR, and is informed by expert input on key drivers such as economic growth and energy trends. Importantly, the ENERGY 2020 model has been peer-reviewed by leading external experts in economic modelling and the model inputs are vetted with stakeholders to ensure transparency and credibility. Canada’s projections have been published regularly since 2011 in federal climate plans, biennial submissions to the UNFCCC, and standalone domestic reports, demonstrating Canada’s proven and internationally aligned modelling capability.
Building on this strong foundation, ECCC is committed to continuous improvement of its modelling framework to enhance transparency, stakeholder engagement, and methodological robustness.
In the 2030 Emissions Reduction Plan (released in 2022), ECCC committed to improving transparency in modelling and reporting. ECCC undertook a two-phase consultation process between 2022 and 2023. Phase 1 gathered input from prominent Canadian modelling experts on objectives, scope, and milestones for a formal consultation process, which led to the development of an Independent Modelling Review Action Plan. Phase 2 expanded consultation on the proposed plan. The final version of the action plan was released in Canada's 2023 Greenhouse Gas and Air Pollutant Emissions Projections Report. A progress update was later included in Canada’s First Biennial Transparency Report under the Paris Agreement, submitted to the UNFCCC in 2024. The projections presented in this report continue to address items identified in this action plan.
Key technical advancements in 2025 include modernizing the ENERGY 2020 model by transitioning it from the legacy PROMULA programming language to the modern, high-performance Julia language. Validation of the updated model confirmed consistency with previous outputs. This transition improves model runtime and maintainability and supports integration with advanced development tools including AI-assisted coding and version control tools. Model documentation will be updated to reflect the changes associated with the transition to the Julia programming language and will be made publicly available in 2026.
ECCC has also developed a methodology to isolate the contributions to emissions reductions of certain key individual climate policies, enhancing transparency and supporting strategic decision-making. Additionally, scenario analyses have been expanded to include trade uncertainty and tariff impacts, providing a broader understanding of potential emissions trajectories.
Additional details regarding modelling assumptions, provincial-level data for emissions from the LULUCF sector, and sensitivity scenarios have been added to the open data portal. Finally, a Multi-Model Comparison Forum was set up under the umbrella of the Energy Modelling Hub. Over 2024 and 2025, the Forum established foundational workflows that are poised to enhance collaboration and comparisons across Canadian models. In December 2025, the Annual Forum brought together Canada’s leading energy modellers, policymakers, and system experts to foster collaboration and develop actionable strategies for the future.
Planned future enhancements focus on optimizing model runtimes, enabling cross-platform functionality, leveraging cloud computing efficiencies, and exploring parallel computing. These efforts aim to support more efficient scenario development and policy analysis.
In the LULUCF sector, ECCC continues to improve data and methods based on peer-reviewed science and international reporting protocols. Planned improvements for forest land and harvested wood products (HWP) are detailed in the NIR and related improvement plans.
In 2023 and 2024, Canada conducted a review of its GHG accounting approach for the LULUCF sector, with specific focus on Forest Land remaining Forest Land (FLFL) and associated HWP accounting. As part of this process, NRCan and ECCC sought input from experts and stakeholders to inform Canada’s decision on its LULUCF accounting approach. Based on internal analysis and on feedback received from stakeholders and experts, the Government of Canada made the decision to maintain the current approach that applies reference level accounting to FLFL and the associated HWP and net-net accounting to all other land categories, while continuing to monitor developments related to LULUCF accounting.
Methodological revisions since the previous report include updates to historical data, policy coverage, and modelling approaches to reflect the latest scientific understanding and policy developments. These updates ensure that projections remain accurate and relevant for informing Canada’s climate commitments and policy decisions. Additional information about improvements to the data and methodology can be found in Section A1.9.
1.6 Scenario definitions
1.6.1 With measures scenario
The WM scenario includes federal, provincial, and territorial policies and measures that were in place as of November 2025 and assume no further government action. This scenario was previously referred to as “Reference Case” in previously published domestic reports. Policies and measures in the WM scenario must:
- reflect current legislative, regulatory, and financial conditions
- have sufficient quantifiable information for its impact to be estimated
- be expected to produce meaningful and material reductions by at least 100 kilotonnes (kt) of carbon dioxide equivalents (CO2 eq) annually
Unless otherwise specified, this scenario also includes the accounting contribution from the LULUCF sector. A full list of policies and measures included in the WM scenario is provided in Table A10 and Table A11. Changes to the policy coverage of the WM scenario since the release of Canada’s 2023 Emissions Projections Report (EPR2023) are discussed in Section A1.9.4.
1.6.2 With additional measures scenario
The WAM scenario builds on the WM scenario by including all federal, provincial, and territorial policies and measures that have been announced but not yet fully implemented. It also accounts for the effects of NBCS and agriculture measures. However, it excludes measures still in development or planning stages where insufficient information prevents accurate modelling. This scenario was previously referred to as “Additional Measures” in previously published domestic reports.
The Enhanced Oil and Gas Methane Regulations and the Landfill Methane Regulations were finalized on December 16, 2025. These regulations were completed too late for inclusion in the WM scenario; however, they were included in the WAM scenario and will be incorporated in WM scenario in future updates.
The list of policies and measures included in the WAM scenario, which includes a description of their underlying assumptions, can be found in Table A12. Changes to the policies included in the WAM scenario since the release of EPR2023 are discussed in Section A1.9.4.
As new measures are developed and implemented, their emissions reductions will be assessed and included in future projections.
From 2017 to 2024, Canada included emissions reductions from the Western Climate Initiative (WCI) in its WAM scenario and counted them toward its 2030 target in both domestic and international reports. The WCI is a regional cap-and-trade program that uses market-based mechanisms to reduce GHG emissions. Currently, Québec and California operate linked cap-and-trade systems under the WCI, with Washington state considering participation. Since 2013, these jurisdictions have exchanged allowances and offsets, known as WCI credits, as interchangeable compliance units.
Under Article 6 of the Paris Agreement, countries can trade emissions reductions as internationally transferred mitigation outcomes (ITMOs) if both parties are signatories to the Agreement and have established a bilateral agreement to authorize the exchange. However, the recent United States of America’s (US) withdrawal from the Paris Agreement means it can no longer authorize ITMO trades, preventing Canada from establishing a bilateral agreement with the US to count WCI credit flows as ITMOs.
Going forward, Canada will continue working with Québec to monitor and track WCI credit flows but will no longer formally count them toward its NDC target. Instead, Canada will highlight these net flows in public reports, including this report and the Second Biennial Transparency Report in 2026, to acknowledge their role in a credible and well-documented emissions trading system.
1.6.3 Alternative scenarios
All projections are subject to uncertainty. The WM and WAM scenarios represent plausible outcomes based on current knowledge, but future developments, such as changes in economic growth, energy prices, or technology, could significantly alter emissions trajectories.
Section 2.5 presents alternative scenarios to explore the sensitivity of projections to these key drivers. It also includes an analysis of the uncertainty associated with the WM scenario.
These scenarios do not consider the impact of the LULUCF accounting contribution, NBCS, and agriculture measures.
2 Greenhouse gas emissions projections
2.1 Summary of historical and projected emissions
This section provides a high-level overview of Canada’s GHG emissions trajectory, combining historical data with projections. It highlights key trends, summarizes expected outcomes under current and additional policy measures, and explains the drivers behind projected changes. Together, these elements provide essential context for understanding Canada’s progress toward its climate targets. Historical emissions data from 2005 to 2023 are sourced from NIR2025, while projections from 2024 to 2035 are developed using ECCC’s modelling framework.
Please note that the tables starting with ‘A’ referenced in Sections 2 and 3 are exclusively available on the Government of Canada’s open data portal. Further information on revisions (historical data, policies, and methodological), can be found in sections A1.9.3 to A1.9.5, in Annex 1. A complete list of policies included in the modelling can be found in Table A10 through Table A12.
2.1.1 Historical trends
In 2023, Canada’s GHG emissions were 694 megatonnes (Mt), a decrease of 65 Mt (8.5%) from 2005 (excluding the LULUCF sector), and a decrease of 6.0 Mt (0.9%) from 2022.
Emissions from Electricity decreased by 67 Mt (58%), between 2005 and 2023, driven by the phase out of coal-fired electricity generation. Oil and Gas emissions increased by 13 Mt (7%). Oil and Gas emissions peaked in 2014 at 228 Mt and have since decreased by 20 Mt (9%) to 208 Mt in 2023. This is consistent with measured decreases of fugitive methane sources in recent years.
The emissions intensity, GHG per GDP, for the entire Canadian economy has continued to decline. In 2023 it had declined by 44% since 1990 and by 33% since 2005.
As with every NIR edition, improvements have been implemented in NIR2025 resulting in revisions to previously published data. Overall, NIR2025 incorporates downward revisions of 2.8 Mt in 2005 and 7.9 Mt in 2022, relative to the previously published inventory in 2024.
2.1.2 Projections summary
Building on the historical trends outlined above, this section summarizes projected emissions under the WM and WAM scenarios.
Under the WM scenario, GHG emissions are projected to decline to 625 Mt in 2030. With the LULUCF sector accounting contributions included, 2030 emissions are projected to be 600 Mt in the WM scenario. Post-2030, emissions projected in the WM scenario continue to decline, reaching 577 Mt in 2035 (including the LULUCF accounting contribution).
Under the WAM scenario, emissions in 2030 decline to 546 Mt, including LULUCF, NBCS, and agriculture measures. Post-2030, emissions projected in the WAM scenario (including LULUCF, NBCS, and agriculture measures) continue to decline, reaching 513 Mt in 2035.
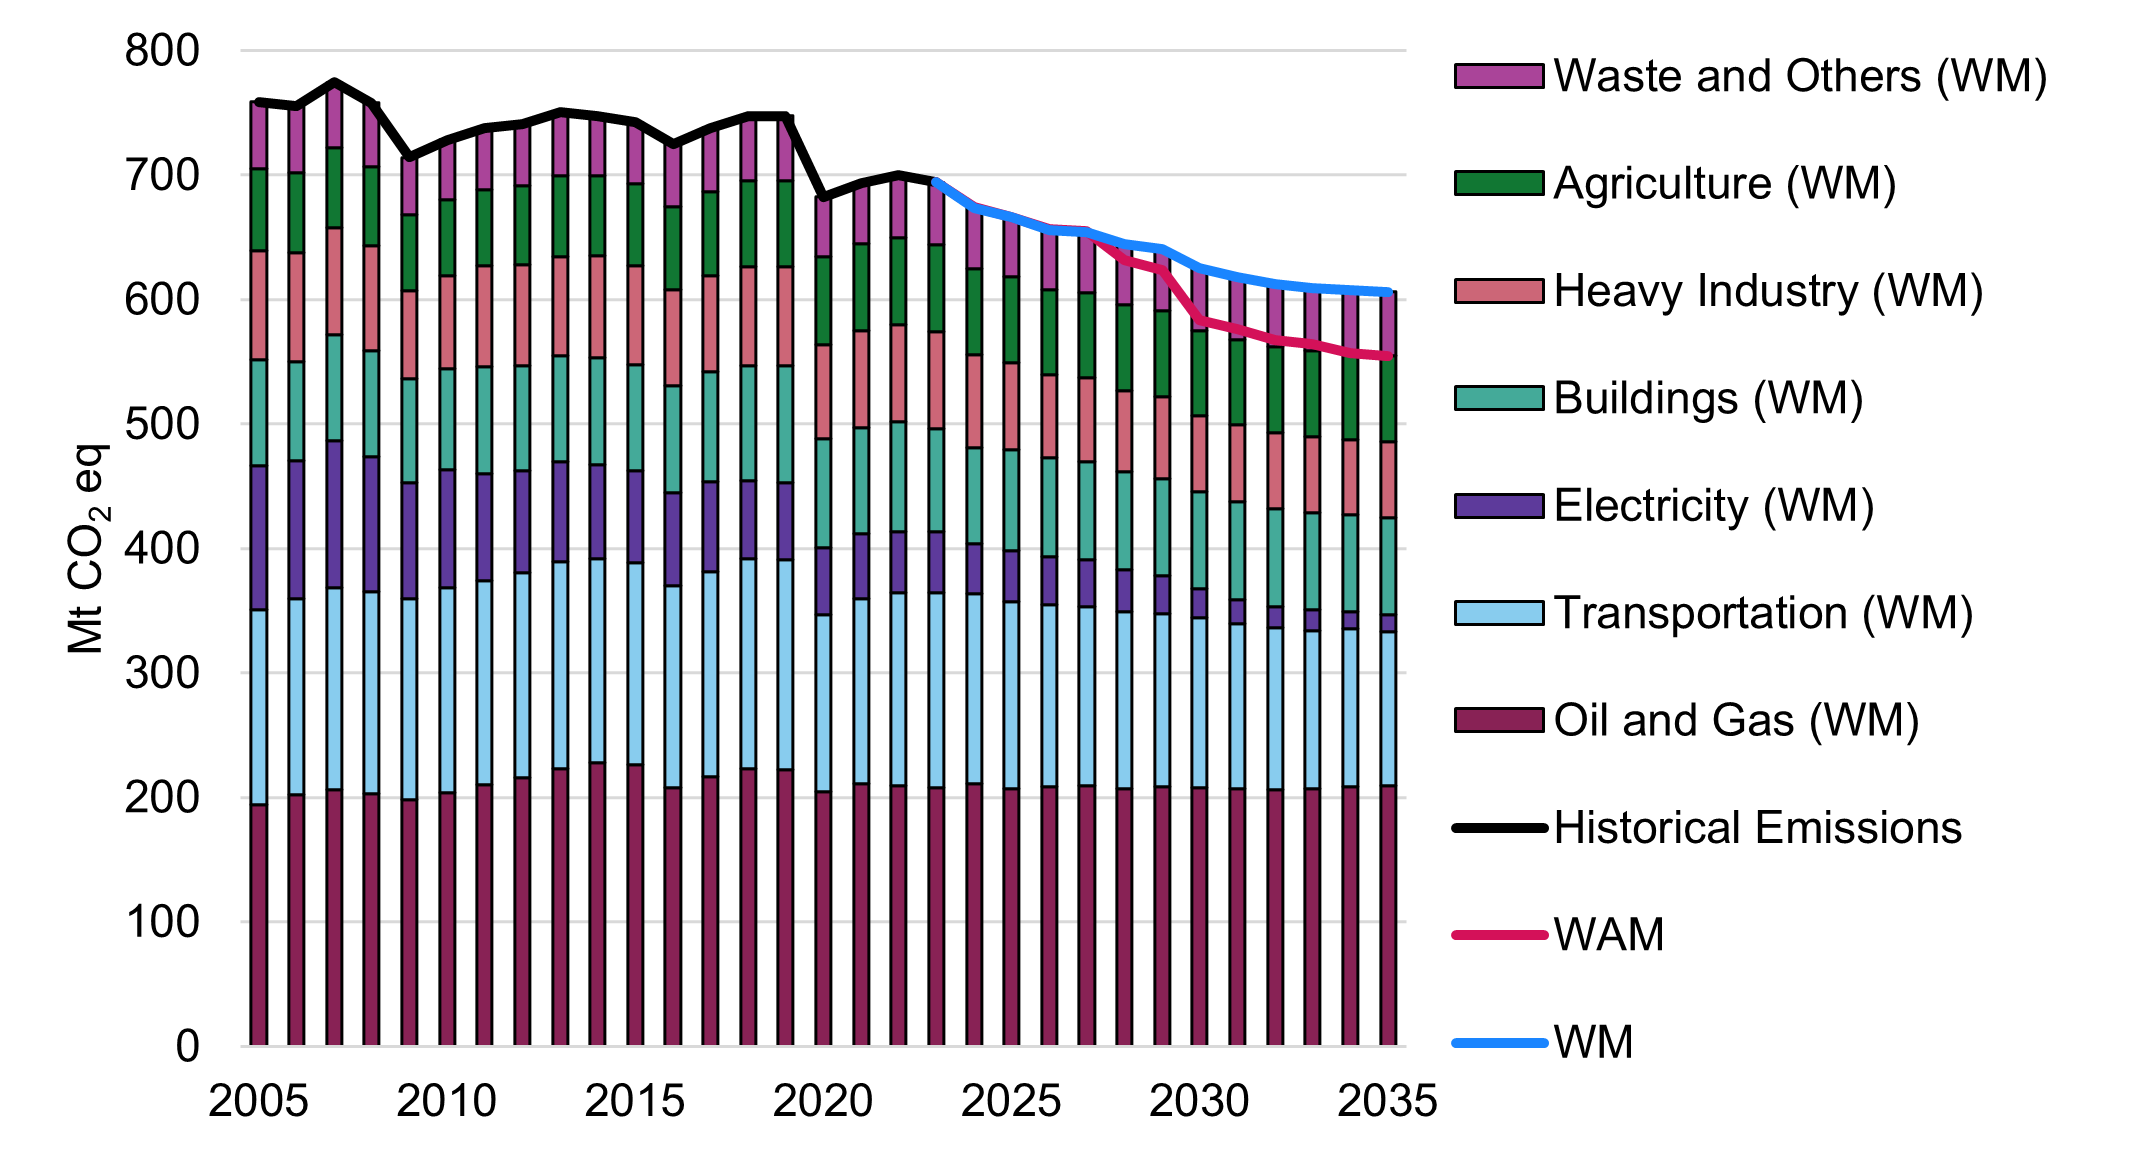
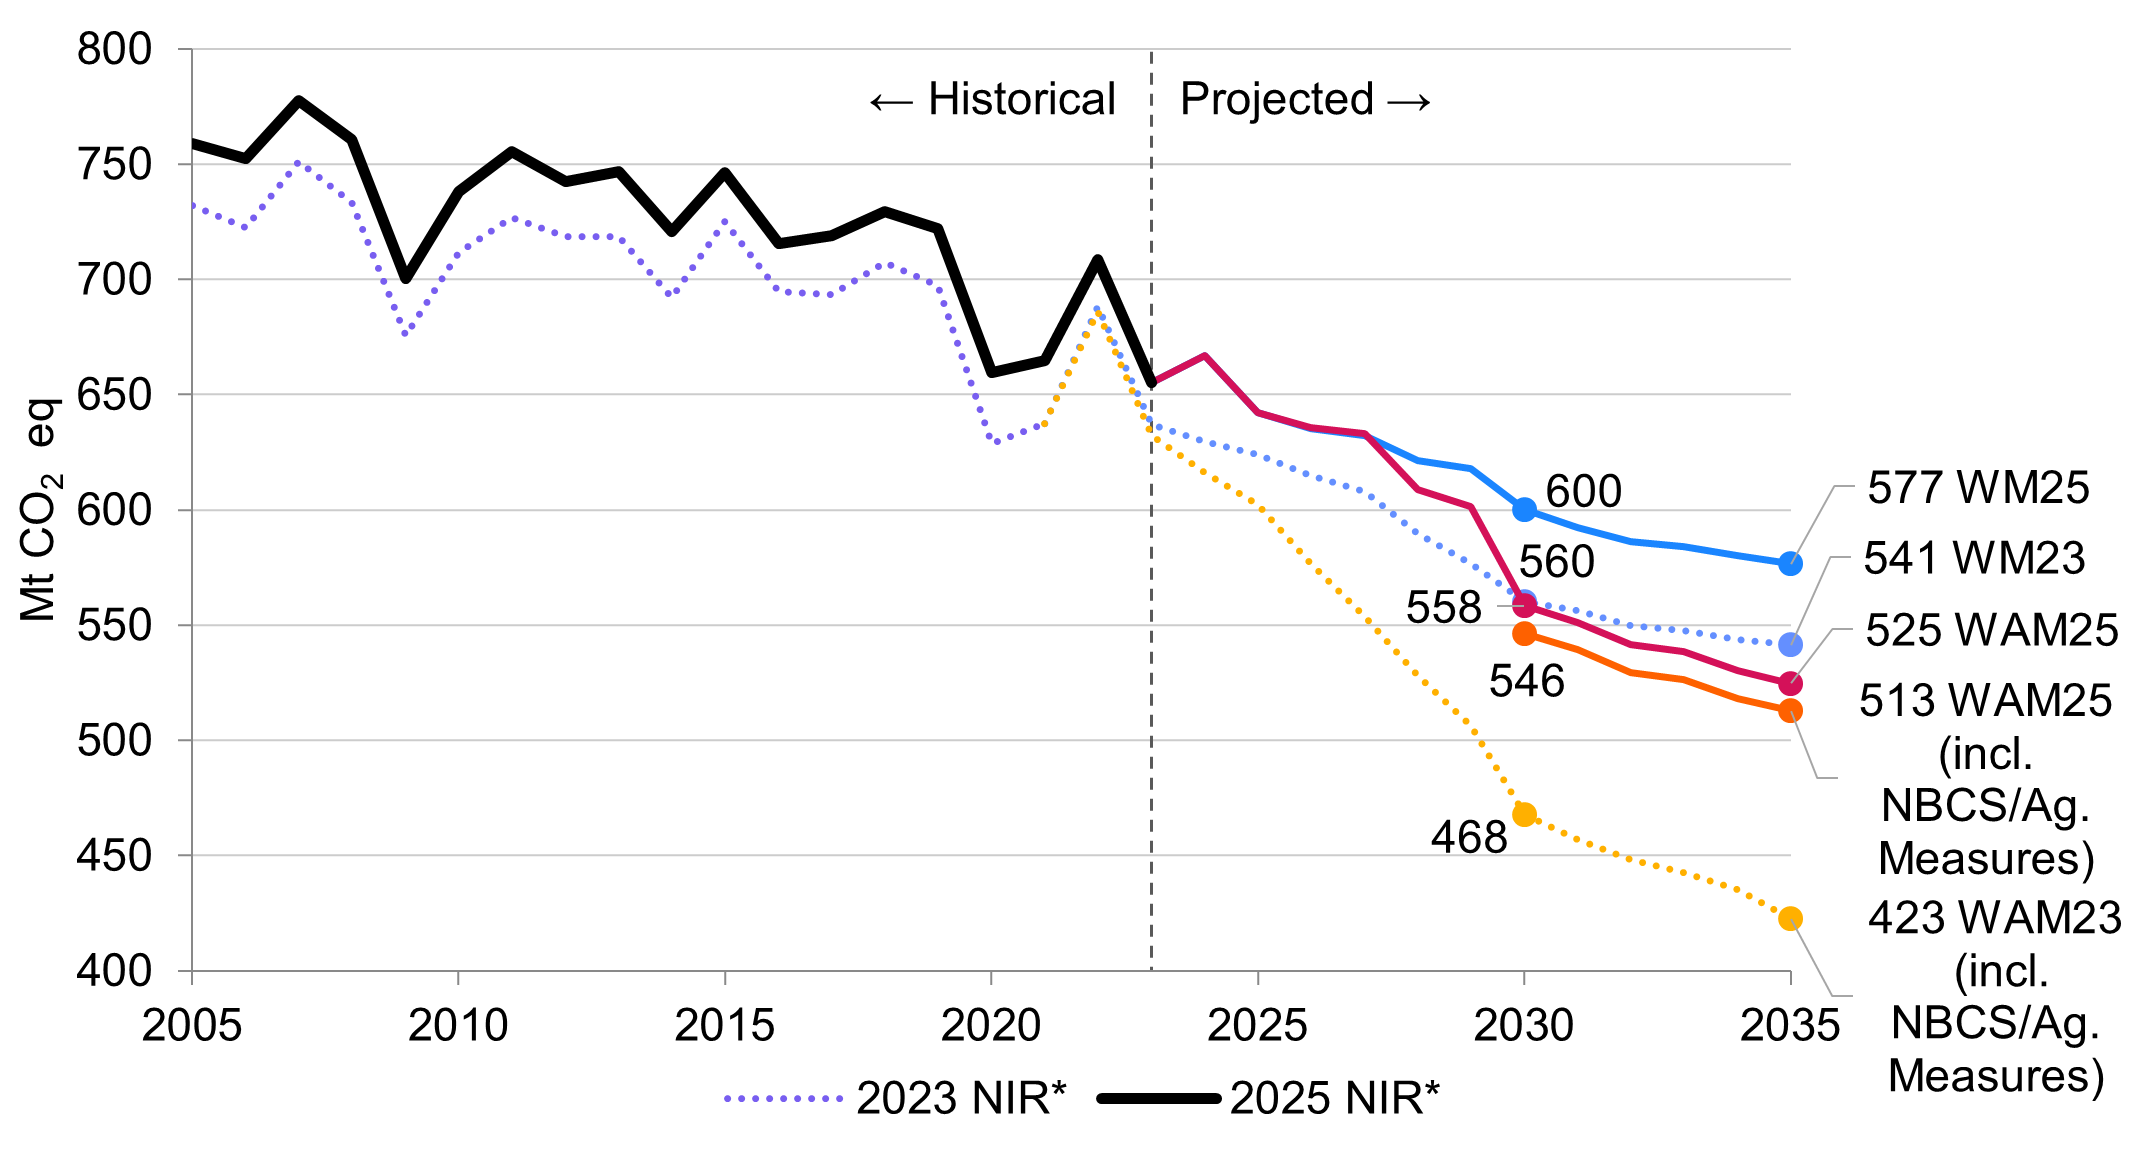
Table 2 and Figure 1 illustrate projected trends in GHG emissions by economic sector, while Table 16 presents the same projections organized by IPCC categories. Figure 2 compares emissions projections under the WM and WAM scenarios, alongside those published in EPR2023. For further detail, Section 2.2 provides sector-level projections, and Section 2.3 offers a comparative analysis of emissions categorized by both IPCC and Canadian economic sector frameworks.
| Sector | 1990 | 2005 | 2023 | 2026Footnote a | 2030Footnote a | 2035Footnote a | 2026Footnote b | 2030Footnote b | 2035Footnote b |
|---|---|---|---|---|---|---|---|---|---|
| Oil and Gas | 117 | 194 | 208 | 209 | 207 | 209 | 208 | 175 | 177 |
| Electricity | 94 | 116 | 49 | 38 | 23 | 14 | 39 | 26 | 14 |
| Transportation | 118 | 156 | 157 | 146 | 137 | 124 | 147 | 138 | 125 |
| Heavy Industry | 97 | 88 | 78 | 67 | 61 | 60 | 67 | 59 | 57 |
| Buildings | 72 | 85 | 83 | 80 | 78 | 78 | 79 | 76 | 69 |
| AgricultureFootnote * | 51 | 66 | 69 | 69 | 69 | 69 | 69 | 68 | 69 |
| Waste and Others | 57 | 54 | 50 | 48 | 50 | 51 | 48 | 41 | 42 |
| Subtotal | 606 | 759 | 694 | 656 | 625 | 606 | 656 | 583 | 554 |
| LULUCF Accounting Contribution | 27 | 0 | -39 | -21 | -25 | -30 | -21 | -25 | -30 |
| NBCS and Agriculture Measures | NA | NA | NA | NA | NA | NA | NA | -12 | -12 |
| Total | 633 | 759 | 655 | 635 | 600 | 577 | 636 | 546 | 513 |
| WCI CreditsFootnote ** | NA | NA | -10 | NA | NA | NA | -6 | -4 | 0 |
Note: Totals may not match due to rounding. Historical data up to 2023 are sourced from NIR2025. Data from 2024 to 2035 are modelled projections developed using ECCC’s analytical framework. Access more data on the open data portal.
Note: Numbers may not sum to the total due to rounding. Historical emissions data come from NIR2025. Access more data on the open data portal.
Long description
| Year | Agriculture (WM) | Buildings (WM) | Electricity (WM) | Heavy Industry (WM) | Oil and Gas (WM) | Transportation (WM) | Waste and Others (WM) | Historical Emissions | WM | WAM |
|---|---|---|---|---|---|---|---|---|---|---|
| 2005 | 66 | 85 | 116 | 88 | 194 | 156 | 54 | 759 | - | - |
| 2006 | 64 | 79 | 111 | 88 | 202 | 157 | 53 | 755 | - | - |
| 2007 | 64 | 85 | 118 | 86 | 207 | 162 | 53 | 774 | - | - |
| 2008 | 64 | 85 | 108 | 84 | 203 | 163 | 51 | 758 | - | - |
| 2009 | 61 | 84 | 93 | 71 | 198 | 161 | 46 | 714 | - | - |
| 2010 | 61 | 81 | 95 | 75 | 203 | 165 | 48 | 728 | - | - |
| 2011 | 61 | 86 | 86 | 81 | 210 | 164 | 50 | 738 | - | - |
| 2012 | 63 | 84 | 82 | 81 | 216 | 164 | 50 | 741 | - | - |
| 2013 | 65 | 85 | 80 | 80 | 223 | 167 | 50 | 750 | - | - |
| 2014 | 64 | 86 | 75 | 82 | 228 | 164 | 48 | 747 | - | - |
| 2015 | 66 | 85 | 74 | 80 | 226 | 162 | 49 | 742 | - | - |
| 2016 | 67 | 86 | 75 | 77 | 208 | 162 | 51 | 725 | - | - |
| 2017 | 67 | 88 | 73 | 78 | 216 | 165 | 51 | 738 | - | - |
| 2018 | 69 | 92 | 63 | 80 | 223 | 169 | 52 | 747 | - | - |
| 2019 | 69 | 94 | 62 | 79 | 222 | 169 | 52 | 747 | - | - |
| 2020 | 70 | 88 | 54 | 75 | 204 | 142 | 48 | 682 | - | - |
| 2021 | 69 | 85 | 52 | 78 | 211 | 149 | 49 | 694 | - | - |
| 2022 | 70 | 88 | 49 | 78 | 209 | 155 | 50 | 700 | - | - |
| 2023 | 69 | 83 | 49 | 78 | 208 | 157 | 50 | 694 | 694 | 694 |
| 2024 | 69 | 77 | 40 | 75 | 211 | 153 | 49 | - | 673 | 674 |
| 2025 | 68 | 81 | 41 | 70 | 207 | 150 | 48 | - | 666 | 666 |
| 2026 | 69 | 80 | 38 | 67 | 209 | 146 | 48 | - | 656 | 656 |
| 2027 | 69 | 79 | 38 | 67 | 209 | 144 | 48 | - | 654 | 655 |
| 2028 | 69 | 78 | 34 | 66 | 207 | 142 | 49 | - | 645 | 632 |
| 2029 | 69 | 78 | 30 | 66 | 208 | 139 | 49 | - | 640 | 624 |
| 2030 | 69 | 78 | 23 | 61 | 207 | 137 | 50 | - | 625 | 583 |
| 2031 | 69 | 78 | 20 | 62 | 207 | 132 | 50 | - | 618 | 576 |
| 2032 | 69 | 79 | 17 | 62 | 206 | 130 | 50 | - | 612 | 567 |
| 2033 | 69 | 78 | 17 | 61 | 207 | 127 | 51 | - | 609 | 564 |
| 2034 | 69 | 78 | 13 | 60 | 209 | 127 | 51 | - | 607 | 557 |
| 2035 | 69 | 78 | 14 | 60 | 209 | 124 | 51 | - | 606 | 554 |
Note: *Historical emissions include data from NIR2023 and NIR2025, and also include LULUCF accounting contribution. Access more data on the open data portal.
- WM25: Current With Measures scenario.
- WAM25: Current With Additional Measures scenario.
- WM23: With Measures scenario published in EPR2023.
- WAM23: With Additional Measures scenario published in EPR2023 in 2023.
Long description
| Year | 2023 NIR* | WM23 | WAM23 (incl. NBCS + Ag. Measures) | 2025 NIR* | 2025 WM | 2025 WAM | 2025 WAM (incl. NBCS/Ag Measures) |
|---|---|---|---|---|---|---|---|
| 2005 | 732 | - | - | 759 | - | - | - |
| 2006 | 722 | - | - | 752 | - | - | - |
| 2007 | 751 | - | - | 778 | - | - | - |
| 2008 | 733 | - | - | 760 | - | - | - |
| 2009 | 675 | - | - | 700 | - | - | - |
| 2010 | 712 | - | - | 738 | - | - | - |
| 2011 | 727 | - | - | 755 | - | - | - |
| 2012 | 719 | - | - | 742 | - | - | - |
| 2013 | 719 | - | - | 747 | - | - | - |
| 2014 | 692 | - | - | 721 | - | - | - |
| 2015 | 725 | - | - | 746 | - | - | - |
| 2016 | 695 | - | - | 715 | - | - | - |
| 2017 | 693 | - | - | 719 | - | - | - |
| 2018 | 707 | - | - | 730 | - | - | - |
| 2019 | 697 | - | - | 722 | - | - | - |
| 2020 | 629 | - | - | 660 | - | - | - |
| 2021 | 637 | 637 | 637 | 665 | - | - | - |
| 2022 | - | 688 | 686 | 709 | - | - | - |
| 2023 | - | 637 | 632 | 655 | 655 | 655 | - |
| 2024 | - | 630 | 616 | - | 667 | 667 | - |
| 2025 | - | 624 | 602 | - | 642 | 642 | - |
| 2026 | - | 615 | 577 | - | 635 | 636 | - |
| 2027 | - | 608 | 554 | - | 632 | 633 | - |
| 2028 | - | 590 | 528 | - | 621 | 609 | - |
| 2029 | - | 577 | 506 | - | 618 | 602 | - |
| 2030 | - | 560 | 468 | - | 600 | 558 | 546 |
| 2031 | - | 556 | 457 | - | 592 | 551 | 539 |
| 2032 | - | 550 | 448 | - | 586 | 541 | 529 |
| 2033 | - | 548 | 442 | - | 584 | 538 | 527 |
| 2034 | - | 544 | 435 | - | 580 | 530 | 518 |
| 2035 | - | 541 | 423 | - | 577 | 525 | 513 |
2.1.3 Comparison to previous projections
To assess progress and methodological consistency, this section compares the current projections to those published in EPR2023.
In 2030, Canada's GHG emissions under the WM scenario (including the LULUCF accounting contribution) are projected to be 600 Mt, or 40 Mt above the WM scenario of 560 Mt presented in EPR2023. In the WAM scenario, emissions (including the LULUCF accounting contribution, NBCS, and agriculture measures) are projected to be 546 Mt in 2030, 79 Mt higher than the WAM projections included in EPR2023. These increases are partly offset by declines in emissions from the heavy industry sector, driven by tariff impacts on production.
The projected emissions have changed along with historical emissions because of improvements and refinements to data sources and methodologies, as discussed in more detail in Section A1.9.3. These revisions extend back to 2005 (Figure 2). For example, in 2021, the last year available for NIR2023, total emissions were revised upward by 24 Mt (from 670 Mt to 694 Mt), primarily due to a 22 Mt increase in the Oil and Gas sector, while other sectors only saw increases or decreases of 2 Mt or less. These changes largely reflect the adoption of updated global warming potential (GWP) factors and also significant revisions to estimates of methane emissions that incorporate atmospheric measurement data, starting with NIR2024. Section A1.9.3 provides a detailed description of these historical changes, while Table A10-2 of the 2023 to 2025 editions of the NIR shows sector-by-sector historical GHG emissions estimates for individual years.
Changes to projected emissions also reflect updates to policy coverage and modelling assumptions. Section A1.9.4 lists policies added or removed since EPR2023. Notably, this year’s projections incorporate the removal of the federal fuel charge and of the oil and gas emissions cap. In the Transportation Sector, two key adjustments stand out. First, Canada’s Electric Vehicle Availability Standard (EVAS) was incorporated into the WM case in the BTR1 projections, whereas in EPR2023 full adoption by 2035 was still treated as a WAM policy. Second, updated data shows that previous assumptions about a post-COVID rebound in demand were overstated.
In the agriculture sector, the WAM scenario no longer includes the assumption of meeting the fertilizer emissions target, a voluntary federal target to reduce emissions by 30% below 2020 levels by 2030. The projected GHG impact of existing programs targeting nitrogen management is now included in the WM scenario.
Projected LULUCF accounting contribution declined from 32 Mt in EPR2023 to 25 Mt in EPR2025 due to revisions to projected harvest rates from provinces and territories.
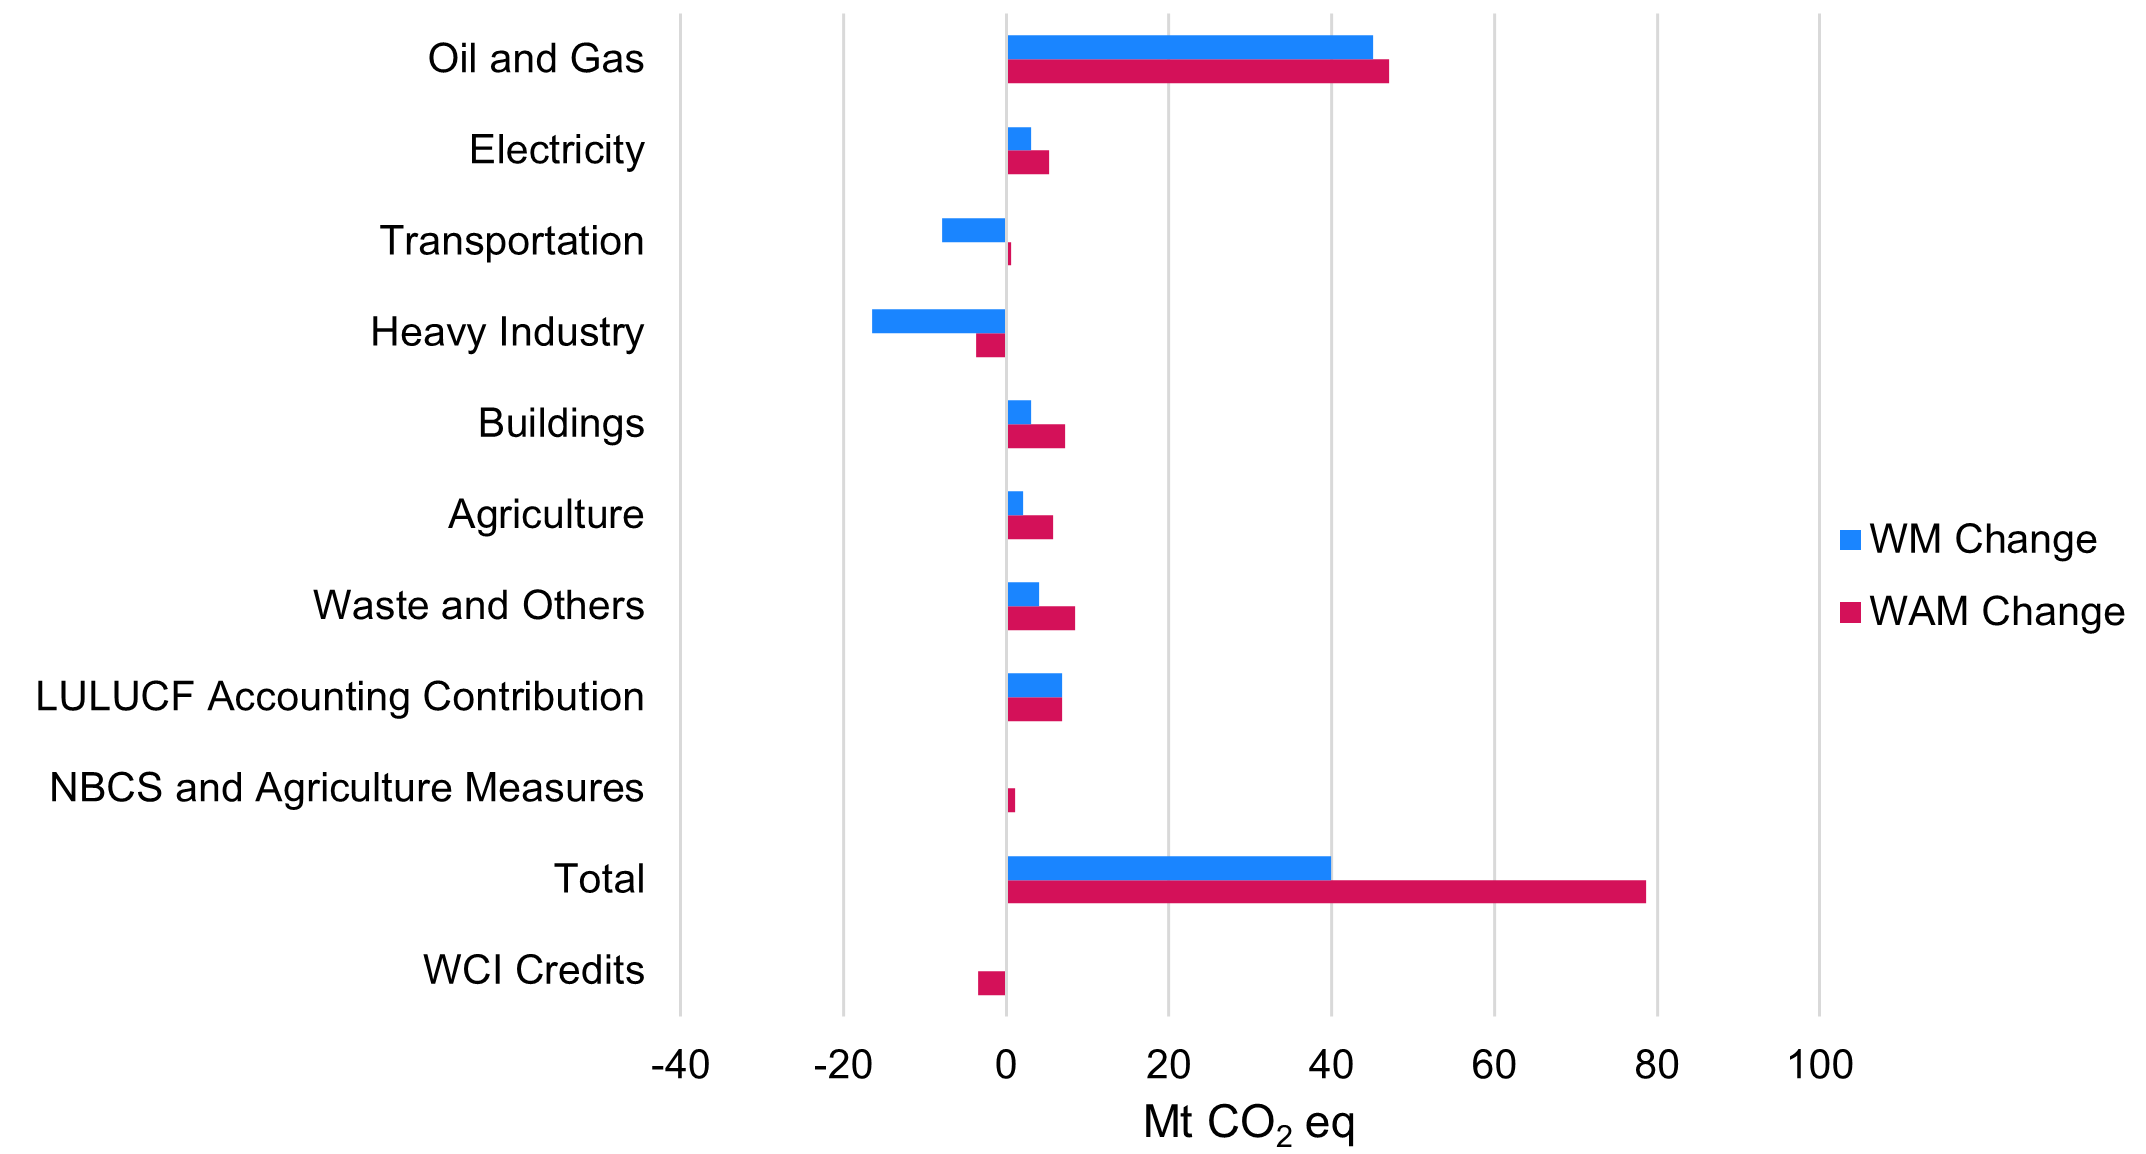
Table 3 presents changes at the economic sector level between the WM and WAM scenarios. Figure 3 illustrates the projected emissions reductions of each sector in 2030.
Oil and Gas
| Sectors | WM – EPR2023 | WM – EPR2025 | Change in WM Scenario (2023 vs 2025) | WAM – EPR2023 | WAM – EPR2025 | Change in WAM Scenario (2023 vs 2025) |
|---|---|---|---|---|---|---|
| Oil and gas | 162 | 207 | 45 | 128 | 175 | 47 |
| Electricity | 20 | 23 | 3 | 20 | 26 | 5 |
| Transportation | 144 | 137 | -8 | 137 | 138 | 1 |
| Heavy Industry | 77 | 61 | -16 | 63 | 59 | -4 |
| Buildings | 75 | 78 | 3 | 69 | 76 | 7 |
| Agriculture* | 67 | 69 | 2 | 63 | 68 | 6 |
| Waste and Others | 46 | 50 | 4 | 32 | 41 | 8 |
| LULUCF Accounting Contribution | -32 | -25 | 7 | -32 | -25 | 7 |
| NBCS and Agriculture Measures | NA | NA | NA | -13 | -12 | 1 |
| Total | 560 | 600 | 40 | 467 | 546 | 79 |
| WCI Credits** | NA | NA | NA | -1 | -4 | -4 |
Note: Numbers may not sum to the total due to rounding. Access more data on the open data portal.
* Additional emissions reductions in the WAM scenario occurring on agricultural lands are represented in the NBCS and Agriculture Measures row.
** As a result of the United States’ withdrawal from the Paris Agreement the United States is unable to participate in cooperative approaches under Article 6 of the Paris Agreement. Therefore, the net flow of WCI allowances and offset credits (imported from California into Québec) could not be considered as potential ITMOs under Article 6 of the Paris Agreement. Consequently, these net flows are excluded from the totals presented in this table. Nonetheless, Canada continues to monitor and document WCI credit flows in recognition of their contribution to a credible, transparent, and well-functioning emissions trading system.
Note: As a result of the United States’ withdrawal from the Paris Agreement, the net flow of WCI allowances and offset credits (imported from California into Québec) cannot be reported by Canada as ITMOs under Article 6 of the Paris Agreement. Consequently, these flows are excluded from the totals in the current WAM projections shown in this figure, but they were included in previous projections, as they were counted at the time of their release. Nonetheless, Canada continues to monitor and document WCI credit flows in recognition of their contribution to a credible, transparent, and well-functioning emissions trading system.
Long description
WAM Change| Scenario | Sector | Emissions |
|---|---|---|
| WM Change | Oil and Gas | 45 |
| WM Change | Electricity | 3 |
| WM Change | Transportation | -8 |
| WM Change | Heavy Industry | -16 |
| WM Change | Buildings | 3 |
| WM Change | Agriculture | 2 |
| WM Change | Waste and Others | 4 |
| WM Change | WCI Credits | NA |
| WM Change | LULUCF Accounting Contribution | 7 |
| WM Change | NBCS and Agriculture Measures | NA |
| WM Change | Total | 40 |
| WAM Change | Oil and Gas | 47 |
| WAM Change | Electricity | 5 |
| WAM Change | Transportation | 1 |
| WAM Change | Heavy Industry | -4 |
| WAM Change | Buildings | 7 |
| WAM Change | Agriculture | 6 |
| WAM Change | Waste and Others | 8 |
| WAM Change | WCI Credits | -4 |
| LULUCF Accounting Contribution | 7 | |
| WAM Change | NBCS and Agriculture Measures | 1 |
| WAM Change | Total | 79 |
2.1.4 Decomposition of projected change in Canada's GHG emissions
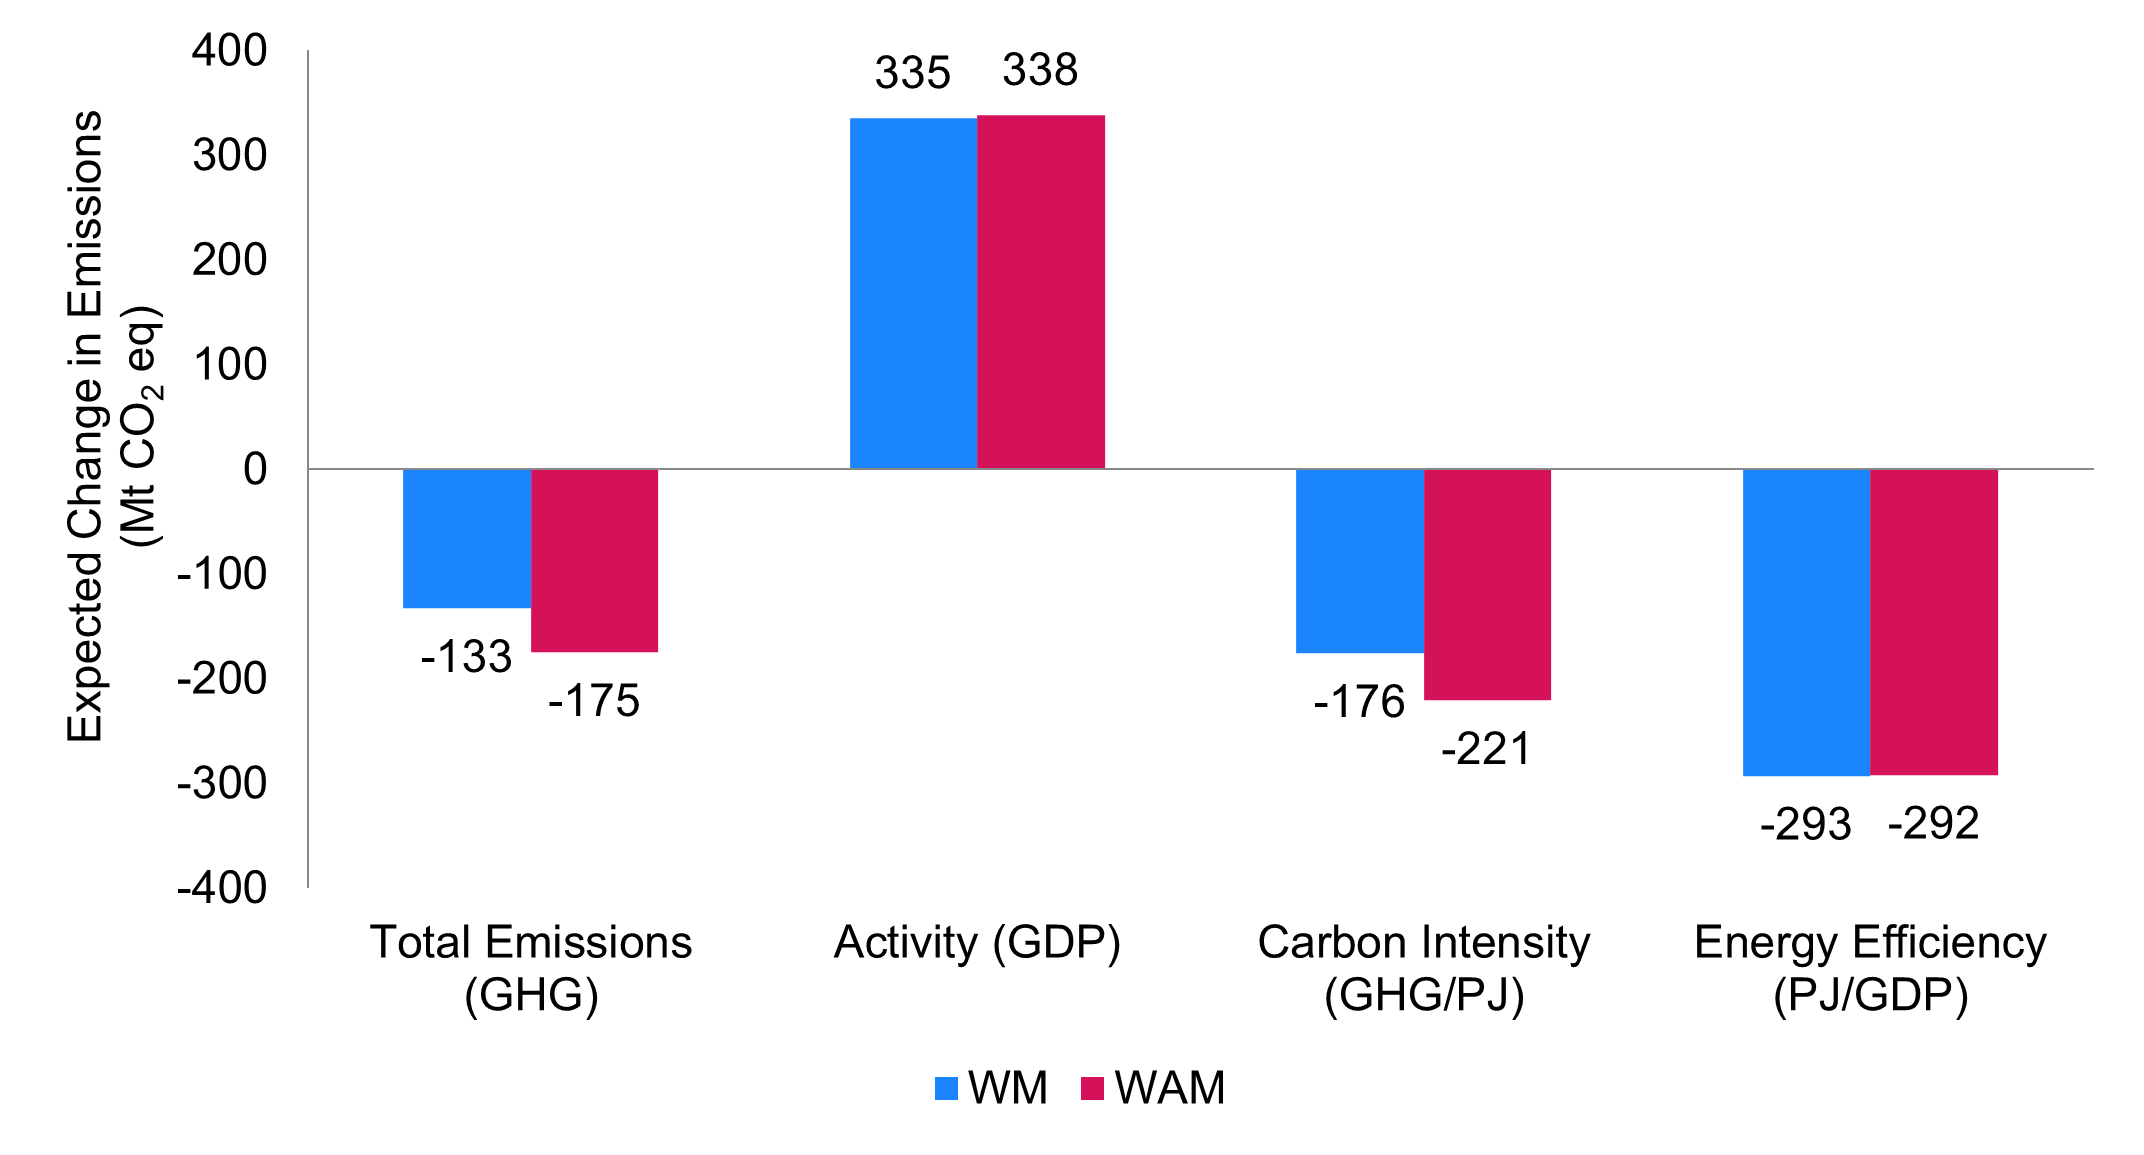
This decomposition analysis explores how different factors contribute to trends in Canada’s historical and projected GHG emissions under the WM and WAM scenarios (Figure 4).
In both scenarios from 2005 to 2030, there is a significant decoupling of economic growth and combustion emissions. Upward pressure on GHG emission projections arising from GDP growth is offset by the switch to cleaner and more efficient energy use. In the WAM scenario, the impact of economic activity adds 338 Mt. This is more than offset by a combined reduction of 513 Mt from lower carbon intensity and greater energy efficiency.
- The Activity Effect measures the impact of economic growth, which is estimated to be 53% over the 2005 to 2030 period
- On its own, this growth is projected to lead to 335 Mt of additional GHG emissions in 2030 in the WM scenario and 338 Mt in the WAM scenario
- The Carbon Intensity Effect measures changes in the carbon emission coefficient of energy
- The shift to cleaner fuels such as the replacement of coal-fired electricity with cleaner sources, as well as measures to reduce fugitive and process emissions, are projected to have a significant impact, reducing emissions by 176 Mt in 2030 in the WM scenario and 221 Mt in the WAM scenario
- The Energy Efficiency Effect measures changes in energy efficiency at the subsector level
- The analysis shows that the uptake of energy-efficient technologies, induced by policies, consumer responses to energy prices, and stock turnover, reduces emissions by 293 Mt in 2030 in the WM scenario and 292 Mt in the WAM scenario
Note: Numbers may not sum to the total due to rounding.
Long description
| Category | 2030 Expected Change in Emissions, WM (Mt CO2 eq) | 2030 Expected Change in Emissions, WAM (Mt CO2 eq) |
|---|---|---|
| Total Emissions (GHG) | -133 | -175 |
| Activity (GDP) | 335 | 338 |
| Carbon Intensity (GHG/PJ) | -176 | -221 |
| Energy Efficiency (PJ/GDP) | -293 | -292 |
2.2 Sectoral emissions analysis
This section presents Canada’s emissions broken down by the following economic sectors: Oil and Gas (including details on emissions attributable to oil and gas exports), Transportation, Electricity, Heavy Industry, Buildings, Agriculture, and Waste and Others (Others includes coal production, light manufacturing, construction and forest resources). Details about emissions reductions resulting from carbon capture and storage (CCS) are presented at the sector level in Section 2.2.8. Finally, foreign passenger and foreign freight emissions are not included in the national total, consistent with the 2006 IPCC Guidelines for National Greenhouse Gas Inventories. They are, however, presented separately in Section 2.2.9.
2.2.1 Oil and Gas
Production, pipeline transportation, processing, refining, and distribution of oil and gas products all contribute to emissions in the Oil and Gas sector. In 2023, this sector was the largest source of GHG emissions in Canada, accounting for 30% of the national total, excluding the LULUCF accounting contribution. Oil and Gas emissions have increased 91 Mt since 1990, largely due to oil sands expansion. Although emissions peaked in 2014, they declined by 14 Mt between 2019 and 2023, reflecting the impact of federal and provincial methane regulations introduced in 2020.
The sector’s emissions are driven by oil and gas production forecasts from the CER. This year’s production and price forecasts use a preliminary version of the Current Measures scenario from the CER’s 2026 Energy Future (EF2026) outlook.
In the WM scenario, over the projection period, emissions from increasing production of oil sands, natural gas, and liquefied natural gas (LNG) are partly offset by declining emission intensities across subsectors. Measures such as regulations on methane emissions in the upstream Oil and Gas sector, the industrial fuel charge, the Clean Fuel Regulations (CFR), and CCS technologies are projected to constrain emissions.
The WAM scenario reflects an ambitious policy environment, with substantial emissions abatement due to enhanced decarbonization, energy efficiency, and methane reductions. A breakdown of emissions by subsector is provided below.
It is important to note that the Enhanced Oil and Gas Methane Regulations targeting 75% reduction in methane emissions from the oil and gas sector by 2030 from 2012 levels, were finalized on December 16, 2025, which was too late for inclusion in the WM scenario, and thus they were included only in the WAM scenario.
Across all subsectors, emissions are shaped by production trends, technological adoption, and policy measures. While output continues to grow, emissions are increasingly constrained by federal and provincial initiatives. Table 4 provides detailed subsector data, and Figure 5 to Figure 9 illustrate emissions and intensity trends under the WM and WAM scenarios.
| Subsector | 1990 | 2005 | 2023 | 2026a | 2030a | 2035a | 2026b | 2030b | 2035b |
|---|---|---|---|---|---|---|---|---|---|
| Natural Gas Production and Processing | 38 | 75 | 52 | 52 | 53 | 55 | 52 | 40 | 39 |
| Conventional Oil | 32 | 48 | 38 | 34 | 32 | 31 | 34 | 21 | 20 |
| Light Oil Production | 19 | 22 | 21 | 19 | 19 | 17 | 19 | 10 | 9 |
| Heavy Oil Production | 13 | 25 | 16 | 13 | 12 | 11 | 13 | 9 | 9 |
| Frontier Oil Production | 0 | 2 | 1 | 2 | 2 | 2 | 2 | 2 | 2 |
| Oil Sands | 15 | 37 | 89 | 94 | 95 | 95 | 94 | 89 | 92 |
| In-Situ | 5 | 13 | 47 | 49 | 53 | 53 | 49 | 50 | 52 |
| Mining and Extraction | 3 | 7 | 17 | 20 | 20 | 20 | 20 | 20 | 20 |
| Upgraders | 8 | 17 | 24 | 25 | 23 | 22 | 25 | 20 | 20 |
| Oil and Natural Gas Transmission | 12 | 12 | 11 | 11 | 12 | 12 | 11 | 10 | 10 |
| Downstream Oil and Gas | 20 | 22 | 18 | 16 | 14 | 13 | 16 | 13 | 13 |
| Petroleum Products | 18 | 20 | 17 | 15 | 13 | 12 | 15 | 12 | 12 |
| Natural Gas Distribution | 2 | 2 | 1 | 1 | 1 | 1 | 1 | 1 | 1 |
| LNG Production | 0 | 0 | 0 | 1 | 2 | 3 | 1 | 2 | 3 |
| Total | 117 | 194 | 208 | 209 | 207 | 209 | 208 | 175 | 177 |
Note: Numbers may not sum to the total due to rounding. Historical data up to 2023 are sourced from NIR2025. Data from 2024 to 2035 are modelled projections developed using ECCC’s analytical framework. Access more data on the open data portal.
a Projections under the WM scenario.
b Projections under the WAM scenario.
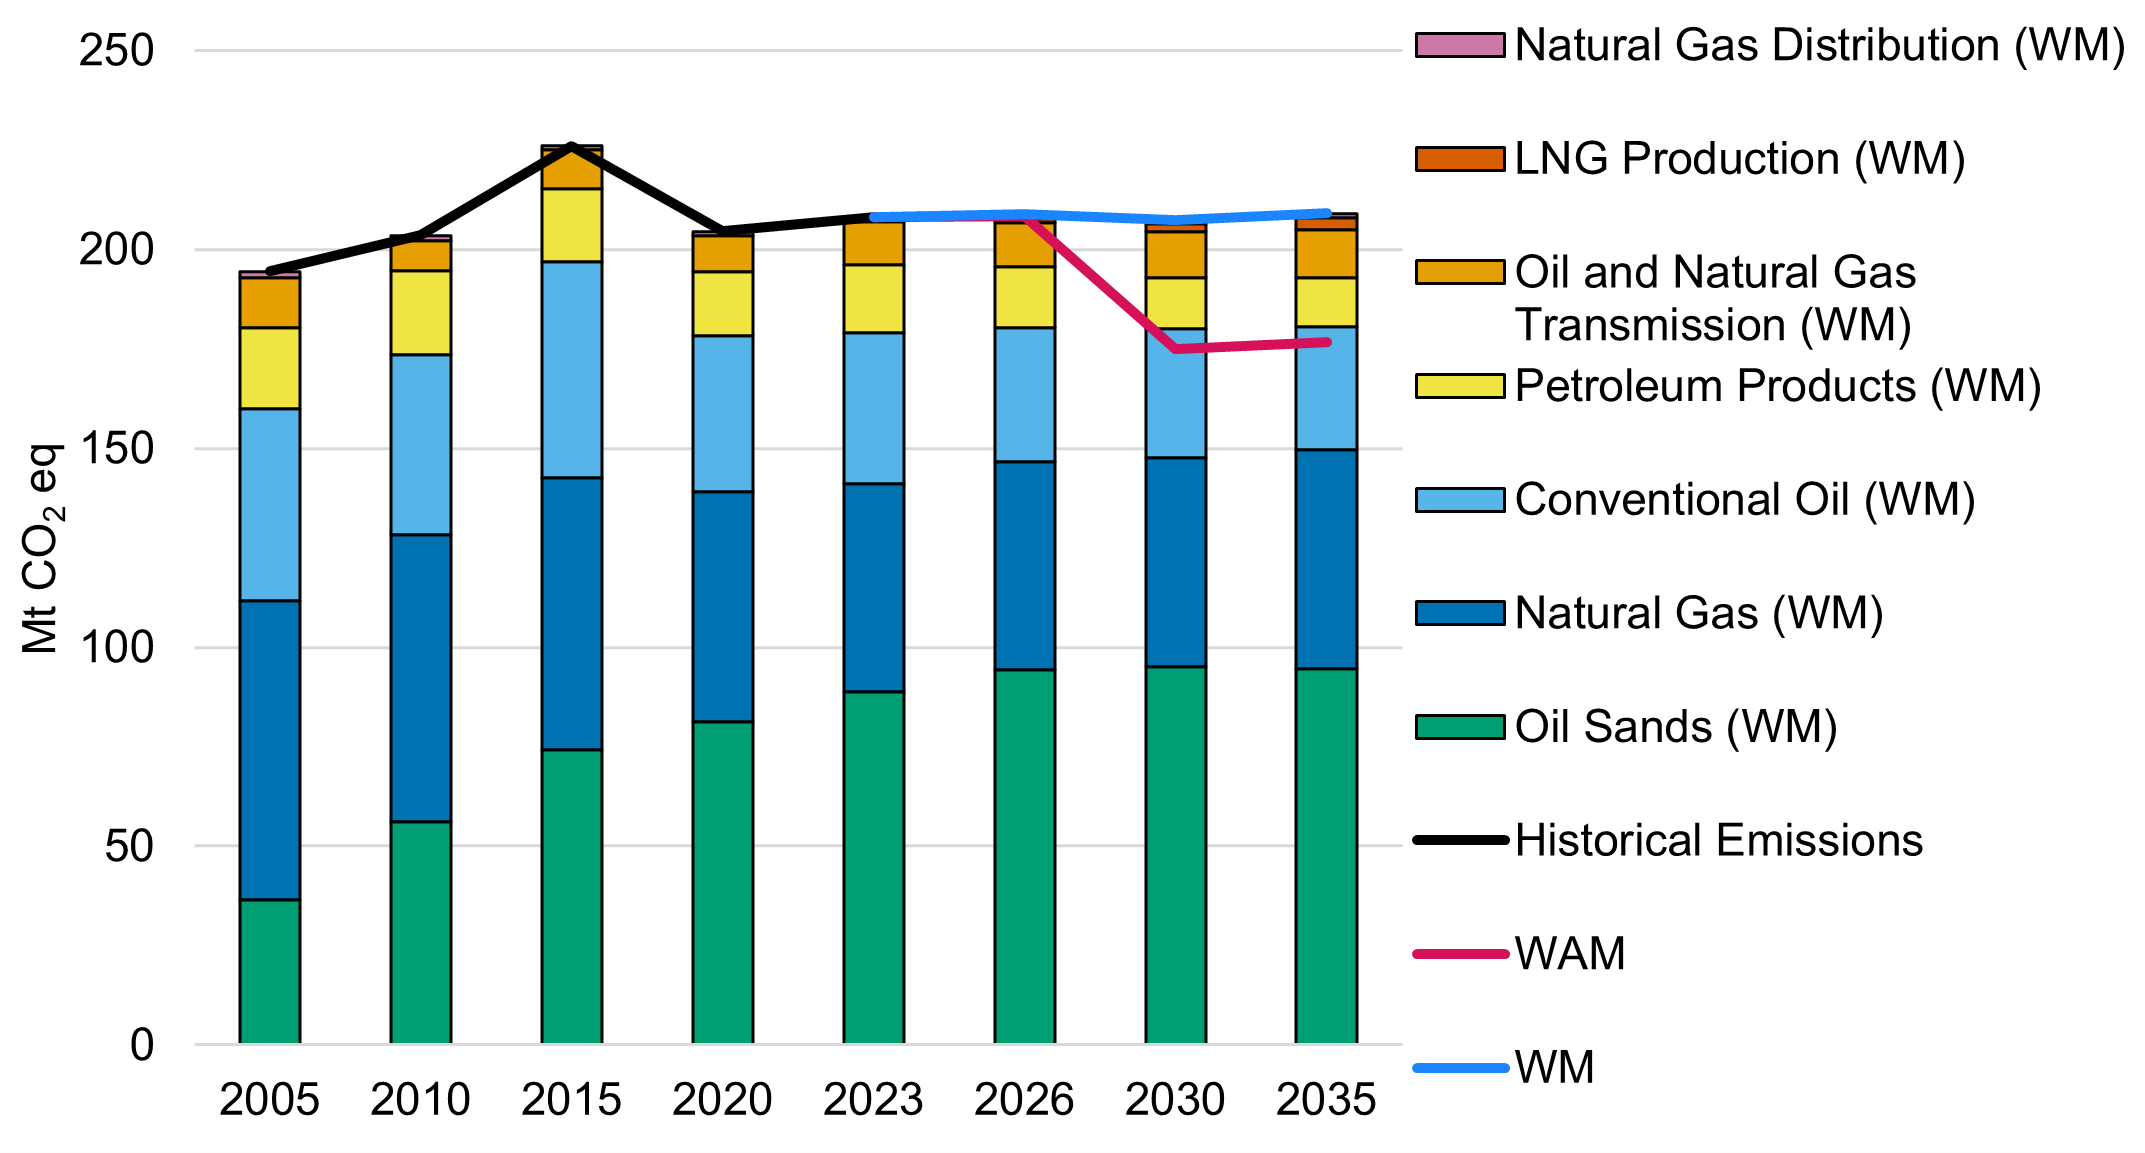
Note: Historical emissions data come from NIR2025. Access more data on the open data portal.
Long description
| Year | Conventional Oil (WM) | LNG Production (WM) | Natural Gas Distribution (WM) | Natural Gas (WM) | Oil and Natural Gas Transmission (WM) | Oil Sands (WM) | Petroleum Products (WM) | Historical Emissions | WM | WAM |
|---|---|---|---|---|---|---|---|---|---|---|
| 2005 | 48 | 0 | 2 | 75 | 12 | 37 | 20 | 194 | - | - |
| 2010 | 45 | 0 | 1 | 72 | 7 | 56 | 21 | 203 | - | - |
| 2015 | 54 | 0 | 1 | 68 | 10 | 74 | 18 | 226 | - | - |
| 2020 | 39 | 0 | 1 | 58 | 9 | 81 | 16 | 204 | - | - |
| 2023 | 38 | 0 | 1 | 52 | 11 | 89 | 17 | 208 | 208 | 208 |
| 2026 | 34 | 1 | 1 | 52 | 11 | 94 | 15 | - | 209 | 208 |
| 2030 | 32 | 2 | 1 | 53 | 12 | 95 | 13 | - | 207 | 175 |
| 2035 | 31 | 3 | 1 | 55 | 12 | 95 | 12 | - | 209 | 177 |
2.2.1.1 Upstream oil and gas production
This subsector includes extraction, production, and processing of conventional and unconventional oil and gas. Emissions in this sector are primarily influenced by two opposing trends: increasing production and declining emissions intensity (open data Table A17). Oil sands and natural gas output are projected to grow steadily, supported by market conditions and investment. Under the WM scenario, emissions intensity declines due to the industrial fuel charge, CFR, and CCS deployment. Additional reductions are driven by technological advancements, provincial regulations, such as the CleanBC plan, and by federal and provincial methane regulations.
In the WAM scenario, further reductions are achieved through Enhanced Oil and Gas Methane Regulations and funding programs (such as the Canada Growth Fund and carbon revenue recycling mechanisms). The Enhanced Oil and Gas Methane Regulations, effective in 2028, target a 75% reduction from 2012 levels, mostly in conventional operations.
Lower CFR credit prices in the WAM scenario reduce compliance costs, encouraging development. Figure 6 illustrates the shift toward in-situ production in the forecast, while Figure 7 shows non-upgraded oil sands representing a dominant portion of oil sands production in the forecast period.

Long description
| Year | Scenario | Sector | Production (MMb/d) |
|---|---|---|---|
| 2005 | WM | In-Situ | 0.29 |
| 2005 | WM | Oil Sands Mining | 0.63 |
| 2005 | WM | Primary Oil Sands | 0.15 |
| 2023 | WM | In-Situ | 1.55 |
| 2023 | WM | Oil Sands Mining | 1.65 |
| 2023 | WM | Primary Oil Sands | 0.20 |
| 2026 | WM | In-Situ | 1.68 |
| 2026 | WM | Oil Sands Mining | 1.72 |
| 2026 | WM | Primary Oil Sands | 0.22 |
| 2030 | WM | In-Situ | 1.83 |
| 2030 | WM | Oil Sands Mining | 1.74 |
| 2030 | WM | Primary Oil Sands | 0.23 |
| 2035 | WM | In-Situ | 1.90 |
| 2035 | WM | Oil Sands Mining | 1.79 |
| 2035 | WM | Primary Oil Sands | 0.24 |
| 2005 | WAM | In-Situ | 0.29 |
| 2005 | WAM | Oil Sands Mining | 0.63 |
| 2005 | WAM | Primary Oil Sands | 0.15 |
| 2023 | WAM | In-Situ | 1.55 |
| 2023 | WAM | Oil Sands Mining | 1.65 |
| 2023 | WAM | Primary Oil Sands | 0.20 |
| 2026 | WAM | In-Situ | 1.68 |
| 2026 | WAM | Oil Sands Mining | 1.72 |
| 2026 | WAM | Primary Oil Sands | 0.22 |
| 2030 | WAM | In-Situ | 1.83 |
| 2030 | WAM | Oil Sands Mining | 1.74 |
| 2030 | WAM | Primary Oil Sands | 0.23 |
| 2035 | WAM | In-Situ | 1.91 |
| 2035 | WAM | Oil Sands Mining | 1.80 |
| 2035 | WAM | Primary Oil Sands | 0.24 |
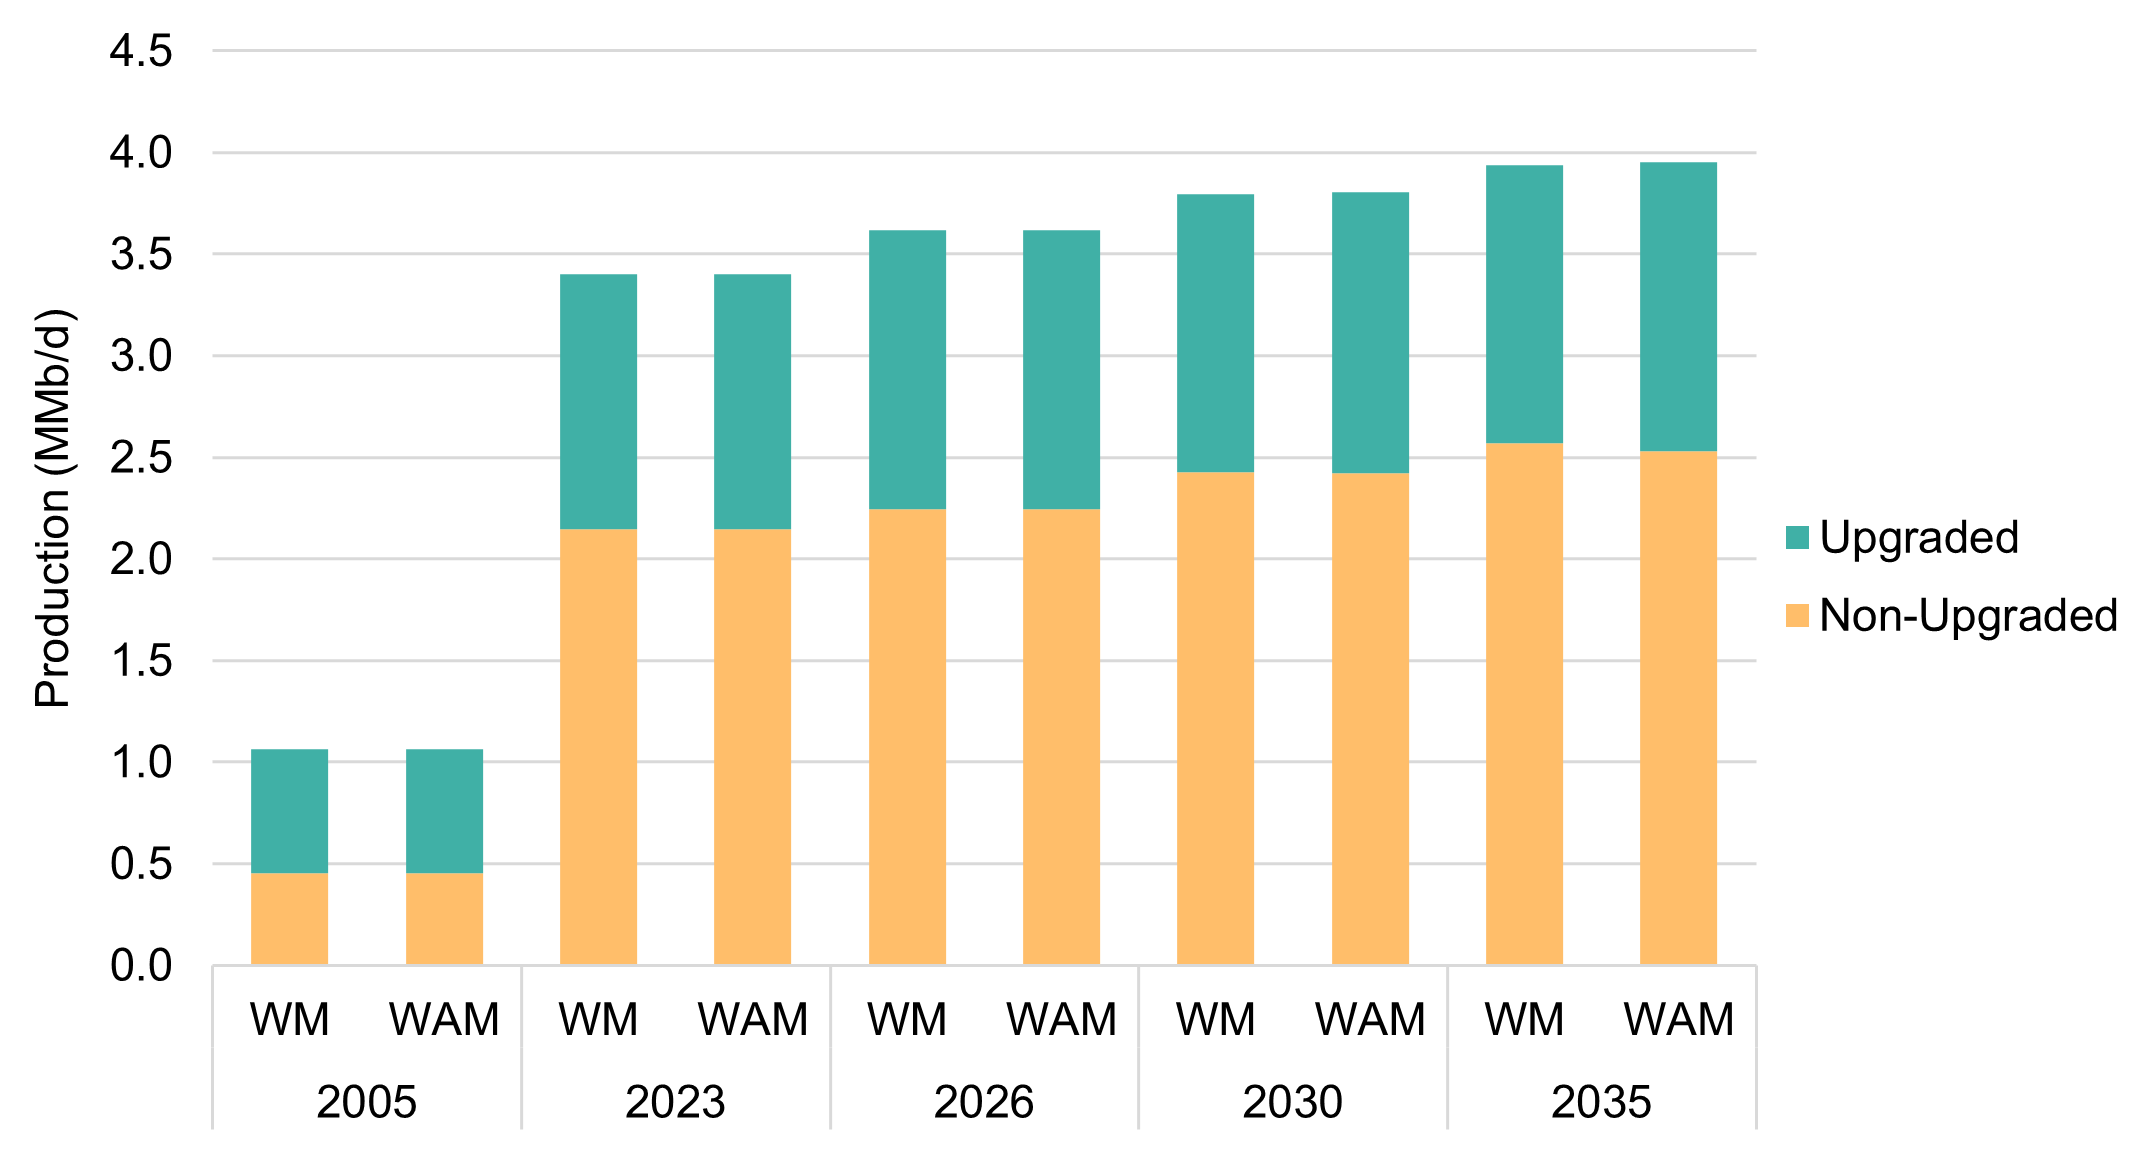
Long description
| Year | Scenario | Sector | Production (MMb/d) |
|---|---|---|---|
| 2005 | WM | Upgraded | 0.61 |
| 2023 | WM | Upgraded | 1.26 |
| 2026 | WM | Upgraded | 1.37 |
| 2030 | WM | Upgraded | 1.37 |
| 2035 | WM | Upgraded | 1.37 |
| 2005 | WM | Non-Upgraded | 0.45 |
| 2023 | WM | Non-Upgraded | 2.15 |
| 2026 | WM | Non-Upgraded | 2.25 |
| 2030 | WM | Non-Upgraded | 2.43 |
| 2035 | WM | Non-Upgraded | 2.57 |
| 2005 | WAM | Upgraded | 0.61 |
| 2023 | WAM | Upgraded | 1.26 |
| 2026 | WAM | Upgraded | 1.37 |
| 2030 | WAM | Upgraded | 1.38 |
| 2035 | WAM | Upgraded | 1.42 |
| 2005 | WAM | Non-Upgraded | 0.45 |
| 2023 | WAM | Non-Upgraded | 2.15 |
| 2026 | WAM | Non-Upgraded | 2.25 |
| 2030 | WAM | Non-Upgraded | 2.42 |
| 2035 | WAM | Non-Upgraded | 2.53 |
Emissions intensity in the oil sands is influenced by extraction method, infrastructure age, and reservoir quality. In-situ extraction, where bitumen is separated underground, is generally more emissions-intensive than surface mining, as shown in Figure 8. As production grew significantly between 2005 and 2023, intensity remained relatively stable. Starting in 2024, emissions from mining operations are expected to rise due to the replacement of petroleum coke-fired boilers with high-efficiency natural gas cogeneration units at Suncor’s Base Plant. While this upgrade improves energy efficiency, it also increases reported cogeneration emissions.
Additional upward pressure on emissions intensity is expected from declining reservoir quality, aging infrastructure, and a continued shift towards in-situ operations. Future production growth is projected to come from brownfield expansions and new greenfield developments that incorporate more energy-efficient technologies. These newer facilities are also more likely to adopt emerging technologies within the unconventional crude oil sector, helping to offset some of the intensity increases.
Emissions intensity is projected to decline under both the WM and WAM scenarios, driven by stronger policy measures and technology adoption. Key drivers include the CFR, Enhanced Oil and Gas Methane Regulations, the industrial fuel charge, and the carbon capture, utilization and storage (CCUS) investment tax credit (ITC). These measures aim to reduce emissions while supporting continued production growth.
Figure 8 and Figure 9 illustrate projected emissions intensity trends under the WM and WAM scenarios, reflecting the combined influence of policy, technology, and operational changes across the oil sands sector.
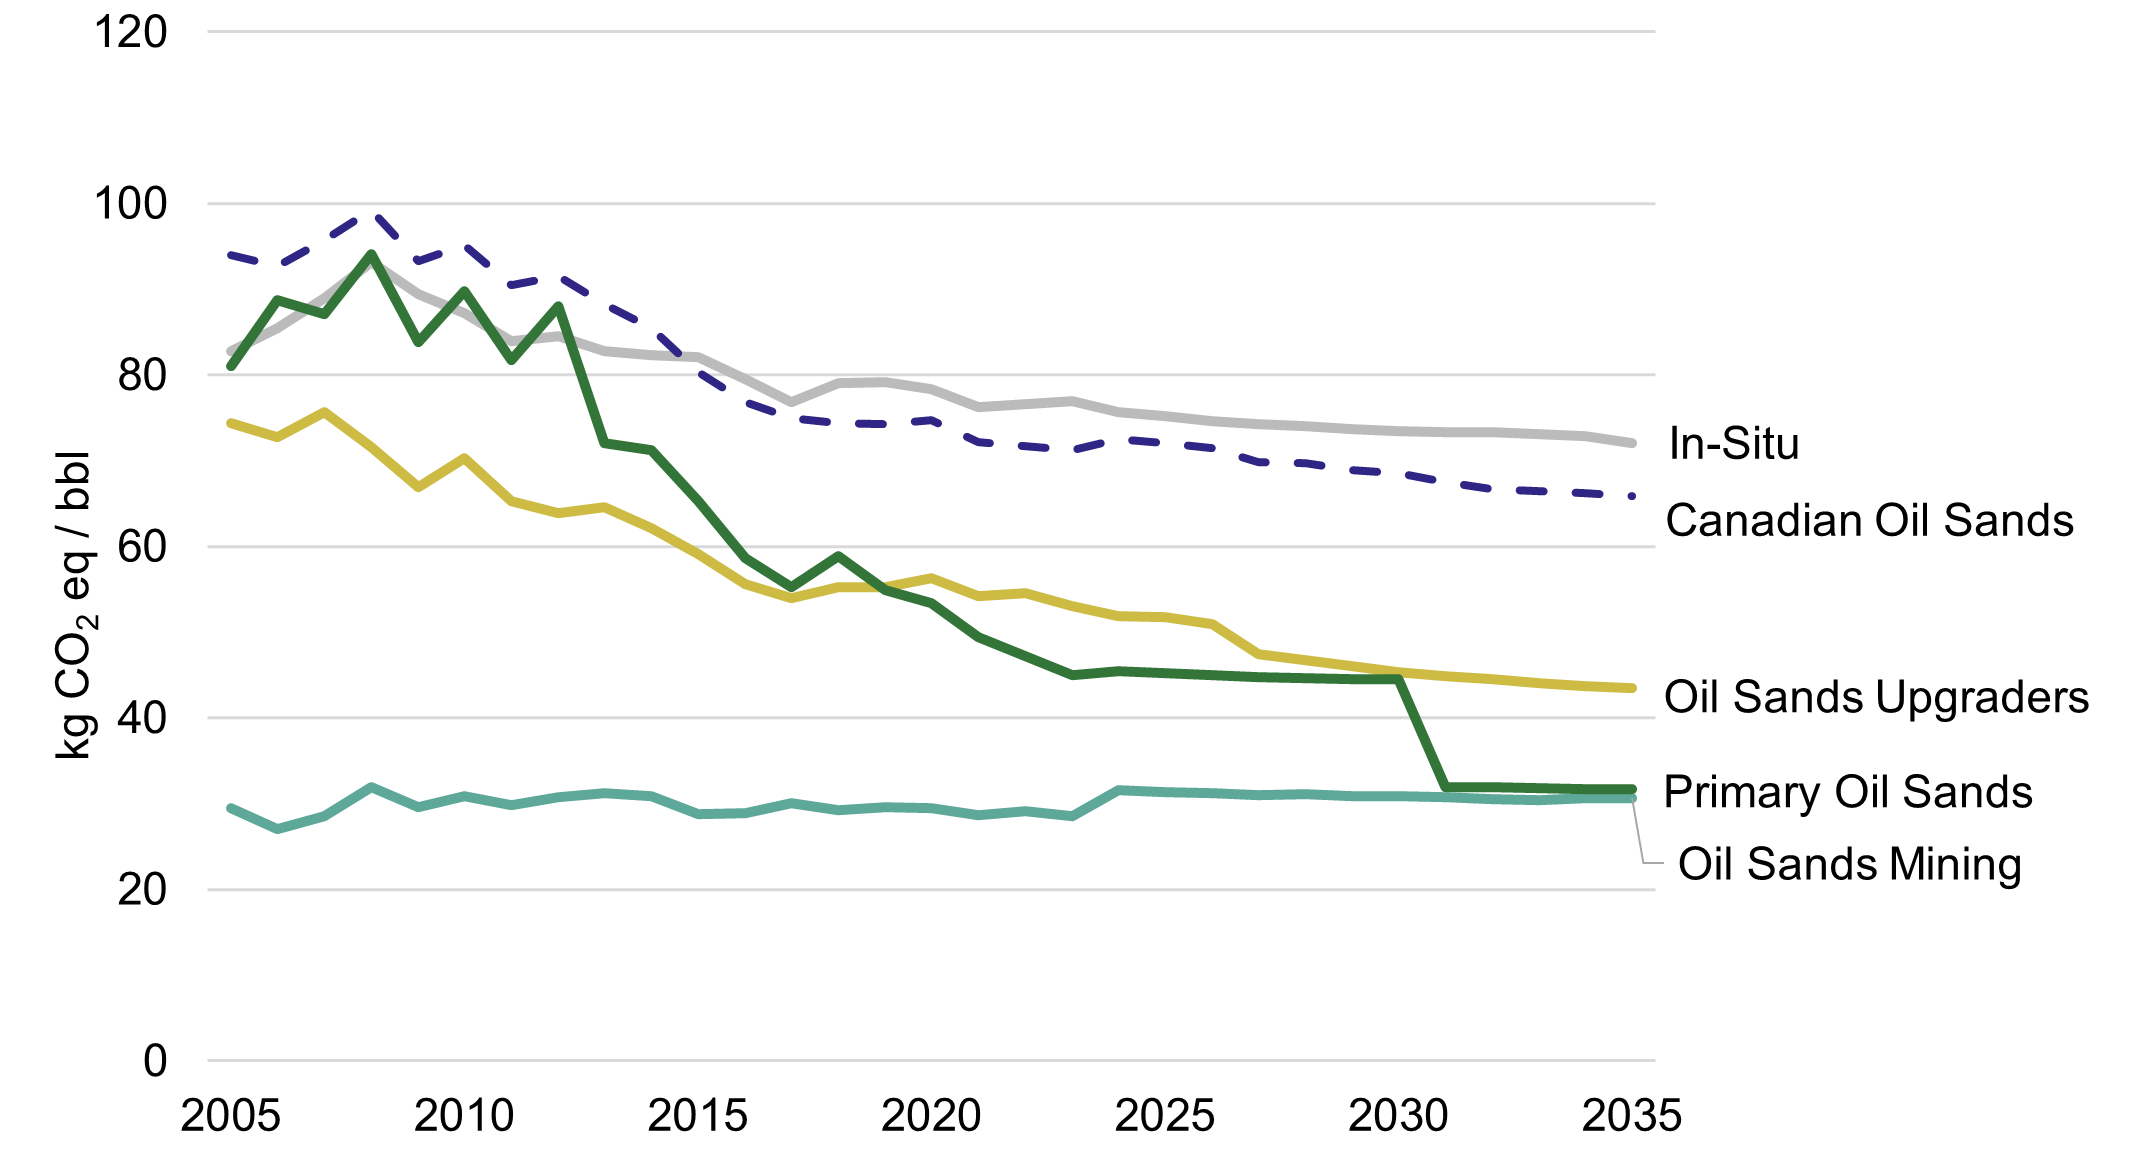
Note: Historical emissions data come from NIR2025. In-situ includes production from cyclic steam stimulation (CSS) and steam assisted gravity drainage (SAGD). Canadian oil sands include emissions from oil sands upgraders, but not the barrels of synthetic crude oil produced by upgraders, as this would lead to double counting of bitumen that is first extracted and then upgraded.
Long description
| Year | In-Situ | Canadian Oil Sands | Oil Sands Mining | Oil Sands Upgraders | Primary Oil Sands |
|---|---|---|---|---|---|
| 2005 | 82.8 | 94.0 | 29.5 | 74.4 | 81.0 |
| 2006 | 85.4 | 93.0 | 27.0 | 72.7 | 88.7 |
| 2007 | 88.9 | 96.0 | 28.6 | 75.6 | 87.1 |
| 2008 | 93.1 | 99.0 | 32.0 | 71.6 | 94.1 |
| 2009 | 89.5 | 93.0 | 29.6 | 66.9 | 83.8 |
| 2010 | 87.3 | 95.0 | 30.9 | 70.3 | 89.8 |
| 2011 | 83.9 | 90.0 | 29.8 | 65.3 | 81.7 |
| 2012 | 84.6 | 91.6 | 30.8 | 63.9 | 88.0 |
| 2013 | 82.8 | 88.0 | 31.2 | 64.6 | 72.1 |
| 2014 | 82.3 | 85.0 | 30.8 | 62.1 | 71.2 |
| 2015 | 82.1 | 80.0 | 28.8 | 59.1 | 65.3 |
| 2016 | 79.5 | 77.0 | 28.9 | 55.6 | 58.6 |
| 2017 | 76.8 | 75.0 | 30.0 | 54.0 | 55.3 |
| 2018 | 79.0 | 74.0 | 29.3 | 55.3 | 58.8 |
| 2019 | 79.2 | 74.0 | 29.6 | 55.3 | 54.9 |
| 2020 | 78.4 | 75.0 | 29.5 | 56.3 | 53.4 |
| 2021 | 76.3 | 72.1 | 28.7 | 54.3 | 49.5 |
| 2022 | 76.6 | 71.8 | 29.1 | 54.6 | 47.2 |
| 2023 | 76.9 | 71.2 | 28.6 | 53.1 | 45.0 |
| 2024 | 75.6 | 72.5 | 31.6 | 51.9 | 45.5 |
| 2025 | 75.2 | 72.1 | 31.3 | 51.7 | 45.2 |
| 2026 | 74.6 | 71.4 | 31.2 | 50.9 | 45.0 |
| 2027 | 74.3 | 69.8 | 31.0 | 47.5 | 44.8 |
| 2028 | 74.1 | 69.7 | 31.1 | 46.8 | 44.7 |
| 2029 | 73.7 | 68.9 | 30.9 | 46.0 | 44.6 |
| 2030 | 73.4 | 68.5 | 30.9 | 45.4 | 44.5 |
| 2031 | 73.4 | 67.6 | 30.7 | 44.9 | 32.0 |
| 2032 | 73.3 | 66.7 | 30.5 | 44.5 | 31.9 |
| 2033 | 73.1 | 66.5 | 30.5 | 44.1 | 31.8 |
| 2034 | 72.8 | 66.3 | 30.6 | 43.7 | 31.7 |
| 2035 | 72.1 | 65.9 | 30.6 | 43.4 | 31.7 |
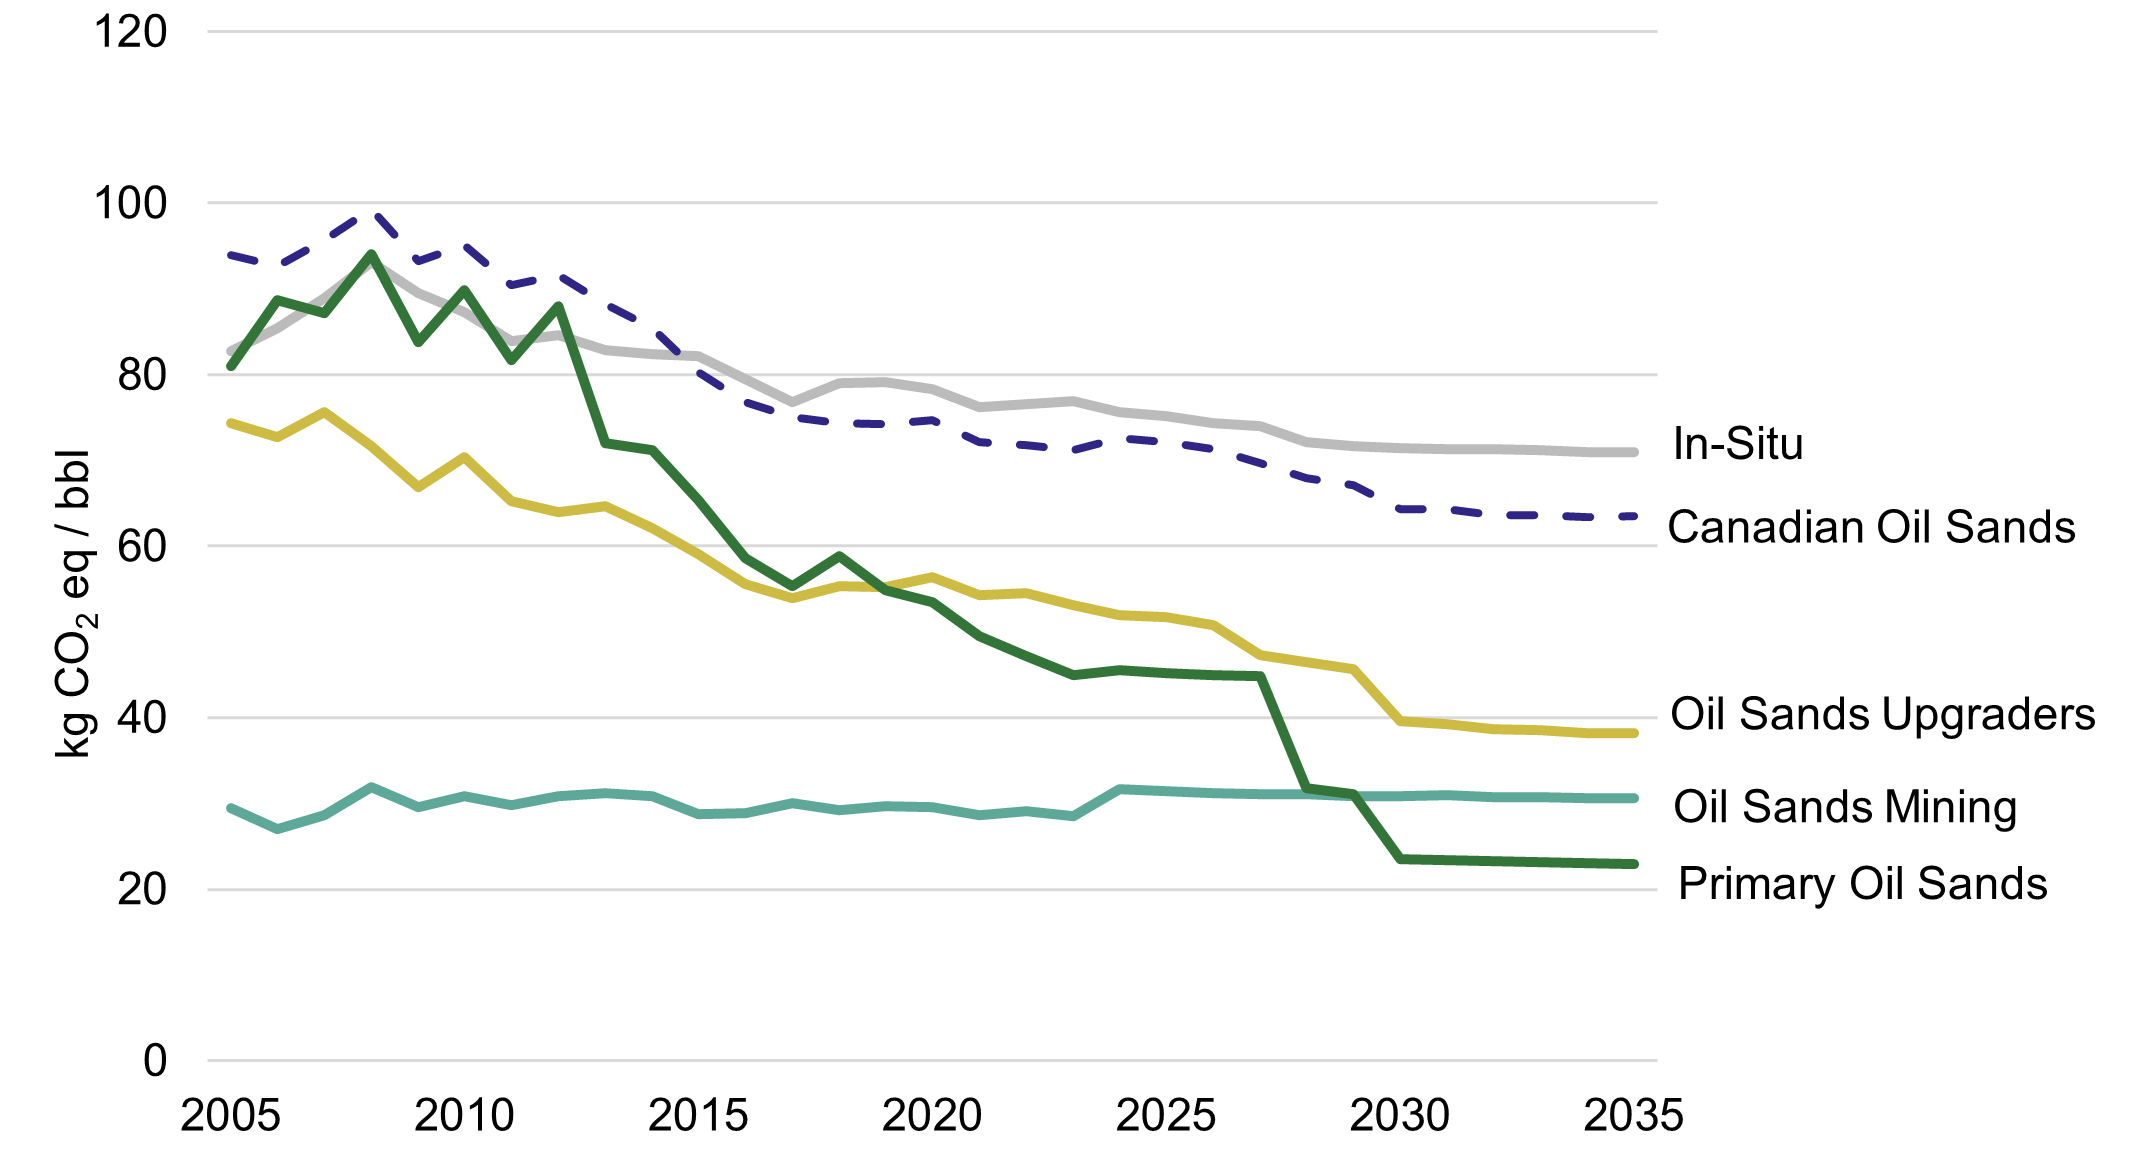
Note: Historical emissions data come from NIR2025. In-situ includes production from CSS and SAGD. Canadian oil sands include emissions from oil sands upgraders, but not the barrels of synthetic crude oil produced by upgraders, as this would lead to double counting of bitumen that is first extracted and then upgraded.
Long description
| Year | In-Situ | Canadian Oil Sands | Oil Sands Mining | Oil Sands Upgraders | Primary Oil Sands |
|---|---|---|---|---|---|
| 2005 | 82.8 | 94.0 | 29.5 | 74.4 | 81.0 |
| 2006 | 85.4 | 93.0 | 27.0 | 72.7 | 88.7 |
| 2007 | 88.9 | 96.0 | 28.6 | 75.6 | 87.1 |
| 2008 | 93.1 | 99.0 | 32.0 | 71.6 | 94.1 |
| 2009 | 89.5 | 93.0 | 29.6 | 66.9 | 83.8 |
| 2010 | 87.3 | 95.0 | 30.9 | 70.3 | 89.8 |
| 2011 | 83.9 | 90.0 | 29.8 | 65.3 | 81.7 |
| 2012 | 84.6 | 91.6 | 30.8 | 63.9 | 88.0 |
| 2013 | 82.8 | 88.0 | 31.2 | 64.6 | 72.1 |
| 2014 | 82.3 | 85.0 | 30.8 | 62.1 | 71.2 |
| 2015 | 82.1 | 80.0 | 28.8 | 59.1 | 65.3 |
| 2016 | 79.5 | 77.0 | 28.9 | 55.6 | 58.6 |
| 2017 | 76.8 | 75.0 | 30.0 | 54.0 | 55.3 |
| 2018 | 79.0 | 74.0 | 29.3 | 55.3 | 58.8 |
| 2019 | 79.2 | 74.0 | 29.6 | 55.3 | 54.9 |
| 2020 | 78.4 | 75.0 | 29.5 | 56.3 | 53.4 |
| 2021 | 76.3 | 72.1 | 28.7 | 54.3 | 49.5 |
| 2022 | 76.6 | 71.8 | 29.1 | 54.6 | 47.2 |
| 2023 | 76.9 | 71.2 | 28.6 | 53.1 | 45.0 |
| 2024 | 75.7 | 72.6 | 31.6 | 51.9 | 45.5 |
| 2025 | 75.2 | 72.2 | 31.4 | 51.7 | 45.2 |
| 2026 | 74.4 | 71.3 | 31.2 | 50.8 | 45.0 |
| 2027 | 74.0 | 69.7 | 31.0 | 47.3 | 44.8 |
| 2028 | 72.1 | 68.0 | 31.0 | 46.4 | 31.8 |
| 2029 | 71.7 | 67.1 | 30.9 | 45.7 | 31.1 |
| 2030 | 71.4 | 64.3 | 30.9 | 39.6 | 23.6 |
| 2031 | 71.4 | 64.3 | 30.9 | 39.3 | 23.4 |
| 2032 | 71.3 | 63.6 | 30.7 | 38.7 | 23.3 |
| 2033 | 71.2 | 63.6 | 30.7 | 38.6 | 23.2 |
| 2034 | 71.0 | 63.4 | 30.6 | 38.2 | 23.0 |
| 2035 | 71.0 | 63.5 | 30.6 | 38.2 | 22.9 |
2.2.1.2 Transmission and distribution of oil and gas
Emissions from transmission and distribution of oil and gas are projected to remain relatively stable under the WM scenario, as shown in Table 4. This reflects the CER’s assumptions regarding incremental infrastructure development. Under the WAM scenario, emissions decline modestly due to the Enhanced Oil and Gas Methane Regulations.
2.2.1.3 Petroleum refining and upgrading
Emissions from petroleum refining and upgrading decline in both the WM and WAM scenarios (open data Table A18), primarily due to CCS deployment. Projects such as Shell Quest and the Alberta Carbon Trunk Line contribute significantly. Refining and upgrading offer low-cost CCS opportunities, with over 3 Mt of capacity expected by 2030. Under the WAM scenario, emissions decline further due to additional investments from the Canada Growth Fund and Output-Based Pricing System (OBPS) revenues.
2.2.1.4 Upstream emissions attributable to exports
Canada’s GHG projections follow territorial accounting. All extraction, processing, upgrading and transmission emissions occur in Canada and are already included in the Oil and Gas sector totals. This subsection provides additional information on decomposition of emissions associated with production of oil and gas products for domestic consumption versus for exports. Importantly, the national totals reported elsewhere in this report remain unchanged.
As outlined in the Climate Competitiveness Strategy, the Government of Canada “will develop and communicate new metrics to show how companies and households are reducing their carbon footprint, how the clean economy is growing, and how exports are tracking to achieve world-leading emissions intensity.”
This first round of reporting focuses on emissions associated with oil and gas produced to meet international demand. Future iterations will progressively expand to other traded emissions sources, such as heavy industries, low-carbon fuels, and electricity. The decision to report on this sector first is based on the data that are currently available. Moving forward, Canada will continue to refine and expand its methodology for reporting on the emissions embodied in trade, notably from oil and gas, and will monitor how clean energy and technology exports support global decarbonization. Details about the methodology are provided in Section A1.5.
Figure 10 and Figure 11 show that between 2005 and 2035, emissions intensity of production for oil and gas decline, while the value of exports increases for oil in both the WM and WAM scenarios.
Over the 2005 to 2023 period, the export value of oil increased by 49%, while that of natural gas declined by 84%, in part because of the expansion of shale gas production in the US. In both projection scenarios, from 2023 to 2035, export values increase by about 31% for oil and 261% for gas, driven by new export markets for liquified natural gas.

Note: The unit barrels is abbreviated to bbl.
Long description
| Year | Emissions intensity - Historical (t CO2 eq/ 1000 bbl) | Export Value - Historical (Billion 2023 US$) | Emissions intensity - WM (t CO2 eq/ 1000 bbl) | Export Value - WM (Billion 2023 US$) | Emissions intensity - WAM (t CO2 eq/1000 bbl) | Export Value - WAM (Billion 2023 US$) |
|---|---|---|---|---|---|---|
| 2005 | 93 | 64 | - | - | - | - |
| 2006 | 92 | 80 | - | - | - | - |
| 2007 | 92 | 89 | - | - | - | - |
| 2008 | 94 | 126 | - | - | - | - |
| 2009 | 91 | 82 | - | - | - | - |
| 2010 | 93 | 70 | - | - | - | - |
| 2011 | 92 | 93 | - | - | - | - |
| 2012 | 94 | 95 | - | - | - | - |
| 2013 | 91 | 104 | - | - | - | - |
| 2014 | 90 | 106 | - | - | - | - |
| 2015 | 88 | 56 | - | - | - | - |
| 2016 | 82 | 47 | - | - | - | - |
| 2017 | 82 | 63 | - | - | - | - |
| 2018 | 80 | 75 | - | - | - | - |
| 2019 | 78 | 78 | - | - | - | - |
| 2020 | 75 | 49 | - | - | - | - |
| 2021 | 72 | 89 | - | - | - | - |
| 2022 | 71 | 120 | - | - | - | - |
| 2023 | 71 | 95 | 71 | 95 | 71 | 95 |
| 2024 | - | - | 71 | 98 | 71 | 98 |
| 2025 | - | - | 67 | 101 | 67 | 101 |
| 2026 | - | - | 67 | 116 | 67 | 116 |
| 2027 | - | - | 65 | 118 | 65 | 118 |
| 2028 | - | - | 65 | 119 | 61 | 119 |
| 2029 | - | - | 64 | 121 | 60 | 121 |
| 2030 | - | - | 64 | 120 | 55 | 121 |
| 2031 | - | - | 63 | 120 | 55 | 120 |
| 2032 | - | - | 62 | 120 | 55 | 121 |
| 2033 | - | - | 62 | 121 | 55 | 122 |
| 2034 | - | - | 62 | 122 | 54 | 123 |
| 2035 | - | - | 61 | 124 | 54 | 125 |
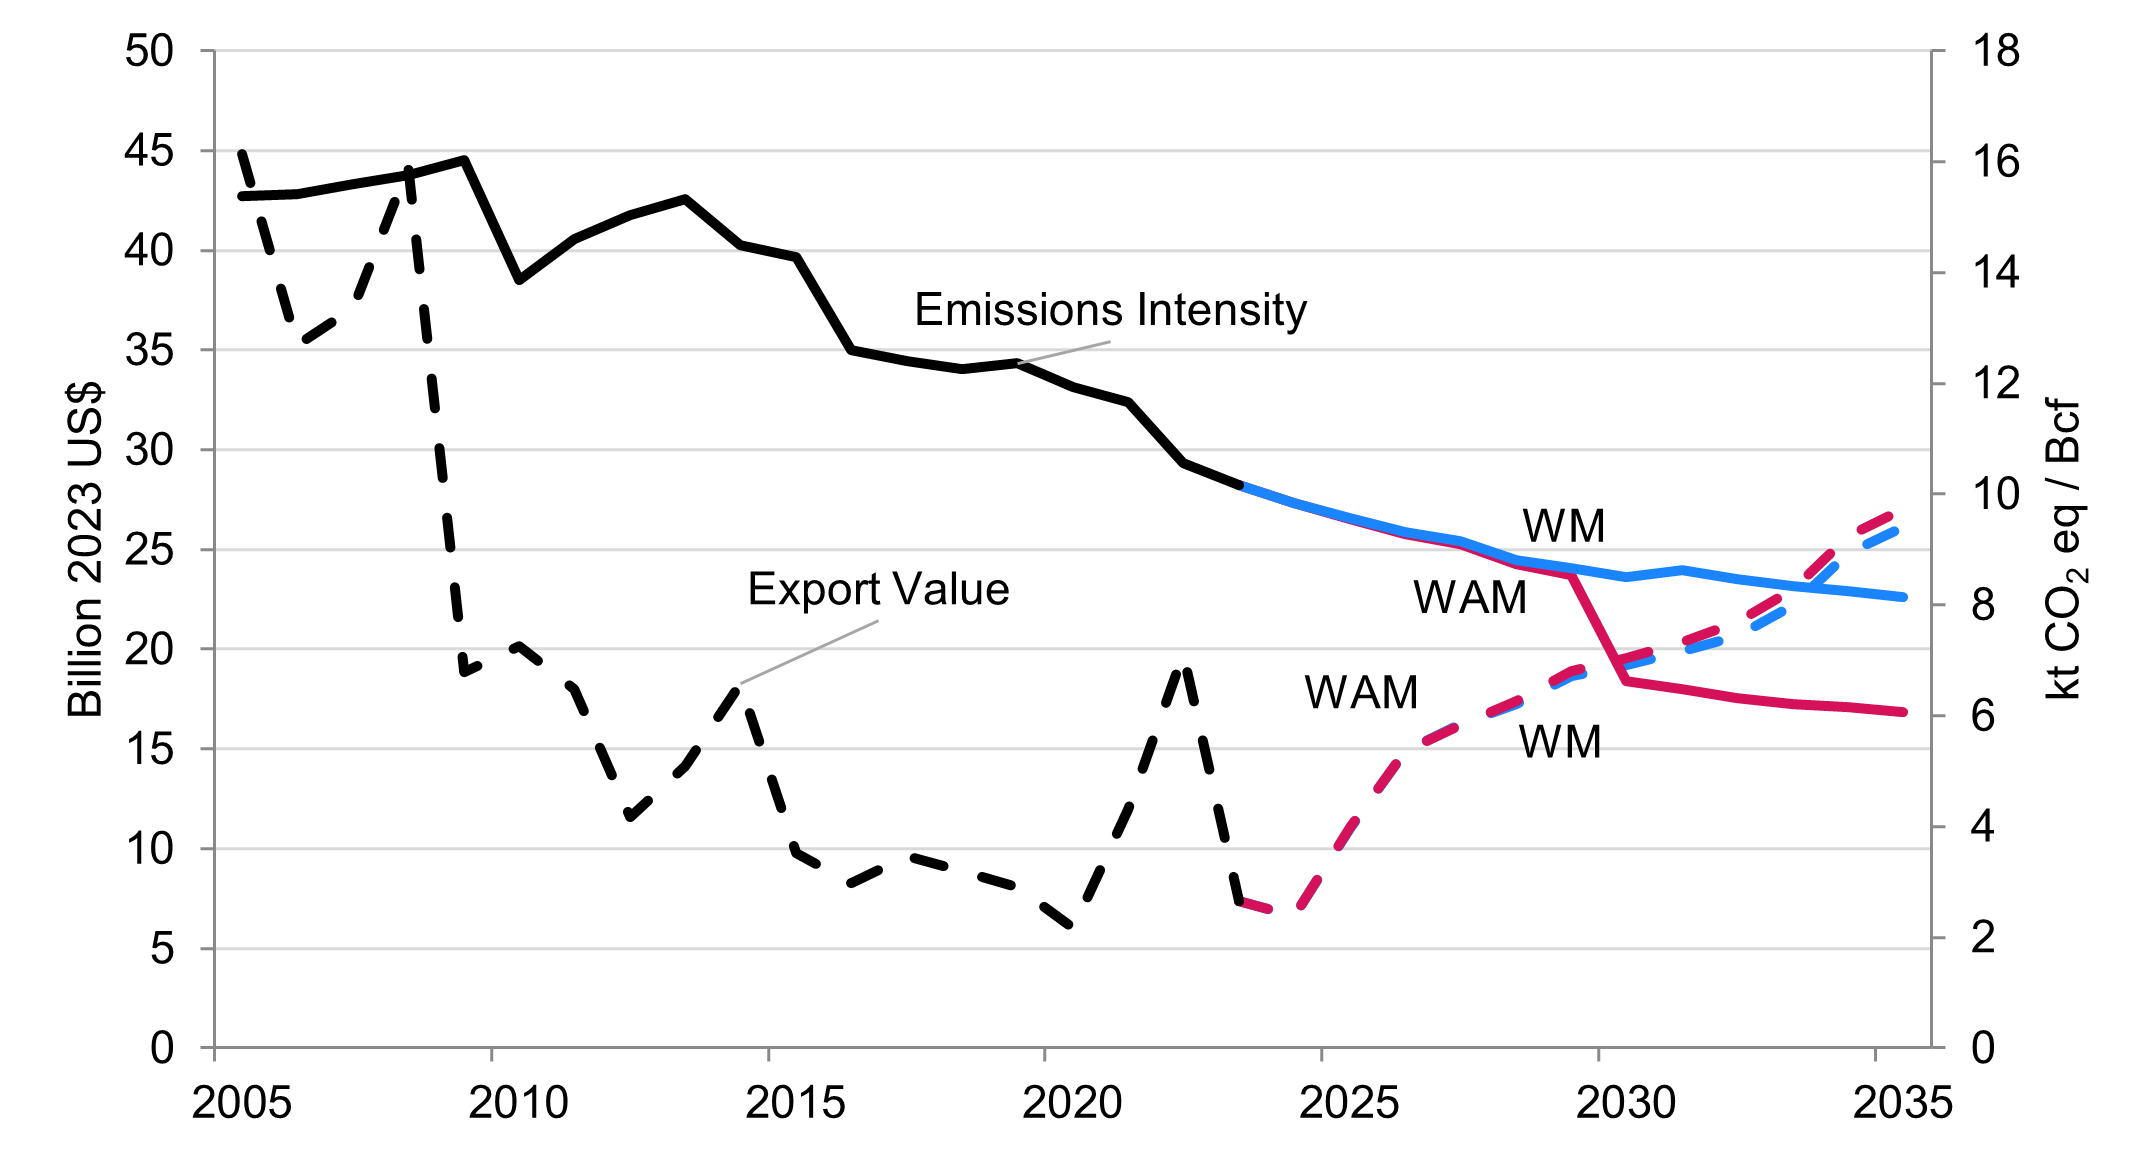
Note: The unit billion cubic feet is abbreviated to Bcf.
Long description
| Year | Emissions intensity - Historical (t CO2 eq/ 1000 bbl) | Export Value - Historical (Billion 2023 US$) | Emissions intensity - WM (t CO2 eq/ 1000 bbl) | Export Value - WM (Billion 2023 US$) | Emissions intensity - WAM (t CO2 eq/1000 bbl) | Export Value - WAM (Billion 2023 US$) |
|---|---|---|---|---|---|---|
| 2005 | 15 | 45 | - | - | - | - |
| 2006 | 15 | 35 | - | - | - | - |
| 2007 | 16 | 37 | - | - | - | - |
| 2008 | 16 | 44 | - | - | - | - |
| 2009 | 16 | 19 | - | - | - | - |
| 2010 | 14 | 20 | - | - | - | - |
| 2011 | 15 | 18 | - | - | - | - |
| 2012 | 15 | 12 | - | - | - | - |
| 2013 | 15 | 14 | - | - | - | - |
| 2014 | 14 | 18 | - | - | - | - |
| 2015 | 14 | 10 | - | - | - | - |
| 2016 | 13 | 8 | - | - | - | - |
| 2017 | 12 | 10 | - | - | - | - |
| 2018 | 12 | 9 | - | - | - | - |
| 2019 | 12 | 8 | - | - | - | - |
| 2020 | 12 | 6 | - | - | - | - |
| 2021 | 12 | 12 | - | - | - | - |
| 2022 | 11 | 20 | - | - | - | - |
| 2023 | 10 | 7 | 10 | 7 | 10 | 7 |
| 2024 | - | - | 10 | 7 | 10 | 7 |
| 2025 | - | - | 10 | 11 | 10 | 11 |
| 2026 | - | - | 9 | 15 | 9 | 15 |
| 2027 | - | - | 9 | 16 | 9 | 16 |
| 2028 | - | - | 9 | 17 | 9 | 17 |
| 2029 | - | - | 9 | 19 | 9 | 19 |
| 2030 | - | - | 8 | 19 | 7 | 20 |
| 2031 | - | - | 9 | 20 | 6 | 20 |
| 2032 | - | - | 8 | 21 | 6 | 21 |
| 2033 | - | - | 8 | 22 | 6 | 23 |
| 2034 | - | - | 8 | 25 | 6 | 26 |
| 2035 | - | - | 8 | 26 | 6 | 27 |
2.2.2 Transportation
Canada’s Transportation sector was the second-largest contributor to national GHG emissions in 2023, accounting for 23% of the total. Emissions increased by 39 Mt (33%) between 1990 and 2023, with a temporary decline in 2020 due to reduced travel during the COVID-19 pandemic. Emissions rebounded in 2023 and were slightly above 2005 levels. Section 2.3 of NIR2025 provides further detail on historical trends.
Under the WM scenario, emissions are projected to decline gradually after 2023. This is driven by turnover to more efficient vehicles and increased adoption of zero-emission vehicles (ZEVs). The WAM scenario achieves deeper reductions through more ambitious ZEV targets and additional funding programs. Table 5 presents emissions projections by subsector, and Figure 12 illustrates trends from 2005 to 2035.
The WM scenario includes EVAS, which mandates that 100% of new light-duty vehicle sales be ZEVs by 2035. It also reflects the waiving of model year 2026 vehicles announced in fall 2025, with regulated targets now beginning in 2027. For freight, the Heavy-Duty Vehicle and Engine Greenhouse Gas Emission Regulations improve fuel efficiency, while the Incentives for Medium- and Heavy-Duty Zero-Emission Vehicles program (set to expire in March 2026) supports early electrification. These measures contribute to declining emissions in both passenger and freight subsectors.
Emissions in the WAM scenario are comparable to those in the WM scenario because the two differ only slightly in reduction policies. The WAM scenario shows marginally higher emissions through 2035, primarily due to lower biofuel demand resulting from variations in the CFR credit market between the two scenarios.
Off-road vehicle emissions (e.g., recreational, commercial, residential) are expected to rise slightly under the WM and WAM scenarios due to increased activity.
Overall, transportation emissions are projected to decline under both scenarios. Table 5 provides a detailed breakdown by subsector.
| Subsector | 1990 | 2005 | 2023 | 2026a | 2030a | 2035a | 2026b | 2030b | 2035b |
|---|---|---|---|---|---|---|---|---|---|
| Passenger Transport | 80 | 95 | 94 | 87 | 75 | 57 | 88 | 75 | 57 |
| Cars, Light Trucks and Motorcycles | 71 | 85 | 82 | 76 | 65 | 47 | 77 | 65 | 47 |
| Bus, Rail and Domestic Aviation | 9 | 10 | 12 | 11 | 10 | 10 | 11 | 11 | 10 |
| Freight Transport | 30 | 48 | 48 | 45 | 46 | 50 | 45 | 47 | 51 |
| Heavy-Duty Trucks, Rail | 25 | 42 | 43 | 40 | 41 | 45 | 40 | 42 | 46 |
| Domestic Aviation and Marine | 5 | 5 | 5 | 5 | 5 | 5 | 5 | 5 | 5 |
| Off-Road: Recreational, Commercial and Residential | 8 | 14 | 15 | 14 | 15 | 17 | 14 | 15 | 17 |
| Total | 118 | 156 | 157 | 146 | 137 | 124 | 147 | 138 | 125 |
Note: Numbers may not sum to the total due to rounding. Historical data up to 2023 are sourced from NIR2025. Data from 2024 to 2035 are modelled projections developed using ECCC’s analytical framework. Access more data on the open data portal.
a Projections under the WM scenario.
b Projections under the WAM scenario.
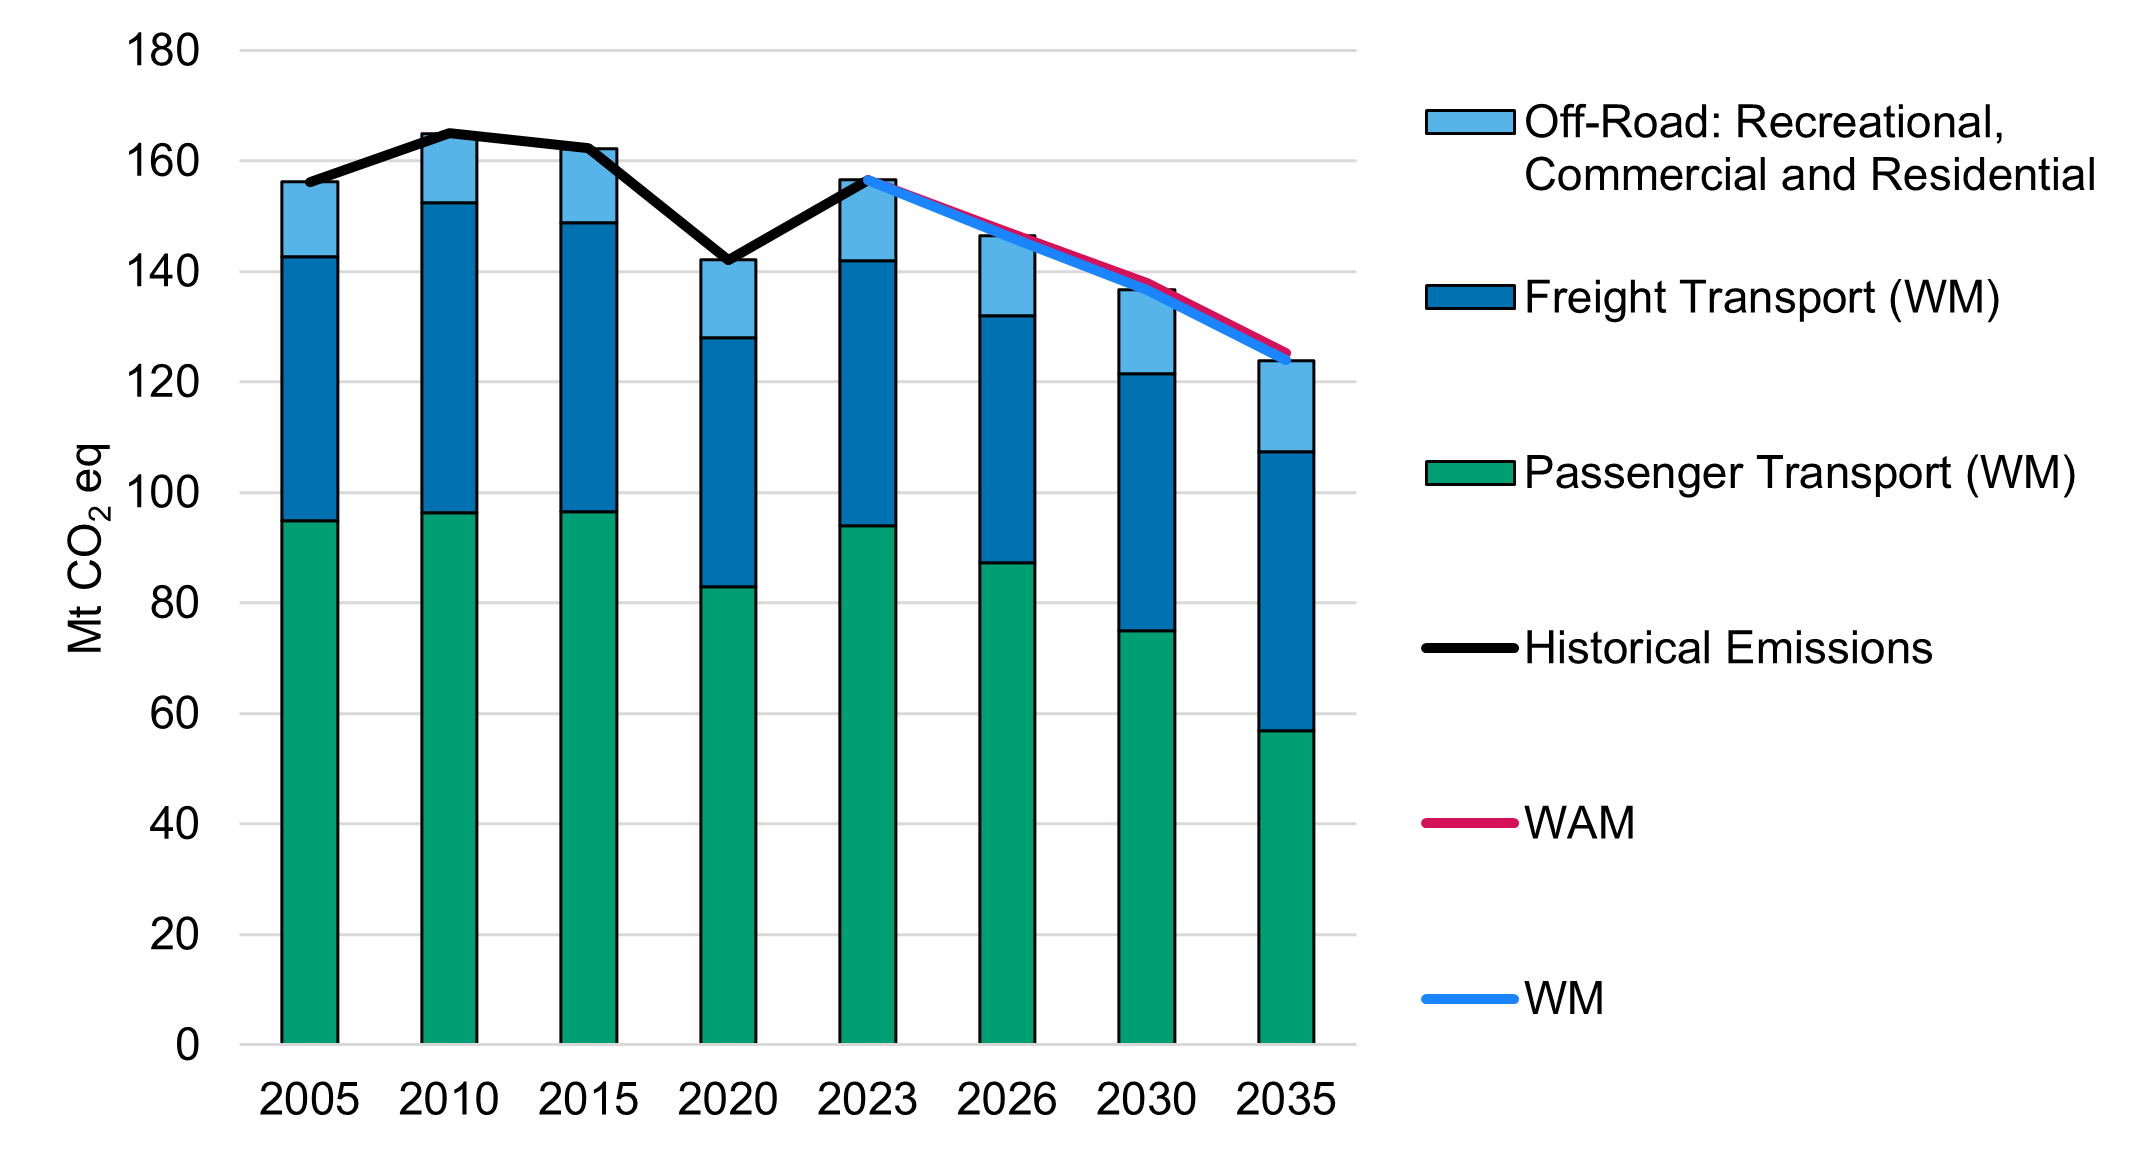
Note: Historical emissions data come from NIR2025. Access more data on the open data portal.
Long description
| Year | Freight Transport (WM) | Other: Recreational, Commercial and Residential (WM) | Passenger Transport (WM) | Historical Emissions | WM | WAM |
|---|---|---|---|---|---|---|
| 2005 | 48 | 14 | 95 | 156 | - | - |
| 2010 | 56 | 12 | 96 | 165 | - | - |
| 2015 | 52 | 14 | 97 | 162 | - | - |
| 2020 | 45 | 14 | 83 | 142 | - | - |
| 2023 | 48 | 15 | 94 | 157 | 157 | 157 |
| 2026 | 45 | 14 | 87 | - | 146 | 147 |
| 2030 | 46 | 15 | 75 | - | 137 | 138 |
| 2035 | 50 | 17 | 57 | - | 124 | 125 |
2.2.3 Electricity
In 2023, the Electricity sector (excluding industrial and commercial generation) contributed 7% of Canada’s total GHG emissions. Emissions declined by 46 Mt (48%) since 1990, driven by the phase out of coal-fired generation and increased reliance on non-emitting sources. Despite an 8% increase in electricity demand since 2005, emissions fell by 67 Mt (58%). Section 2.3 of NIR2025 provides further detail on historical trends.
As Canada transitions to a low-carbon economy, the Electricity sector plays a central role in decarbonization while at the same time supporting increasing electricity demands in high-growth sectors such as Data Centres. Nearly all deep decarbonization pathways rely on a clean electricity grid and electrification of other sectors. In 2023, approximately 86% of utility electricity was generated from non-GHG-emitting sources. This share is expected to grow to 90% by 2030 and 94% by 2035.
By 2023, several provinces had achieved nearly 100% non-emitting electricity generation. Prince Edward Island, Québec, Manitoba, and British Columbia each generated over 99% of their electricity from hydro and other renewables and are expected to continue expanding renewable capacity.
The energy mix used to generate electricity varies significantly by region. It is influenced by factors such as access to renewable resources like hydropower, interprovincial and international transmission connections, and availability of natural gas. Some provinces rely almost entirely on hydropower, while others use a combination of renewables, nuclear, and fossil fuels. A few provinces still depend primarily on fossil fuels, including coal, natural gas and refined petroleum products.
Industrial on-site cogeneration, which produces both electricity and heat or steam for processes such as in-situ oil sands extraction, has grown. This has reduced demand for utility-generated electricity and shifted some emissions from the Electricity sector to industrial sectors. In Alberta, this shift is particularly notable. For example, the Suncor Base Plant cogeneration facility is replacing older petroleum coke boilers and may displace higher-emitting utility generation.
The WM scenario reflects continued reductions in coal and refined petroleum use, with natural gas emissions peaking in 2025 before declining. Wind generation is projected to grow from 8% of total generation in 2023 to 19% by 2030 and 24% by 2035. Solar generation is projected to grow from 1% in 2023 to 4% in 2030 and 5% by 2035. Nuclear power remains reasonably stable, with small modular reactors expected in several provinces. Table 6 and Figure 13 present emissions projections by fuel type under the WM and WAM scenarios.
Federal regulations introduced in 2015 and amended in 2018 require coal units to meet strict emissions standards, accelerating the coal phase out by 2030. Additionally, the Clean Electricity Regulations which aim to prohibit the excessive use of fossil fuels in electricity generation contribute to emissions reductions in both the WM and WAM cases from 2035 and beyond. Saskatchewan’s Boundary Dam 3, equipped with CCS, is expected to remain operational until the end of 2034. Provinces such as Newfoundland and Labrador, Nova Scotia, and Alberta make significant progress in reducing fossil fuel use in electricity generation.
Between 2030 and 2035, emissions in the WAM scenario are moderately higher than in the WM scenario due to slightly higher generation for most of this period.
Overall, emissions from the Electricity sector are expected to continue declining (open data Table A19), supported by federal and provincial initiatives, technological advancements, and increased renewable capacity.
| Fuel | 1990 | 2005 | 2023 | 2026a | 2030a | 2035a | 2026b | 2030b | 2035b |
|---|---|---|---|---|---|---|---|---|---|
| Coal | 80 | 98 | 22 | 11 | 0 | 0 | 11 | 0 | 0 |
| Refined Petroleum Products | 11 | 10 | 3 | 3 | 1 | 1 | 3 | 1 | 1 |
| Natural Gas | 3 | 7 | 24 | 23 | 21 | 12 | 24 | 23 | 12 |
| Biofuels | 0 | 0 | 0 | 0 | 0 | 0 | 0 | 0 | 0 |
| Steam Generation | 0 | 1 | 0 | 1 | 1 | 1 | 1 | 1 | 1 |
| Total | 94 | 116 | 49 | 38 | 23 | 14 | 38 | 26 | 14 |
Note: Numbers may not sum to the total due to rounding. Access more data on the open data portal.
a Projections under the WM scenario.
b Projections under the WAM scenario.
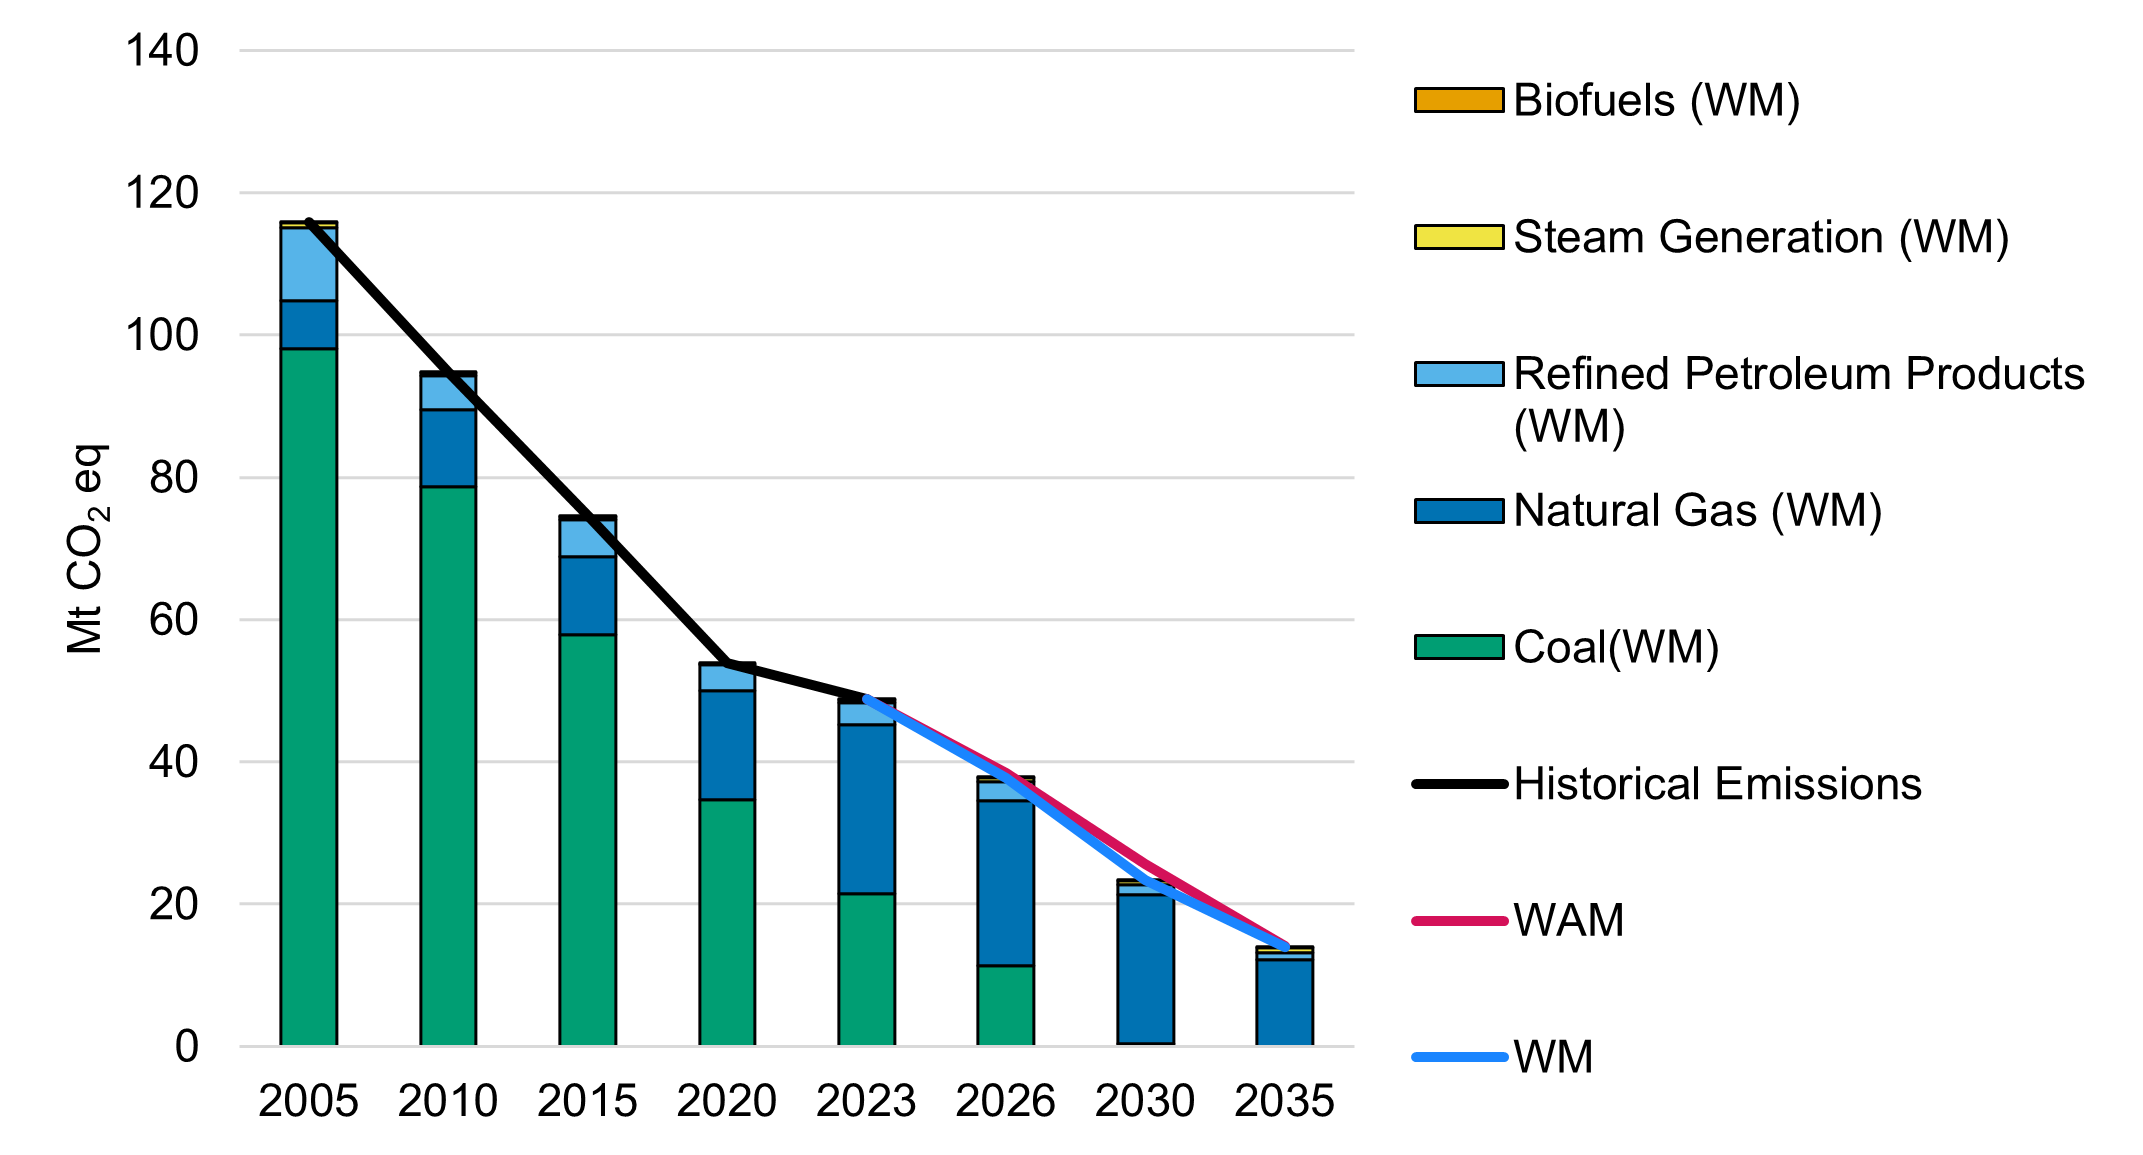
Note: Historical emissions data come from NIR2025. Access more data on the open data portal.
Long description
| Year | Biofuels (WM) | Coal (WM) | Natural Gas (WM) | Refined Petroleum Products (WM) | Steam Generation (WM) | Historical Emissions | WM | WAM |
|---|---|---|---|---|---|---|---|---|
| 2005 | 0 | 98 | 7 | 10 | 1 | 116 | - | - |
| 2010 | 0 | 79 | 11 | 5 | 0 | 95 | - | - |
| 2015 | 0 | 58 | 11 | 5 | 0 | 74 | - | - |
| 2020 | 0 | 35 | 15 | 4 | 0 | 54 | - | - |
| 2023 | 0 | 22 | 24 | 3 | 0 | 49 | 49 | 49 |
| 2026 | 0 | 11 | 23 | 3 | 1 | - | 38 | 38 |
| 2030 | 0 | 0 | 21 | 1 | 1 | - | 23 | 26 |
| 2035 | 0 | 0 | 12 | 1 | 1 | - | 14 | 14 |
2.2.4 Heavy Industry
Emissions from the Heavy Industry sector accounted for 11% of Canada’s total GHG emissions in 2023, down from 16% in 1990. Emissions declined by 19 Mt (19%) since 1990 and by 9.5 Mt (11%) since 2005, with notable reductions during the 2008 to 2009 recession. Recent declines reflect reduced economic activity and a shift toward less emissions-intensive sectors.
From 2023 to 2035, emissions are projected to decline under the WM scenario. This overall reduction is driven by several factors, including the decarbonization of iron and steel facilities, improvements in the cement sector, the OBPS, energy efficiency programs, targeted provincial initiatives, and trade-related uncertainty. After 2031, emissions are flat and stay below 2023 levels (open data Table A20).
Emissions in the chemicals and fertilizers subsector fluctuate between 20 Mt and 23 Mt over the 2024 to 2035 period. While production increases after 2027, the growth in emissions is moderated by the deployment of CCS technology.
In the mining subsector, emissions begin to rise after 2026, reflecting increased activity. By contrast, emissions from smelting and refining initially decline slightly and then remain essentially flat from 2026.
The iron and steel subsector shows a significant decline in emissions by 2030. This reduction is driven by major conversions at Ontario facilities (Algoma and ArcelorMittal Dofasco) from traditional blast furnace/basic oxygen furnace to electric arc furnace and direct reduced iron. These projects are supported by the Strategic Innovation Fund – Net-Zero Accelerator (SIF-NZA). After 2031, emissions in this subsector stabilize and remain flat through 2035.
For pulp and paper, emissions decline steadily through 2030, primarily due to improvements in energy efficiency. After 2030, the downward trend continues, but at a slower pace.
The cement subsector experiences a notable reduction in emissions by 2030, driven by fuel switching and CCS initiatives supported by Emissions Reduction Alberta. Starting in 2029, emissions increase modestly due to economic growth but remain below 2023 levels.
Finally, emissions from lime and gypsum emissions decline in the early years of the projection period. Starting in 2027, they rise slightly but stay below 2023 levels overall.
Under the WAM scenario, emissions decline further past 2030 due to pending projects funded by SIF-NZA, increased hydrogen adoption, and investments from the Canada Growth Fund and carbon revenue returns. CCS, energy efficiency, and electrification are key drivers. Between 2023 and 2035, emissions decline across most subsectors.
| Subsector | 1990 | 2005 | 2023 | 2026a | 2030a | 2035a | 2026b | 2030b | 2035b |
|---|---|---|---|---|---|---|---|---|---|
| Mining | 7 | 8 | 9 | 10 | 10 | 11 | 10 | 10 | 11 |
| Smelting and Refining (Non-Ferrous Metals) | 17 | 14 | 10 | 9 | 8 | 8 | 9 | 8 | 8 |
| Pulp and Paper | 15 | 9 | 8 | 7 | 6 | 6 | 7 | 6 | 6 |
| Iron and Steel | 17 | 16 | 14 | 11 | 6 | 6 | 11 | 4 | 4 |
| Cement | 10 | 13 | 11 | 9 | 8 | 8 | 9 | 8 | 9 |
| Lime and Gypsum | 3 | 3 | 2 | 2 | 2 | 2 | 2 | 2 | 2 |
| Chemicals and Fertilizers | 28 | 24 | 23 | 20 | 21 | 20 | 20 | 21 | 18 |
| Total | 97 | 88 | 78 | 67 | 61 | 60 | 67 | 59 | 57 |
Note: Numbers may not sum to the total due to rounding. Historical data up to 2023 are sourced from NIR2025. Data from 2024 to 2035 are modelled projections developed using ECCC’s analytical framework. Access more data on the open data portal.
a Projections under the WM scenario.
b Projections under the WAM scenario.
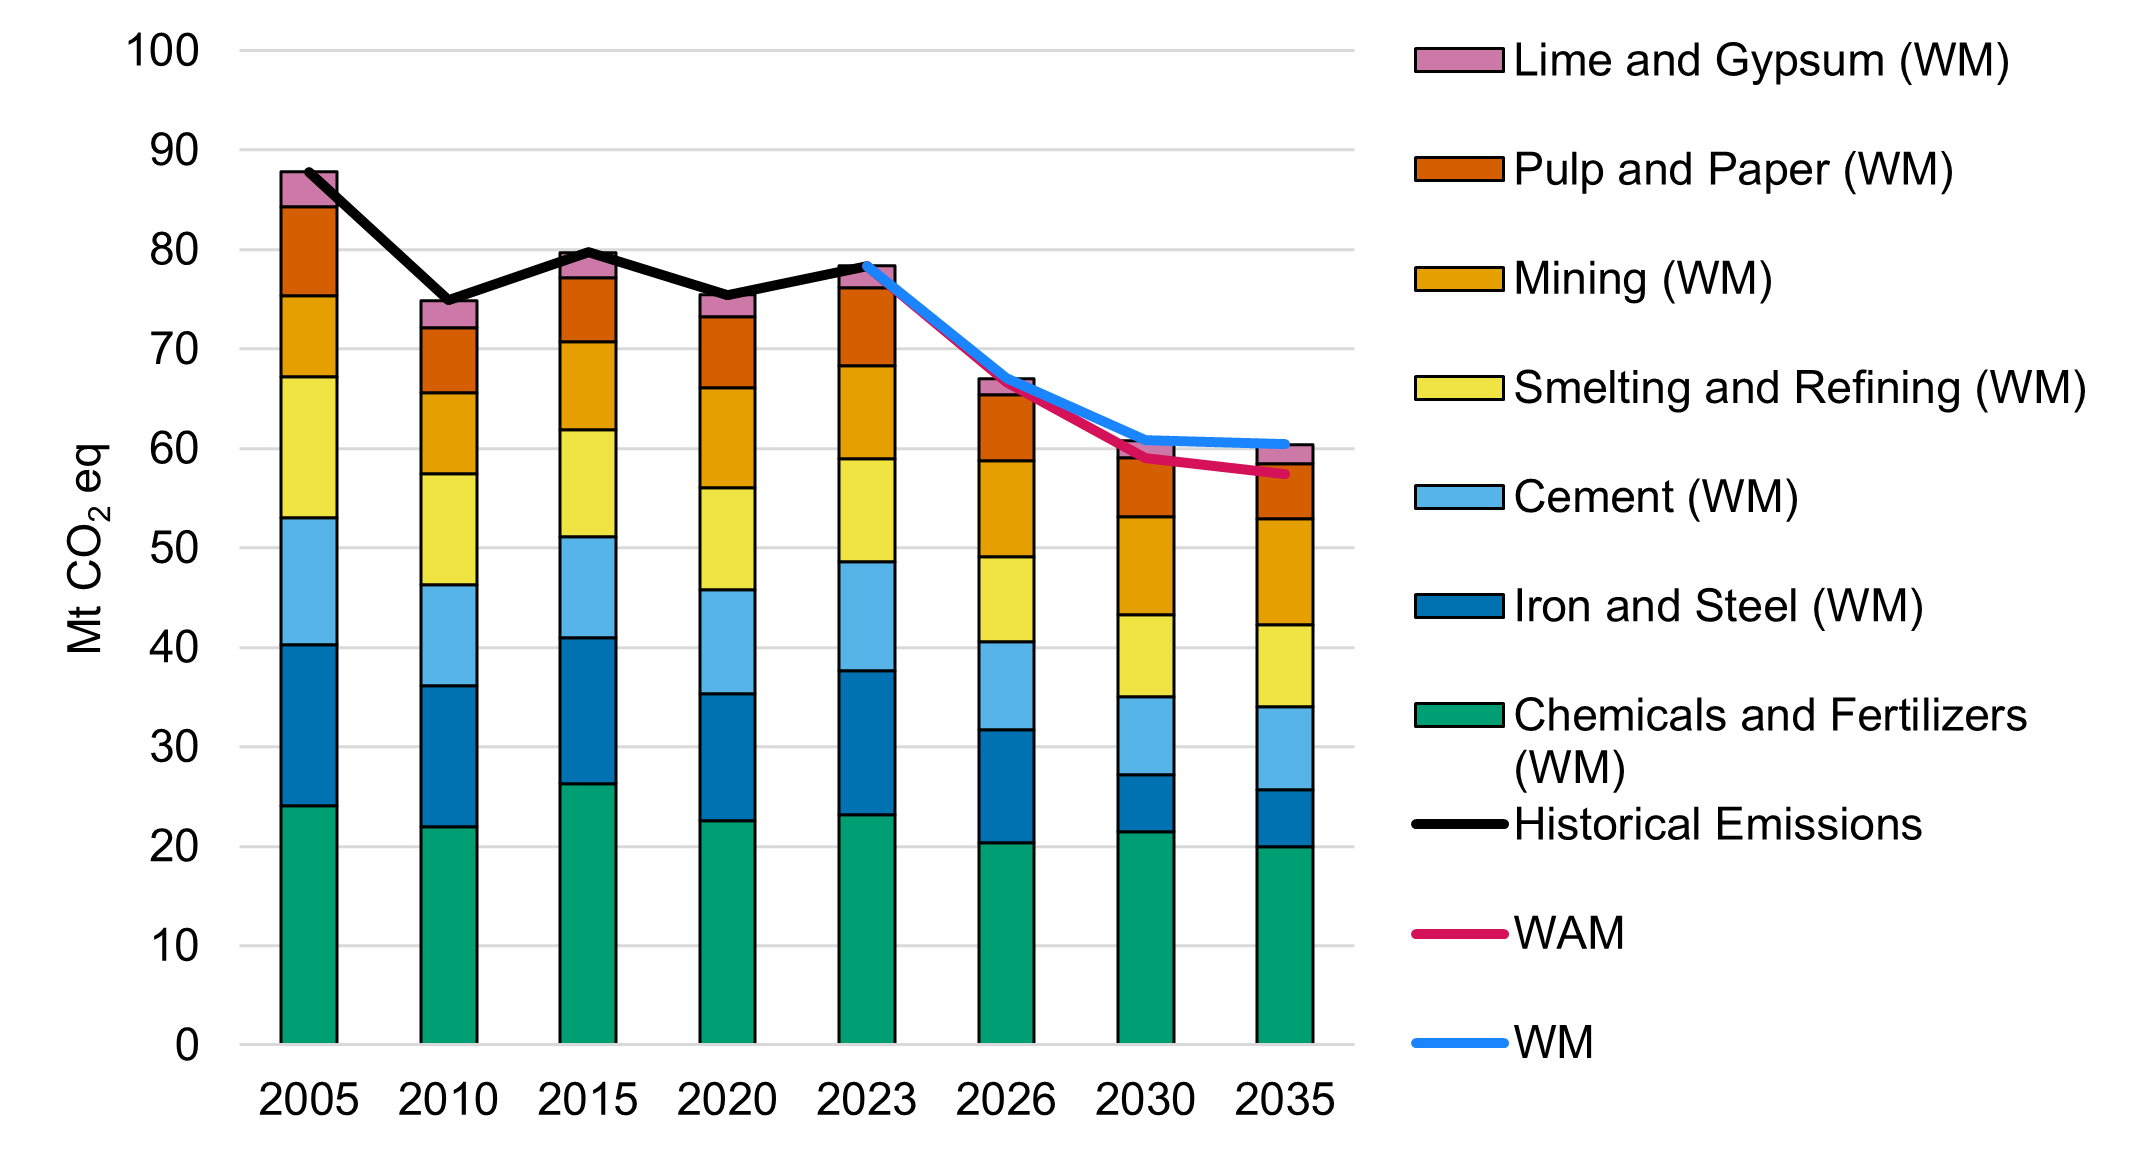
Note: Historical emissions data come from NIR2025. Access more data on the open data portal.
Long description
| Year | Cement (WM) | Chemicals and Fertilizers (WM) | Iron and Steel (WM) | Lime and Gypsum (WM) | Mining (WM) | Pulp and Paper (WM) | Smelting and Refining (WM) | Historical Emissions | WM | WAM |
|---|---|---|---|---|---|---|---|---|---|---|
| 2005 | 13 | 24 | 16 | 3 | 8 | 9 | 14 | 88 | - | - |
| 2010 | 10 | 22 | 14 | 3 | 8 | 7 | 11 | 75 | - | - |
| 2015 | 10 | 26 | 15 | 3 | 9 | 6 | 11 | 80 | - | - |
| 2020 | 10 | 23 | 13 | 2 | 10 | 7 | 10 | 75 | - | - |
| 2023 | 11 | 23 | 14 | 2 | 9 | 8 | 10 | 78 | 78 | 78 |
| 2026 | 9 | 20 | 11 | 2 | 10 | 7 | 9 | - | 67 | 67 |
| 2030 | 8 | 21 | 6 | 2 | 10 | 6 | 8 | - | 61 | 59 |
| 2035 | 8 | 20 | 6 | 2 | 11 | 6 | 8 | - | 60 | 57 |
2.2.5 Buildings
In 2023, the Buildings sector contributed 12% of Canada’s total GHG emissions. Residential emissions declined by 5.7 Mt (13%) since 1990, while commercial emissions increased by 17 Mt (61%). Since 2005, overall emissions from the sector decreased by 2.0 Mt (2.3%). Despite population growth and expanding building stock, emissions have remained relatively stable since 2005 (open data Table A21).
Under the WM scenario, emissions decline due to improvements in energy efficiency and increased adoption of heat pumps. Electrification of heating systems plays a key role, particularly in the commercial subsector. In the WAM scenario, emissions fall further, driven by net-zero ready building codes for new construction and policies promoting the electrification of space and water heating equipment.
After 2030, emissions continue to decline in both scenarios, with WAM showing further reductions due to long-term impacts of enhanced policies. Table 8 presents emissions projections by residential and commercial subsectors, and Figure 15 illustrates trends from 2005 to 2035.
In the residential subsector, emissions increase slightly between 2028 and 2035 due to the removal of the consumer carbon levy and updated economic drivers. Federal and provincial measures (including building codes, rebates, and voluntary standards) support long-term efficiency gains. Post-2030 reductions are largely attributed to heating system electrification. In the WAM scenario, additional measures such as net-zero ready codes accelerate these reductions.
In the commercial subsector, emissions decline under both scenarios despite continued growth in floor space. This is driven by energy efficiency improvements and the phase-down of hydrofluorocarbons (HFCs), which have high global warming potential. The WAM scenario includes further reductions from building envelope improvements and policies targeting oil- and gas-fired heating systems.
Overall, emissions from the Buildings sector are projected to decline steadily, with deeper reductions under WAM due to stronger policy measures and increased electrification.
| Subsector | 1990 | 2005 | 2023 | 2026a | 2030a | 2035a | 2026b | 2030b | 2035b |
|---|---|---|---|---|---|---|---|---|---|
| Residential | 44 | 45 | 38 | 37 | 36 | 37 | 37 | 35 | 31 |
| Commercial | 28 | 40 | 44 | 43 | 42 | 41 | 43 | 41 | 38 |
| Total | 72 | 85 | 83 | 80 | 78 | 78 | 79 | 76 | 69 |
Note: Numbers may not sum to the total due to rounding. Historical data up to 2023 are sourced from NIR2025. Data from 2024 to 2035 are modelled projections developed using ECCC’s analytical framework. Access more data on the open data portal.
a Projections under the WM scenario.
b Projections under the WAM scenario.
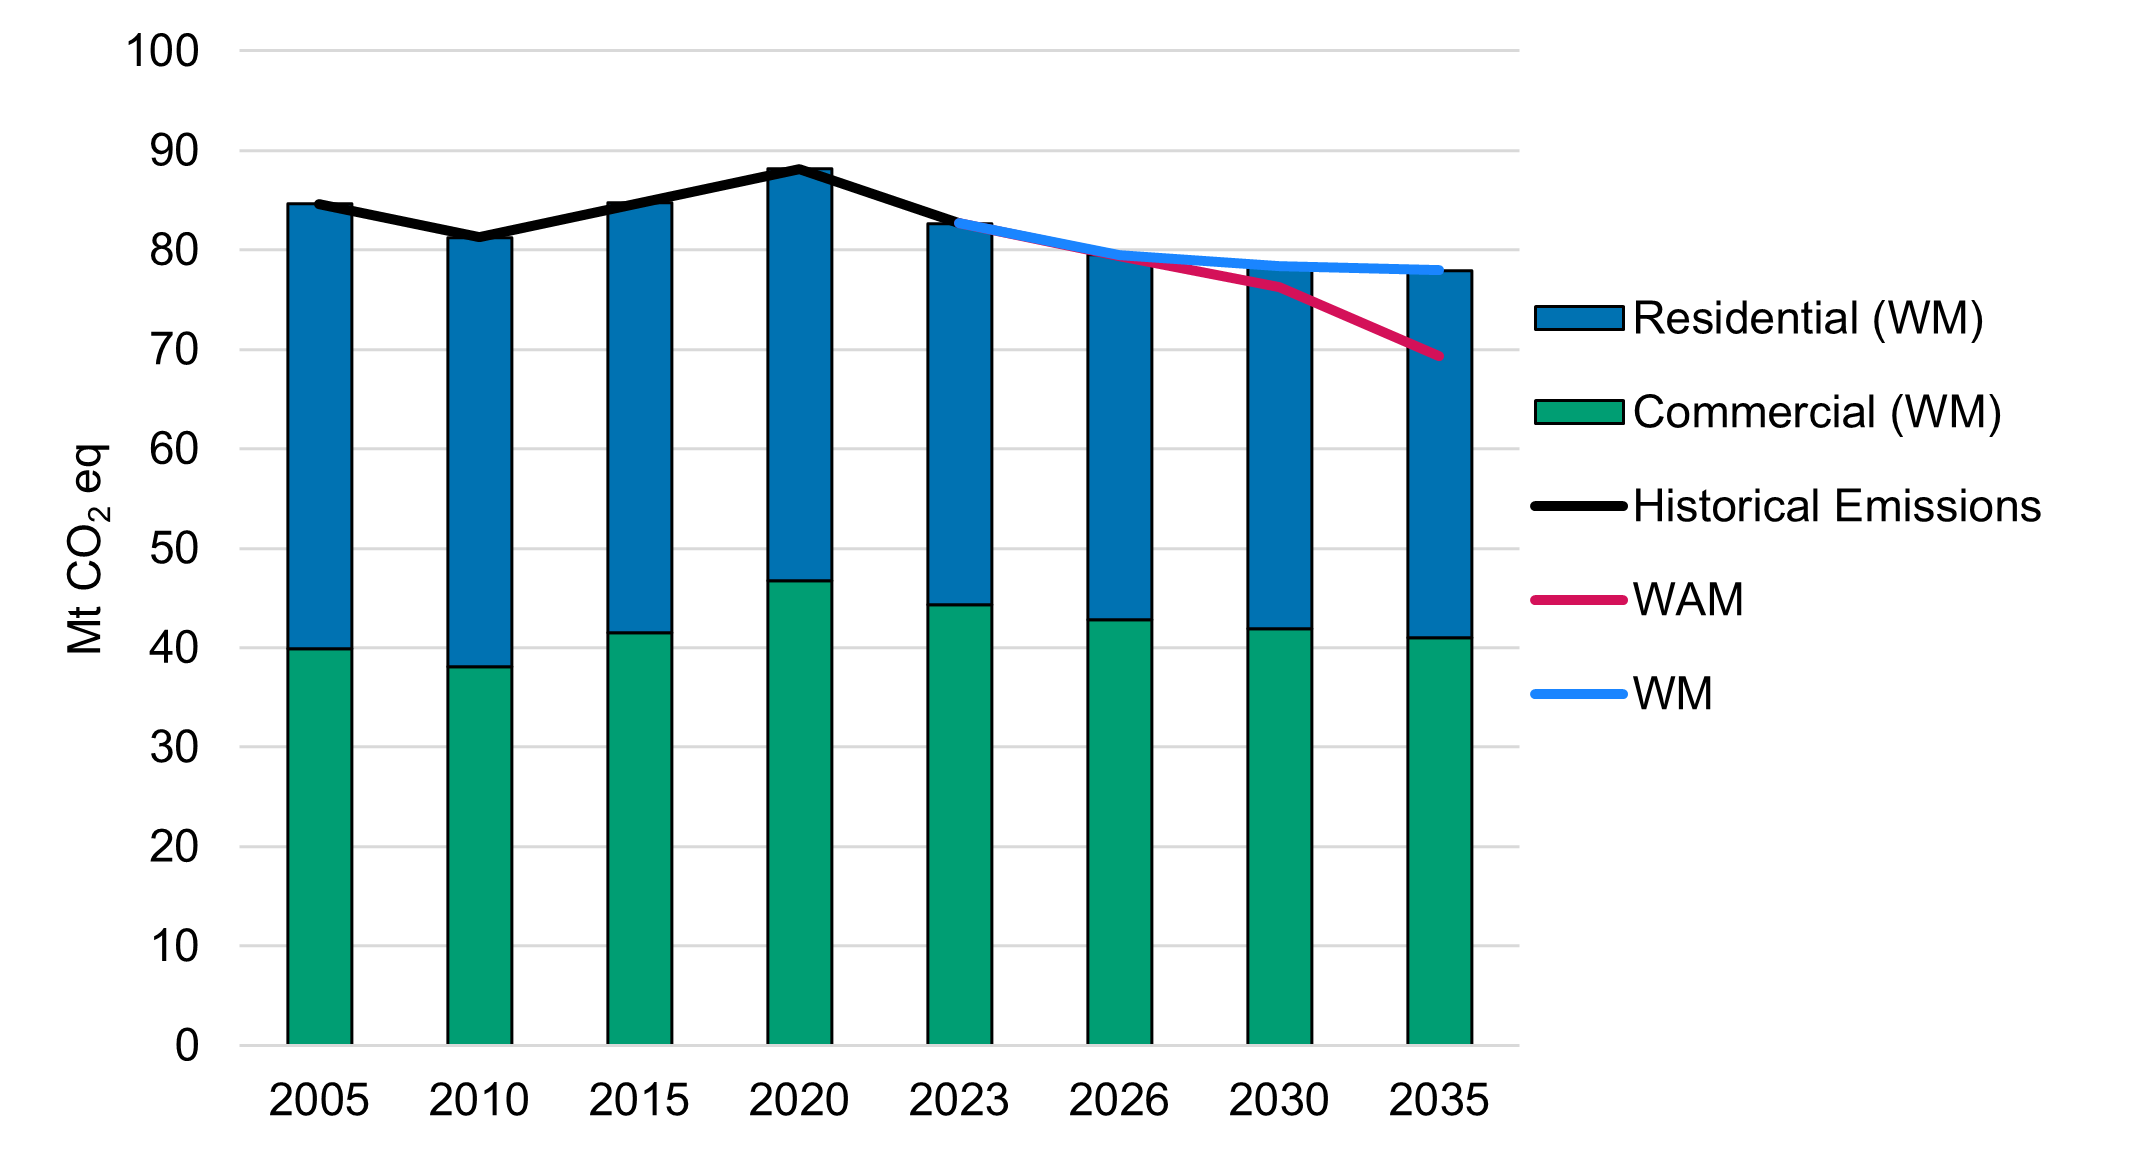
Note: Historical emissions data come from NIR2025. Access more data on the open data portal.
Long description
| Year | Commercial (WM) | Residential (WM) | Historical Emissions | WM | WAM |
|---|---|---|---|---|---|
| 2005 | 40 | 45 | 85 | - | - |
| 2010 | 38 | 43 | 81 | - | - |
| 2015 | 42 | 43 | 85 | - | - |
| 2020 | 47 | 41 | 88 | - | - |
| 2023 | 44 | 38 | 83 | 83 | 83 |
| 2026 | 43 | 37 | - | 80 | 79 |
| 2030 | 42 | 36 | - | 78 | 76 |
| 2035 | 41 | 37 | - | 78 | 69 |
2.2.6 Agriculture
The Agriculture sector includes crop production, animal production, and on-farm fuel use. The majority of GHG emissions from agriculture are due to biological processes in animal and crop production, as well as emissions from inorganic and organic fertilizer. Most of the GHGs emitted in the Agriculture sector (on a carbon dioxide equivalency basis) are methane and nitrous oxide with a smaller amount of carbon dioxide emissions from on-farm fuel combustion and carbon-containing fertilizers. Emissions from land use and land-use change on agricultural lands are accounted for in the LULUCF sector and excluded from this section unless otherwise noted. In 2023, agricultural emissions reached 69 Mt, up from 66 Mt in 2005 and 51 Mt in 1990.
Over time, the composition of agricultural emissions has shifted. Fertilizer use has increased emissions from crop production, while emissions from livestock have declined due to smaller cattle herds. On-farm fuel use has risen slightly, reflecting increased energy demand. Table 9 presents emissions by subsector, and Figure 16 shows net agricultural emissions including fluxes from land use and land-use change, and agricultural mitigation measures.
Under the WM scenario, emissions decline slightly between 2023 and 2030, driven by the industrial carbon price, the CFR, and programs like the Agricultural Clean Technology (ACT) initiative and components of programs targeting nitrogen management (such as the On-Farm Climate Action Fund and the Sustainable Canadian Agricultural Partnership). The WAM scenario emissions are similar to the WM scenario. OBPS revenue recycling targets improvements in efficiencies across several sectors, including On-Farm Fuel Use in Agriculture leading to slightly lower emissions in the WAM scenario. The WAM scenario is lower from 2030 onward when the impacts of other agriculture measures are included.
From 2030 to 2035, emissions from crop production, animal production, and on farm fuel use remain relatively stable in both scenarios. Cropland continues to act as a carbon sink, though net sequestration declines slightly. Reductions from agriculture measures are projected to result in approximately 6 Mt of additional abatement relative to the WM scenario.
Overall, agricultural emissions are projected to remain near current levels under the WM scenario and decline under the WAM scenario, reflecting the impact of targeted mitigation policies and improved land management practices.
To increase consistency and integrity of the scenarios, a number of adjustments have been made to the estimated emissions reductions associated with agriculture programming, based on the most current scientific understanding of the sector emissions and the impacts of programming, more recent program data, and planned future programming. The WAM scenario no longer includes the assumption of meeting the fertilizer emissions target, a voluntary federal target to reduce emissions by 30% below 2020 levels by 2030. The projected GHG impact of existing programs targeting nitrogen management is now included in the WM scenario. The federal government continues to work with manufacturers, farmers, provinces, and territories to close the gap to the fertilizer target.
Figure 16 illustrates net agricultural emissions from 2005 to 2035. This includes emissions from crop and animal production, on-farm fuel use, and the net GHG flux from cropland, such as soil carbon sequestration, and land-use change, including deforestation. The figure also shows the projected impact of agricultural mitigation measures between 2030 and 2035.
To track progress towards emissions reduction targets, net GHG flux from agricultural soils, as well as emissions from land use and land-use change, are accounted for using the Net-net approach. These are included in the LULUCF accounting contribution, as detailed in open data Table A36 and Section 2.2.10.
| Subsector | 1990 | 2005 | 2023 | 2026a | 2030a | 2035a | 2026b | 2030b | 2035b |
|---|---|---|---|---|---|---|---|---|---|
| On Farm Fuel Use | 8 | 9 | 14 | 14 | 13 | 14 | 14 | 13 | 13 |
| Crop Production | 9 | 11 | 19 | 19 | 19 | 19 | 19 | 19 | 19 |
| Animal Production | 33 | 46 | 37 | 36 | 37 | 37 | 36 | 37 | 37 |
| Total | 51 | 66 | 69 | 69 | 69 | 69 | 69 | 68 | 69 |
Note: Numbers may not sum to the total due to rounding. Historical data up to 2023 are sourced from NIR2025. Data from 2024 to 2035 are modelled projections developed using ECCC’s analytical framework. These values do not include the accounting contribution from Cropland remaining cropland or agriculture measures. Access more data on the open data portal.
a Projections under the WM scenario.
b Projections under the WAM scenario.
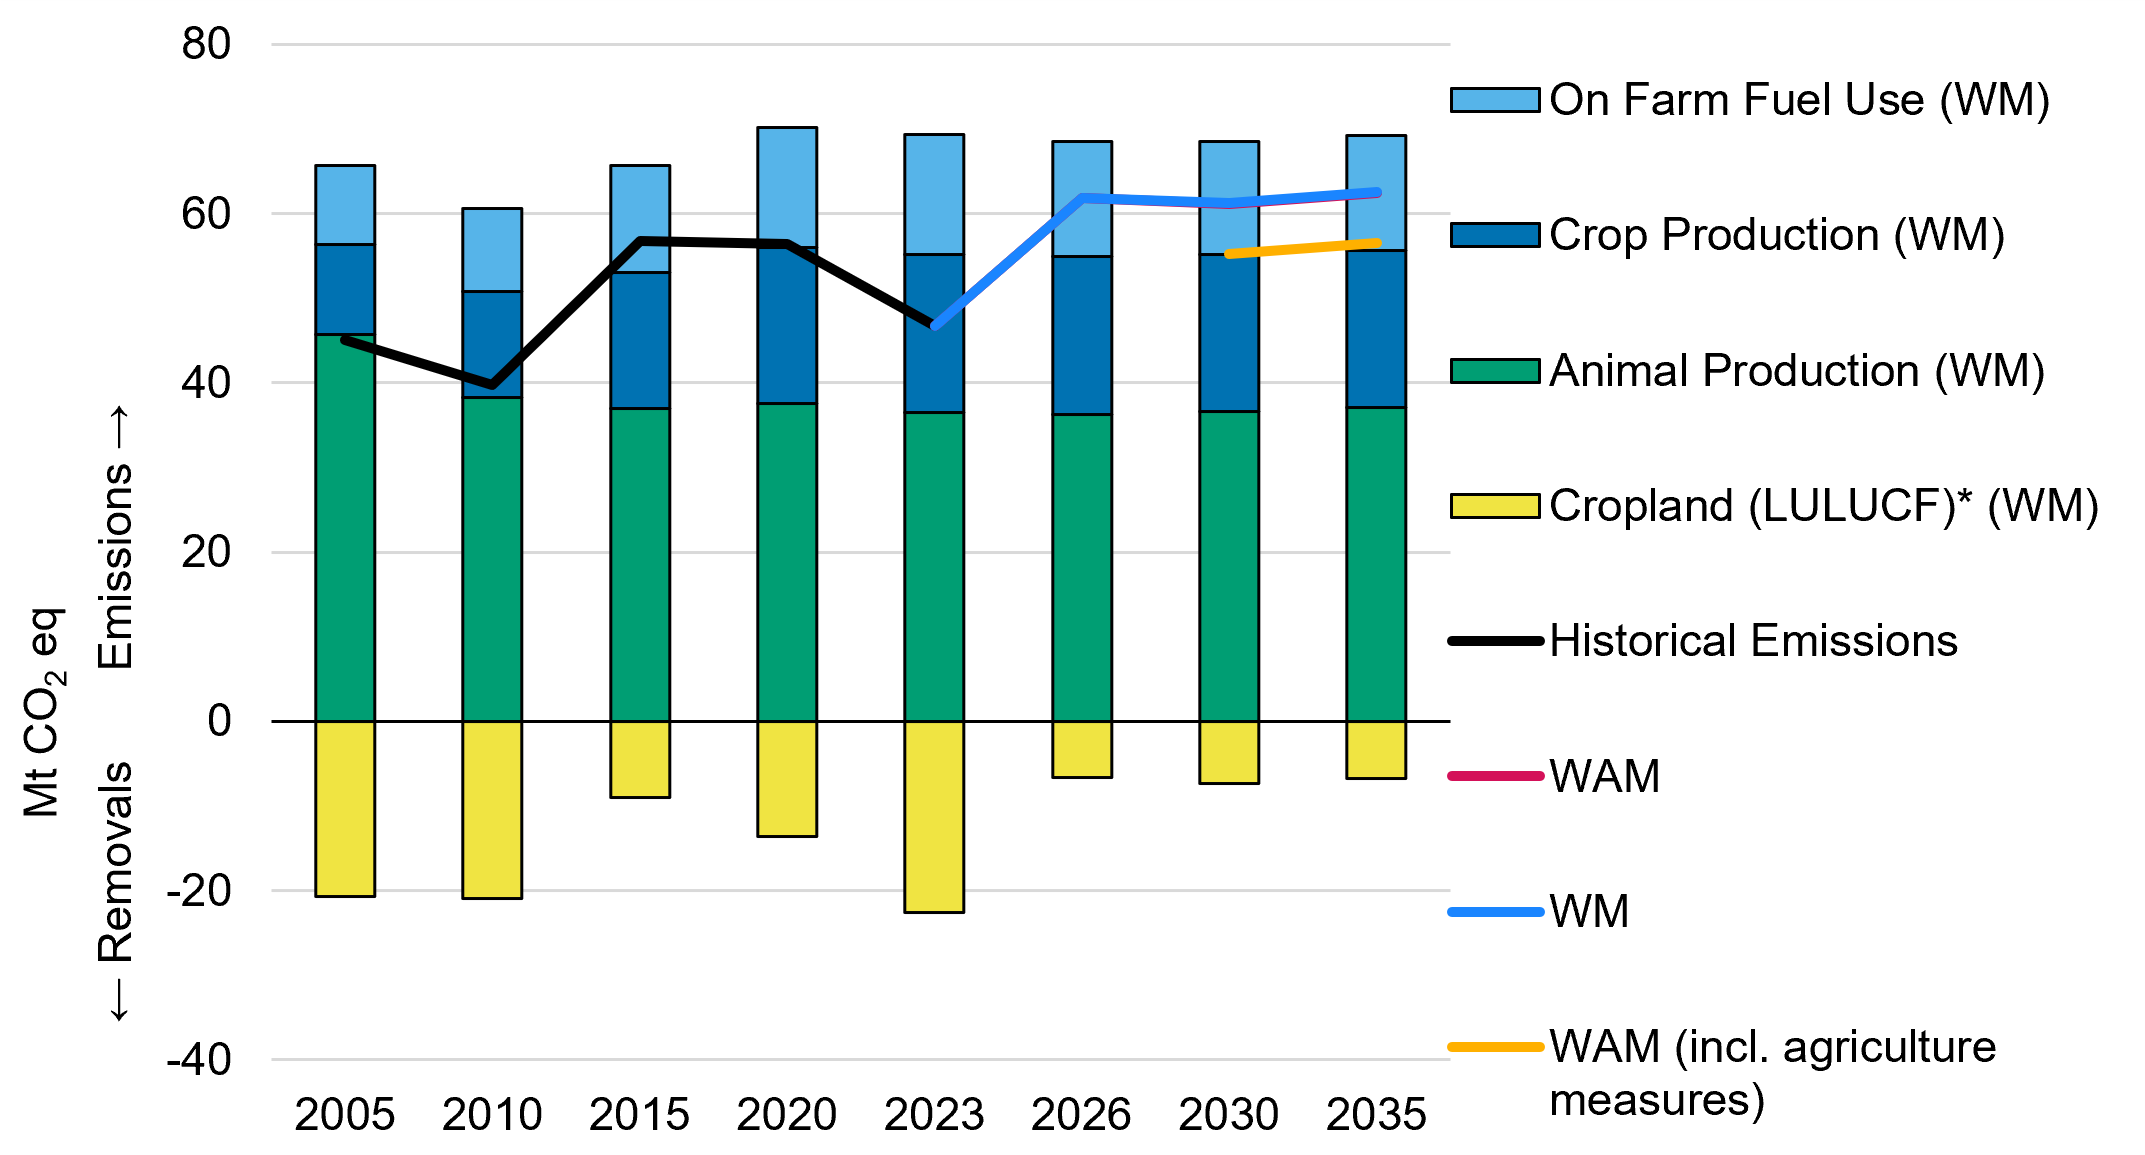
Note: Historical emissions data come from NIR2025. Access more data on the open data portal.
* Projections only include soil carbon and forest conversion components of cropland.
Long description
| Year | Animal Production (WM) | Crop Production (WM) | On Farm Fuel Use (WM) | Cropland (LULUCF)* (WM) | Historical Emissions | WM | WAM | WAM (incl. agriculture measures) |
|---|---|---|---|---|---|---|---|---|
| 2005 | 46 | 11 | 9 | -21 | 45 | - | - | - |
| 2010 | 38 | 13 | 10 | -21 | 40 | - | - | - |
| 2015 | 37 | 16 | 13 | -9 | 57 | - | - | - |
| 2020 | 38 | 18 | 14 | -14 | 56 | - | - | - |
| 2023 | 37 | 19 | 14 | -23 | 47 | 47 | 47 | - |
| 2026 | 36 | 19 | 14 | -7 | - | 62 | 62 | - |
| 2030 | 37 | 19 | 13 | -7 | - | 61 | 61 | 55 |
| 2035 | 37 | 19 | 14 | -7 | - | 62 | 62 | 56 |
2.2.7 Waste and Others
Subsectors included in the Waste and Others sector are waste, coal production, light manufacturing (e.g., food and beverage, electronics), construction, and forest resources. Emissions from the Waste and Others sector decreased by 7.3 Mt (13%) since 1990 and 3.9 Mt (7.2%) since 2005. Overall, waste subsector emissions fluctuated and slightly increased over the time series, from 21 Mt in 1990 to 23 Mt in 2023. Section 2.3 of NIR2025 discusses the main historical drivers of emissions trends associated with the sector.
| Subsector | 1990 | 2005 | 2023 | 2026a | 2030a | 2035a | 2026b | 2030b | 2035b |
|---|---|---|---|---|---|---|---|---|---|
| Waste | 21 | 24 | 23 | 23 | 23 | 24 | 23 | 15 | 15 |
| Coal Production | 5 | 3 | 4 | 4 | 3 | 3 | 3 | 3 | 3 |
| Light Manufacturing, Construction and Forest Resources | 31 | 27 | 24 | 21 | 23 | 25 | 21 | 22 | 24 |
| Total | 57 | 54 | 50 | 48 | 50 | 51 | 48 | 41 | 42 |
Note: Numbers may not sum to the total due to rounding. Historical data up to 2023 are sourced from NIR2025. Data from 2024 to 2035 are modelled projections developed using ECCC’s analytical framework. Access more data on the open data portal.
a Projections under the WM scenario.
b Projections under the WAM scenario.
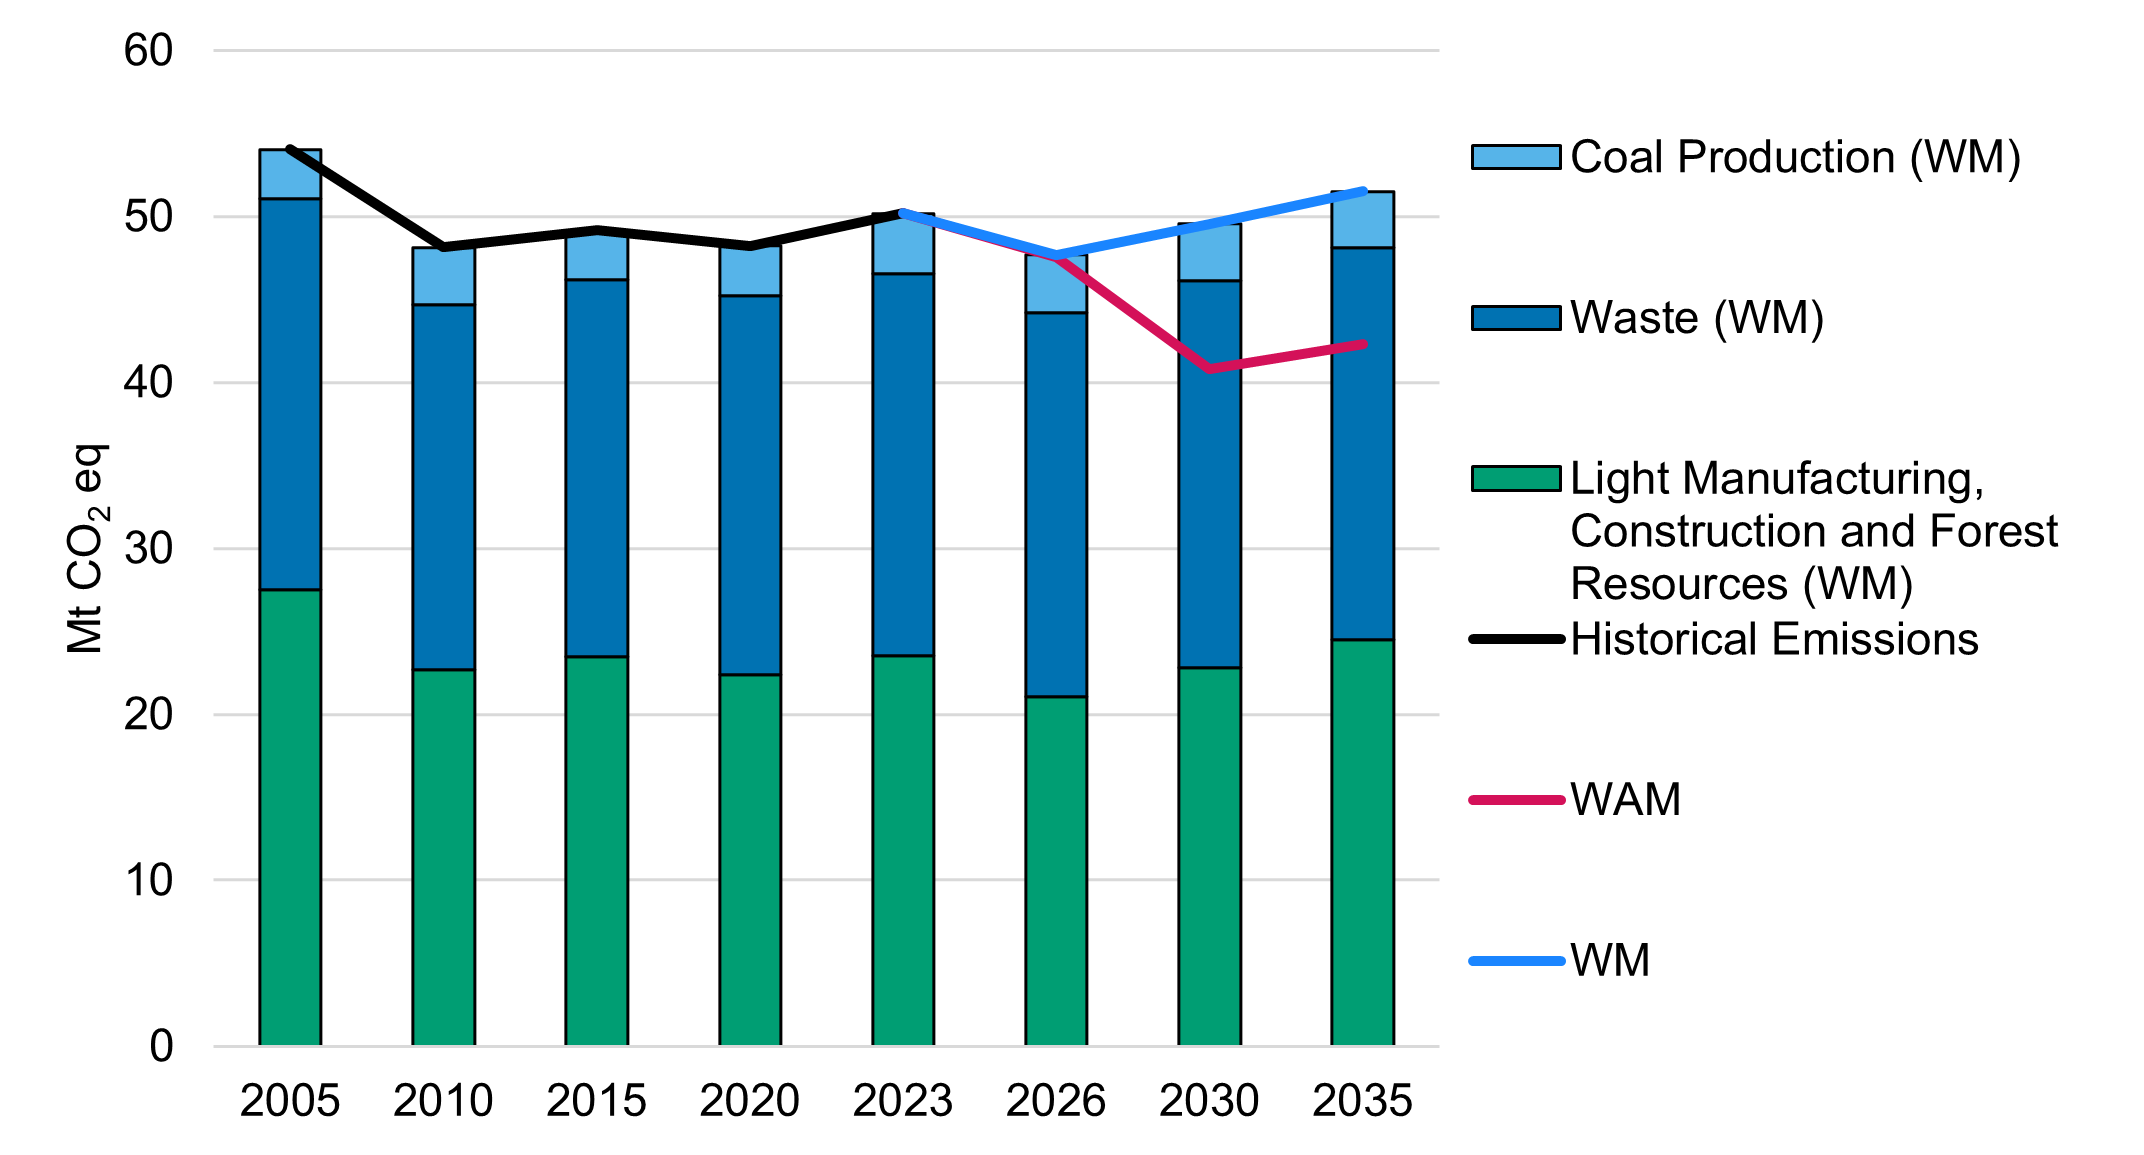
Note: Historical emissions data come from NIR2025. Access more data on the open data portal.
Long description
| Year | Coal Production (WM) | Light Manufacturing, Construction and Forest Resources (WM) | Waste (WM) | Historical Emissions | WM | WAM |
|---|---|---|---|---|---|---|
| 2005 | 3 | 27 | 24 | 54 | - | - |
| 2010 | 3 | 23 | 22 | 48 | - | - |
| 2015 | 3 | 23 | 23 | 49 | - | - |
| 2020 | 3 | 22 | 23 | 48 | - | - |
| 2023 | 4 | 24 | 23 | 50 | 50 | 50 |
| 2026 | 4 | 21 | 23 | - | 48 | 48 |
| 2030 | 3 | 23 | 23 | - | 50 | 41 |
| 2035 | 3 | 25 | 24 | - | 51 | 42 |
Aggregate GHG emissions from the Waste and Others sector are projected to remain relatively stable between 2024 and 2030 in the WM scenario, staying close to 2023 levels. This trend reflects the influence of provincial and territorial waste diversion programs and landfill gas regulations, which help limit emissions from the waste subsector. In the light manufacturing and other subsectors, emissions are contained by the industrial fuel charge, Québec-based decarbonization programs, and initiatives aimed at improving energy efficiency. Emissions from coal production also remain relatively stable during this period, largely due to flat demand for coal, particularly metallurgical coal.
Between 2031 and 2035, emissions in the Waste and Others sector are projected to slightly increase relative to 2030 levels, primarily due to growth in the light manufacturing and other subsectors. In contrast, emissions from the waste subsector are expected to remain flat over this period, despite population growth. This stability is supported by continued implementation of waste diversion policies that reduce landfill disposal, as well as landfill gas regulations in British Columbia, Québec, and Ontario, which help lower emissions in those provinces.
In the WAM scenario, emissions from the Waste and Others sector are lower than in the WM scenario, with the most significant reductions occurring in the solid waste and light manufacturing subsectors. These reductions are driven by additional measures, including the federal Landfill Methane Regulations and carbon revenue returns. Throughout the projections period, emissions are projected to decline relative to 2023 levels. However, between 2030 and 2035, emissions in the light manufacturing subsectors are expected to rise slightly due to increased economic activity, though they remain below or equal to 2023 levels.
The Landfill Methane Regulations were finalized on December 16, 2025, which was too late for inclusion in the WM scenario, and thus they were included only in the WAM scenario.
2.2.8 Carbon capture and storage
Incentives such as the industrial fuel charge, the CFR, and the federal CCUS ITC support the development of CCS technologies over the projection period. In the WAM scenario, the Alberta Carbon Capture Incentive Program is also included, further enhancing support for CCS deployment.
In the WM scenario, approximately 14 Mt of CCS capacity is projected to be in place by 2030 (an increase of about 11 Mt compared to 2023 levels), with about half originating from the Oil and Gas sector. Most government programs that incentivize CCS construction reach full implementation by 2030 and gradually taper off afterward. Given an assumed four-year construction timeline, CCS contributions to emissions reductions are projected to peak in 2035.
In the WAM scenario, increased electric vehicle adoption generates more CFR credits, which lowers the credit price and reduces the incentive for upstream producers to deploy CCS. However, this reduction is offset by the inclusion of Alberta’s Carbon Capture Incentive Program and the modelling of several announced projects, including Strathcona, Shell’s Polaris, and Entropy’s Glacier Phase 2. As a result, CCS is projected to contribute more to emissions reductions in the WAM scenario than in the WM scenario, with abatement levels projected to peak in 2035.
In the WM scenario, CCS related to hydrogen production remains relatively stable between 2030 and Table 11 provides further detail on CCS associated with hydrogen production.
| Sector | 2023 | 2026a | 2030a | 2035a | 2026b | 2030b | 2035b |
|---|---|---|---|---|---|---|---|
| Electricity | -0.8 | -0.7 | -0.7 | -3.8 | -0.7 | -0.7 | -4.3 |
| Heavy Industry | NA | -0.2 | -1.9 | -6.1 | -0.2 | -1.4 | -7.5 |
| Hydrogen Production | NA | 0.0 | -4.1 | -3.8 | 0.0 | -4.5 | -4.2 |
| Oil and Gas | -2.3 | -2.5 | -7.4 | -9.6 | -2.7 | -12.3 | -14.4 |
| Total | -3.1 | -3.3 | -14.1 | -23.2 | -3.5 | -18.9 | -30.4 |
Note: Numbers may not sum to the total due to rounding. Historical data up to 2023 are sourced from NIR2025. Data from 2024 to 2035 are modelled projections developed using ECCC’s analytical framework. Access more data on the open data portal.
a Projections under the WM scenario.
b Projections under the WAM scenario.
2.2.9 Foreign passenger and foreign freight
Emissions from foreign passenger and foreign freight transportation are excluded from Canada’s national total, in accordance with the 2006 IPCC Guidelines for National Greenhouse Gas Inventories. Under these guidelines, the distinction between international and domestic emissions is based on the origin and destination of each trip, rather than the nationality of the air or maritime carrier.
Following a decline in 2020 and 2021 due to the COVID-19 pandemic, emissions from foreign passenger transport rebounded in 2023 and showed an overall increase compared to 1990 levels. Over the projection period, emissions are expected to continue rising slightly. These projections incorporate anticipated energy efficiency improvements, including voluntary emissions reduction agreements with the aviation industry.
| Subsector | 2005 | 2023 | 2026a | 2030a | 2035a | 2026b | 2030b | 2035b |
|---|---|---|---|---|---|---|---|---|
| Foreign Freight | 6 | 3 | 5 | 5 | 5 | 5 | 5 | 5 |
| Foreign Passenger | 10 | 14 | 12 | 12 | 13 | 12 | 12 | 13 |
| Total | 16 | 17 | 17 | 17 | 17 | 17 | 17 | 17 |
Note: Numbers may not sum to the total due to rounding. Historical data up to 2023 are sourced from NIR2025. Data from 2024 to 2035 are modelled projections developed using ECCC’s analytical framework. Access more data on the open data portal.
a Projections under the WM scenario.
b Projections under the WAM scenario.
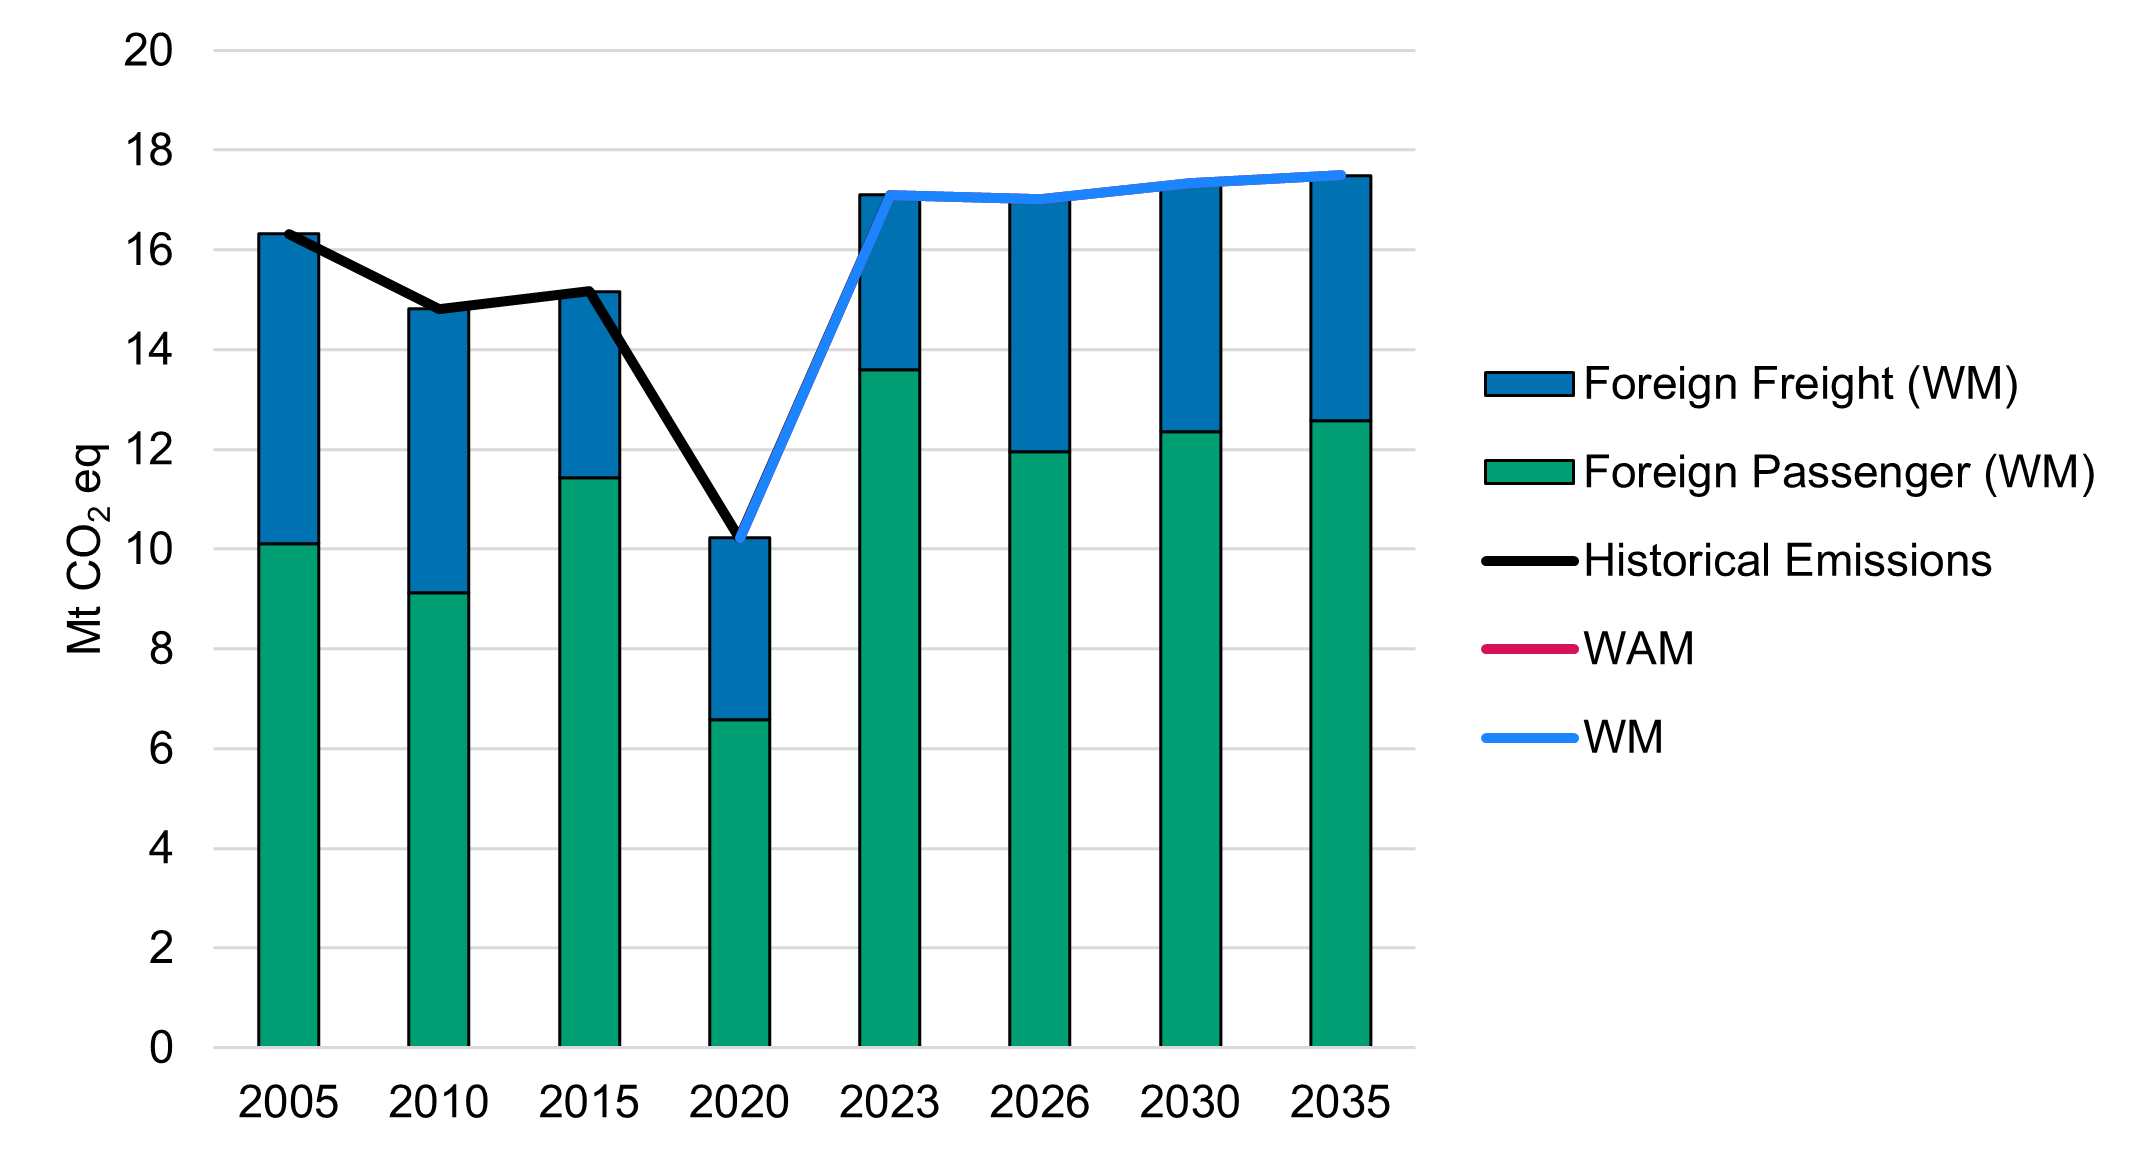
Note: Historical emissions data come from NIR2025. Access more data on the open data portal.
Long description
| Year | Foreign Freight (WM) | Foreign Passenger (WM) | Historical Emissions | WM | WAM |
|---|---|---|---|---|---|
| 2005 | 6 | 10 | 16 | - | - |
| 2010 | 6 | 9 | 15 | - | - |
| 2015 | 4 | 11 | 15 | - | - |
| 2020 | 4 | 7 | 10 | 10 | 10 |
| 2023 | 4 | 14 | 17 | 17 | 17 |
| 2026 | 5 | 12 | - | 17 | 17 |
| 2030 | 5 | 12 | - | 17 | 17 |
| 2035 | 5 | 13 | - | 17 | 17 |
2.2.10 Land use, land-use change and forestry, nature-based climate solutions, and agriculture measures
Recent technical reviews of Canada's National Communications and Biennial Reports noted that information related to the LULUCF contribution to national emissions reductions targets was spread across multiple sections of the National Communication, Biennial Report, and NIR. To address this, the current section brings together all relevant details on LULUCF reporting, projecting, and accounting in one place, offering a clear and complete overview of the sector. More detailed information about the methodology used to generate the projections is provided in Sections A1.5 and A1.7.
2.2.10.1 Overview
The LULUCF sector accounts for the net GHG flux (both GHG emissions and carbon removals) from managed lands in Canada. These include forest land (FL), cropland (CL), wetlands (WL), grasslands (GL), settlements (SL), and other land categories. The sector also tracks the net change in carbon storage in HWP as well as GHG fluxes from land-use change activities.
In Canada’s emissions projections, the LULUCF sector is treated as a distinct accounting element, separate from economic sectors. Canada uses specific accounting rules for the LULUCF sector to determine its contribution to Canada’s progress towards its emissions targets. This contribution, referred to as the LULUCF accounting contribution, is included in both the WM and WAM scenarios. Detailed LULUCF accounting contribution data by LULUCF subcategory are presented in Section 2.2.10.4 and the LULUCF accounting framework is described in more detail in Section A1.6.3.
The projected GHG impact of NBCS and agriculture measures (which refers to NBCS on agricultural land and other agriculture emissions reduction programs not currently modelled) are included in the WAM scenario. More information on NBCS and agriculture measures is available in section 2.2.10.4 and section A1.7.
The projected LULUCF accounting contribution and projected GHG impact of NBCS and agriculture measures can be seen in Figure 19, along with the breakdown of LULUCF accounting by land category from 2024 to 2035.
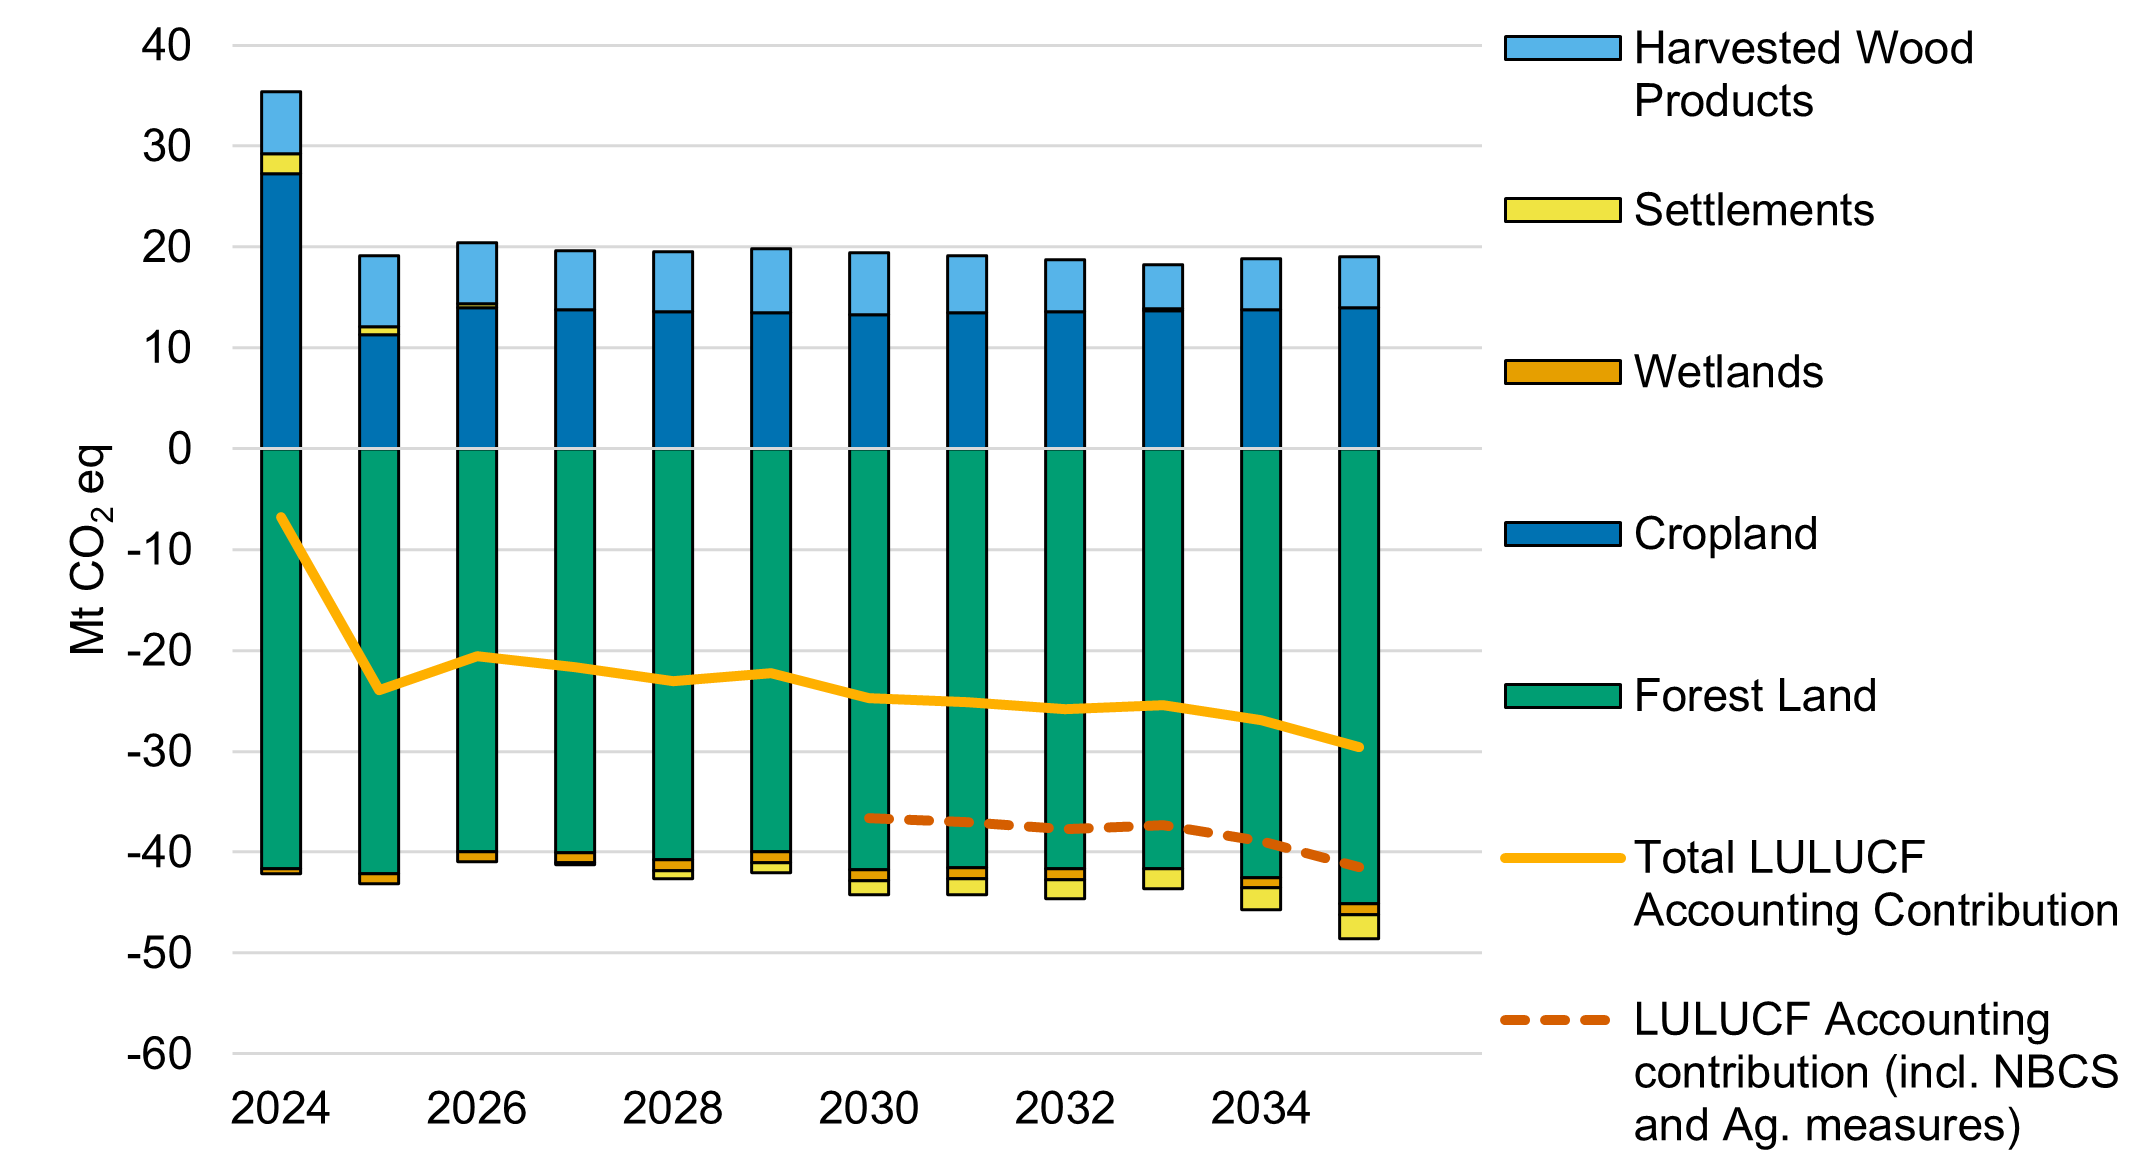
Note: LULUCF accounting is included in both the WM and WAM scenarios. The GHG impact of NBCS and Ag. Measures are included in the WAM scenario.
Long description
| Year | Forest Land Cropland | Wetlands | Settlements | Harvested Wood Products | Total LULUCF Accounting Contribution | LULUCF Accounting contribution (incl. NBCS and Ag. measures) | |
|---|---|---|---|---|---|---|---|
| 2024 | -42 | 27 | 0 | 2 | 6 | -7 | - |
| 2025 | -42 | 11 | -1 | 1 | 7 | -24 | - |
| 2026 | -40 | 14 | -1 | 0 | 6 | -21 | - |
| 2027 | -40 | 14 | -1 | 0 | 6 | -22 | - |
| 2028 | -41 | 14 | -1 | -1 | 6 | -23 | - |
| 2029 | -40 | 13 | -1 | -1 | 6 | -22 | - |
| 2030 | -42 | 13 | -1 | -1 | 6 | -25 | -37 |
| 2031 | -42 | 13 | -1 | -2 | 6 | -25 | -37 |
| 2032 | -42 | 14 | -1 | -2 | 5 | -26 | -38 |
| 2033 | -42 | 14 | 0 | -2 | 4 | -25 | -37 |
| 2034 | -42 | 14 | -1 | -2 | 5 | -27 | -39 |
| 2035 | -45 | 14 | -1 | -2 | 5 | -30 | -42 |
| 2036 | -43 | 14 | -1 | -3 | 4 | -28 | -40 |
| 2037 | -42 | 14 | -1 | -3 | 3 | -29 | -41 |
| 2038 | -42 | 14 | -1 | -3 | 3 | -28 | -40 |
| 2039 | -42 | 14 | -1 | -3 | 3 | -29 | -41 |
| 2040 | -43 | 14 | -1 | -3 | 3 | -30 | -42 |
Table 13 presents the aggregate LULUCF accounting contribution (which includes the GHG impact of the 2 Billion Trees program as estimated prior to Budget 2025 announcements) for selected years from 2018 to 2035, as well as projected GHG impact of NBCS and agriculture measures for 2030, and 2035.
| GHG Impact Component | 2018 | 2019 | 2020 | 2021 | 2022 | 2023 | 2026 | 2030 | 2035 |
|---|---|---|---|---|---|---|---|---|---|
| LULUCF Accounting Contribution | -17 | -25 | -23 | -29 | 8.8 | -39 | -21 | -25 | -30 |
| NBCS and Agriculture Measures | NA | NA | NA | NA | NA | NA | NA | -12 | -12 |
| Total | -17 | -25 | -23 | -29 | 8.8 | -39 | -21 | -37 | -42 |
Note: Historical estimates up to 2023 include all LULUCF subcategories and are based on net GHG flux estimates in NIR2025. Data from 2024 to 2035 are modelled projections. Projected estimates include only those components for which projections are available. Estimates for the GHG impact of NBCS and Agriculture Measures are subject to high uncertainty and may be revised as more data become available. Access more data on the open data portal.
2.2.10.2 LULUCF sector historical and projected net flux
The LULUCF sector reports positive net fluxes (i.e., carbon emissions) during all years of the historical estimates, reaching a peak in the mid 2000s and declining thereafter. The historical net GHG flux is also impacted by the high interannual variability in the Cropland category. The downward trend is projected to continue throughout the projection period, with the LULUCF sector switching from a source to sink before 2030.
Fluxes from the Forest Land and HWP categories are the largest contributor of the LULUCF sector and come from the harvest of mature stands and milling and disposal of forest products. Net emissions from the combination of these two categories increased during the 1990 to 2005 period. However, they have been declining since, because of the impact of the mountain pine beetle and lower forest harvest rates. Harvest rates are projected to continue to remain below that of the early historical period. As a result, these categories combined are projected to become a net carbon sink in 2026 and continue their decline through 2035.
Historically, cropland in Canada has acted as a net carbon sink, largely due to the adoption of conservation tillage and improved crop and soil management practices. However, recent trends indicate these benefits are having a reduced impact over time as soil sequestration rates reach saturation and the adoption rates of these practices slow, leading to fewer new adopters. In addition, annual crops are becoming a greater proportion of cropland, resulting in a decline in Cropland removals and increased interannual variability. Despite these factors, projections of this category suggest that Cropland will remain a carbon sink driven by increased crop productivity and associated soil carbon inputs, conservation tillage, land-use patterns and changing market and dietary trends.
GHG flux projections from LULUCF are modelled separately from other sectors. Table 14 presents the aggregate projected LULUCF net GHG flux for selected years from 1990 to 2035. Historical net GHG flux estimates are found in open data Table A32 (also presented in Table 6-1 of NIR2025 or the full time series on open data), while open data Table A33 presents detailed historical and projected estimates of net GHG fluxes from all LULUCF subcategories for which projections are available to facilitate a more complete understanding of the projected accounting contributions. As a result, some of the historical information in open data Table A33 differs from open data Table A32. More information on methodology for the development of historical and projected estimates is available in Section A1.6.3 and Section A1.6.4.
| Category | 1990 | 2005 | 2018 | 2019 | 2020 | 2021 | 2022 | 2023 | 2026 | 2030 | 2035 |
|---|---|---|---|---|---|---|---|---|---|---|---|
| Total LULUCF | 50 | 66 | 24 | 15 | 25 | 15 | 51 | 4.2 | 7.1 | -1.4 | -9.6 |
Note: Historical estimates up to 2023 are sourced from NIR2025 and include all LULUCF subcategories. Data from 2024 to 2035 are modelled projections developed using various projections frameworks. Projected estimates include only components for which projections are available. Access more data on the open data portal.
2.2.10.3 LULUCF accounting contribution
Tables A32 to A36 are available only on the Government of Canada open data portal. Historical estimates and projections of LULUCF net GHG fluxes and accounting contributions in these tables are rounded to two significant figures (except for values under 1.0 kt CO2 eq, which are rounded to the first decimal) based on the same rounding protocol used in Canada's NIR.
Tables A34, A35, and A36 present historical and projected accounting contributions, calculated using unrounded data and then rounded according to the protocol outlined in this section.
- Table A34, shows the contribution from FLFL and associated HWP, derived using the Reference Level (RL) approach
- Table A35, presents historical contributions from all LULUCF subsectors for selected years, based on Net-net accounting (Table A32) and RL accounting (Table A34)
- Table A36 provides projected contributions for 2030, and 2035 based on estimates from Table A33 and Table A34 for subcategories with available projections
- Results from Tables A35 and A36 are not directly comparable due to the exclusion of subcategories without projections in Table A36
FLFL and associated HWP represent the largest share of historical accounting contributions, increasing through 2023 (open data Table A34 and A35). The RL approach (see Section A.1.6.2.1 for more details) calculates the difference between the net GHG flux under projected harvest rates and those under a continuation of historical harvest rates and practices. Because projected harvest rates remain slightly below historical averages, the accounting contribution remains relatively stable through 2035. Since BTR1, the projected accounting credit for 2030 from FLFL and HWP has decreased due to minor methodological changes. These two categories remain the greatest contributor to the LULUCF sector’s total projected contribution for 2030.
Forest conversion is accounted for using the Net-net approach (see Section A.1.6.2.2 for more details on the Net-net approach). The increasing projected accounting credit from 2030 to 2035 (open data Table A35) reflects the projected decline in forest conversion rates since 2005. Recalculations in this category occurred due to changes in the reporting of HWP. Carbon transfers to the HWP pool are now reported in the source land category which results in an apparent upward recalculation equivalent to the carbon transfer out of the source land ecosystem. Details are provided in Chapter 6, section 6.3.1.5 of NIR2025. This reporting change results in an upward adjustment to the projected accounting contribution of HWP from forest conversion. At the same time, it results in a corresponding reduction to the projected accounting contribution from land subcategories impacted by forest conversion (Forest Land Converted to Cropland, Forest Land Converted to Wetlands, and Forest Land Converted to Settlements) leading to no overall impact on total accounting contribution.
The historical estimates for Cropland Remaining Cropland (CLCL) category includes estimates from field crops, summer fallow, hayfields, pastures and woody biomass from shelterbelts and orchards. The historical accounting contributions from CLCL vary significantly due to fluctuations in yield associated with interannual differences in growing season weather. For example, there is a large debit in 2022 (open data Table A35) as the decomposition of soil carbon exceeded the amount of crop residue carbon added to the soils. While open data Table A32 includes annual carbon dioxide fluxes from woody biomass on CLCL, these are excluded from projections in open data Table A33 due to the uncertainty of future disturbed areas. Since last year’s projections, the methodological changes to soil carbon emissions and accounting estimates have been relatively minor. Most notably, the 2025 analysis incorporated the addition of perennial crop areas on cultivated organic soils, as well as updated emission factors for both annual and perennial crops. Details are provided in Chapter 6, Section 6.5.1.1 of NIR2025.
2.2.10.4 Nature-based climate solutions and agriculture measures
NBCS leverage the capacity of natural ecosystems to reduce GHG emissions, enhance carbon sequestration, and increase resilience to climate-related risks, while also supporting biodiversity and benefiting local communities. They are implemented across forests, grasslands, wetlands, and agricultural lands, and include activities such as avoided conversion of carbon-rich lands, restoration of degraded ecosystems and improved land management practices to enhance carbon sequestration. Specific examples include changing farming practices, restoration of wetlands and perennial lands, and afforestation and reforestation efforts. Key initiatives included in this year’s projections: the Government of Canada’s prior commitment to plant two billion trees by 2031, restoration of degraded ecosystems, improved land management practices, conservation of at-risk lands.
Practices that support NBCS in Canada are funded through two main initiatives. The first is the Natural Climate Solutions Fund horizontal initiative, which covers NRCan’s 2 Billion Trees program, ECCC’s Nature Smart Climate Solutions Fund, and Agriculture and Agri-Food Canada’s (AAFC’s) Agricultural Climate Solutions Program. The second is the Sustainable Canadian Agricultural Partnership, which includes the Resilient Agricultural Landscape Program.
Table 15 presents the projected GHG impact of NBCS (excluding 2 Billion Trees, as those impacts are already reflected in the historical and projected accounting LULUCF accounting contribution) and agriculture measures by program category for 2030 and 2035. The estimated GHG impact from these programs is not an accounting value but represents how accounting contributions could change in the presence of these programs and thus are incremental to the LULUCF accounting contribution, as presented in Table 13. The ACT program and nitrogen management components of programs listed above are not included in Table 15 as they are now included in the modelling of Agriculture emissions in the WM scenario. The projected GHG impact estimates were calculated before the Budget 2025 announcement about the 2 Billion Trees program and will be revised in future reports.
| Category | 2030 | 2035 |
|---|---|---|
| Agriculture Measures: Living Labs program, On−Farm Climate Action Fund, Sustainable Canadian Agriculture Partnership, Resilient Agricultural Landscapes Program | −6 | −6 |
| Nature-Smart Climate Solutions: includes avoided conversion of wetlands, grasslands, and forests, restoration of wetlands and grasslands, and improved forest management | −5 to −7 (−6) |
−5 to −7 (−6) |
| Total Additional Reductions from Nature-Based Climate Solutions and Agriculture Measures | −11 to −13 (−12) |
−11 to −13 (−12) |
2.3 Alternative perspectives on emissions
This section provides GHG emissions projections organized by IPCC reporting category, gas type, emissions intensity, and geographic distribution. These perspectives support Canada’s domestic policy development and international reporting obligations under the UNFCCC and the IPCC Guidelines for National Greenhouse Gas Inventories.
2.3.1 Emissions projections by IPCC categories
Reallocating emissions from IPCC categories to Canadian economic sectors is useful for the purpose of analyzing trends and policies. This reallocation simply recategorises emissions under different headings but does not change the overall magnitude of Canadian emission estimates. Estimates for each economic sector include emissions from energy-related and non-energy-related processes. The method used to reallocate emissions is discussed in more details in Section A1.4.
Table 16 presents projected GHG emissions by IPCC categories. Figure 20 compares the distribution of GHG emissions by IPCC categories versus Canadian economic sectors. It is important to note that total domestic emissions remain the same regardless of which classification system is used.
| IPCC Category | 1990 | 2005 | 2023 | 2026a | 2030a | 2035a | 2026b | 2030b | 2035b |
|---|---|---|---|---|---|---|---|---|---|
| Energy - Stationary Combustion and Fugitive Sources | 342 | 433 | 367 | 346 | 323 | 314 | 346 | 290 | 271 |
| Energy - Transport | 145 | 190 | 195 | 185 | 177 | 166 | 186 | 178 | 167 |
| Industrial Processes | 55 | 56 | 54 | 46 | 46 | 46 | 46 | 45 | 45 |
| Agriculture | 43 | 56 | 55 | 55 | 55 | 56 | 55 | 55 | 56 |
| Waste | 21 | 24 | 23 | 23 | 23 | 24 | 23 | 15 | 15 |
| Total | 606 | 759 | 694 | 656 | 625 | 606 | 656 | 583 | 554 |
Note: Numbers may not sum to the total due to rounding. Historical data up to 2023 are sourced from NIR2025. Data from 2024 to 2035 are modelled projections developed using ECCC’s analytical framework. Access more data on the open data portal.
a Projections under the WM scenario.
b Projections under the WAM scenario.
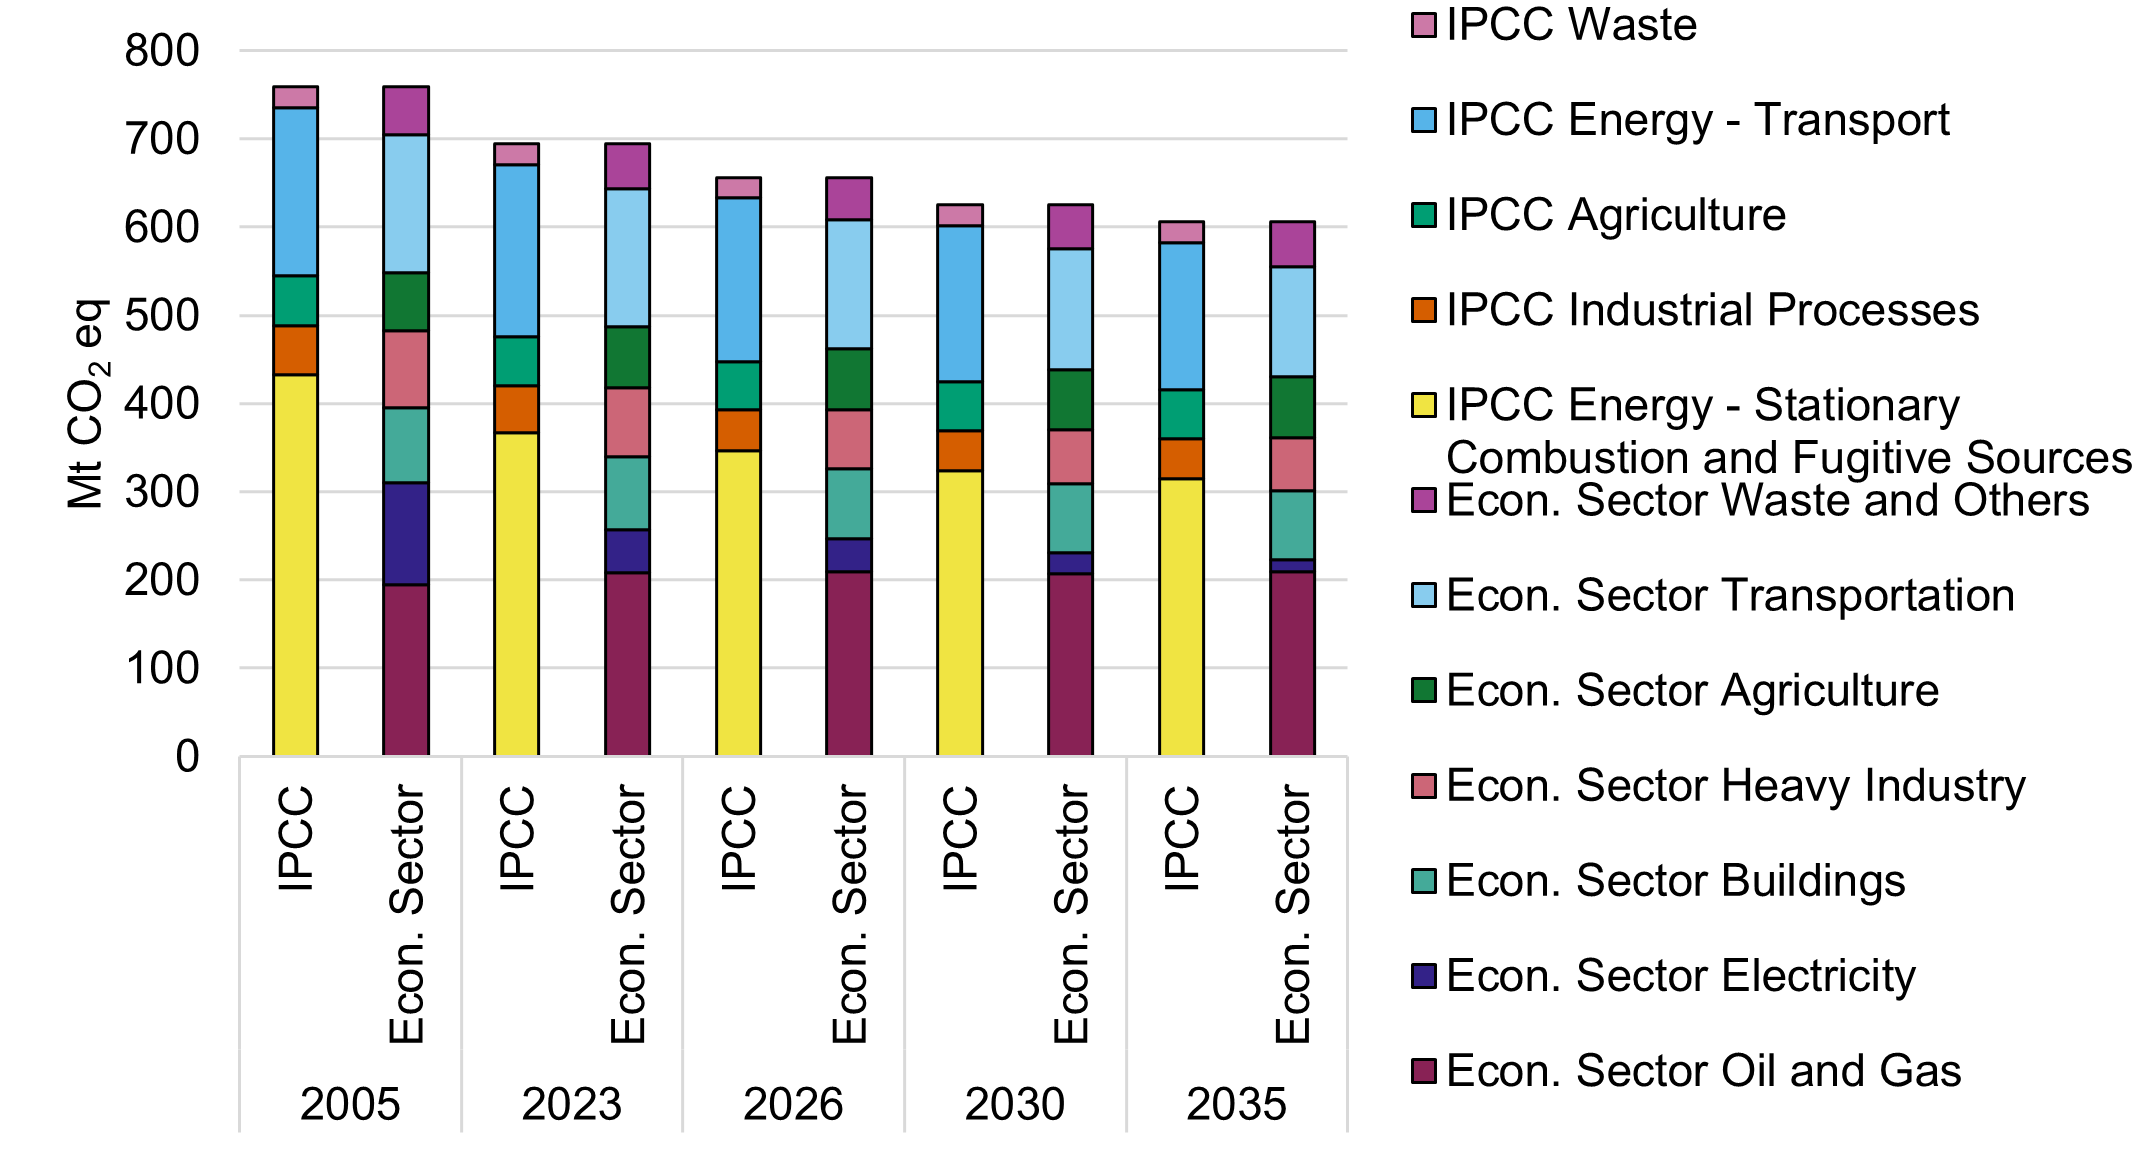
Note: Numbers may not sum to the total due to rounding. Historical emissions data come from NIR2025.
Long description
| Year | Category | Sector | Emissions |
|---|---|---|---|
| 2005 | IPCC | IPCC Energy - Transport | 190 |
| 2023 | IPCC | IPCC Energy - Transport | 195 |
| 2005 | IPCC | IPCC Industrial Processes | 56 |
| 2023 | IPCC | IPCC Industrial Processes | 54 |
| 2005 | IPCC | IPCC Agriculture | 56 |
| 2023 | IPCC | IPCC Agriculture | 55 |
| 2005 | IPCC | IPCC Waste | 24 |
| 2023 | IPCC | IPCC Waste | 23 |
| 2005 | IPCC | IPCC Energy - Stationary Combustion and Fugitive Sources | 433 |
| 2023 | IPCC | IPCC Energy - Stationary Combustion and Fugitive Sources | 367 |
| 2026 | IPCC | IPCC Energy - Transport | 185 |
| 2030 | IPCC | IPCC Energy - Transport | 177 |
| 2035 | IPCC | IPCC Energy - Transport | 166 |
| 2026 | IPCC | IPCC Industrial Processes | 46 |
| 2030 | IPCC | IPCC Industrial Processes | 46 |
| 2035 | IPCC | IPCC Industrial Processes | 46 |
| 2026 | IPCC | IPCC Agriculture | 55 |
| 2030 | IPCC | IPCC Agriculture | 55 |
| 2035 | IPCC | IPCC Agriculture | 56 |
| 2026 | IPCC | IPCC Waste | 23 |
| 2030 | IPCC | IPCC Waste | 23 |
| 2035 | IPCC | IPCC Waste | 24 |
| 2026 | IPCC | IPCC Energy - Stationary Combustion and Fugitive Sources | 346 |
| 2030 | IPCC | IPCC Energy - Stationary Combustion and Fugitive Sources | 323 |
| 2035 | IPCC | IPCC Energy - Stationary Combustion and Fugitive Sources | 314 |
| 2005 | Econ. Sector | Econ. Sector Agriculture | 66 |
| 2005 | Econ. Sector | Econ. Sector Buildings | 85 |
| 2005 | Econ. Sector | Econ. Sector Electricity | 116 |
| 2005 | Econ. Sector | Econ. Sector Heavy Industry | 88 |
| 2005 | Econ. Sector | Econ. Sector Oil and Gas | 194 |
| 2005 | Econ. Sector | Econ. Sector Transportation | 156 |
| 2005 | Econ. Sector | Econ. Sector Waste and Others | 54 |
| 2023 | Econ. Sector | Econ. Sector Agriculture | 69 |
| 2023 | Econ. Sector | Econ. Sector Buildings | 83 |
| 2023 | Econ. Sector | Econ. Sector Electricity | 49 |
| 2023 | Econ. Sector | Econ. Sector Heavy Industry | 78 |
| 2023 | Econ. Sector | Econ. Sector Oil and Gas | 208 |
| 2023 | Econ. Sector | Econ. Sector Transportation | 157 |
| 2023 | Econ. Sector | Econ. Sector Waste and Others | 50 |
| 2026 | Econ. Sector | Econ. Sector Agriculture | 69 |
| 2026 | Econ. Sector | Econ. Sector Buildings | 80 |
| 2026 | Econ. Sector | Econ. Sector Electricity | 38 |
| 2026 | Econ. Sector | Econ. Sector Heavy Industry | 67 |
| 2026 | Econ. Sector | Econ. Sector Oil and Gas | 209 |
| 2026 | Econ. Sector | Econ. Sector Transportation | 146 |
| 2026 | Econ. Sector | Econ. Sector Waste and Others | 48 |
| 2030 | Econ. Sector | Econ. Sector Agriculture | 69 |
| 2030 | Econ. Sector | Econ. Sector Buildings | 78 |
| 2030 | Econ. Sector | Econ. Sector Electricity | 23 |
| 2030 | Econ. Sector | Econ. Sector Heavy Industry | 61 |
| 2030 | Econ. Sector | Econ. Sector Oil and Gas | 207 |
| 2030 | Econ. Sector | Econ. Sector Transportation | 137 |
| 2030 | Econ. Sector | Econ. Sector Waste and Others | 50 |
| 2035 | Econ. Sector | Econ. Sector Agriculture | 69 |
| 2035 | Econ. Sector | Econ. Sector Buildings | 78 |
| 2035 | Econ. Sector | Econ. Sector Electricity | 14 |
| 2035 | Econ. Sector | Econ. Sector Heavy Industry | 60 |
| 2035 | Econ. Sector | Econ. Sector Oil and Gas | 209 |
| 2035 | Econ. Sector | Econ. Sector Transportation | 124 |
| 2035 | Econ. Sector | Econ. Sector Waste and Others | 51 |
2.3.2 Emissions by gas
This section presents detailed projections of GHG emissions by gas and economic sector, along with key trends. Total Canadian GHG emissions by gas (excluding contributions from LULUCF, NBCS, and agriculture measures) are shown in open data Table A22. GHG emissions projections by sector and by gas under the WM and WAM scenarios, excluding LULUCF accounting contribution, NBCS, and agriculture measures are presented in open data Tables A24 through A30.
For more on historical trends, refer to Section 2.2 of NIR2025.
Carbon Dioxide (CO2)
Carbon dioxide emissions increased by 87 Mt between 1990 and 2023 (open data Table A23). In the WM scenario, emissions are projected to decline by 15% from 2005 to 2030, and by 16% in the WAM scenario.
Carbon dioxide accounted for 75% of total GHG emissions in 2005. By 2030, this share is projected to rise to 77% in the WM scenario and 82% in the WAM scenario. By 2035, carbon dioxide emissions will remain stable, and are expected to represent 77% of total emissions in the WM scenario and 81% in the WAM scenario.
Between 1990 and 2023, carbon dioxide emissions rose in the Oil and Gas, Agriculture, Transportation, and Buildings sectors. It remained flat in Heavy Industry, and declined significantly in the Electricity and Waste and Others sectors. From 2023 to 2030, emissions are projected to decline across all sectors in both scenarios. The downward trend continues post-2030, especially under WAM. Figure 21 presents carbon dioxide emissions between 1990 and 2035.
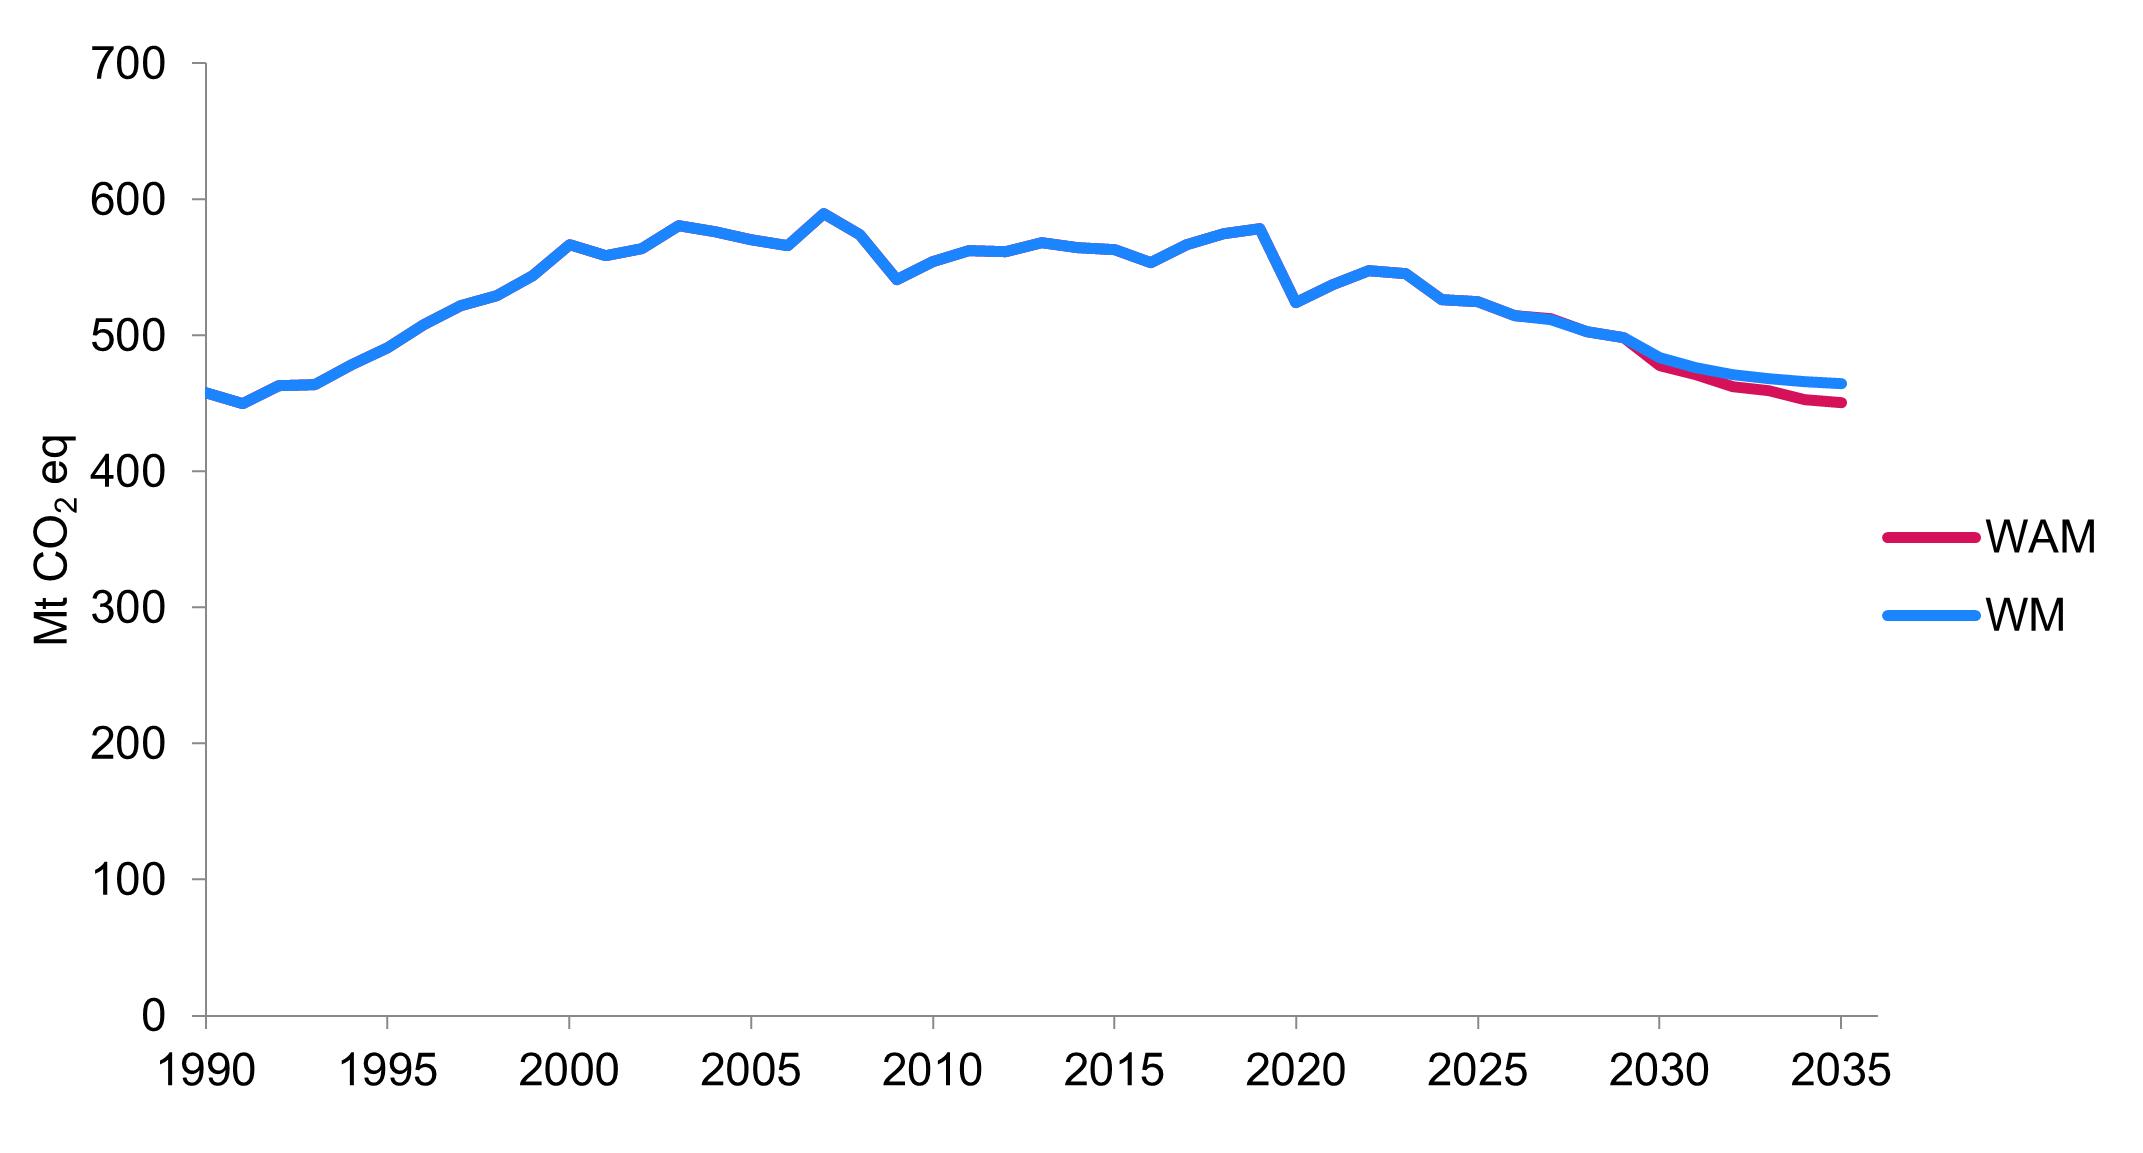
Note: Historical emissions data come from NIR2025. Access more data on the open data portal.
Long description
| Year | WM | WAM |
|---|---|---|
| 1990 | 458.0 | 458.0 |
| 1991 | 449.8 | 449.8 |
| 1992 | 463.4 | 463.4 |
| 1993 | 464.1 | 464.1 |
| 1994 | 478.5 | 478.5 |
| 1995 | 491.3 | 491.3 |
| 1996 | 507.8 | 507.8 |
| 1997 | 522.0 | 522.0 |
| 1998 | 529.6 | 529.6 |
| 1999 | 543.9 | 543.9 |
| 2000 | 566.7 | 566.7 |
| 2001 | 559.0 | 559.0 |
| 2002 | 564.3 | 564.3 |
| 2003 | 581.2 | 581.2 |
| 2004 | 576.3 | 576.3 |
| 2005 | 570.4 | 570.4 |
| 2006 | 566.3 | 566.3 |
| 2007 | 590.0 | 590.0 |
| 2008 | 574.2 | 574.2 |
| 2009 | 541.1 | 541.1 |
| 2010 | 554.3 | 554.3 |
| 2011 | 562.8 | 562.8 |
| 2012 | 561.8 | 561.8 |
| 2013 | 568.6 | 568.6 |
| 2014 | 564.9 | 564.9 |
| 2015 | 563.0 | 563.0 |
| 2016 | 553.7 | 553.7 |
| 2017 | 566.7 | 566.7 |
| 2018 | 575.1 | 575.1 |
| 2019 | 579.0 | 579.0 |
| 2020 | 524.2 | 524.2 |
| 2021 | 537.5 | 537.5 |
| 2022 | 547.7 | 547.7 |
| 2023 | 545.5 | 545.5 |
| 2024 | 526.5 | 526.8 |
| 2025 | 524.8 | 525.0 |
| 2026 | 514.5 | 514.9 |
| 2027 | 511.8 | 512.7 |
| 2028 | 502.8 | 503.0 |
| 2029 | 498.3 | 498.6 |
| 2030 | 483.5 | 477.7 |
| 2031 | 476.5 | 471.3 |
| 2032 | 471.0 | 462.3 |
| 2033 | 468.0 | 459.2 |
| 2034 | 466.0 | 452.7 |
| 2035 | 464.9 | 450.4 |
Methane (CH4)
Methane emissions peaked at 152 Mt CO2 eq in 2006 and declined to 109 Mt by 2023. Methane accounted for 20% of total emissions in 2005 and 16% in 2023 (open data Table A24).
Key sources in 2023 included Oil and Gas, Agriculture, and Waste (particularly landfills). Emissions rose from 1990 to 2006 due to increased oil and gas production, then declined due to improved practices and regulations. Two key regulations targeting methane emissions, the Enhanced Oil and Gas Methane Regulations and the Landfill Methane Regulations, were finalized on December 16, 2025. It was too late for inclusion in the WM scenario, however, they were included in the WAM scenario and will be incorporated in WM scenario in future updates.
In the WM scenario, methane emissions are projected to fall by 1% from 2023 to 2030. The WAM scenario projects a significant decrease in emissions due to the Enhanced Oil and Gas Methane Regulations and Landfill Methane Regulations, including a 43% drop from the Oil and Gas sector.
By 2035, methane emissions are expected to remain near 2030 levels, with a 1% increase in the WM scenario and no change in the WAM scenario. Under the Global Methane Pledge, Canada aims to reduce methane emissions by 30% below 2020 levels by 2030. Methane emissions are projected to be 8% below 2020 levels in the WM scenario and 39% lower in the WAM scenario by 2030. Figure 22 presents Canadian methane emissions between 1990 and 2035.
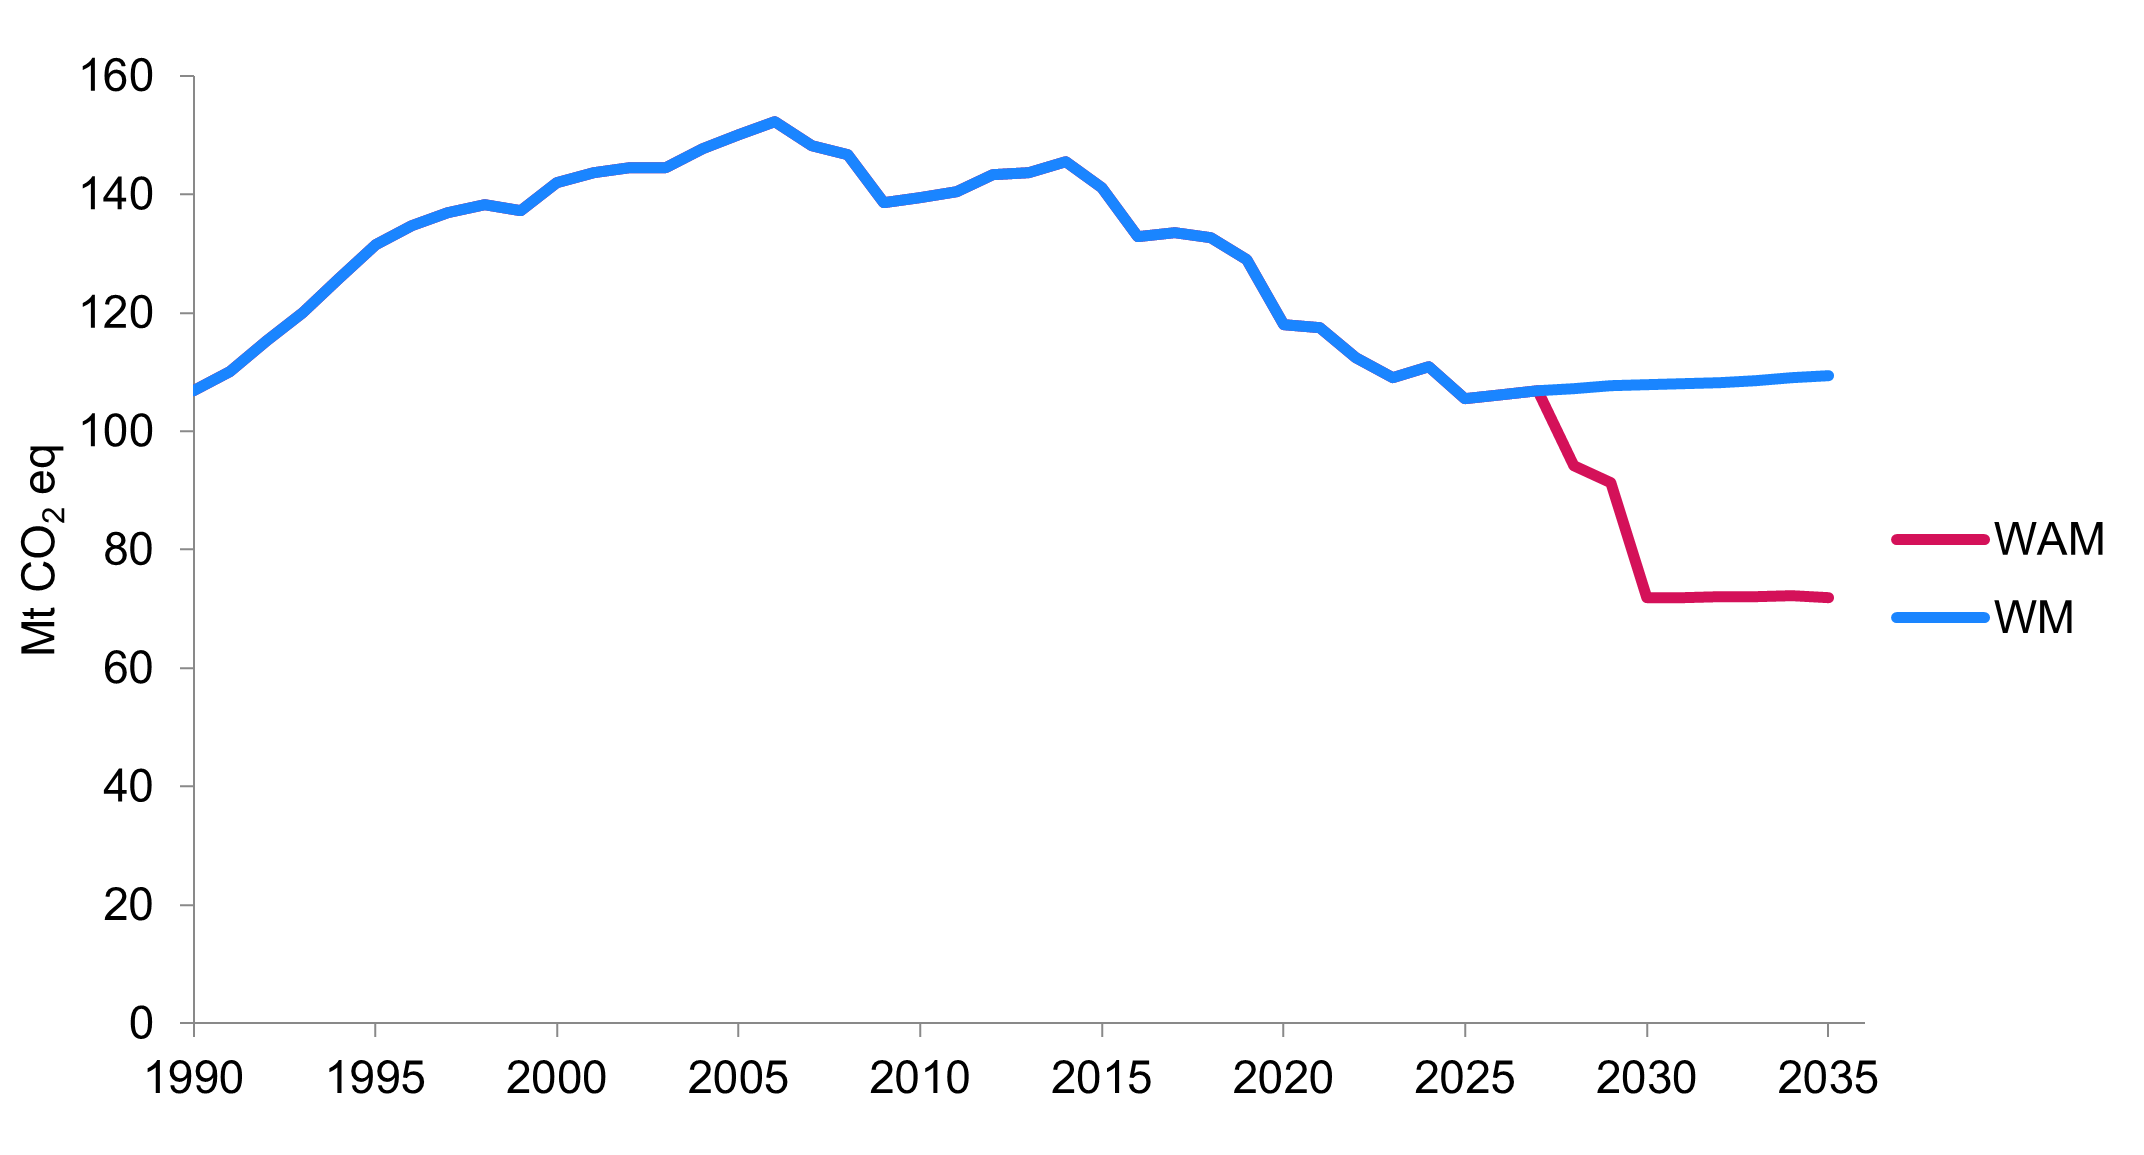
Note: Historical emissions data come from NIR2025. Access more data on the open data portal.
Long description
| Year | WM | WAM |
|---|---|---|
| 1990 | 106.9 | 106.9 |
| 1991 | 110.1 | 110.1 |
| 1992 | 115.2 | 115.2 |
| 1993 | 120.0 | 120.0 |
| 1994 | 125.8 | 125.8 |
| 1995 | 131.5 | 131.5 |
| 1996 | 134.6 | 134.6 |
| 1997 | 136.9 | 136.9 |
| 1998 | 138.3 | 138.3 |
| 1999 | 137.3 | 137.3 |
| 2000 | 142.0 | 142.0 |
| 2001 | 143.6 | 143.6 |
| 2002 | 144.4 | 144.4 |
| 2003 | 144.5 | 144.5 |
| 2004 | 147.7 | 147.7 |
| 2005 | 150.0 | 150.0 |
| 2006 | 152.2 | 152.2 |
| 2007 | 148.2 | 148.2 |
| 2008 | 146.7 | 146.7 |
| 2009 | 138.6 | 138.6 |
| 2010 | 139.5 | 139.5 |
| 2011 | 140.4 | 140.4 |
| 2012 | 143.4 | 143.4 |
| 2013 | 143.7 | 143.7 |
| 2014 | 145.5 | 145.5 |
| 2015 | 141.0 | 141.0 |
| 2016 | 132.9 | 132.9 |
| 2017 | 133.5 | 133.5 |
| 2018 | 132.7 | 132.7 |
| 2019 | 129.0 | 129.0 |
| 2020 | 118.1 | 118.1 |
| 2021 | 117.6 | 117.6 |
| 2022 | 112.4 | 112.4 |
| 2023 | 109.1 | 109.1 |
| 2024 | 110.9 | 110.9 |
| 2025 | 105.5 | 105.5 |
| 2026 | 106.1 | 106.2 |
| 2027 | 106.8 | 106.8 |
| 2028 | 107.2 | 94.2 |
| 2029 | 107.6 | 91.3 |
| 2030 | 107.8 | 71.9 |
| 2031 | 107.9 | 71.9 |
| 2032 | 108.2 | 72.0 |
| 2033 | 108.6 | 72.1 |
| 2034 | 109.0 | 72.3 |
| 2035 | 109.3 | 71.9 |
Nitrous Oxide (N2O)
Nitrous oxide emissions were 28 Mt CO2 eq in 2023, or 4.0% of total emissions, down 9.7% from 1990 (open data Table A25). The main source is nitrogen fertilizer use in agriculture.
In the WM and WAM scenarios, emissions are expected to remain flat between 2023 and 2030, as presented in Figure 23. Increased nitrous oxide emissions from the Agriculture sector are offset by declines in Heavy Industry, Transportation, and Electricity.
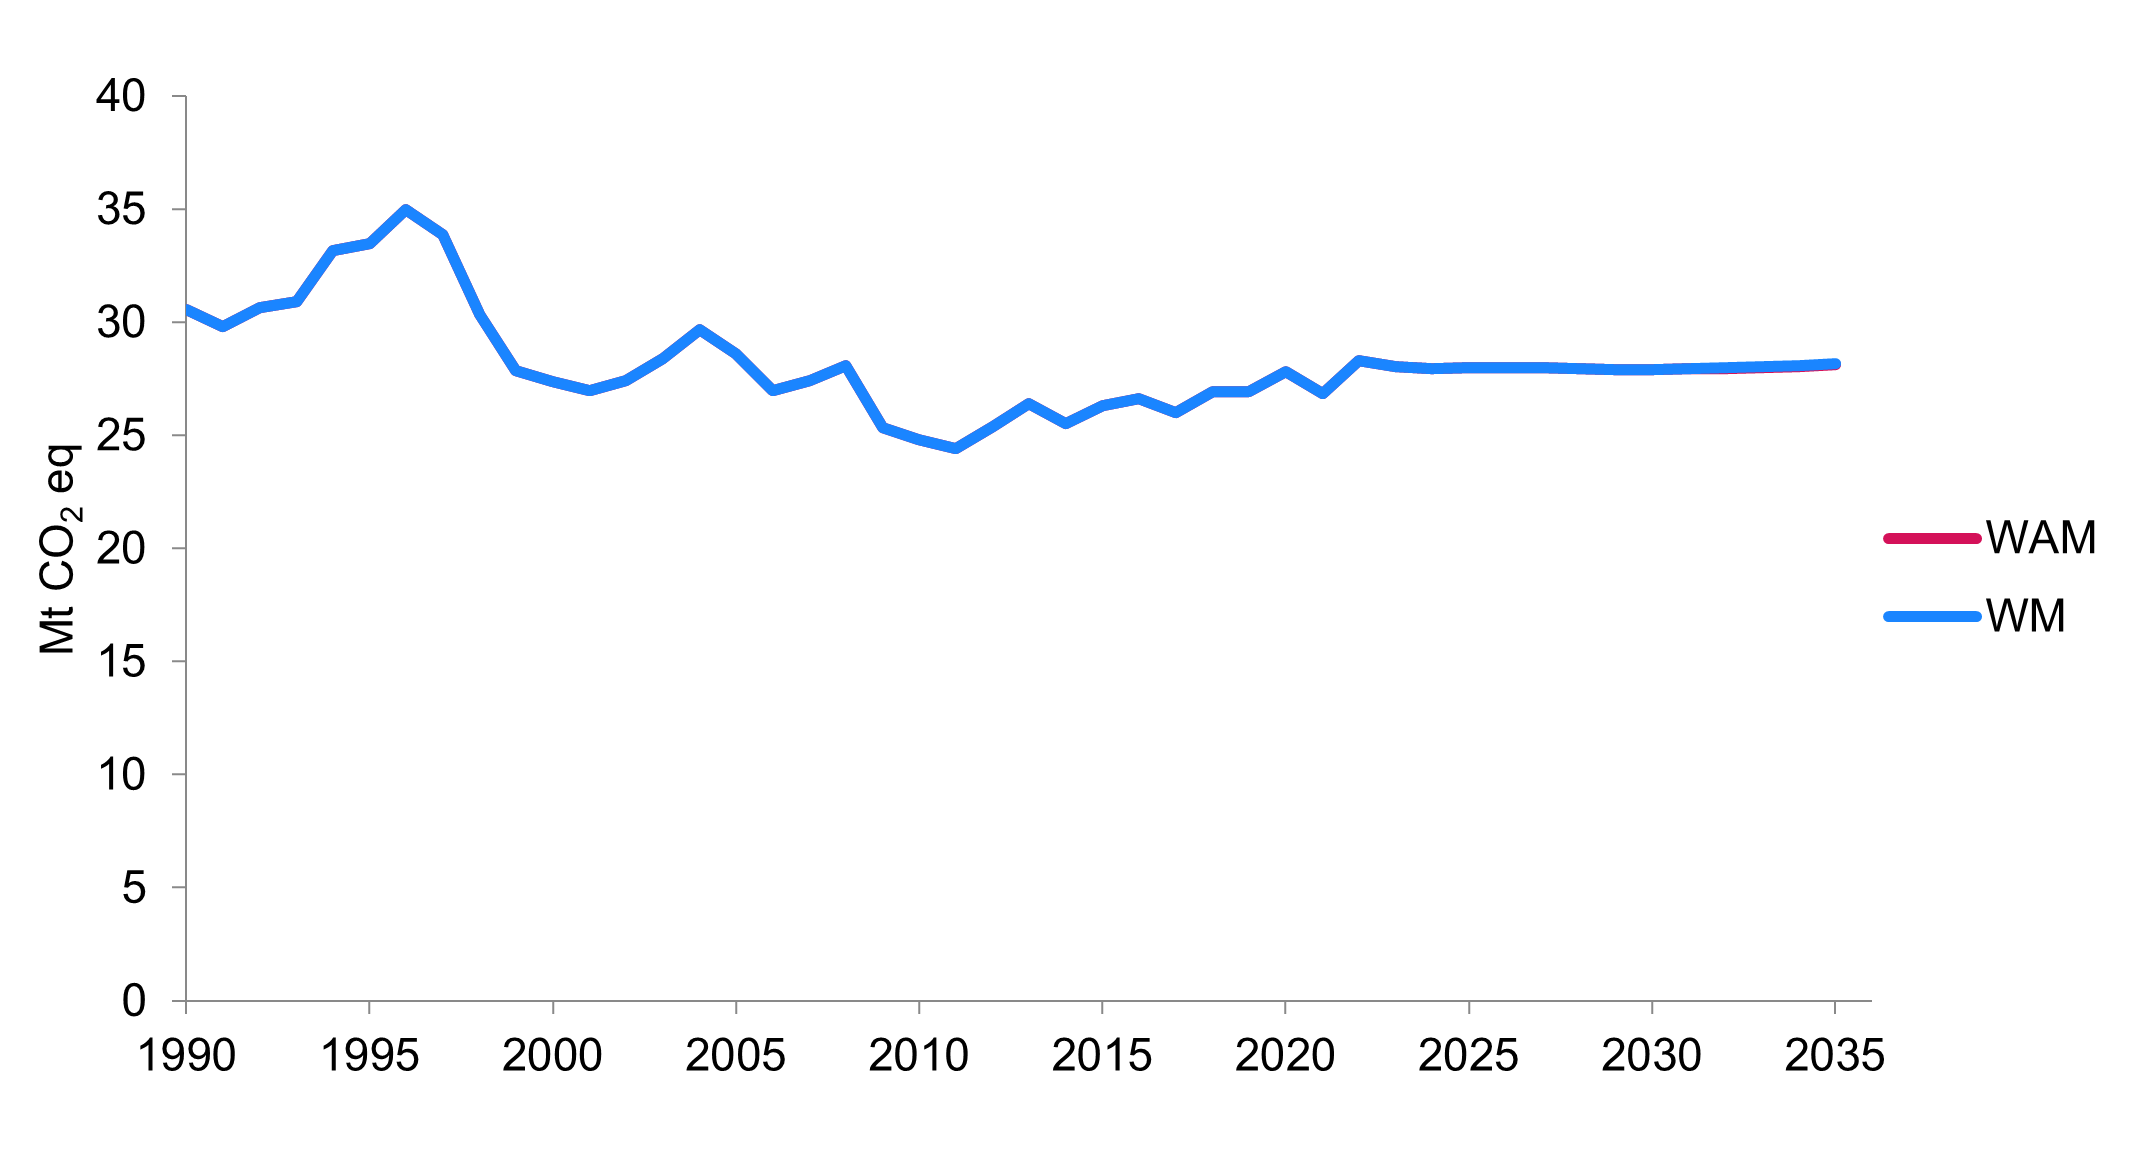
Note: Historical emissions data come from NIR2025. Access more data on the open data portal.
Long description
| Year | WM | WAM |
|---|---|---|
| 1990 | 30.6 | 30.6 |
| 1991 | 29.8 | 29.8 |
| 1992 | 30.6 | 30.6 |
| 1993 | 30.9 | 30.9 |
| 1994 | 33.1 | 33.1 |
| 1995 | 33.5 | 33.5 |
| 1996 | 35.0 | 35.0 |
| 1997 | 33.9 | 33.9 |
| 1998 | 30.3 | 30.3 |
| 1999 | 27.9 | 27.9 |
| 2000 | 27.3 | 27.3 |
| 2001 | 26.9 | 26.9 |
| 2002 | 27.4 | 27.4 |
| 2003 | 28.4 | 28.4 |
| 2004 | 29.7 | 29.7 |
| 2005 | 28.6 | 28.6 |
| 2006 | 27.0 | 27.0 |
| 2007 | 27.4 | 27.4 |
| 2008 | 28.1 | 28.1 |
| 2009 | 25.3 | 25.3 |
| 2010 | 24.8 | 24.8 |
| 2011 | 24.4 | 24.4 |
| 2012 | 25.4 | 25.4 |
| 2013 | 26.4 | 26.4 |
| 2014 | 25.5 | 25.5 |
| 2015 | 26.3 | 26.3 |
| 2016 | 26.6 | 26.6 |
| 2017 | 26.0 | 26.0 |
| 2018 | 26.9 | 26.9 |
| 2019 | 26.9 | 26.9 |
| 2020 | 27.8 | 27.8 |
| 2021 | 26.9 | 26.9 |
| 2022 | 28.3 | 28.3 |
| 2023 | 28.0 | 28.0 |
| 2024 | 27.9 | 27.9 |
| 2025 | 28.0 | 28.0 |
| 2026 | 28.0 | 28.0 |
| 2027 | 28.0 | 28.0 |
| 2028 | 27.9 | 27.9 |
| 2029 | 27.9 | 27.9 |
| 2030 | 27.9 | 27.9 |
| 2031 | 27.9 | 27.9 |
| 2032 | 28.0 | 28.0 |
| 2033 | 28.0 | 28.0 |
| 2034 | 28.1 | 28.0 |
| 2035 | 28.2 | 28.1 |
Hydrofluorocarbons (HFCs)
HFC emissions rose by 9.4 Mt CO2 eq from 1990 to 2023 due to the use of HFCs in refrigeration and air conditioning. HFCs became popular as substitutes for ozone-depleting hydrochlorofluorocarbons (open data Table A26).
Following the Kigali Amendment to the Montreal Protocol, HFC use is being phased out, with emissions peaking at 11 Mt CO2 eq in 2018 and are projected to decline to 5 Mt CO2 eq by 2030 and 3 Mt CO2 eq by 2035 in both scenarios, as displayed in Figure 24.
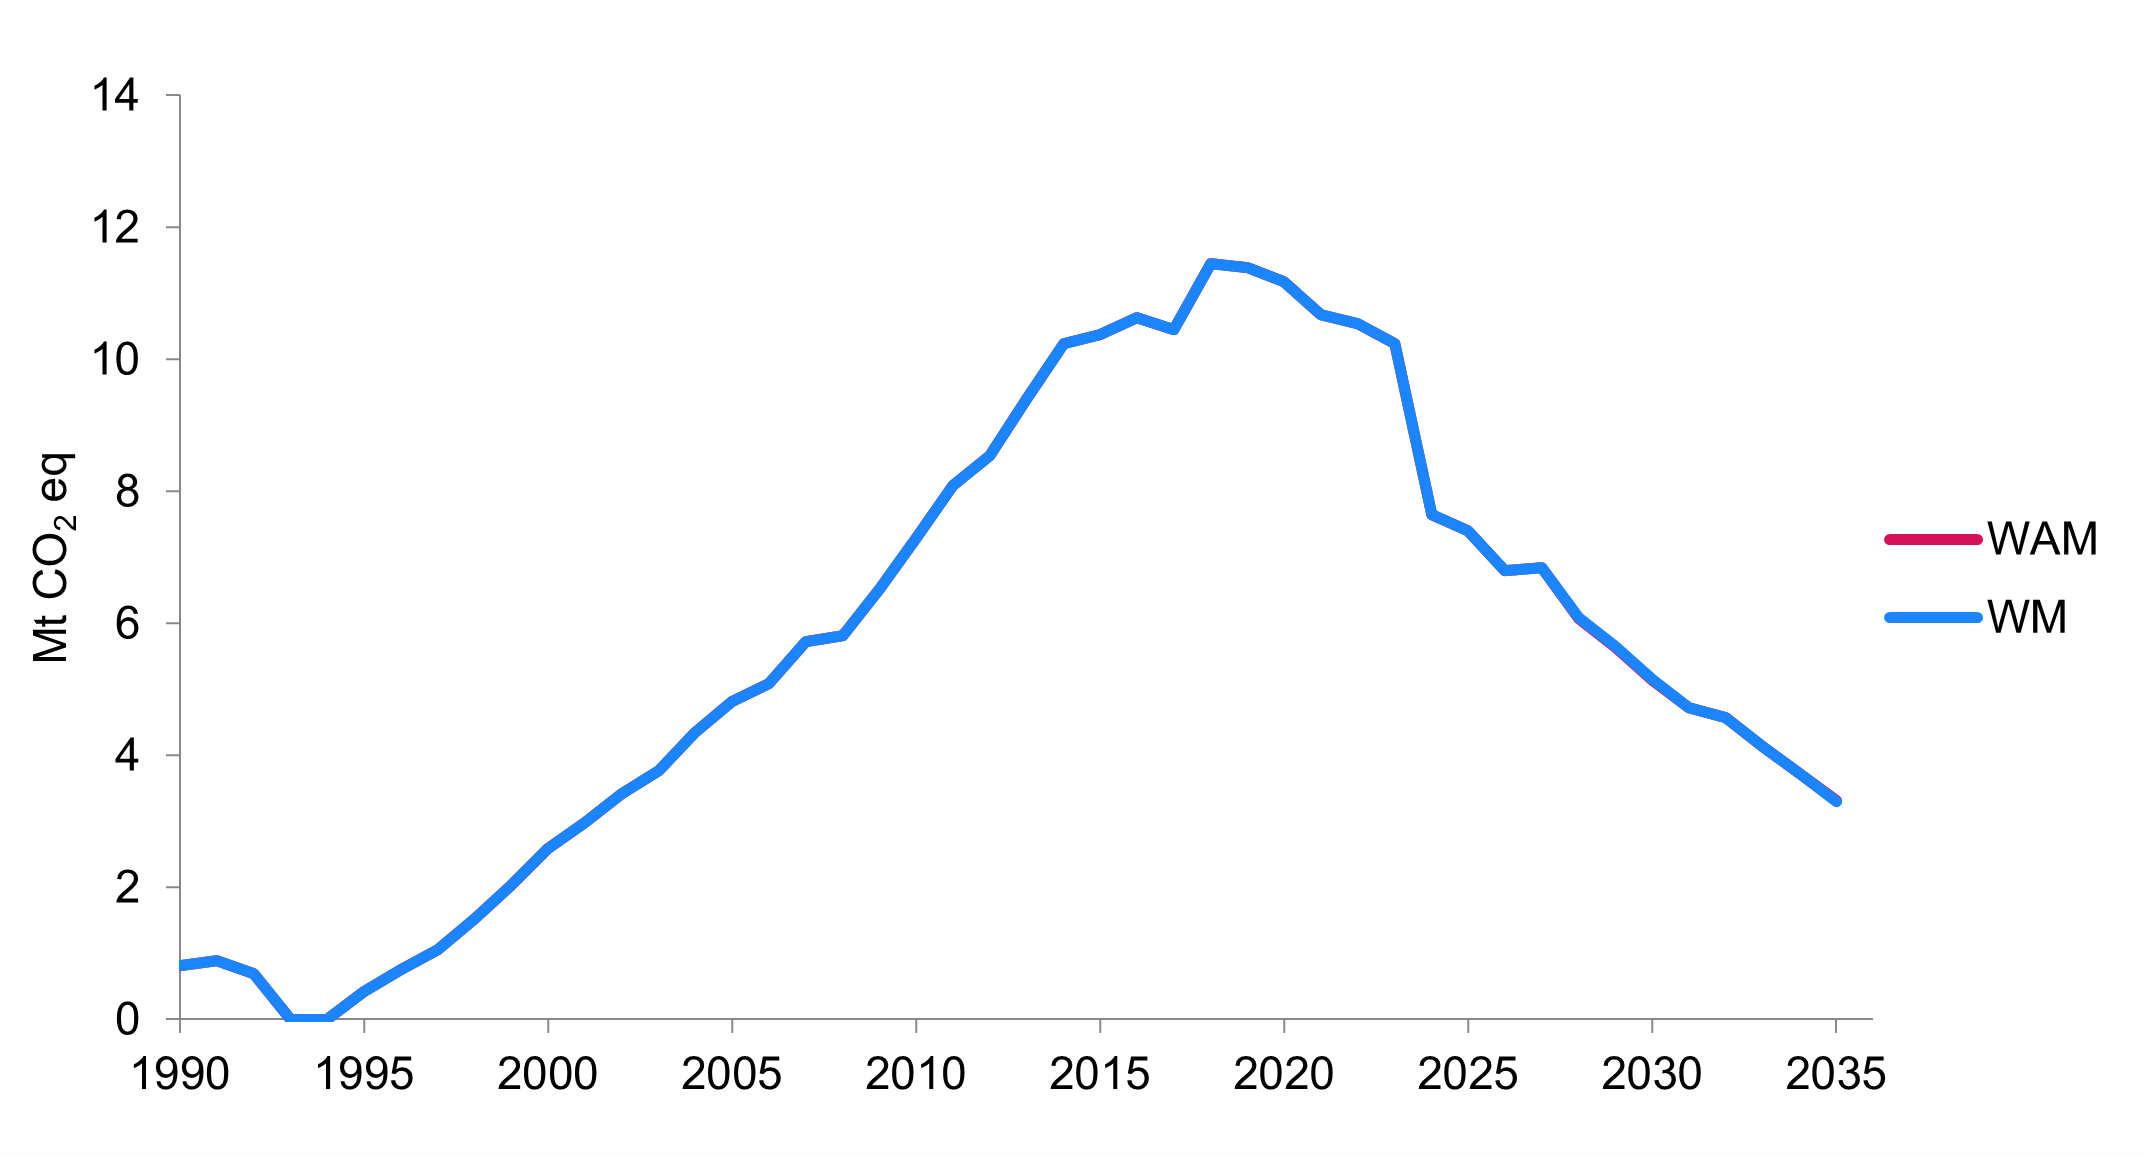
Note: Historical emissions data come from NIR2025. Access more data on the open data portal.
Long description
| Year | WM | WAM |
|---|---|---|
| 1990 | 0.8 | 0.8 |
| 1991 | 0.9 | 0.9 |
| 1992 | 0.7 | 0.7 |
| 1993 | 0.0 | 0.0 |
| 1994 | 0.0 | 0.0 |
| 1995 | 0.4 | 0.4 |
| 1996 | 0.8 | 0.8 |
| 1997 | 1.0 | 1.0 |
| 1998 | 1.5 | 1.5 |
| 1999 | 2.0 | 2.0 |
| 2000 | 2.6 | 2.6 |
| 2001 | 3.0 | 3.0 |
| 2002 | 3.4 | 3.4 |
| 2003 | 3.8 | 3.8 |
| 2004 | 4.3 | 4.3 |
| 2005 | 4.8 | 4.8 |
| 2006 | 5.1 | 5.1 |
| 2007 | 5.7 | 5.7 |
| 2008 | 5.8 | 5.8 |
| 2009 | 6.5 | 6.5 |
| 2010 | 7.3 | 7.3 |
| 2011 | 8.1 | 8.1 |
| 2012 | 8.5 | 8.5 |
| 2013 | 9.4 | 9.4 |
| 2014 | 10.2 | 10.2 |
| 2015 | 10.4 | 10.4 |
| 2016 | 10.6 | 10.6 |
| 2017 | 10.4 | 10.4 |
| 2018 | 11.5 | 11.5 |
| 2019 | 11.4 | 11.4 |
| 2020 | 11.2 | 11.2 |
| 2021 | 10.7 | 10.7 |
| 2022 | 10.5 | 10.5 |
| 2023 | 10.2 | 10.2 |
| 2024 | 7.7 | 7.7 |
| 2025 | 7.4 | 7.4 |
| 2026 | 6.8 | 6.8 |
| 2027 | 6.8 | 6.8 |
| 2028 | 6.1 | 6.1 |
| 2029 | 5.6 | 5.6 |
| 2030 | 5.1 | 5.1 |
| 2031 | 4.7 | 4.7 |
| 2032 | 4.6 | 4.6 |
| 2033 | 4.1 | 4.1 |
| 2034 | 3.7 | 3.7 |
| 2035 | 3.3 | 3.3 |
Perfluorocarbons (PFCs), Sulphur Hexafluoride (SF6), and Nitrogen Trifluoride (NF3)
Emissions of PFCs (Figure 25) and sulphur hexafluoride (Figure 26) have declined since 1990 and are projected to continue decreasing (open data Tables A27 and A28). Nitrogen trifluoride (Figure 27) emissions are expected to remain below 1 kt CO2 eq through 2035 in both scenarios (open data Table A29).
These gases are primarily released during semiconductor manufacturing, refrigeration, aluminium production, and other industrial processes. The WAM scenario includes further reductions from voluntary measures in the aluminium industry, electricity transmission, and other sectors.
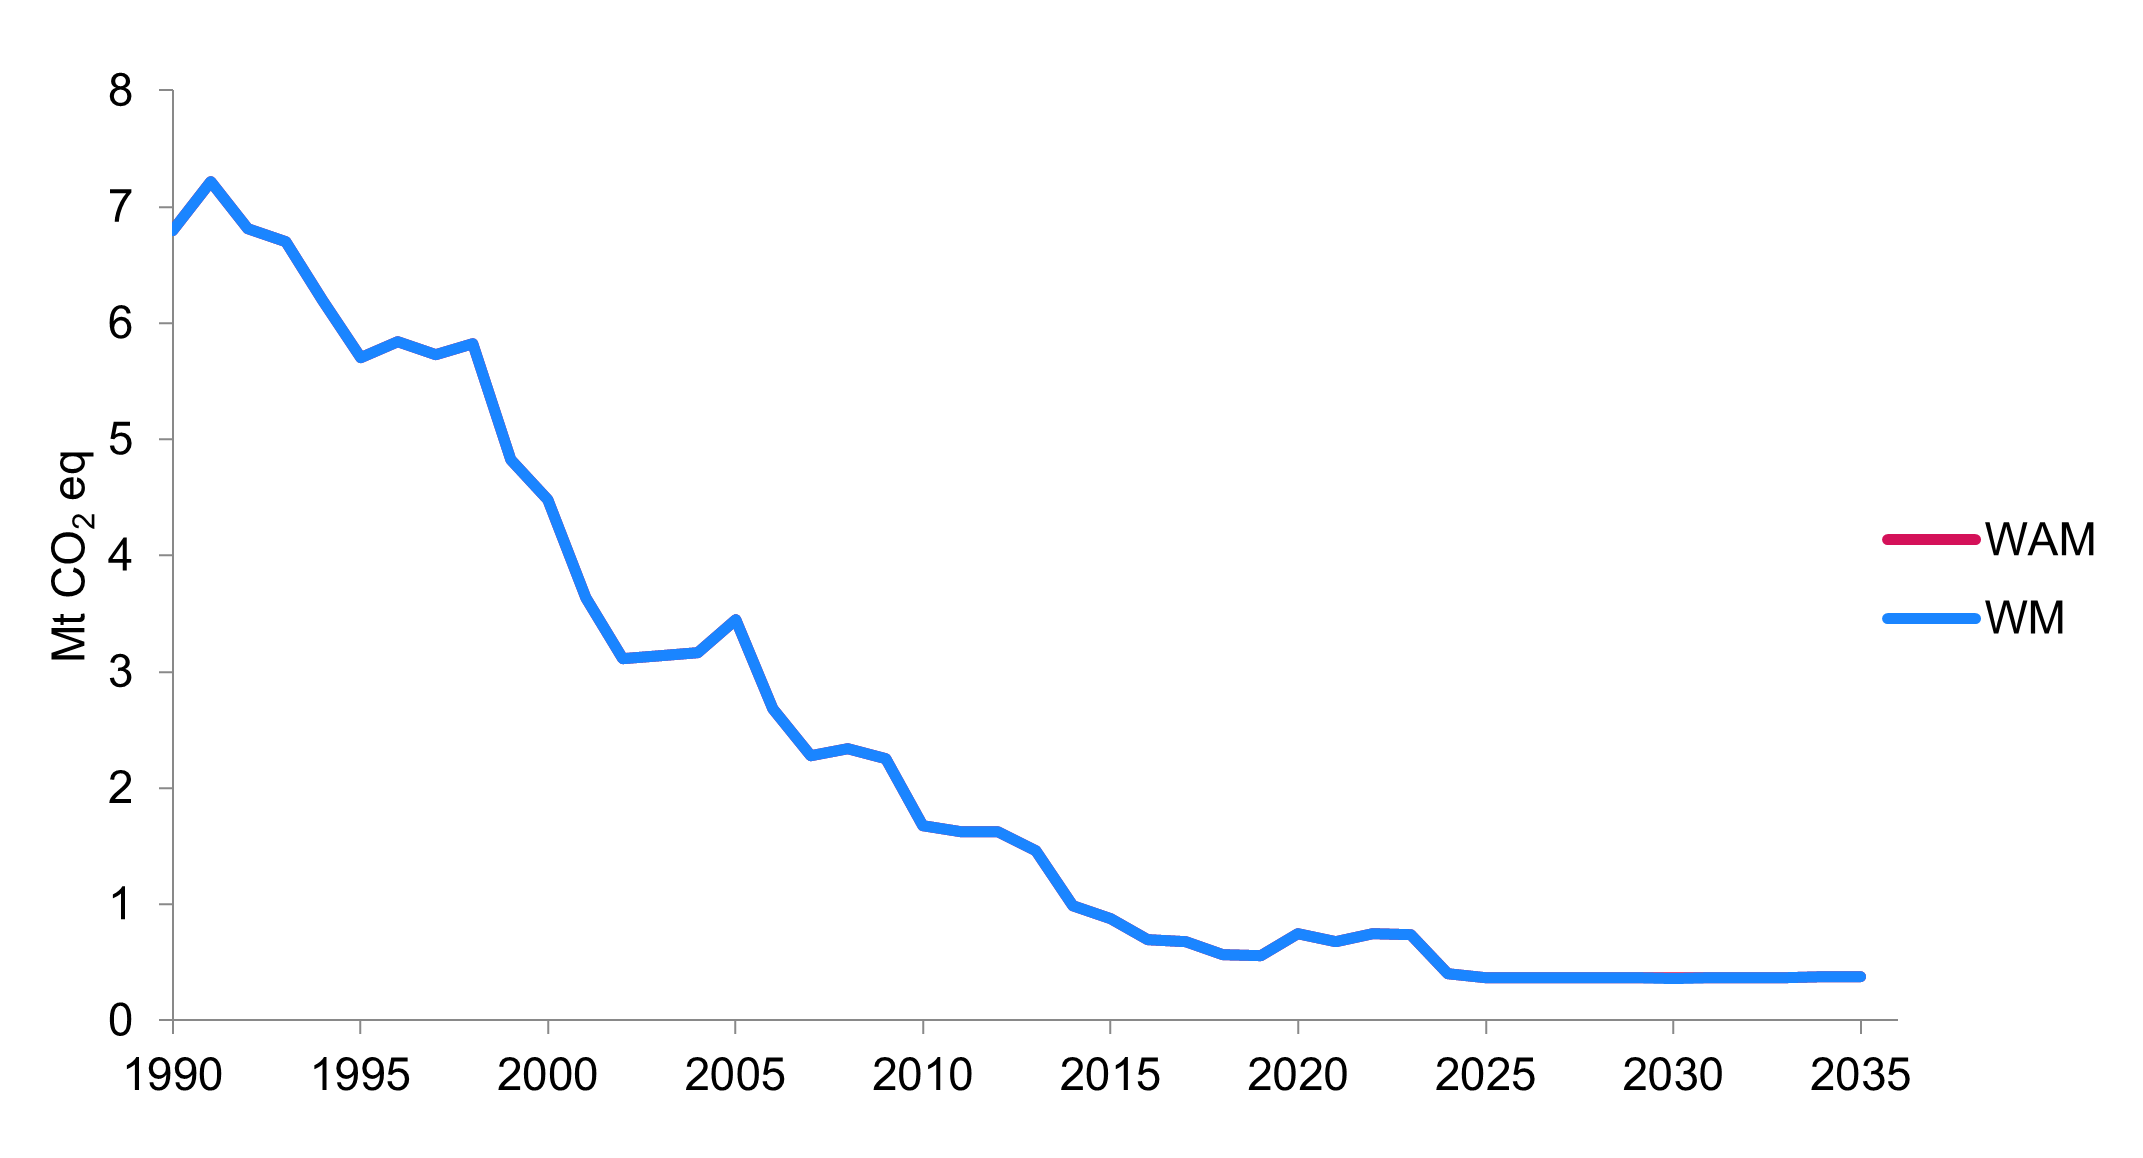
Note: Historical emissions data come from NIR2025. Access more data on the open data portal.
Long description
| Year | WM | WAM |
|---|---|---|
| 1990 | 6.8 | 6.8 |
| 1991 | 7.2 | 7.2 |
| 1992 | 6.8 | 6.8 |
| 1993 | 6.7 | 6.7 |
| 1994 | 6.2 | 6.2 |
| 1995 | 5.7 | 5.7 |
| 1996 | 5.8 | 5.8 |
| 1997 | 5.7 | 5.7 |
| 1998 | 5.8 | 5.8 |
| 1999 | 4.8 | 4.8 |
| 2000 | 4.5 | 4.5 |
| 2001 | 3.6 | 3.6 |
| 2002 | 3.1 | 3.1 |
| 2003 | 3.1 | 3.1 |
| 2004 | 3.2 | 3.2 |
| 2005 | 3.4 | 3.4 |
| 2006 | 2.7 | 2.7 |
| 2007 | 2.3 | 2.3 |
| 2008 | 2.3 | 2.3 |
| 2009 | 2.3 | 2.3 |
| 2010 | 1.7 | 1.7 |
| 2011 | 1.6 | 1.6 |
| 2012 | 1.6 | 1.6 |
| 2013 | 1.5 | 1.5 |
| 2014 | 1.0 | 1.0 |
| 2015 | 0.9 | 0.9 |
| 2016 | 0.7 | 0.7 |
| 2017 | 0.7 | 0.7 |
| 2018 | 0.6 | 0.6 |
| 2019 | 0.6 | 0.6 |
| 2020 | 0.7 | 0.7 |
| 2021 | 0.7 | 0.7 |
| 2022 | 0.7 | 0.7 |
| 2023 | 0.7 | 0.7 |
| 2024 | 0.4 | 0.4 |
| 2025 | 0.4 | 0.4 |
| 2026 | 0.4 | 0.4 |
| 2027 | 0.4 | 0.4 |
| 2028 | 0.4 | 0.4 |
| 2029 | 0.4 | 0.4 |
| 2030 | 0.4 | 0.4 |
| 2031 | 0.4 | 0.4 |
| 2032 | 0.4 | 0.4 |
| 2033 | 0.4 | 0.4 |
| 2034 | 0.4 | 0.4 |
| 2035 | 0.4 | 0.4 |
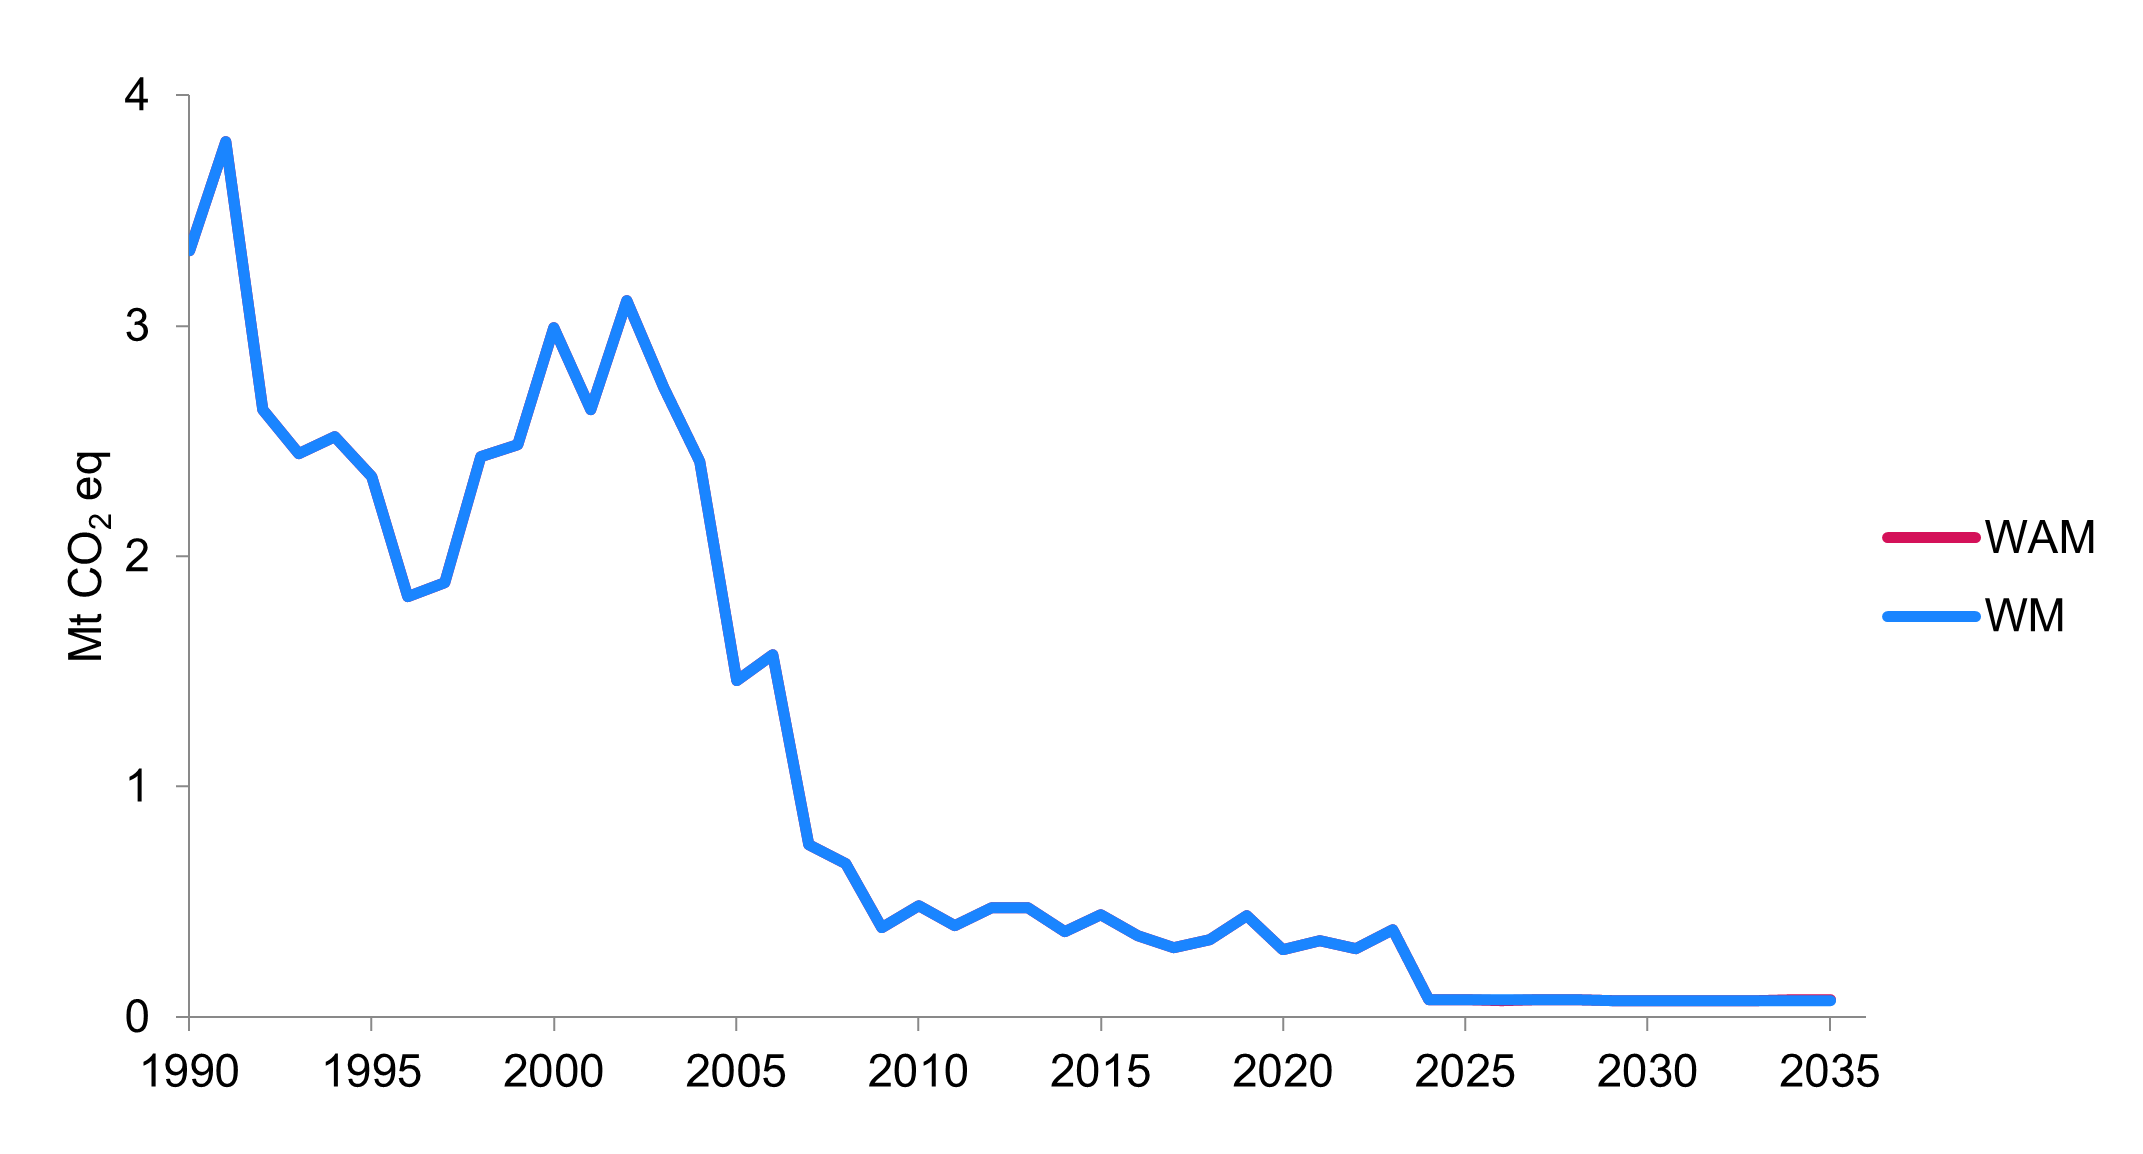
Note: Historical emissions data come from NIR2025. Access more data on the open data portal.
Long description
| Year | WM | WAM |
|---|---|---|
| 1990 | 3.3 | 3.3 |
| 1991 | 3.8 | 3.8 |
| 1992 | 2.6 | 2.6 |
| 1993 | 2.4 | 2.4 |
| 1994 | 2.5 | 2.5 |
| 1995 | 2.3 | 2.3 |
| 1996 | 1.8 | 1.8 |
| 1997 | 1.9 | 1.9 |
| 1998 | 2.4 | 2.4 |
| 1999 | 2.5 | 2.5 |
| 2000 | 3.0 | 3.0 |
| 2001 | 2.6 | 2.6 |
| 2002 | 3.1 | 3.1 |
| 2003 | 2.7 | 2.7 |
| 2004 | 2.4 | 2.4 |
| 2005 | 1.5 | 1.5 |
| 2006 | 1.6 | 1.6 |
| 2007 | 0.7 | 0.7 |
| 2008 | 0.7 | 0.7 |
| 2009 | 0.4 | 0.4 |
| 2010 | 0.5 | 0.5 |
| 2011 | 0.4 | 0.4 |
| 2012 | 0.5 | 0.5 |
| 2013 | 0.5 | 0.5 |
| 2014 | 0.4 | 0.4 |
| 2015 | 0.4 | 0.4 |
| 2016 | 0.4 | 0.4 |
| 2017 | 0.3 | 0.3 |
| 2018 | 0.3 | 0.3 |
| 2019 | 0.4 | 0.4 |
| 2020 | 0.3 | 0.3 |
| 2021 | 0.3 | 0.3 |
| 2022 | 0.3 | 0.3 |
| 2023 | 0.4 | 0.4 |
| 2024 | 0.1 | 0.1 |
| 2025 | 0.1 | 0.1 |
| 2026 | 0.1 | 0.1 |
| 2027 | 0.1 | 0.1 |
| 2028 | 0.1 | 0.1 |
| 2029 | 0.1 | 0.1 |
| 2030 | 0.1 | 0.1 |
| 2031 | 0.1 | 0.1 |
| 2032 | 0.1 | 0.1 |
| 2033 | 0.1 | 0.1 |
| 2034 | 0.1 | 0.1 |
| 2035 | 0.1 | 0.1 |
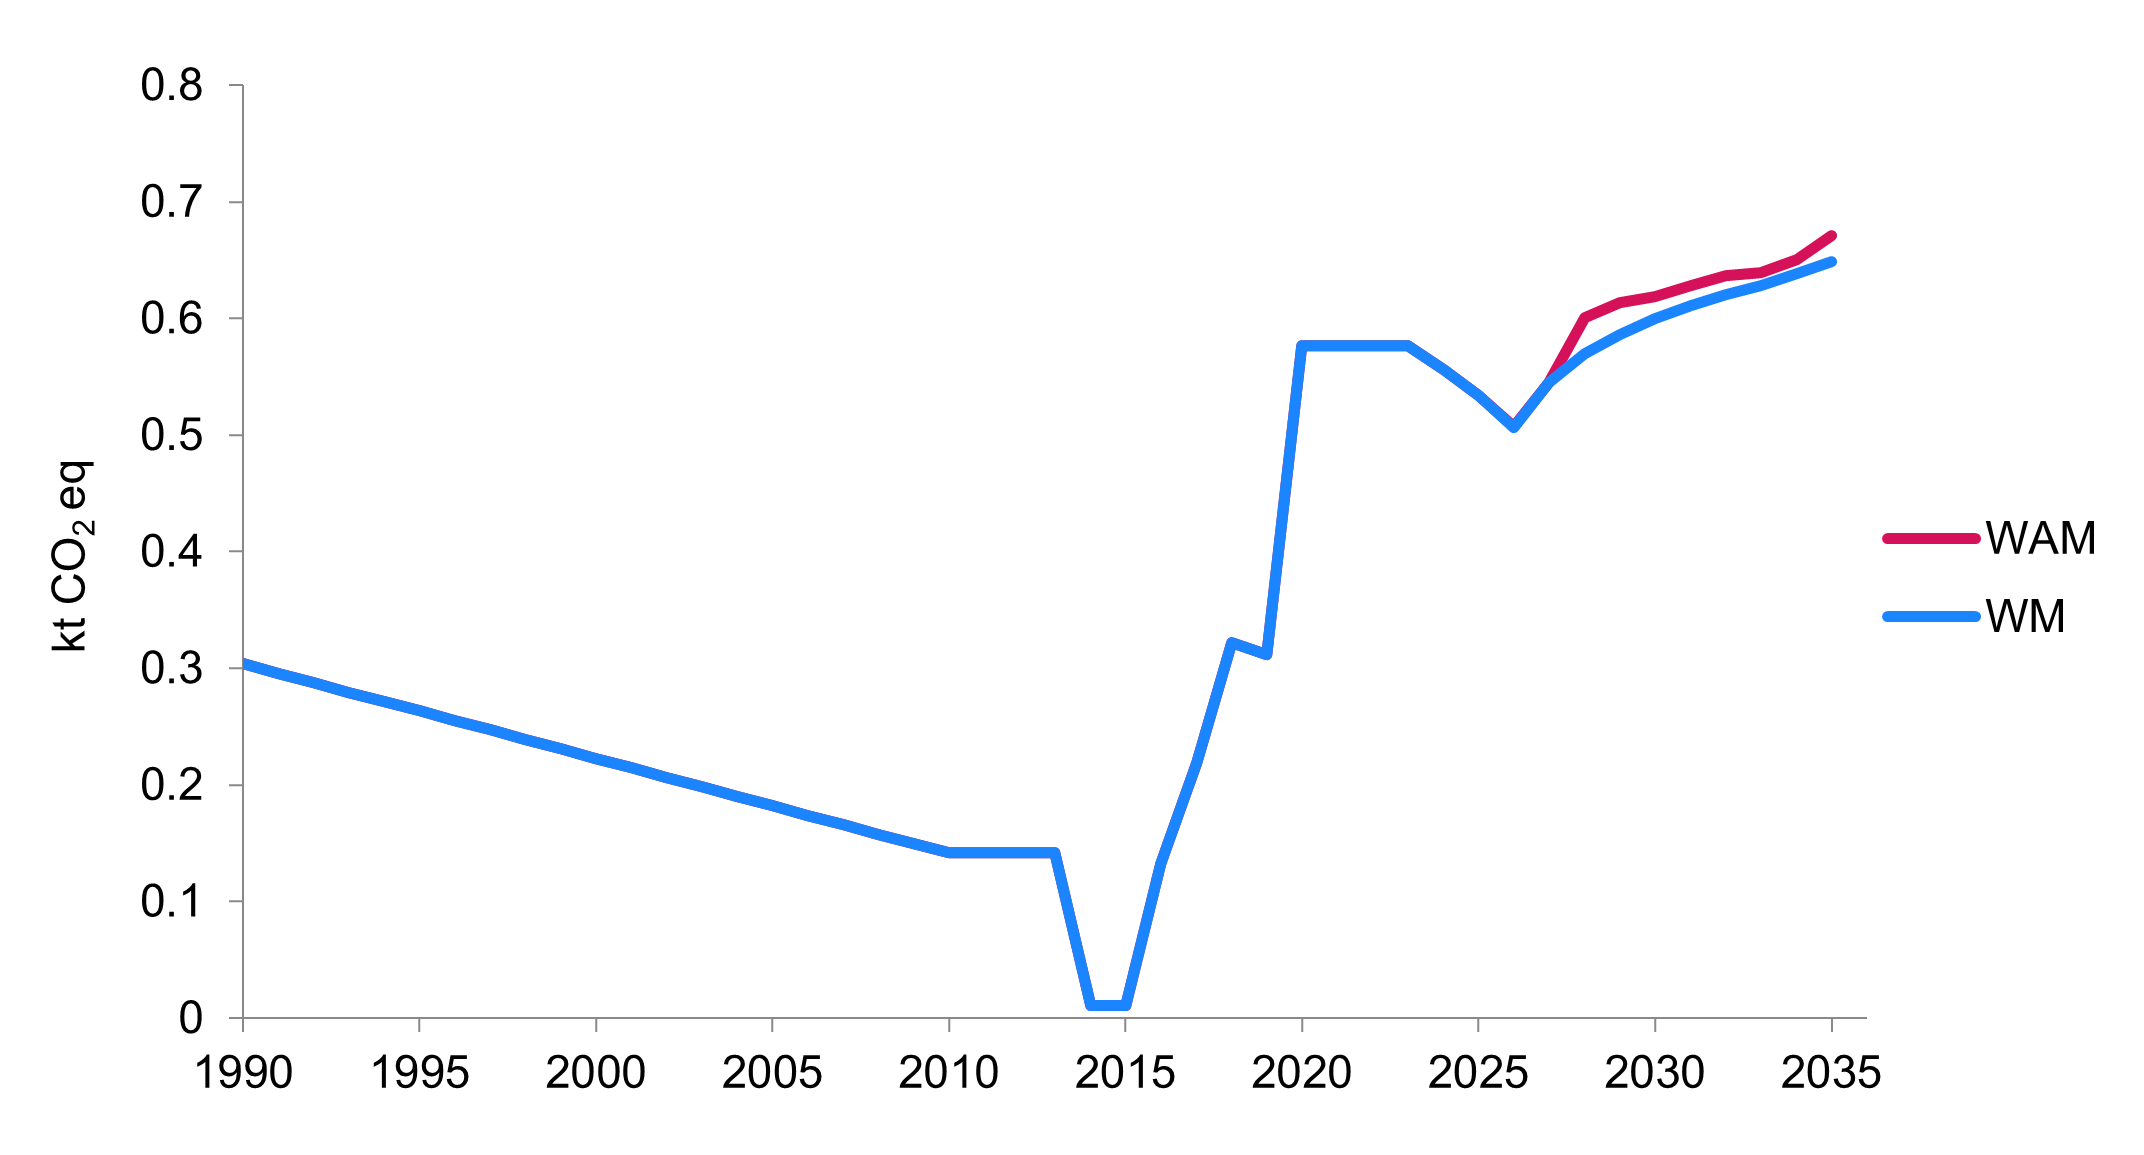
Note: Historical emissions data come from NIR2025. Access more data on the open data portal.
Long description
| Year | WM | WAM |
|---|---|---|
| 1990 | 0.3 | 0.3 |
| 1991 | 0.3 | 0.3 |
| 1992 | 0.3 | 0.3 |
| 1993 | 0.3 | 0.3 |
| 1994 | 0.3 | 0.3 |
| 1995 | 0.3 | 0.3 |
| 1996 | 0.3 | 0.3 |
| 1997 | 0.2 | 0.2 |
| 1998 | 0.2 | 0.2 |
| 1999 | 0.2 | 0.2 |
| 2000 | 0.2 | 0.2 |
| 2001 | 0.2 | 0.2 |
| 2002 | 0.2 | 0.2 |
| 2003 | 0.2 | 0.2 |
| 2004 | 0.2 | 0.2 |
| 2005 | 0.2 | 0.2 |
| 2006 | 0.2 | 0.2 |
| 2007 | 0.2 | 0.2 |
| 2008 | 0.2 | 0.2 |
| 2009 | 0.1 | 0.1 |
| 2010 | 0.1 | 0.1 |
| 2011 | 0.1 | 0.1 |
| 2012 | 0.1 | 0.1 |
| 2013 | 0.1 | 0.1 |
| 2014 | 0.0 | 0.0 |
| 2015 | 0.0 | 0.0 |
| 2016 | 0.1 | 0.1 |
| 2017 | 0.2 | 0.2 |
| 2018 | 0.3 | 0.3 |
| 2019 | 0.3 | 0.3 |
| 2020 | 0.6 | 0.6 |
| 2021 | 0.6 | 0.6 |
| 2022 | 0.6 | 0.6 |
| 2023 | 0.6 | 0.6 |
| 2024 | 0.6 | 0.6 |
| 2025 | 0.5 | 0.5 |
| 2026 | 0.5 | 0.5 |
| 2027 | 0.5 | 0.5 |
| 2028 | 0.6 | 0.6 |
| 2029 | 0.6 | 0.6 |
| 2030 | 0.6 | 0.6 |
| 2031 | 0.6 | 0.6 |
| 2032 | 0.6 | 0.6 |
| 2033 | 0.6 | 0.6 |
| 2034 | 0.6 | 0.7 |
| 2035 | 0.6 | 0.7 |
2.3.3 Emissions intensity
Between 1990 and 2023, Canada’s economy grew more rapidly than its GHG emissions. As a result, the emissions intensity for the entire economy (GHGs per unit of GDP) has continued to decline. Emissions intensity decreased by 44% since 1990 and by 33% since 2005. The COVID-19 pandemic undoubtedly affected recent year emissions. The sustained decline in emissions intensity, however, can be attributed to factors including fuel switching, improved energy efficiency and modernizing industrial processes.
Emissions per capita (excluding the contribution of LULUCF, NBCS, and agriculture measures) were 21.9 t CO2 eq per person in 1990. By 2023, they declined to 17.3 t CO2 eq per person, a 21% reduction from their 1990 levels. Recent relatively strong population growth from 2022 through 2024 is expected to slow. From 2025 to 2030, the population is expected to grow by 0.6% annually, and by 0.8% annually from 2031 to 2035. Nevertheless, emissions intensity per capita is expected to decrease in the WM and WAM scenarios.
Declines in emissions intensity per unit of GDP are also expected to continue in the projection period, with intensity declining faster in the WAM scenario.
Table 17 and Figure 28 also provide details on GHG emissions intensity per capita by province and territory. Figure 29 shows the evolution of Canada's GHG emissions intensity per unit of GDP and per capita, from 1990 to 2035. GHG emissions exclude both the accounting contribution of the LULUCF sector and the impact of NBCS and agriculture measures.
| Province/Territory | 2005 | 2023 | 2026a | 2030a | 2035a | 2026b | 2030b | 2035b |
|---|---|---|---|---|---|---|---|---|
| Newfoundland and Labrador | 20.0 | 14.7 | 15.3 | 14.0 | 13.6 | 15.3 | 13.6 | 13.2 |
| Prince Edward Island | 13.7 | 9.2 | 8.2 | 7.5 | 6.8 | 8.2 | 7.3 | 6.5 |
| Nova Scotia | 23.4 | 12.8 | 11.1 | 7.2 | 6.4 | 11.1 | 6.9 | 5.8 |
| New Brunswick | 26.5 | 13.8 | 12.5 | 10.5 | 9.7 | 12.5 | 10.1 | 9.2 |
| Québec | 11.1 | 8.9 | 7.8 | 7.1 | 6.6 | 7.8 | 7.0 | 6.4 |
| Ontario | 16.2 | 10.2 | 9.0 | 8.4 | 7.5 | 9.0 | 8.2 | 7.1 |
| Manitoba | 17.6 | 14.6 | 13.2 | 12.7 | 12.0 | 13.2 | 12.2 | 11.4 |
| Saskatchewan | 81.0 | 61.1 | 52.3 | 44.7 | 41.7 | 52.1 | 40.2 | 37.1 |
| Alberta | 75.4 | 56.2 | 50.3 | 46.9 | 43.7 | 50.5 | 42.1 | 38.9 |
| British Columbia | 15.1 | 10.9 | 10.4 | 9.9 | 9.4 | 10.4 | 9.2 | 8.2 |
| Yukon | 17.7 | 14.8 | 13.3 | 11.9 | 10.6 | 12.6 | 11.1 | 9.6 |
| Northwest Territories | 39.7 | 30.4 | 25.2 | 21.0 | 19.1 | 25.2 | 20.5 | 18.2 |
| Nunavut | 19.3 | 17.5 | 39.4 | 35.2 | 32.8 | 39.4 | 35.2 | 32.9 |
| Canada | 23.5 | 17.3 | 15.7 | 14.6 | 13.6 | 15.7 | 13.6 | 12.4 |
Note: Historical data up to 2023 are sourced from NIR2025. Data from 2024 to 2035 are modelled projections developed using ECCC’s analytical framework. Access more data on the open data portal.
a Projections under the WM scenario.
b Projections under the WAM scenario.
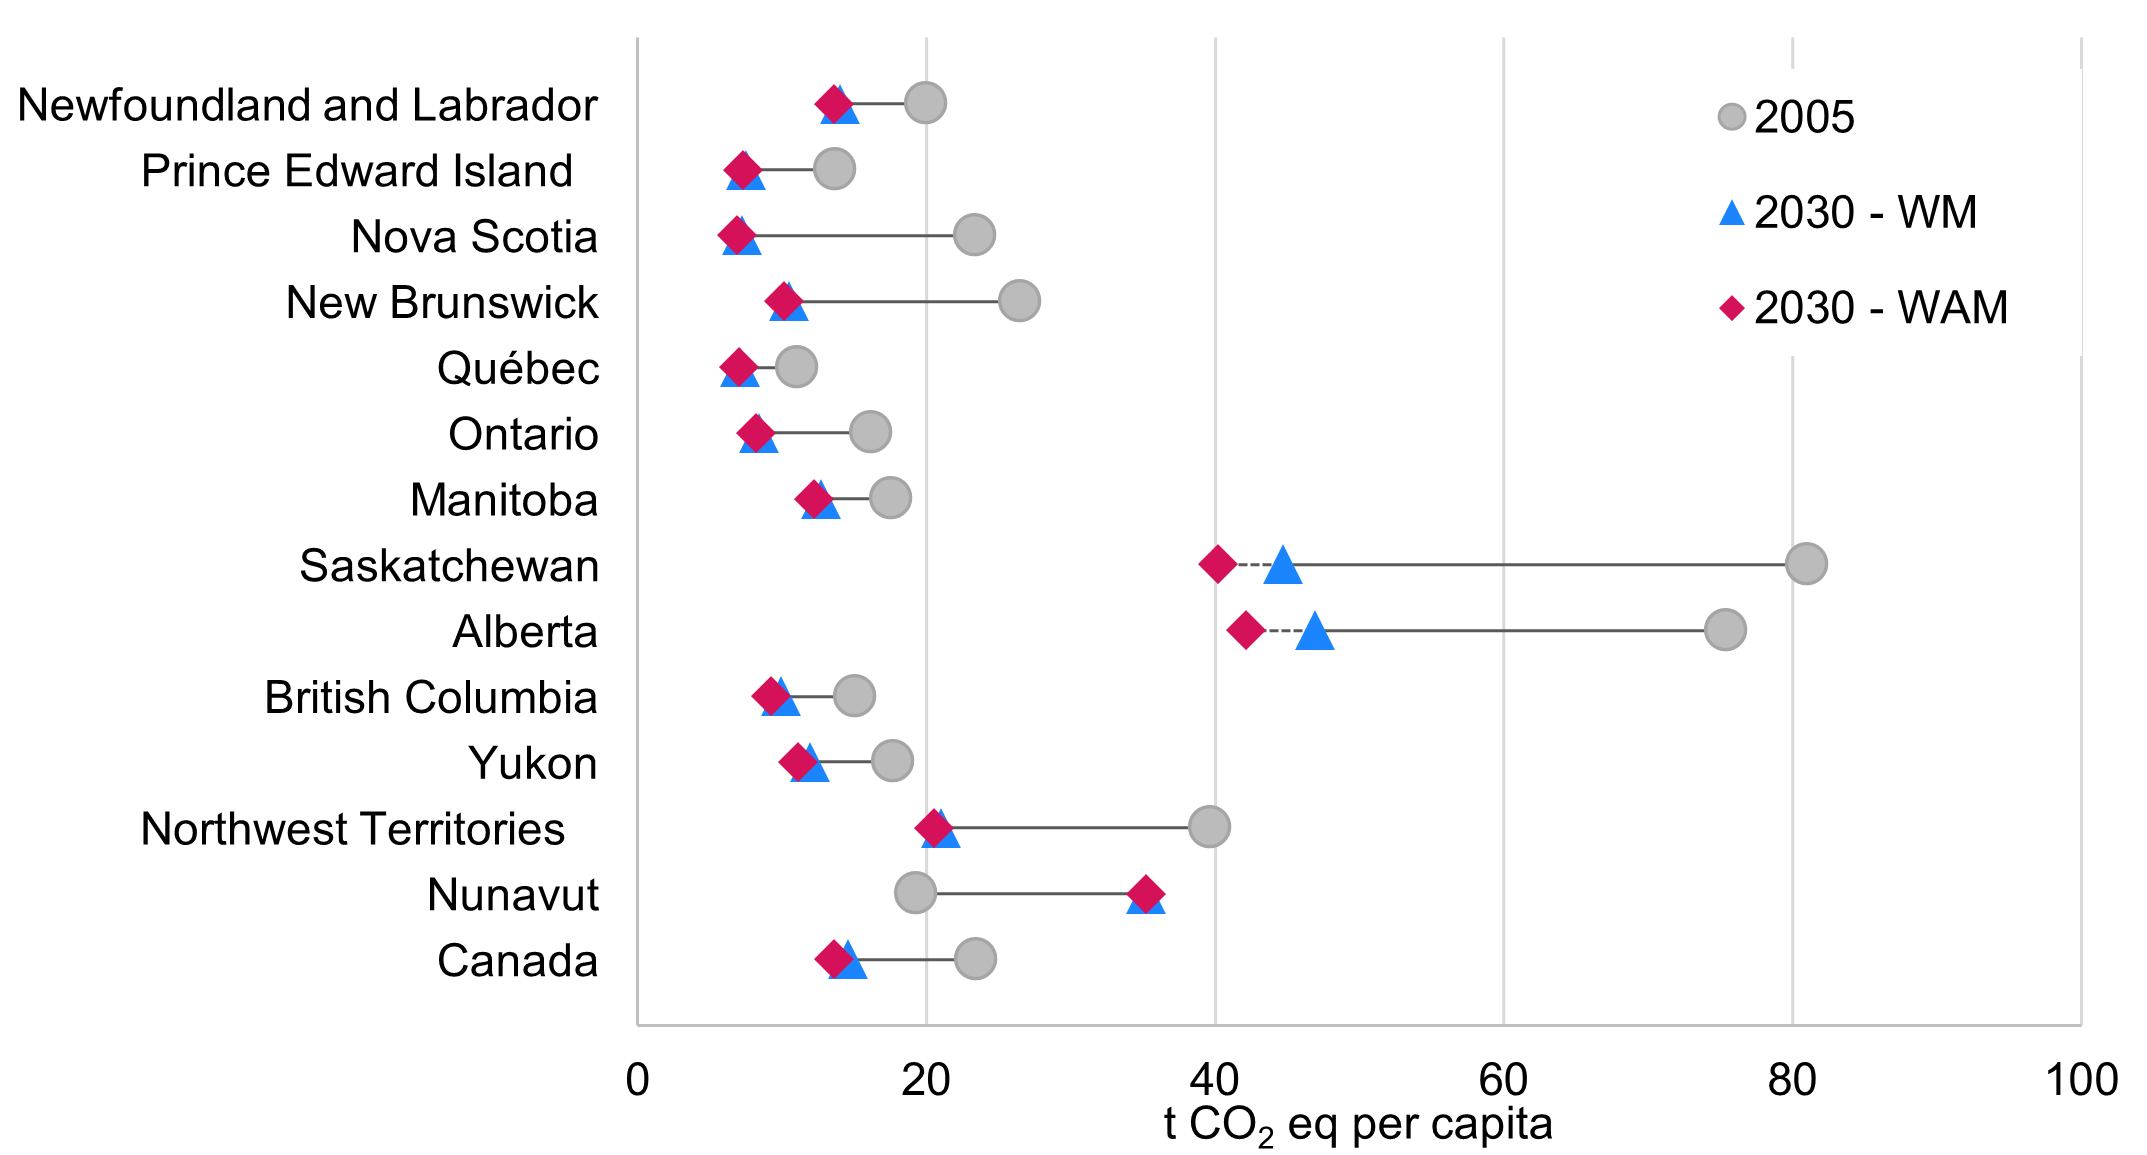
Long description
| Jurisdiction | 2005 | 2030 - WM | 2030 - WAM |
|---|---|---|---|
| Canada | 23.5 | 14.6 | 12.7 |
| Nunavut | 19.3 | 35.2 | 35.2 |
| Northwest Territories | 39.7 | 21.0 | 20.5 |
| Yukon | 17.7 | 11.9 | 11.1 |
| British Columbia | 15.1 | 9.9 | 9.2 |
| Alberta | 75.4 | 46.9 | 42.1 |
| Saskatchewan | 81.0 | 44.7 | 40.2 |
| Manitoba | 17.6 | 12.7 | 12.2 |
| Ontario | 16.2 | 8.4 | 8.2 |
| Québec | 11.1 | 7.1 | 6.5 |
| New Brunswick | 26.5 | 10.5 | 10.1 |
| Nova Scotia | 23.4 | 7.2 | 6.9 |
| Prince Edward Island | 13.7 | 7.5 | 7.3 |
| Newfoundland and Labrador | 20.0 | 14.0 | 13.6 |
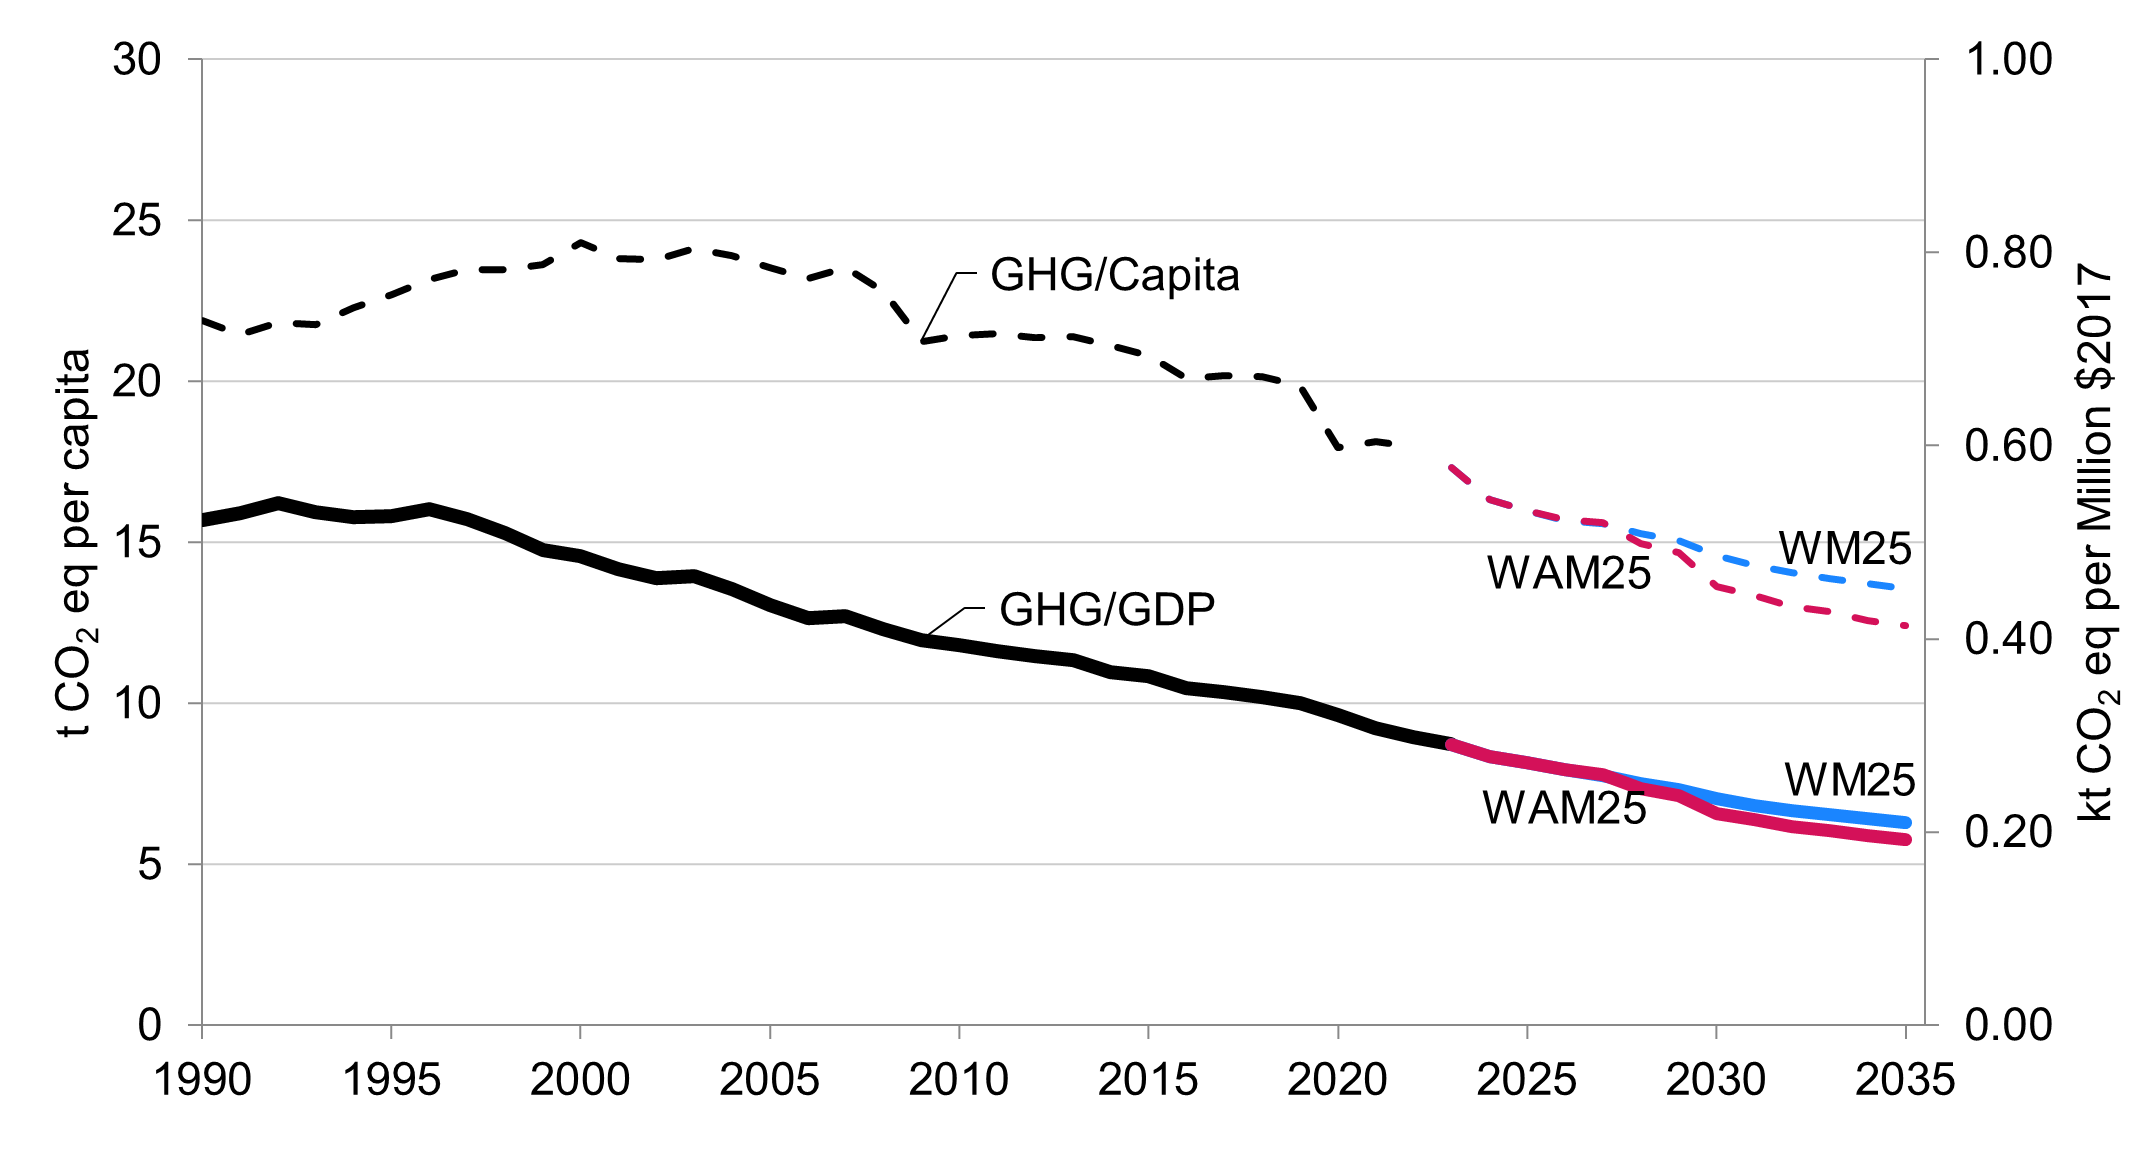
Note: Historical GDP and population data come from Statistics Canada. Historical emissions data come from NIR2025. Access more data on the open data portal.
Long description
| Year | GHG/Capita - History | GHG/Capita - WM25 | GHG/Capita - WAM25 | GHG/GDP - History | GHG/GDP - WM25 | GHG/GDP - WAM25 |
|---|---|---|---|---|---|---|
| 1990 | 21.9 | - | - | 0.52 | - | - |
| 1991 | 21.5 | - | - | 0.53 | - | - |
| 1992 | 21.8 | - | - | 0.54 | - | - |
| 1993 | 21.8 | - | - | 0.53 | - | - |
| 1994 | 22.3 | - | - | 0.53 | - | - |
| 1995 | 22.7 | - | - | 0.53 | - | - |
| 1996 | 23.2 | - | - | 0.53 | - | - |
| 1997 | 23.5 | - | - | 0.52 | - | - |
| 1998 | 23.5 | - | - | 0.51 | - | - |
| 1999 | 23.6 | - | - | 0.49 | - | - |
| 2000 | 24.3 | - | - | 0.49 | - | - |
| 2001 | 23.8 | - | - | 0.47 | - | - |
| 2002 | 23.8 | - | - | 0.46 | - | - |
| 2003 | 24.1 | - | - | 0.47 | - | - |
| 2004 | 23.9 | - | - | 0.45 | - | - |
| 2005 | 23.5 | - | - | 0.43 | - | - |
| 2006 | 23.2 | - | - | 0.42 | - | - |
| 2007 | 23.5 | - | - | 0.42 | - | - |
| 2008 | 22.8 | - | - | 0.41 | - | - |
| 2009 | 21.2 | - | - | 0.40 | - | - |
| 2010 | 21.4 | - | - | 0.39 | - | - |
| 2011 | 21.5 | - | - | 0.39 | - | - |
| 2012 | 21.4 | - | - | 0.38 | - | - |
| 2013 | 21.4 | - | - | 0.38 | - | - |
| 2014 | 21.1 | - | - | 0.37 | - | - |
| 2015 | 20.8 | - | - | 0.36 | - | - |
| 2016 | 20.1 | - | - | 0.35 | - | - |
| 2017 | 20.2 | - | - | 0.34 | - | - |
| 2018 | 20.2 | - | - | 0.34 | - | - |
| 2019 | 19.9 | - | - | 0.33 | - | - |
| 2020 | 17.9 | - | - | 0.32 | - | - |
| 2021 | 18.1 | - | - | 0.31 | - | - |
| 2022 | 18.0 | - | - | 0.30 | - | - |
| 2023 | 17.3 | 17.3 | 17.3 | 0.29 | 0.29 | 0.29 |
| 2024 | - | 16.3 | 15.9 | - | 0.28 | 0.28 |
| 2025 | - | 16.0 | 15.2 | - | 0.27 | 0.27 |
| 2026 | - | 15.7 | 15.1 | - | 0.26 | 0.26 |
| 2027 | - | 15.6 | 15.0 | - | 0.26 | 0.26 |
| 2028 | - | 15.3 | 14.4 | - | 0.25 | 0.25 |
| 2029 | - | 15.1 | 14.1 | - | 0.24 | 0.24 |
| 2030 | - | 14.6 | 12.7 | - | 0.23 | 0.22 |
| 2031 | - | 14.3 | 12.5 | - | 0.23 | 0.21 |
| 2032 | - | 14.0 | 12.1 | - | 0.22 | 0.21 |
| 2033 | - | 13.9 | 12.0 | - | 0.22 | 0.20 |
| 2034 | - | 13.7 | 11.7 | - | 0.21 | 0.20 |
| 2035 | - | 13.6 | 11.5 | - | 0.21 | 0.19 |
2.3.4 Emissions by province and territory
Historical emissions vary considerably by province and territory. These differences are driven by diversity in population size, economic activity, and resource base, among other factors. Provinces and territories where the economy is oriented toward resource extraction tend to have higher emissions. On the other hand, manufacturing or service-based economies tend to have lower emissions. Electricity generation sources also vary in different provinces and territories. Those that rely on fossil fuels for their electricity generation tend to have higher emissions. Provinces and territories that rely on non-emitting sources of electricity (e.g., hydroelectricity, nuclear, wind), tend to have lower emissions.
Provincial and territorial projections reflect diverse economic factors and varying measures to reduce GHG emissions. These include the industrial fuel charge, energy efficiency and renewable electricity programs, legislated renewable electricity targets, and regulatory measures. Only measures that could be readily modelled or have an announced regulatory or budgetary dimension were included in the projections. ECCC engages in extensive consultations with other federal government departments, provinces, and territories. This ensures that their initiatives are accounted for in the analysis and modelling of emissions projections. Aspirational goals and targets are not included in the projections. Provincial and territorial policies and measures modelled in the WM and WAM scenarios are listed in Annex 2. Provincial emissions reductions targets, although not included in the modelling, are also listed in that section.
Table 18 displays historical and projected provincial and territorial GHG emissions. GHG emissions exclude both the accounting contribution of the LULUCF sector and the impact of NBCS and agriculture measures. More detailed data at the provincial and territorial level is available through open data.
| Province/Territory | 2005 | 2023 | 2026a | 2030a | 2035a | 2026b | 2030b | 2035b |
|---|---|---|---|---|---|---|---|---|
| Newfoundland and Labrador | 10 | 8 | 8 | 8 | 8 | 8 | 8 | 8 |
| Prince Edward Island | 2 | 2 | 2 | 1 | 1 | 2 | 1 | 1 |
| Nova Scotia | 22 | 14 | 12 | 8 | 7 | 12 | 8 | 7 |
| New Brunswick | 20 | 11 | 11 | 9 | 9 | 11 | 9 | 8 |
| Québec | 85 | 79 | 71 | 64 | 60 | 71 | 63 | 59 |
| Ontario | 202 | 159 | 147 | 140 | 131 | 147 | 137 | 124 |
| Manitoba | 21 | 21 | 20 | 20 | 19 | 20 | 19 | 19 |
| Saskatchewan | 80 | 74 | 67 | 61 | 60 | 67 | 55 | 53 |
| Alberta | 251 | 263 | 255 | 251 | 248 | 256 | 225 | 221 |
| British Columbia | 63 | 60 | 60 | 59 | 59 | 59 | 55 | 52 |
| Yukon | 1 | 1 | 1 | 1 | 1 | 1 | 1 | 1 |
| Northwest Territories | 2 | 1 | 1 | 1 | 1 | 1 | 1 | 1 |
| Nunavut | 1 | 1 | 2 | 2 | 1 | 2 | 2 | 1 |
| Canada | 759 | 694 | 656 | 625 | 606 | 656 | 583 | 554 |
Note: Numbers may not sum to the total due to rounding. Historical data up to 2023 are sourced from NIR2025. Data from 2024 to 2035 are modelled projections developed using ECCC’s analytical framework. Access more data on the open data portal.
a Projections under the WM scenario.
b Projections under the WAM scenario.
2.4 Analysis of the impacts of key policies
ECCC has developed a methodology to assess the individual impact of key climate policies, fulfilling Canada’s 2030 Emissions Reduction Plan commitment to greater transparency in climate modelling and reporting.
Since Canada’s climate policies are designed to work together, their overlapping effects make isolating the impact of any single policy challenging. An Action Plan was developed following the Independent Modelling Review to address criticism from the Commissioner of the Environment and Sustainable Development. As such, ECCC developed a modelling approach, similar to that of the Canadian Climate Institute, that estimates the range of each policy’s contribution using two baselines:
- Additive baseline: WM scenario without any of the selected policies
- Subtractive baseline: WM scenario with all the selected policies
Policy impacts are estimated by individually adding each policy to the additive baseline and by individually removing each policy from the subtractive baseline. This approach provides a range of potential emissions outcomes and enables consistent comparisons across policies.
The proposed methodology was used on the 2025 emissions projections and results are presented in this section. The analysis focuses on five key federal climate policies: Clean Electricity Regulations, OBPS, Enhanced Oil and Gas Methane Regulations, transportation policies (including EVAS and Extension of passenger vehicle efficiency improvements), and Landfill Methane Regulations. More details about these policies are available in Annex 2.
Presenting the impacts of individual policies offers several advantages. It improves transparency by showing each policy’s impact on emissions, supporting evidence-based decision-making. It also helps stakeholders understand the role of specific policies in achieving climate objectives.
While the methodology provides valuable insights, it has some limitations. Differences in the list of policies assessed mean results cannot be directly compared to WM or WAM scenarios. The estimated impact range is narrow due to the limited number of policies analyzed. Expanding future analyses to include more policies could capture more interactions and provide a more comprehensive view of Canada’s climate policy landscape. Some of the policies analysed are expected to have longer-term impacts, such as the Clean Electricity Regulations, and therefore the impacts presented in Table 19 and Figure 30 underestimate full potential of these regulations.
Table 19 and Figure 30 present estimated ranges and impacts for 2030 and 2035.
| Policy | 2030 | 2035 |
|---|---|---|
| Clean Electricity Regulations (CER)* | +1 to 0 | -3 |
| Output-Based Pricing System (OBPS) | -50 to -51 | -66 to -70 |
| Transportation measures (including EVAS** and post-2026 light-duty vehicle standards) (Transport) | +1 to 0 | -1 to -4 |
| Enhanced Oil and Gas Methane Regulations (OG Methane) | -28 | -29 to -30 |
| Landfill Methane Regulations (Waste LFG) | -8 | -9 |
- * The Clean Electricity Regulations come into force in 2035 and reach their full impact on emissions in 2050 and after. In 2050 the regulations are estimated to deliver emissions reductions in the range of 10 to 21 Mt based on this analysis.
- ** Analysis of EVAS is based on the December 2023 amendments to the Passenger Automobile and Light Truck Greenhouse Gas Emission Regulations.
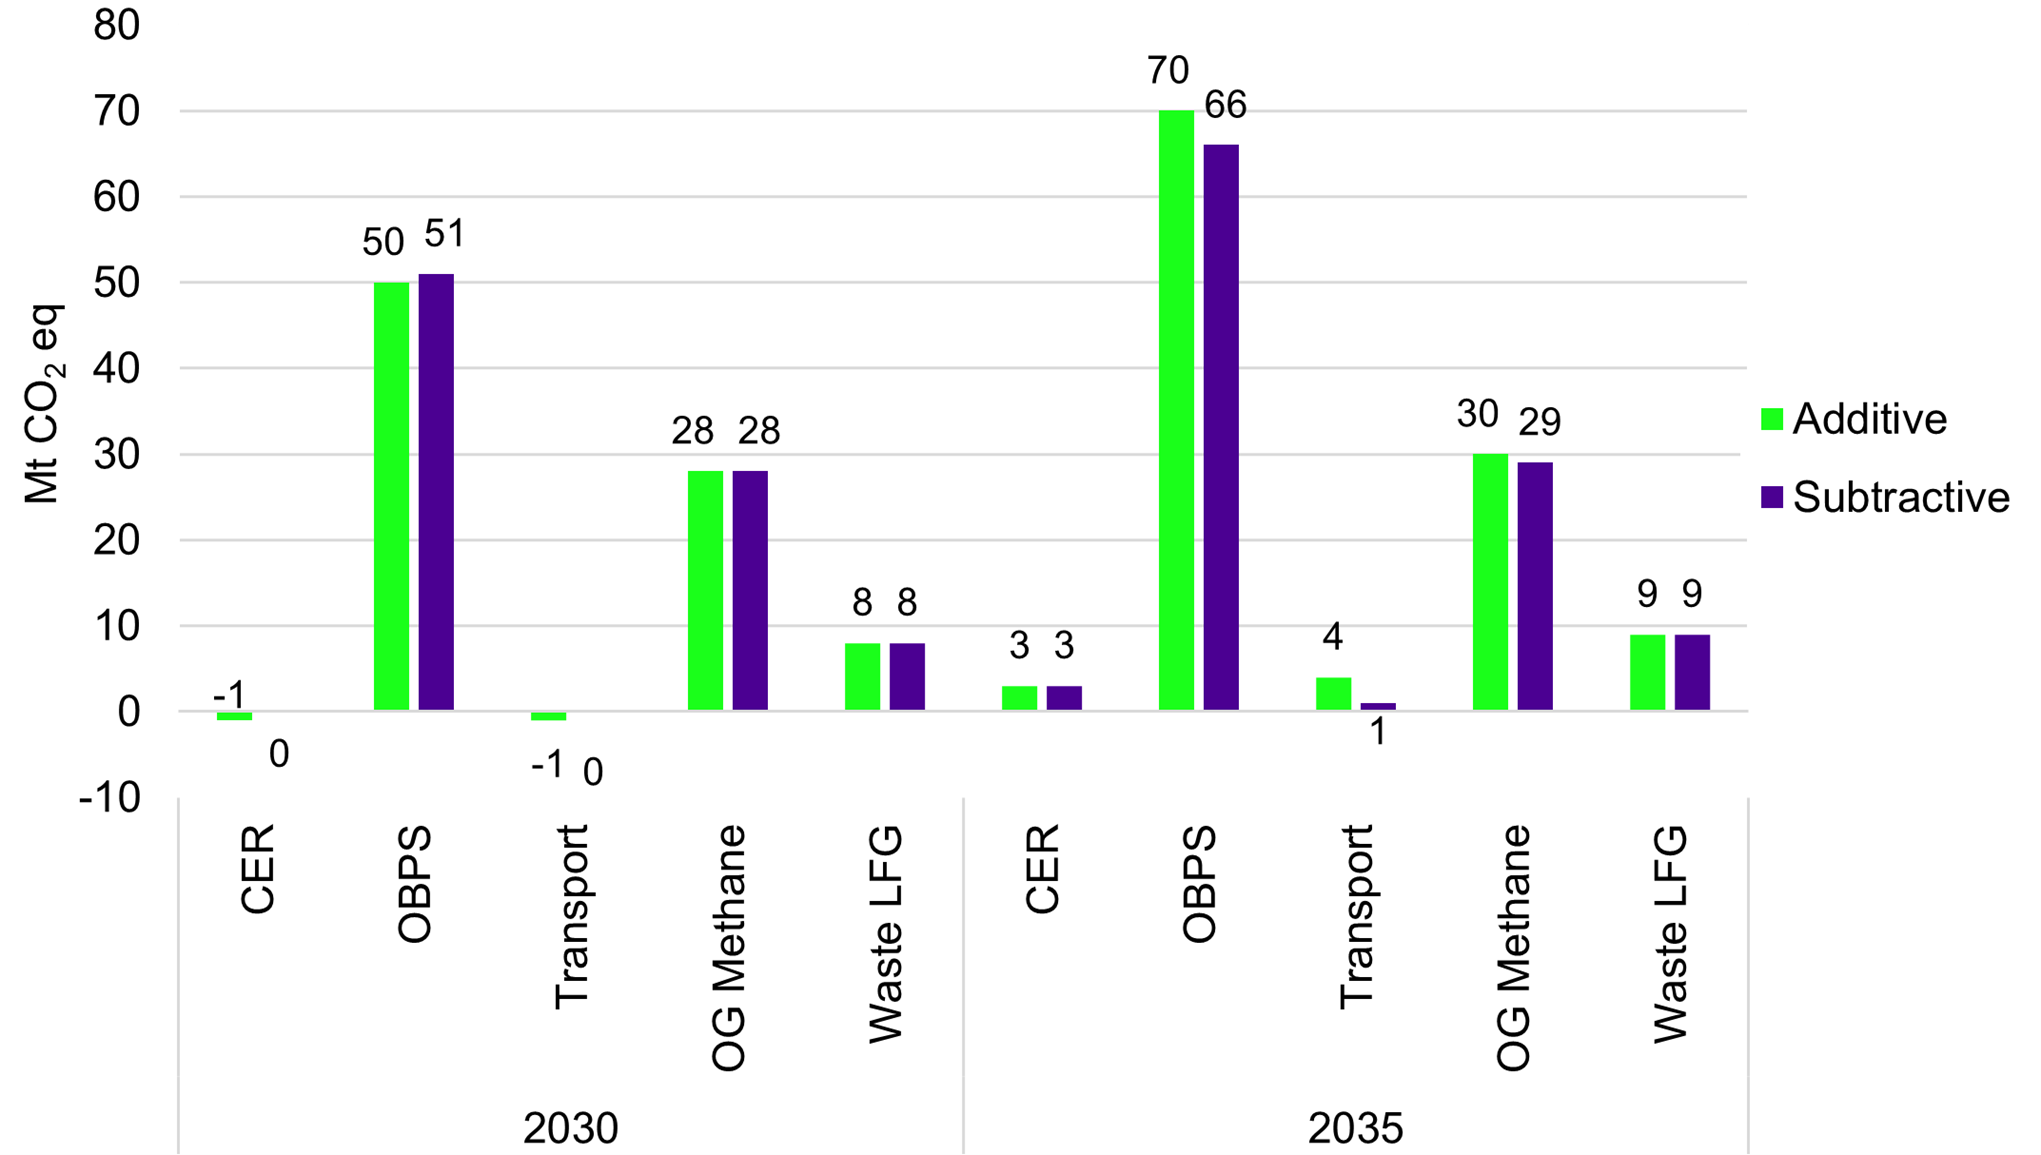
Long description
| Year | Policy | Additive | Subtractive |
|---|---|---|---|
| 2030 | Clean Electricity Regulations (CER) | -1 | 0 |
| 2030 | Output-Based Pricing System (OBPS) | 50 | 51 |
| 2030 | Transportation measures (including EVAS and post-2026 light-duty vehicle standards) (Transport) | -1 | 0 |
| 2030 | Enhanced Oil and Gas Methane Regulations (OG Methane) | 28 | 28 |
| 2030 | Landfill Methane Regulations (Waste LFG) | 8 | 8 |
| 2035 | Clean Electricity Regulations (CER) | 3 | 3 |
| 2035 | Output-Based Pricing System (OBPS) | 70 | 66 |
| 2035 | Transportation measures (including EVAS and post-2026 light-duty vehicle standards) (Transport) | 4 | 1 |
| 2035 | Enhanced Oil and Gas Methane Regulations (OG Methane) | 30 | 29 |
| 2035 | Landfill Methane Regulations (Waste LFG) | 9 | 9 |
2.5 Alternative scenarios and uncertainty
Future economic conditions, energy markets, and trade policies are uncertain. This report includes alternative scenarios and uncertainty analysis to illustrate how Canada’s projected emissions could change under different conditions and the confidence that can be placed in those projections.
2.5.1 Sensitivity analysis
This year’s sensitivity analysis uses modelling and alternative scenarios to assess how changes in future economic and population growth, as well as oil and natural gas prices, could influence outcomes. To reflect increasing uncertainty in both economic conditions and policy, two new scenarios that explore the potential effects of shifts in trade policy are introduced in the sensitivity analysis.
Sensitivity parameters related to oil and gas price and production assumptions are based on the CER’s preliminary Canada Energy Futures 2026 high and low price and production scenarios, which are scheduled for publication in 2026
Starting in 2026, the fast and slow GDP growth scenarios incorporate impacts on both the economy and population. By 2035, Canada’s GDP is approximately 6% higher or lower than the WM result, depending on the scenario. Relative population changes are based on Statistics Canada’s January 2025 high and low population growth projections, applied to their M1 baseline projection.
Trade policy scenarios are included because changes in trade policy affect industries differently than general economic growth. Of note, the implementation of tariffs in the model is based on fixed trade relationships. Industries mostly affected are goods producing and trade exposed. In the reduced global trade scenario, global tariffs added by the US in 2025 and the Canadian retaliation, that was current as of August 2025, are tripled beginning 2026.The improved global trade scenario removes the added 2025 US tariffs and the Canadian retaliation, that was current as of August 2025, beginning 2026.
Table 20 and Table 21 present the price and growth results from the low and high emission scenarios and energy price assumptions used for this analysis. The low emissions scenario is the slow growth and low energy price scenario, and the high emissions scenario is the fast growth and high energy price scenario. Oil and gas production volumes for the low, WM and high scenarios are included in Table 22.
| Assumption | Low | WM Scenario | High |
|---|---|---|---|
| Annual GDP Growth Rate | 1.02% | 1.67% | 2.28% |
| Annual Population Growth Rate | 0.35% | 0.70% | 1.18% |
| Scenario | Product | Units | 2026 | 2030 | 2035 |
|---|---|---|---|---|---|
| Low Price | Light Oil (WTI) | US$/bbl | $54.23 | $49.45 | $49.45 |
| WM | Light Oil (WTI) | US$/bbl | $68.56 | $68.56 | $68.56 |
| High Price | Light Oil (WTI) | US$/bbl | $68.57 | $87.67 | $87.67 |
| Low Price | Heavy Oil (WCS) | US$/bbl | $42.28 | $37.51 | $37.51 |
| WM | Heavy Oil (WCS) | US$/bbl | $56.62 | $56.62 | $56.62 |
| High Price | Heavy Oil (WCS) | US$/bbl | $56.62 | $75.73 | $75.73 |
| Low Price | Natural Gas (Henry Hub) | US$/MMBtu | $3.82 | $2.59 | $2.84 |
| WM | Natural Gas (Henry Hub) | US$/MMBtu | $3.82 | $4.02 | $4.27 |
| High Price | Natural Gas (Henry Hub) | US$/MMBtu | $3.82 | $5.45 | $5.70 |
Note: Access more data on the open data portal. Data from 2026 to 2035 are modelled price projections from CER’s Current Measures scenario forecast (preliminary 2026 Energy Future report – EF2026).
| Scenario | Product | Volume | 2026 | 2030 | 2035 |
|---|---|---|---|---|---|
| Low Price | Crude Oil* | 1000 bbl/day | 5 874 | 5 990 | 5 801 |
| WM | Crude Oil* | 1000 bbl/day | 6 025 | 6 256 | 6 457 |
| High Price | Crude Oil* | 1000 bbl/day | 5 940 | 6 335 | 6 620 |
| Low Price | Natural Gas | Bcf | 8 239 | 8 305 | 8 410 |
| WM | Natural Gas | Bcf | 8 283 | 8 959 | 9 722 |
| High Price | Natural Gas | Bcf | 8 372 | 9 699 | 11 098 |
Note: Access more data on the open data portal. Data from 2026 to 2035 are modelled projections from CER’s Current Measures scenario forecast (preliminary 2026 Energy Future report – EF2026).
*Oil and Gas production projections include pentanes and condensates
The emissions outcomes of these alternative cases are presented independently and in various combinations (open data Tables A30 and A31). These alternative cases explore the interaction of energy markets and economic growth, and their impact on emissions, under a range of assumptions.
The scenario with slow GDP growth, slow population growth, and low world oil and gas prices represents the low end of the range of the sensitivity estimates that have been prepared around the central WM scenario. The high end is represented by the scenario with fast GDP growth, high population growth, and high world oil and gas prices. The difference in emissions between these two scenarios represents a range of 38 Mt in 2030 and 63 Mt in 2035.
Across all sensitivity scenarios, emissions continue to follow a downward trend through 2035. This downward trend occurs even though these scenarios are based on the WM framework and do not include additional measures beyond those currently in place. While the pace of reductions varies depending on assumptions about economic growth, energy prices, and trade policy, the overall trajectory remains consistent with declining emissions over time.
In the high oil and gas price scenario, the Buildings and Electricity sectors reduce their emissions by reducing natural gas use for heating and electricity generation due to higher prices. Conversely, the Oil and Gas sector invests in and develops new and existing assets because higher prices make it more profitable to produce and sell fossil fuels. The demand sectors react quickly to higher input costs. The Oil and Gas sector, however, takes longer to adjust. This is because there is a longer lag between increasing oil and gas prices and changes in asset development and total fossil fuel output, especially in the oil sands.
The reduced global trade scenario increases domestic prices when compared to the WM scenario, resulting in lower emissions concentrated in the trade-exposed goods producing industries. These relative differences from the WM scenario affect the initial years and are then relatively consistent through the end of the projection period.
The improved global trade scenario includes relatively lower prices for goods that are directly affected by price changes. This results in stronger growth of the trade-exposed goods producing industries causing higher emissions than the WM scenario. The relative differences from the WM scenario are relatively consistent after the second year.
GHG emissions for the alternative global trade scenarios do not differ significantly from the WM scenario when compared to other sensitivity parameters involving GDP growth and world oil and gas prices. The range of emissions between the improved and reduced trade scenarios are 5 Mt by 2030 and 8 Mt by 2035.
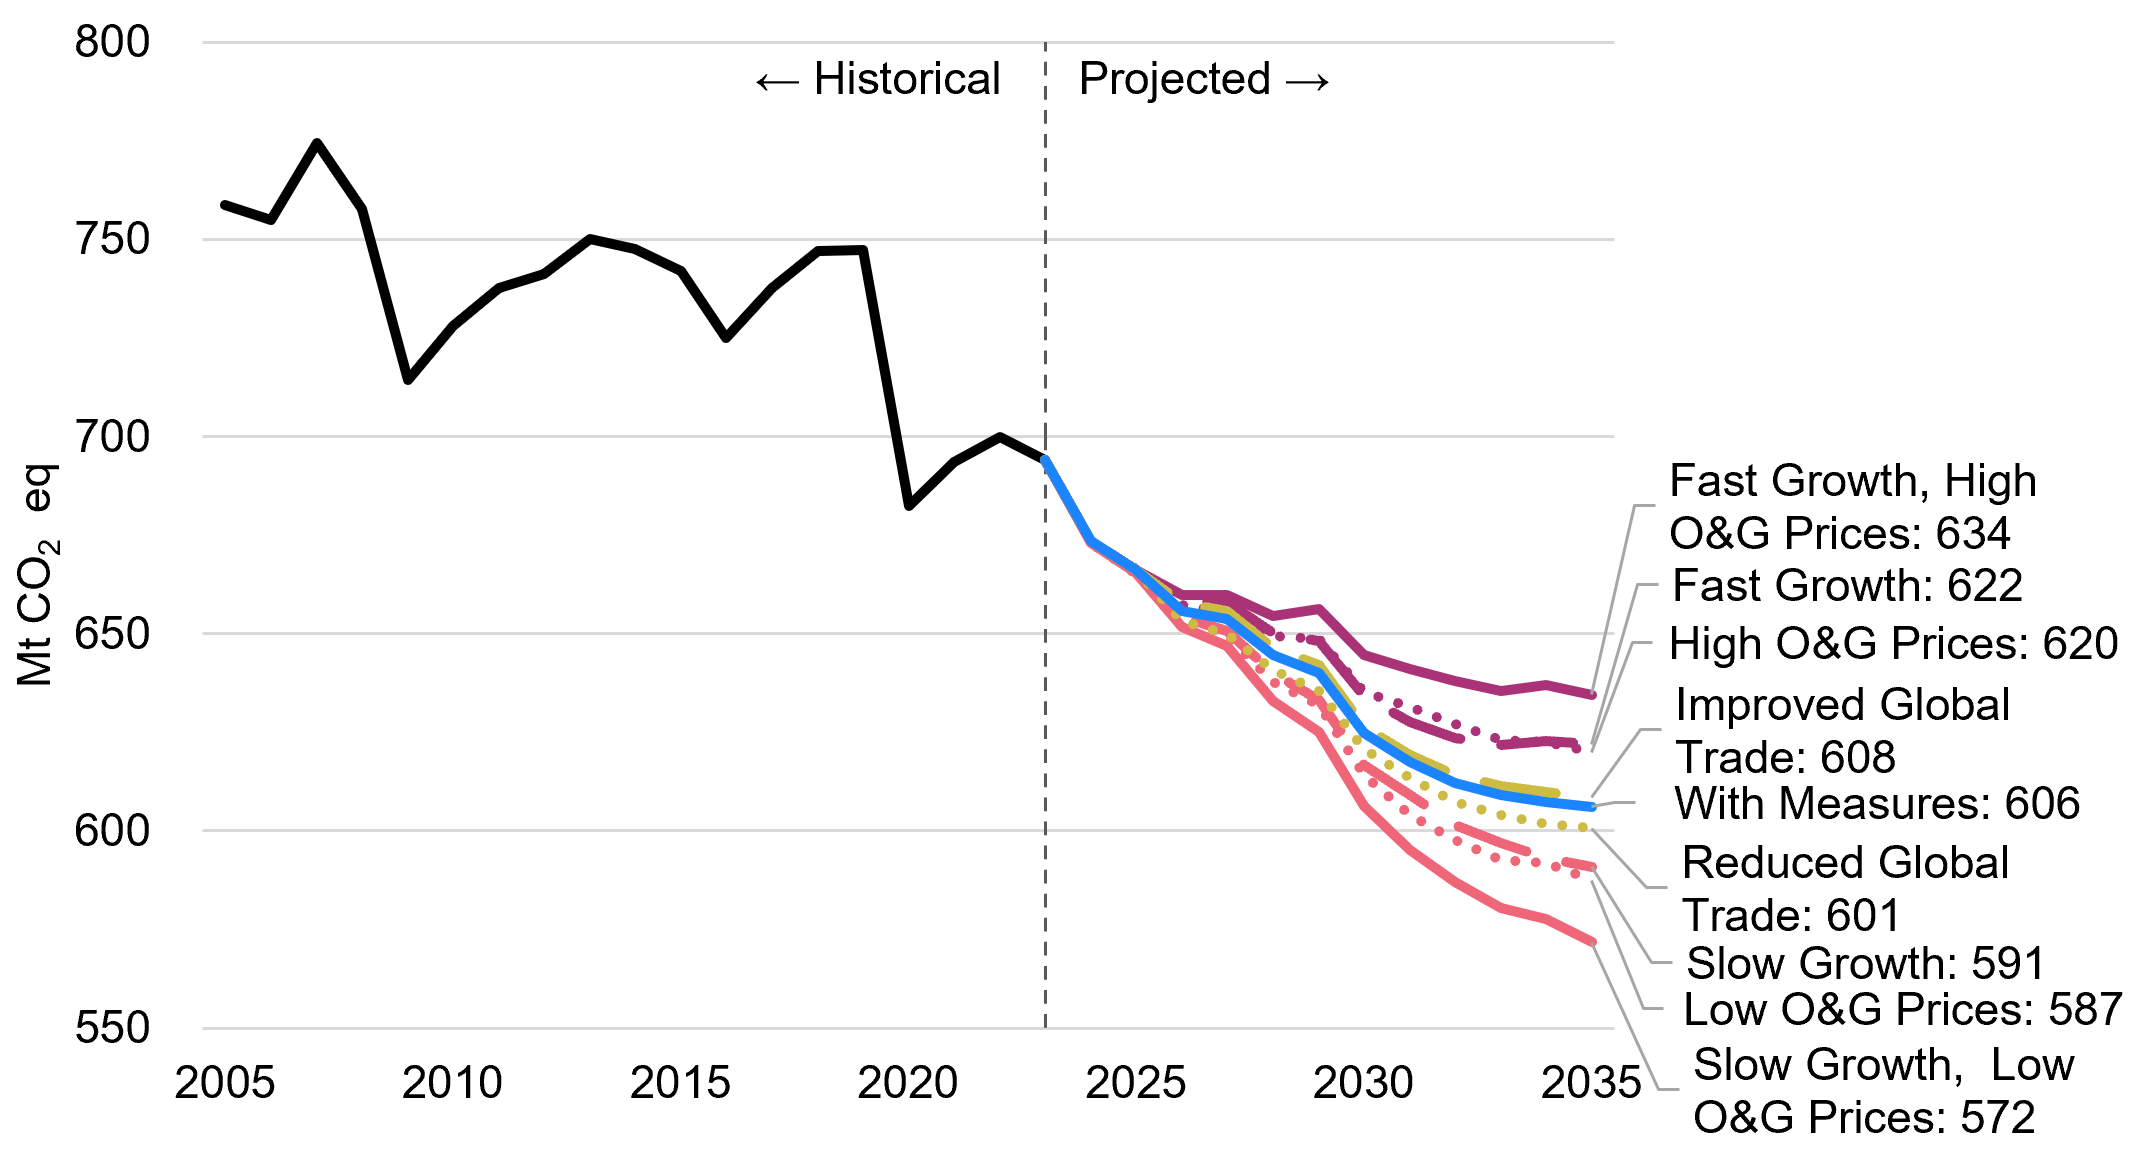
Note: Numbers may not sum to the total due to rounding.
Long description
| Year | Fast Growth | Fast Growth, High O&G Prices | High O&G Prices | Low O&G Prices | Slow Growth | Slow Growth, Low O&G Prices | Improved Global Trade | Reduced Global Trade | WM | History |
|---|---|---|---|---|---|---|---|---|---|---|
| 2005 | - | - | - | - | - | - | - | - | - | 759 |
| 2006 | - | - | - | - | - | - | - | - | - | 755 |
| 2007 | - | - | - | - | - | - | - | - | - | 774 |
| 2008 | - | - | - | - | - | - | - | - | - | 758 |
| 2009 | - | - | - | - | - | - | - | - | - | 714 |
| 2010 | - | - | - | - | - | - | - | - | - | 728 |
| 2011 | - | - | - | - | - | - | - | - | - | 738 |
| 2012 | - | - | - | - | - | - | - | - | - | 741 |
| 2013 | - | - | - | - | - | - | - | - | - | 750 |
| 2014 | - | - | - | - | - | - | - | - | - | 747 |
| 2015 | - | - | - | - | - | - | - | - | - | 742 |
| 2016 | - | - | - | - | - | - | - | - | - | 725 |
| 2017 | - | - | - | - | - | - | - | - | - | 738 |
| 2018 | - | - | - | - | - | - | - | - | - | 747 |
| 2019 | - | - | - | - | - | - | - | - | - | 747 |
| 2020 | - | - | - | - | - | - | - | - | - | 682 |
| 2021 | - | - | - | - | - | - | - | - | - | 694 |
| 2022 | - | - | - | - | - | - | - | - | - | 700 |
| 2023 | 694 | 694 | 694 | 694 | 694 | 694 | 694 | 694 | 694 | 694 |
| 2024 | 673 | 673 | 673 | 673 | 673 | 673 | 673 | 673 | 673 | - |
| 2025 | 666 | 666 | 666 | 665 | 666 | 665 | 666 | 666 | 666 | - |
| 2026 | 658 | 660 | 657 | 653 | 654 | 652 | 658 | 653 | 656 | - |
| 2027 | 658 | 660 | 655 | 650 | 651 | 647 | 656 | 650 | 654 | - |
| 2028 | 650 | 655 | 649 | 638 | 640 | 633 | 646 | 641 | 645 | - |
| 2029 | 648 | 656 | 649 | 632 | 633 | 625 | 642 | 635 | 640 | - |
| 2030 | 634 | 645 | 635 | 614 | 617 | 606 | 626 | 621 | 625 | - |
| 2031 | 628 | 641 | 631 | 604 | 609 | 595 | 619 | 613 | 618 | - |
| 2032 | 623 | 638 | 627 | 598 | 601 | 587 | 614 | 607 | 612 | - |
| 2033 | 622 | 635 | 623 | 593 | 597 | 580 | 611 | 604 | 609 | - |
| 2034 | 623 | 637 | 623 | 592 | 593 | 578 | 610 | 602 | 607 | - |
| 2035 | 622 | 634 | 620 | 587 | 591 | 572 | 608 | 601 | 606 | - |
The range of emissions from the Oil and Gas sector between scenarios is 21 Mt by 2030 and 39 Mt by 2035. This represents 63% of the total range of emissions in the sensitivity scenarios by 2035. The range reflects the sector's overall contribution to Canadian emissions and its sensitivity to the highly uncertain world oil and gas prices. In addition, fast GDP and population growth lead to higher emissions in the Heavy Industry sector compared to the WM scenario.
2.5.2 Probabilistic uncertainty analysis
The WM scenario provides emissions pathway considering only one potential scenario of future population and economic growth, evolution of world oil and gas markets. The sensitivity analysis presented in Section 2.5.1 and Figure 26 shows how different assumptions of future domestic economic activity and energy prices would alter GHG emissions in 2030. This section shows the statistical uncertainty arising from the uncertainty associated with future economic activity and energy prices.
Figure 25 shows the sensitivity of GHG emissions estimates to changes in economic activity, energy prices and global trade. This information is important as it indicates the extent to which the emission projections are influenced by different assumptions. However, the limitation of this analysis is the lack of information about the likelihood of these different scenarios. Monte Carlo uncertainty analysis fills this void by considering the probability distribution function of chosen input variables. Monte Carlo analysis consists of simulating 40,000 different scenarios obtained by varying both economic activity and energy prices based on their respective probability distribution functions. The uncertainty associated with global trade and tariffs was not explored in this analysis.
Figure 26 shows a frequency distribution of projected GHG emissions (excluding LULUCF accounting, NBCS and agriculture measures) in 2030 coming from 40,000 economic activity/energy price simulations for the year 2030. In the figure:
- the 2030 emissions in the WM scenario (625 Mt) are shown by the vertical black dashed bar
- the lower and upper critical values, with 95% confidence interval, are 582 Mt (-6.9% lower than the WM scenario) and 662 Mt (5.9% higher than the WM scenario), respectively
- the results are comparable to the sensitivity analysis shown in Figure 25 where GHG emission in 2030 could vary between -3.0% (slow GDP, low prices) up to +3.2% (fast GDP, high prices)
- the bell curve, calculated using the mean and standard deviation of the 40,000 different scenarios, is shown to illustrate that the scenario results can be approximated by a normal distribution
It seems reasonable to assume that the same uncertainty levels (+/- 6%) would also apply to the WAM scenario.
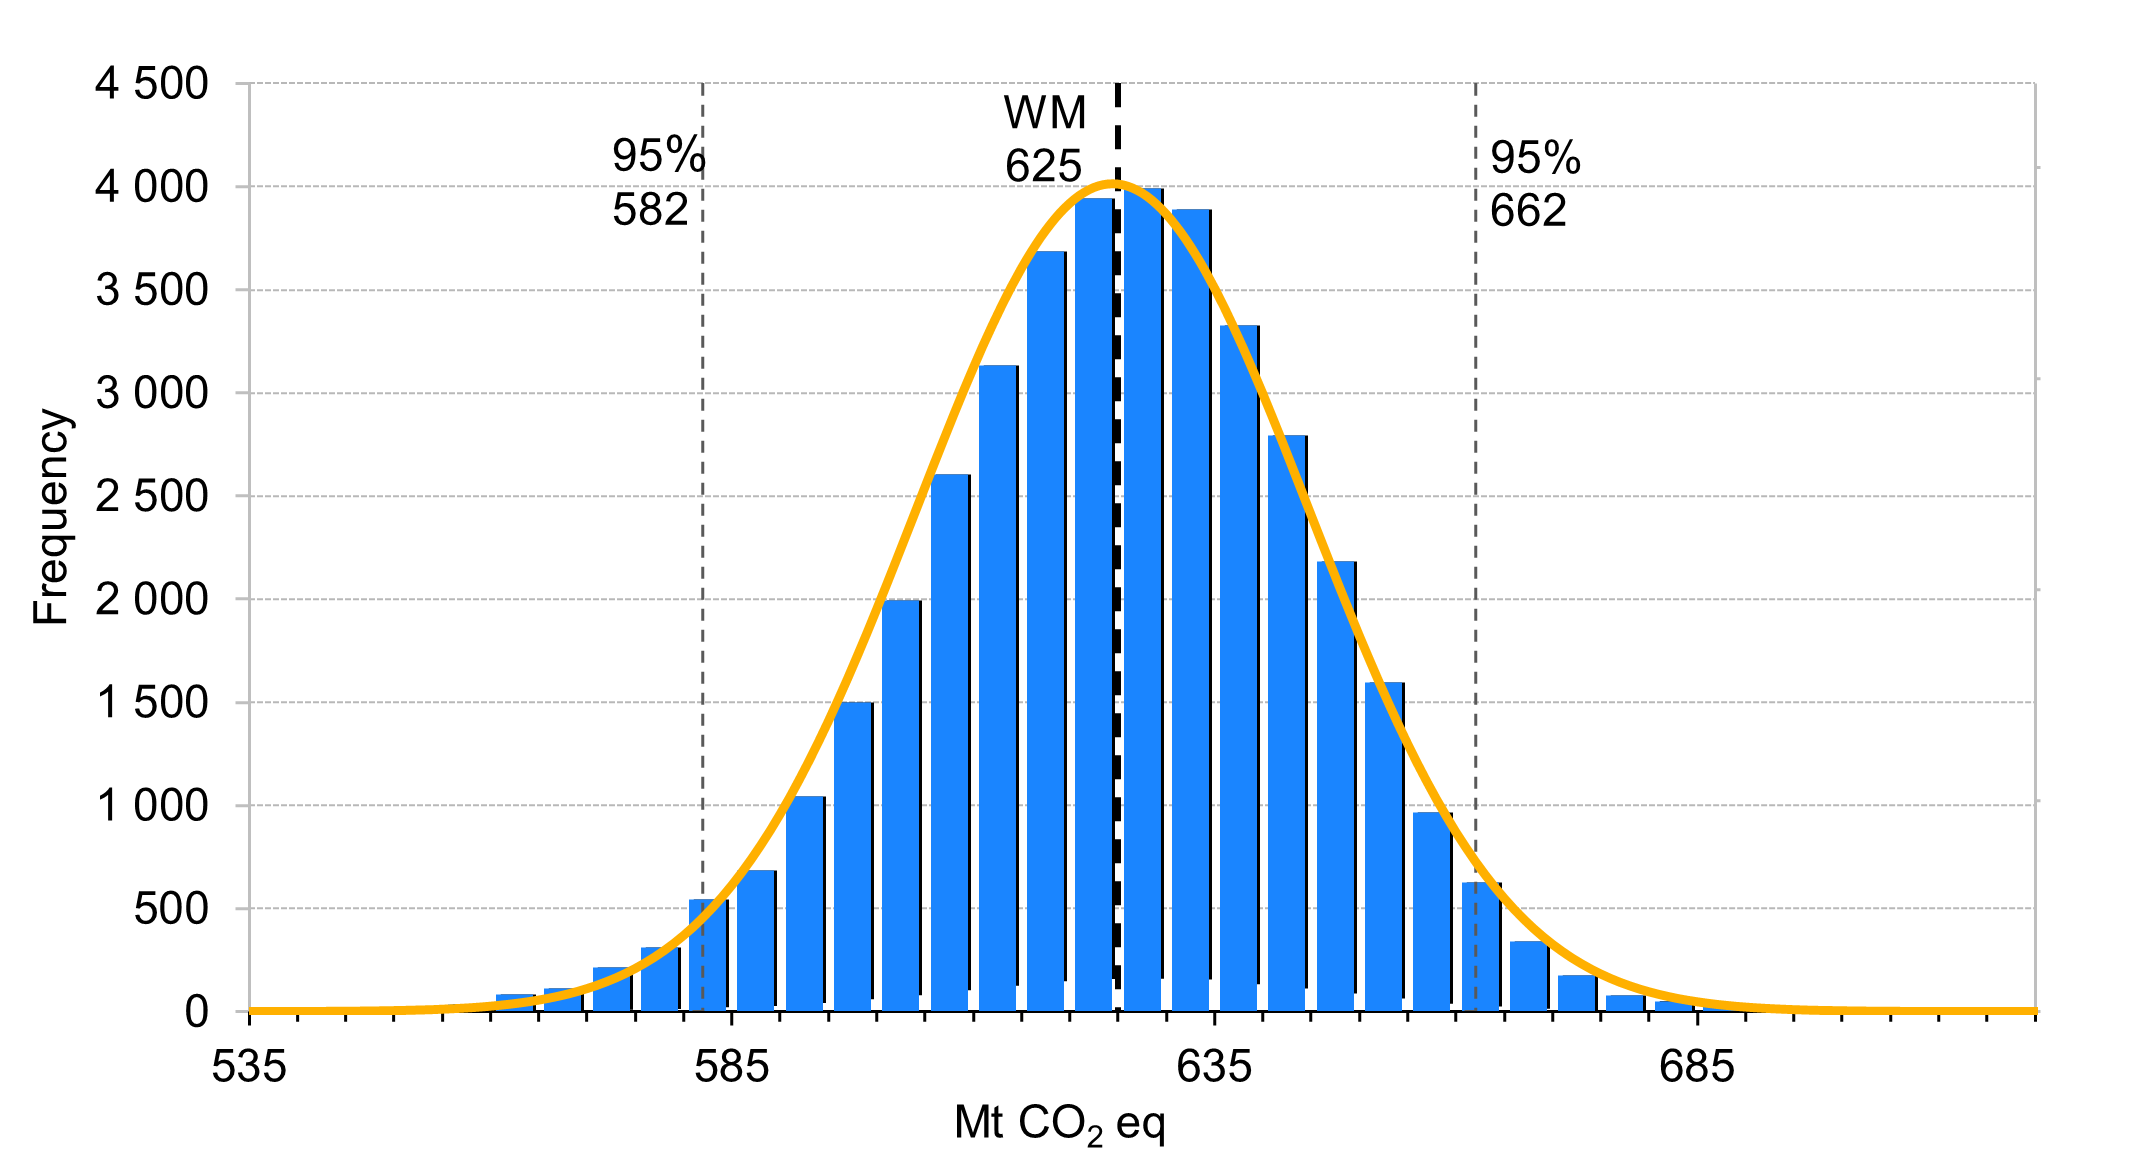
Long description
| Center of Bin (Mt) | Bin (Mt) | Frequency (Histogram) | Value (Mt) | Normal Distribution Probability | WM Value (Mt) | 95% Confidence Interval Lower Bound | 95% Confidence Interval Upper Bound |
|---|---|---|---|---|---|---|---|
| 510 | 507.5 - 510 | 1 | 510 | 0.0000 | 625 | 582 | 662 |
| 513 | 510 - 520 | 0 | 511 | 0.0000 | - | - | - |
| 523 | 520 - 525 | 0 | 512 | 0.0000 | - | - | - |
| 528 | 525 - 530 | 0 | 513 | 0.0000 | - | - | - |
| 533 | 530 - 535 | 1 | 514 | 0.0000 | - | - | - |
| 538 | 535 - 540 | 3 | 515 | 0.0000 | - | - | - |
| 543 | 540 - 545 | 6 | 516 | 0.0000 | - | - | - |
| 548 | 545 - 550 | 6 | 517 | 0.0000 | - | - | - |
| 553 | 550 - 555 | 25 | 518 | 0.0000 | - | - | - |
| 558 | 555 - 560 | 33 | 519 | 0.0000 | - | - | - |
| 563 | 560 - 565 | 83 | 520 | 0.0000 | - | - | - |
| 568 | 565 - 570 | 112 | 521 | 0.0000 | - | - | - |
| 573 | 570 - 575 | 216 | 522 | 0.0000 | - | - | - |
| 578 | 575 - 580 | 309 | 523 | 0.0000 | - | - | - |
| 583 | 580 - 585 | 545 | 524 | 0.0000 | - | - | - |
| 588 | 585 - 590 | 685 | 525 | 0.0000 | - | - | - |
| 593 | 590 - 595 | 1 044 | 526 | 0.0000 | - | - | - |
| 598 | 595 - 600 | 1 496 | 527 | 0.0000 | - | - | - |
| 603 | 600 - 605 | 1 993 | 528 | 0.0000 | - | - | - |
| 608 | 605 - 610 | 2 604 | 529 | 0.0000 | - | - | - |
| 613 | 610 - 615 | 3 134 | 530 | 0.0000 | - | - | - |
| 618 | 615 - 620 | 3 687 | 531 | 0.0000 | - | - | - |
| 623 | 620 - 625 | 3 940 | 532 | 0.0000 | - | - | - |
| 628 | 625 - 630 | 3 989 | 533 | 0.0000 | - | - | - |
| 633 | 630 - 635 | 3 887 | 534 | 0.0000 | - | - | - |
| 638 | 635 - 640 | 3 328 | 535 | 0.0000 | - | - | - |
| 643 | 640 - 645 | 2 794 | 536 | 0.0000 | - | - | - |
| 648 | 645 - 650 | 2 183 | 537 | 0.0000 | - | - | - |
| 653 | 650 - 655 | 1 594 | 538 | 0.0000 | - | - | - |
| 658 | 655 - 660 | 966 | 539 | 0.0000 | - | - | - |
| 663 | 660 - 665 | 625 | 540 | 0.0000 | - | - | - |
| 668 | 665 - 670 | 342 | 541 | 0.0000 | - | - | - |
| 673 | 670 - 675 | 176 | 542 | 0.0000 | - | - | - |
| 678 | 675 - 680 | 80 | 543 | 0.0000 | - | - | - |
| 683 | 680 - 685 | 51 | 544 | 0.0000 | - | - | - |
| 688 | 685 - 690 | 29 | 545 | 0.0000 | - | - | - |
| 693 | 690 - 695 | 12 | 546 | 0.0000 | - | - | - |
| 698 | 695 - 700 | 8 | 547 | 0.0000 | - | - | - |
| 703 | 700 - 705 | 3 | 548 | 0.0000 | - | - | - |
| 708 | 705 - 710 | 3 | 549 | 0.0000 | - | - | - |
| 713 | 710 - 715 | 0 | 550 | 0.0000 | - | - | - |
| 718 | 715 - 720 | 3 | 551 | 0.0000 | - | - | - |
| 723 | 720 - 725 | 1 | 552 | 0.0000 | - | - | - |
| 728 | 725 - 730 | 1 | 553 | 0.0000 | - | - | - |
| 733 | 730 - 735 | 1 | 554 | 0.0000 | - | - | - |
| 738 | 735 - 740 | 0 | 555 | 0.0001 | - | - | - |
| 743 | 740 - 745 | 0 | 556 | 0.0001 | - | - | - |
| - | - | - | 557 | 0.0001 | - | - | - |
| - | - | - | 558 | 0.0001 | - | - | - |
| - | - | - | 559 | 0.0001 | - | - | - |
| - | - | - | 560 | 0.0001 | - | - | - |
| - | - | - | 561 | 0.0002 | - | - | - |
| - | - | - | 562 | 0.0002 | - | - | - |
| - | - | - | 563 | 0.0002 | - | - | - |
| - | - | - | 564 | 0.0002 | - | - | - |
| - | - | - | 565 | 0.0003 | - | - | - |
| - | - | - | 566 | 0.0003 | - | - | - |
| - | - | - | 567 | 0.0004 | - | - | - |
| - | - | - | 568 | 0.0004 | - | - | - |
| - | - | - | 569 | 0.0005 | - | - | - |
| - | - | - | 570 | 0.0005 | - | - | - |
| - | - | - | 571 | 0.0006 | - | - | - |
| - | - | - | 572 | 0.0007 | - | - | - |
| - | - | - | 573 | 0.0008 | - | - | - |
| - | - | - | 574 | 0.0009 | - | - | - |
| - | - | - | 575 | 0.0010 | - | - | - |
| - | - | - | 576 | 0.0012 | - | - | - |
| - | - | - | 577 | 0.0013 | - | - | - |
| - | - | - | 578 | 0.0014 | - | - | - |
| - | - | - | 579 | 0.0016 | - | - | - |
| - | - | - | 580 | 0.0018 | - | - | - |
| - | - | - | 581 | 0.0020 | - | - | - |
| - | - | - | 582 | 0.0022 | - | - | - |
| - | - | - | 583 | 0.0025 | - | - | - |
| - | - | - | 584 | 0.0027 | - | - | - |
| - | - | - | 585 | 0.0030 | - | - | - |
| - | - | - | 586 | 0.0033 | - | - | - |
| - | - | - | 587 | 0.0036 | - | - | - |
| - | - | - | 588 | 0.0039 | - | - | - |
| - | - | - | 589 | 0.0043 | - | - | - |
| - | - | - | 590 | 0.0047 | - | - | - |
| - | - | - | 591 | 0.0051 | - | - | - |
| - | - | - | 592 | 0.0055 | - | - | - |
| - | - | - | 593 | 0.0059 | - | - | - |
| - | - | - | 594 | 0.0064 | - | - | - |
| - | - | - | 595 | 0.0069 | - | - | - |
| - | - | - | 596 | 0.0074 | - | - | - |
| - | - | - | 597 | 0.0079 | - | - | - |
| - | - | - | 598 | 0.0084 | - | - | - |
| - | - | - | 599 | 0.0090 | - | - | - |
| - | - | - | 600 | 0.0095 | - | - | - |
| - | - | - | 601 | 0.0101 | - | - | - |
| - | - | - | 602 | 0.0107 | - | - | - |
| - | - | - | 603 | 0.0113 | - | - | - |
| - | - | - | 604 | 0.0118 | - | - | - |
| - | - | - | 605 | 0.0124 | - | - | - |
| - | - | - | 606 | 0.0130 | - | - | - |
| - | - | - | 607 | 0.0136 | - | - | - |
| - | - | - | 608 | 0.0141 | - | - | - |
| - | - | - | 609 | 0.0147 | - | - | - |
| - | - | - | 610 | 0.0152 | - | - | - |
| - | - | - | 611 | 0.0158 | - | - | - |
| - | - | - | 612 | 0.0163 | - | - | - |
| - | - | - | 613 | 0.0167 | - | - | - |
| - | - | - | 614 | 0.0172 | - | - | - |
| - | - | - | 615 | 0.0176 | - | - | - |
| - | - | - | 616 | 0.0180 | - | - | - |
| - | - | - | 617 | 0.0183 | - | - | - |
| - | - | - | 618 | 0.0187 | - | - | - |
| - | - | - | 619 | 0.0189 | - | - | - |
| - | - | - | 620 | 0.0192 | - | - | - |
| - | - | - | 621 | 0.0193 | - | - | - |
| - | - | - | 622 | 0.0195 | - | - | - |
| - | - | - | 623 | 0.0196 | - | - | - |
| - | - | - | 624 | 0.0196 | - | - | - |
| - | - | - | 625 | 0.0196 | - | - | - |
| - | - | - | 626 | 0.0196 | - | - | - |
| - | - | - | 627 | 0.0195 | - | - | - |
| - | - | - | 628 | 0.0193 | - | - | - |
| - | - | - | 629 | 0.0191 | - | - | - |
| - | - | - | 630 | 0.0189 | - | - | - |
| - | - | - | 631 | 0.0186 | - | - | - |
| - | - | - | 632 | 0.0183 | - | - | - |
| - | - | - | 633 | 0.0180 | - | - | - |
| - | - | - | 634 | 0.0176 | - | - | - |
| - | - | - | 635 | 0.0171 | - | - | - |
| - | - | - | 636 | 0.0167 | - | - | - |
| - | - | - | 637 | 0.0162 | - | - | - |
| - | - | - | 638 | 0.0157 | - | - | - |
| - | - | - | 639 | 0.0152 | - | - | - |
| - | - | - | 640 | 0.0146 | - | - | - |
| - | - | - | 641 | 0.0141 | - | - | - |
| - | - | - | 642 | 0.0135 | - | - | - |
| - | - | - | 643 | 0.0129 | - | - | - |
| - | - | - | 644 | 0.0124 | - | - | - |
| - | - | - | 645 | 0.0118 | - | - | - |
| - | - | - | 646 | 0.0112 | - | - | - |
| - | - | - | 647 | 0.0106 | - | - | - |
| - | - | - | 648 | 0.0100 | - | - | - |
| - | - | - | 649 | 0.0095 | - | - | - |
| - | - | - | 650 | 0.0089 | - | - | - |
| - | - | - | 651 | 0.0084 | - | - | - |
| - | - | - | 652 | 0.0078 | - | - | - |
| - | - | - | 653 | 0.0073 | - | - | - |
| - | - | - | 654 | 0.0068 | - | - | - |
| - | - | - | 655 | 0.0063 | - | - | - |
| - | - | - | 656 | 0.0059 | - | - | - |
| - | - | - | 657 | 0.0054 | - | - | - |
| - | - | - | 658 | 0.0050 | - | - | - |
| - | - | - | 659 | 0.0046 | - | - | - |
| - | - | - | 660 | 0.0043 | - | - | - |
| - | - | - | 661 | 0.0039 | - | - | - |
| - | - | - | 662 | 0.0036 | - | - | - |
| - | - | - | 663 | 0.0033 | - | - | - |
| - | - | - | 664 | 0.0030 | - | - | - |
| - | - | - | 665 | 0.0027 | - | - | - |
| - | - | - | 666 | 0.0024 | - | - | - |
| - | - | - | 667 | 0.0022 | - | - | - |
| - | - | - | 668 | 0.0020 | - | - | - |
| - | - | - | 669 | 0.0018 | - | - | - |
| - | - | - | 670 | 0.0016 | - | - | - |
| - | - | - | 671 | 0.0014 | - | - | - |
| - | - | - | 672 | 0.0013 | - | - | - |
| - | - | - | 673 | 0.0011 | - | - | - |
| - | - | - | 674 | 0.0010 | - | - | - |
| - | - | - | 675 | 0.0009 | - | - | - |
| - | - | - | 676 | 0.0008 | - | - | - |
| - | - | - | 677 | 0.0007 | - | - | - |
| - | - | - | 678 | 0.0006 | - | - | - |
| - | - | - | 679 | 0.0005 | - | - | - |
| - | - | - | 680 | 0.0005 | - | - | - |
| - | - | - | 681 | 0.0004 | - | - | - |
| - | - | - | 682 | 0.0004 | - | - | - |
| - | - | - | 683 | 0.0003 | - | - | - |
| - | - | - | 684 | 0.0003 | - | - | - |
| - | - | - | 685 | 0.0002 | - | - | - |
| - | - | - | 686 | 0.0002 | - | - | - |
| - | - | - | 687 | 0.0002 | - | - | - |
| - | - | - | 688 | 0.0001 | - | - | - |
| - | - | - | 689 | 0.0001 | - | - | - |
| - | - | - | 690 | 0.0001 | - | - | - |
| - | - | - | 691 | 0.0001 | - | - | - |
| - | - | - | 692 | 0.0001 | - | - | - |
| - | - | - | 693 | 0.0001 | - | - | - |
| - | - | - | 694 | 0.0001 | - | - | - |
| - | - | - | 695 | 0.0000 | - | - | - |
| - | - | - | 696 | 0.0000 | - | - | - |
| - | - | - | 697 | 0.0000 | - | - | - |
| - | - | - | 698 | 0.0000 | - | - | - |
| - | - | - | 699 | 0.0000 | - | - | - |
| - | - | - | 700 | 0.0000 | - | - | - |
| - | - | - | 701 | 0.0000 | - | - | - |
| - | - | - | 702 | 0.0000 | - | - | - |
| - | - | - | 703 | 0.0000 | - | - | - |
| - | - | - | 704 | 0.0000 | - | - | - |
| - | - | - | 705 | 0.0000 | - | - | - |
| - | - | - | 706 | 0.0000 | - | - | - |
| - | - | - | 707 | 0.0000 | - | - | - |
| - | - | - | 708 | 0.0000 | - | - | - |
| - | - | - | 709 | 0.0000 | - | - | - |
| - | - | - | 710 | 0.0000 | - | - | - |
| - | - | - | 711 | 0.0000 | - | - | - |
| - | - | - | 712 | 0.0000 | - | - | - |
| - | - | - | 713 | 0.0000 | - | - | - |
| - | - | - | 714 | 0.0000 | - | - | - |
| - | - | - | 715 | 0.0000 | - | - | - |
| - | - | - | 716 | 0.0000 | - | - | - |
| - | - | - | 717 | 0.0000 | - | - | - |
| - | - | - | 718 | 0.0000 | - | - | - |
| - | - | - | 719 | 0.0000 | - | - | - |
| - | - | - | 720 | 0.0000 | - | - | - |
| - | - | - | 721 | 0.0000 | - | - | - |
| - | - | - | 722 | 0.0000 | - | - | - |
| - | - | - | 723 | 0.0000 | - | - | - |
| - | - | - | 724 | 0.0000 | - | - | - |
| - | - | - | 725 | 0.0000 | - | - | - |
| - | - | - | 726 | 0.0000 | - | - | - |
| - | - | - | 727 | 0.0000 | - | - | - |
| - | - | - | 728 | 0.0000 | - | - | - |
| - | - | - | 729 | 0.0000 | - | - | - |
| - | - | - | 730 | 0.0000 | - | - | - |
| - | - | - | 731 | 0.0000 | - | - | - |
| - | - | - | 732 | 0.0000 | - | - | - |
| - | - | - | 733 | 0.0000 | - | - | - |
| - | - | - | 734 | 0.0000 | - | - | - |
| - | - | - | 735 | 0.0000 | - | - | - |
| - | - | - | 736 | 0.0000 | - | - | - |
| - | - | - | 737 | 0.0000 | - | - | - |
| - | - | - | 738 | 0.0000 | - | - | - |
| - | - | - | 739 | 0.0000 | - | - | - |
| - | - | - | 740 | 0.0000 | - | - | - |
| - | - | - | 741 | 0.0000 | - | - | - |
| - | - | - | 742 | 0.0000 | - | - | - |
| - | - | - | 743 | 0.0000 | - | - | - |
| - | - | - | 744 | 0.0000 | - | - | - |
| - | - | - | 745 | 0.0000 | - | - | - |
| - | - | - | 746 | 0.0000 | - | - | - |
| - | - | - | 747 | 0.0000 | - | - | - |
| - | - | - | 748 | 0.0000 | - | - | - |
Figure 27 presents results from the same 40,000 Monte Carlo simulation, showing the cumulative probability associated with different levels of projected GHG emissions for 2030. For a given level of projected GHG emissions in 2030, the cumulative probability indicates the likelihood that the actual emission will be less than the projected level. For example, the probability that GHG emission projections are smaller than 641 Mt is 80%. Determining GHG emissions associated to a cumulative probability of 80% is often interpreted as identifying a “reasonable” worst-case scenario. It is worth noting that this “reasonable” worst-case scenario is only 2.6% higher than the value from the WM scenario.
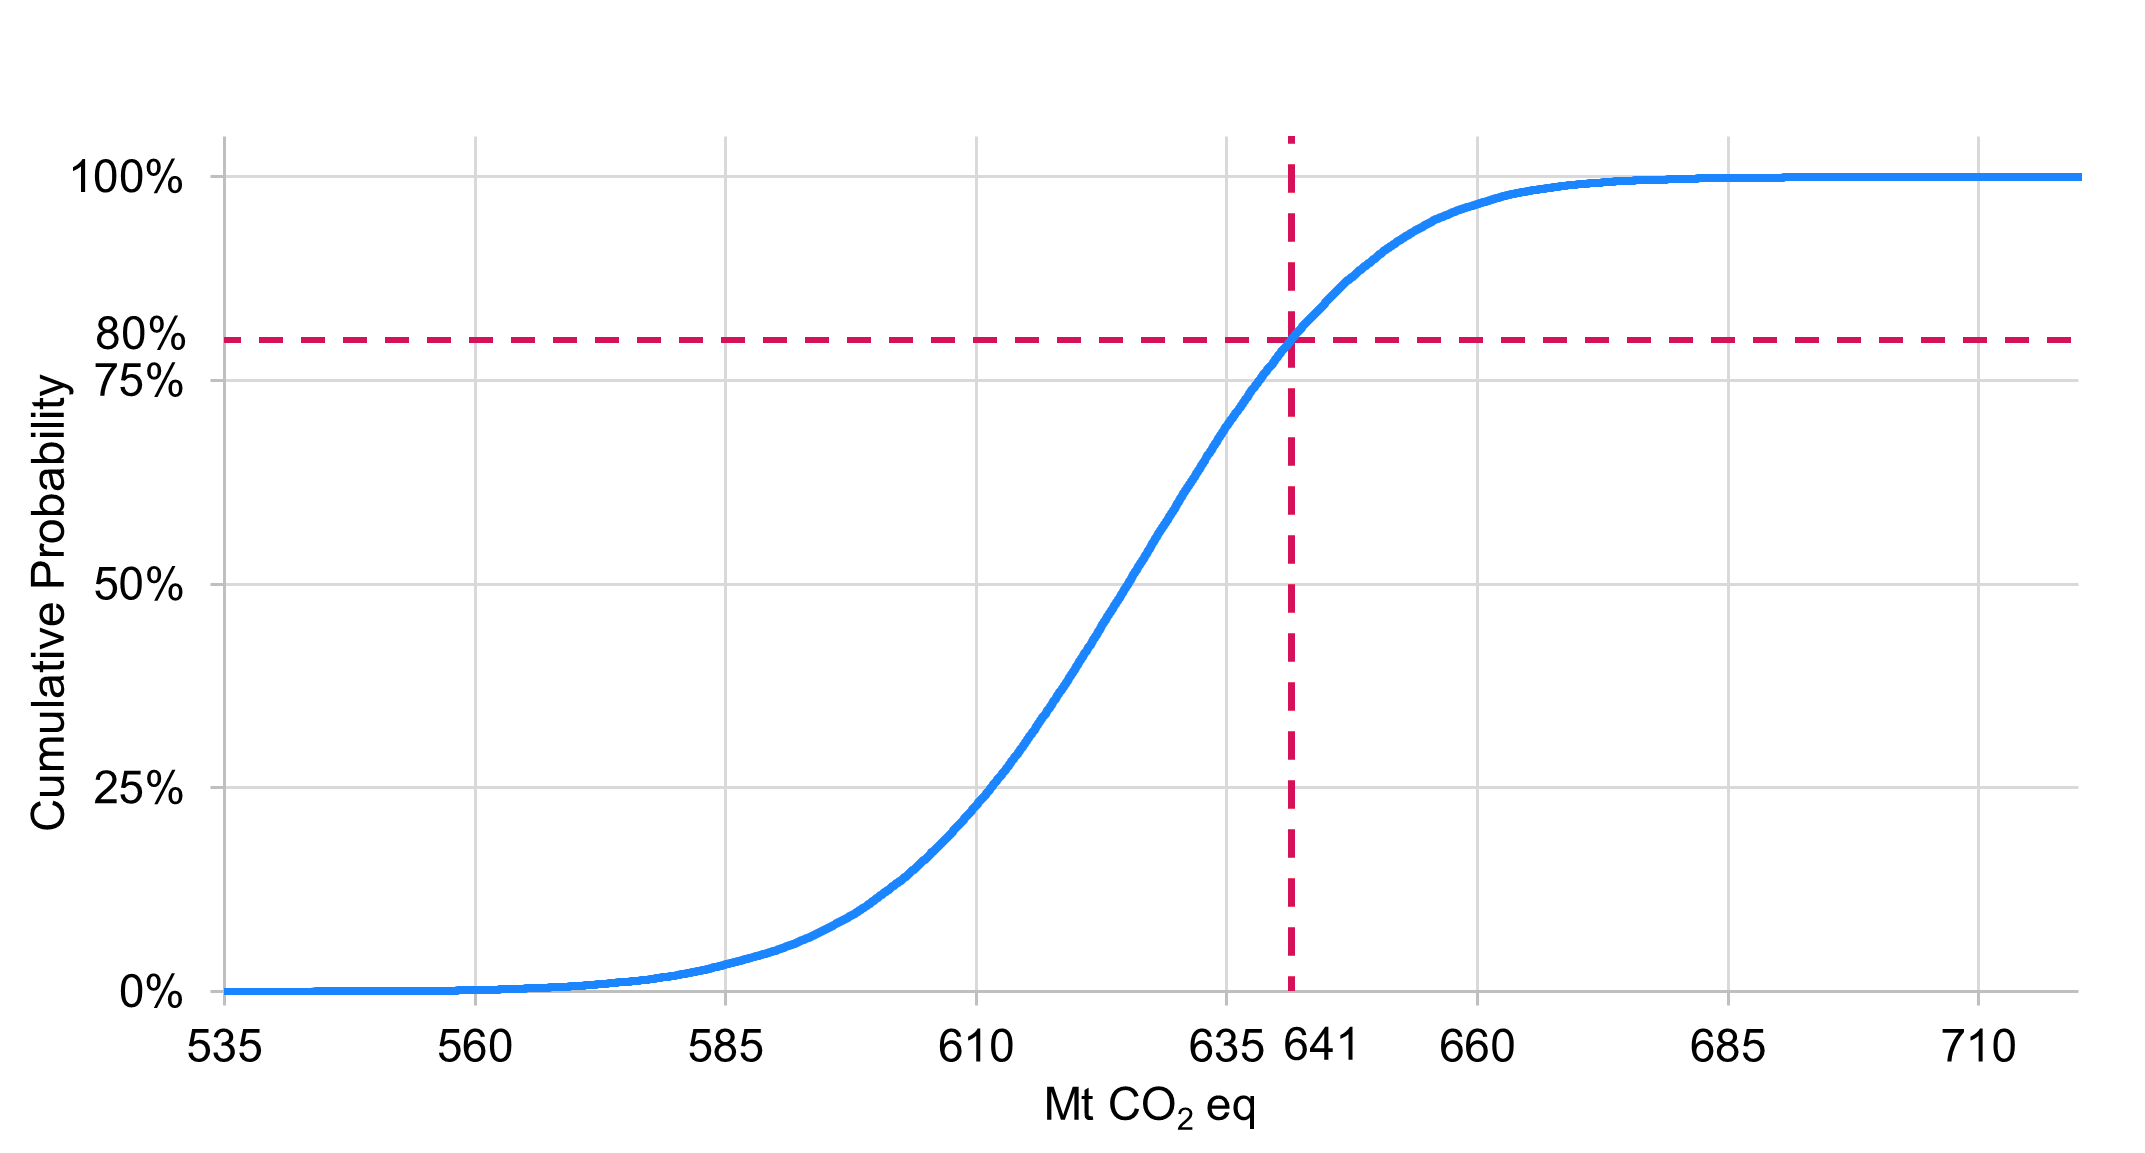
Long description
The figure presents a cumulative probability distribution curve plotted against greenhouse gas emissions measured in megatonnes of CO₂ equivalent (Mt CO2 eq). The horizontal axis (x axis) represents emissions levels, beginning at 535 Mt and extending to 710 Mt. The vertical axis (y axis) shows cumulative probability, ranging from 0% at the bottom to 100% at the top.
The main feature of the plot is a smooth S shaped (sigmoidal) cumulative distribution curve, which gradually increases from left to right:- At the far left of the x axis (around 535 Mt to 560 Mt), the curve stays near 0% probability, indicating that emissions values in this range have a very low likelihood according to the underlying distribution.
- As emissions reach approximately 580 Mt to 600 Mt, the curve begins to rise slowly.
- Between roughly 610 Mt and 650 Mt, the curve enters its steepest section. This is the midpoint region of the distribution, where small changes in emissions correspond to relatively large changes in cumulative probability.
- After about 660 Mt, the slope flattens again, with the curve approaching 100% probability, meaning that emissions above that level fall at or near the upper tail of the distribution.
Superimposed on this distribution are two intersecting dashed red reference lines:
- A horizontal dashed line is drawn at 80% cumulative probability.
- A vertical dashed line extends upward from 641 Mt on the x axis.
These two lines intersect at a point on the cumulative curve, marking the emissions value that corresponds to a cumulative probability of 80%. This point serves as a highlight or reference marker, indicating the emissions threshold below which 80% of all modelled outcomes fall.
Monte Carlo analysis is used to derive probabilistic distribution function of projected GHG emissions. Based on historical information, economic activity and energy prices probability distribution functions are defined. This allows the generation of tens of thousands of different random scenarios for economic activity and energy prices. GHG emissions associated with each of these random scenarios using ENERGY 2020 model are evaluated. However, given ENERGY 2020’s long simulation time of several hours per scenario, an alternative method is required. Research has shown that it is possible to approximate ENERGY 2020 GHG emission projections in presence of random scenarios for economic activity and energy prices. It is possible to calibrate some quadratic functions that take a fraction of a second to compute and can approximate sufficiently accurate results from ENERGY 2020. The method is described in Laferrière and Wang (2024) .
Future research on the uncertainty of projected GHG emissions will seek to apply the same method to determine uncertainty of the WAM scenario. It could also explore uncertainty of projected emissions from individual economic sectors and consider uncertainty associated with historical estimates.
Other sources of uncertainty, beyond those discussed in this section, influence the projections. This includes decision-making of agents under given assumptions and the pace of clean technology development and adoption. For instance, consumer adoption of emerging technologies in the future may diverge from model projections. This is due to the influence of behavioural decision-making processes that are not captured in the model. For example, the diffusion of electric vehicles (EVs) depends not only on relative vehicle prices, but also on consumer awareness of EVs and the availability of recharging infrastructure. Both will evolve over time and are therefore hard to predict when looking at historical behaviour. This source of projection uncertainty is present across all economic sectors with the rapid emergence of new and cleaner technologies.
Some sources of uncertainty are also specific to sectors, several of which are listed below. These could be explored quantitatively through uncertainty analysis in the future.
- Oil and Gas:
- Canadian oil and gas production projections vary significantly depending on world price assumptions
- Global prices are determined by supply and demand for oil
- Supply and demand are driven by economic growth, technological developments, and geopolitics, and is set in international markets
- Electricity:
- There is uncertainty for both the supply and demand sides of the Electricity sector
- Other than economic and population growth, electricity demand changes from the electrification of vehicles or industrial processes and behavioural change, influence the demand side
- On the supply side, emissions depend on the changes in the composition of the power plant fleet
- Assumptions on future capital costs of new power plants, availability of emerging technologies (such as intermittent renewables and energy storage), and cooperation for the construction of new interprovincial transmission lines are key sources of uncertainty
- Transportation:
- Over the short term, vehicle kilometres travelled is the key driver of emissions
- This is influenced by assumptions on population, fuel prices, and optimization of freight trucks (increased tonnage per kilometre) and freight transportation volume resulting from changes in economic activity
- Over the medium to long term, changing characteristics of the fleet will be influenced by government policies, different types of vehicle's respective production costs, technological development, and consumer choices
- Heavy Industry:
- Emissions are primarily driven by expected economic growth in each subsector
- Future technological developments that would affect the costs of electrification and CCS technologies, the use of clean fuels such as hydrogen, novel methods of reducing non-combustion emissions, and other energy-efficiency improvements, would impact emissions
- Buildings:
- Emission projections in this sector are affected by consumer response to emerging technologies and government policies
- Future relative fuel prices and technology costs will also have an impact
- Agriculture:
- Emissions from agriculture production are affected by production costs
- Examples include fertilizer prices and international prices of agricultural commodities that affect crop composition and livestock size
3 Air pollutant emissions projections
3.1 Overview
Air pollutant emissions projections through 2035 are available by pollutant and economic sector under the WM and WAM scenarios. These projections are based on historical data from 1990 to 2023. Historical data are reported in Canada's Air Pollutant Emissions Inventory Report 2025 (APEI2025) and Canada's Black Carbon Inventory Report 2025.
Canada’s reporting is guided by its commitments (both legally- and non-legally-binding) under international agreements and national environmental policies, as outlined in Section 1.3.2.
The projections indicate that Canada is projected to remain on track to meet its international air pollutant emission reduction commitments under both scenarios. This underscores the country’s leadership in environmental stewardship and cross-border collaboration.
Trends for ten key pollutants and their respective reduction targets are presented in Figure 28 to Figure 40. Table 23 summarizes historical and projected emissions by pollutant. Open data Tables A37 through A46 provide detailed national emissions data by economic sector and pollutant.
| Pollutant | 1990 | 2005 | 2023 | 2026a | 2030a | 2035a | 2026b | 2030b | 2035b |
|---|---|---|---|---|---|---|---|---|---|
| Nitrogen Oxides | 2 236 | 2 259 | 1 228 | 1 006 | 963 | 950 | 1 004 | 960 | 944 |
| Sulphur Oxides | 3 010 | 2 095 | 608 | 544 | 443 | 458 | 542 | 442 | 451 |
| Volatile Organic Compounds | 2 200 | 2 256 | 1 368 | 1 174 | 1 184 | 1 202 | 1 174 | 989 | 1 000 |
| Total Particulate Matter* (excl. Open Sources†) | 1 080 | 633 | 528 | 500 | 497 | 507 | 499 | 494 | 499 |
| Total Particulate Matter* (incl. Open Sources†) | 19 976 | 21 161 | 26 804 | 28 550 | 31 508 | 33 946 | 28 575 | 31 455 | 33 961 |
| PM10** (excl. Open Sources†) | 640 | 386 | 278 | 262 | 258 | 260 | 262 | 256 | 254 |
| PM10** (incl. Open Sources†) | 6 528 | 6 809 | 8 172 | 8 650 | 9 477 | 10 158 | 8 656 | 9 461 | 10 159 |
| PM2.5*** (excl. Open Sources†) | 458 | 271 | 160 | 149 | 144 | 142 | 149 | 142 | 136 |
| PM2.5*** (incl. Open Sources†) | 1 609 | 1 364 | 1 370 | 1 415 | 1 515 | 1 597 | 1 416 | 1 510 | 1 592 |
| Carbon Monoxide | 13 082 | 9 006 | 4 518 | 4 320 | 4 276 | 4 202 | 4 322 | 4 264 | 4 112 |
| Mercury (Kilograms) | 33 541 | 7 947 | 3 131 | 2 713 | 2 482 | 2 531 | 2 707 | 2 470 | 2 507 |
| Ammonia | 395 | 490 | 495 | 490 | 520 | 550 | 490 | 520 | 551 |
| Black Carbon | NA | NA | 21.6 | 19.8 | 18.4 | 17.9 | 19.7 | 18.3 | 17.4 |
Note: Historical data up to 2023 are sourced from APEI2025 and Canada's Black Carbon Inventory Report 2025. Data from 2024 to 2035 are modelled projections developed using ECCC’s analytical framework. Other sources include emissions from domestic and international air transportation at cruise speed, and international marine emissions. Access more data on the open data portal. Following international reporting standards, emissions from international aviation at cruise altitude and international marine navigation are excluded from national totals.
a Projections under the WM scenario.
b Projections under the WAM scenario.
† Open sources refer to emissions from construction activities (excluding off-road construction equipment), agricultural crop production, and road dust.
* TPM refers to the entire range of airborne particles, encompassing particles of various sizes, including PM10 and PM2.5. The sum of PM10 and PM2.5 does not equal TPM estimates because PM10 is a subset of TPM, and PM2.5 is a subset of PM10.
** PM10 refers to particles with a diameter of 10 microns or less which are small enough to enter the respiratory system when inhaled.
*** PM2.5 is defined as particles with a diameter of 2.5 microns or less. PM2.5 particles pose significant health risks because they can penetrate deeply into the respiratory system and bloodstream.
3.2 Nitrogen oxides (NOx)
The main sources of nitrogen oxides (NOₓ) emissions include diesel use in transportation, natural gas production and processing, oil sands operations, mining, and coal-fired electricity generation.
NOₓ emissions have steadily declined since 2005, and this trend is expected to continue. Between 2023 and 2030, reductions are largely driven by the phase out of coal for power generation and the implementation of the Multi-Sector Air Pollutants Regulations (MSAPR), which targets emissions from industrial facilities in the Heavy Industry and Oil and Gas sectors. After 2030, further reductions are anticipated due to broader efforts to reduce fossil fuel use across the Transportation, Buildings, and Oil and Gas sectors.
Under the WAM scenario, even greater reductions are projected. From 2023 to 2030, these are mainly due to declining fossil fuel use in various industrial activities and buildings. Beyond 2030, continued progress is expected from improved vehicle efficiency, increased electrification in transportation and buildings.
These measures are expected to keep Canada’s NOₓ emissions well below its Gothenburg Protocol commitment throughout the projection period. The reduction required under this commitment is a 35% reduction from 2005 levels, which equates to a national level of emissions of 1,468 kt, to be met by 2020 and maintained. Notably, the emissions level associated with meeting the percentage reduction commitment is subject to change when inventory adjustments are made periodically. It is therefore the percentage reduction that is the commitment, not the number itself expressed in absolute terms.
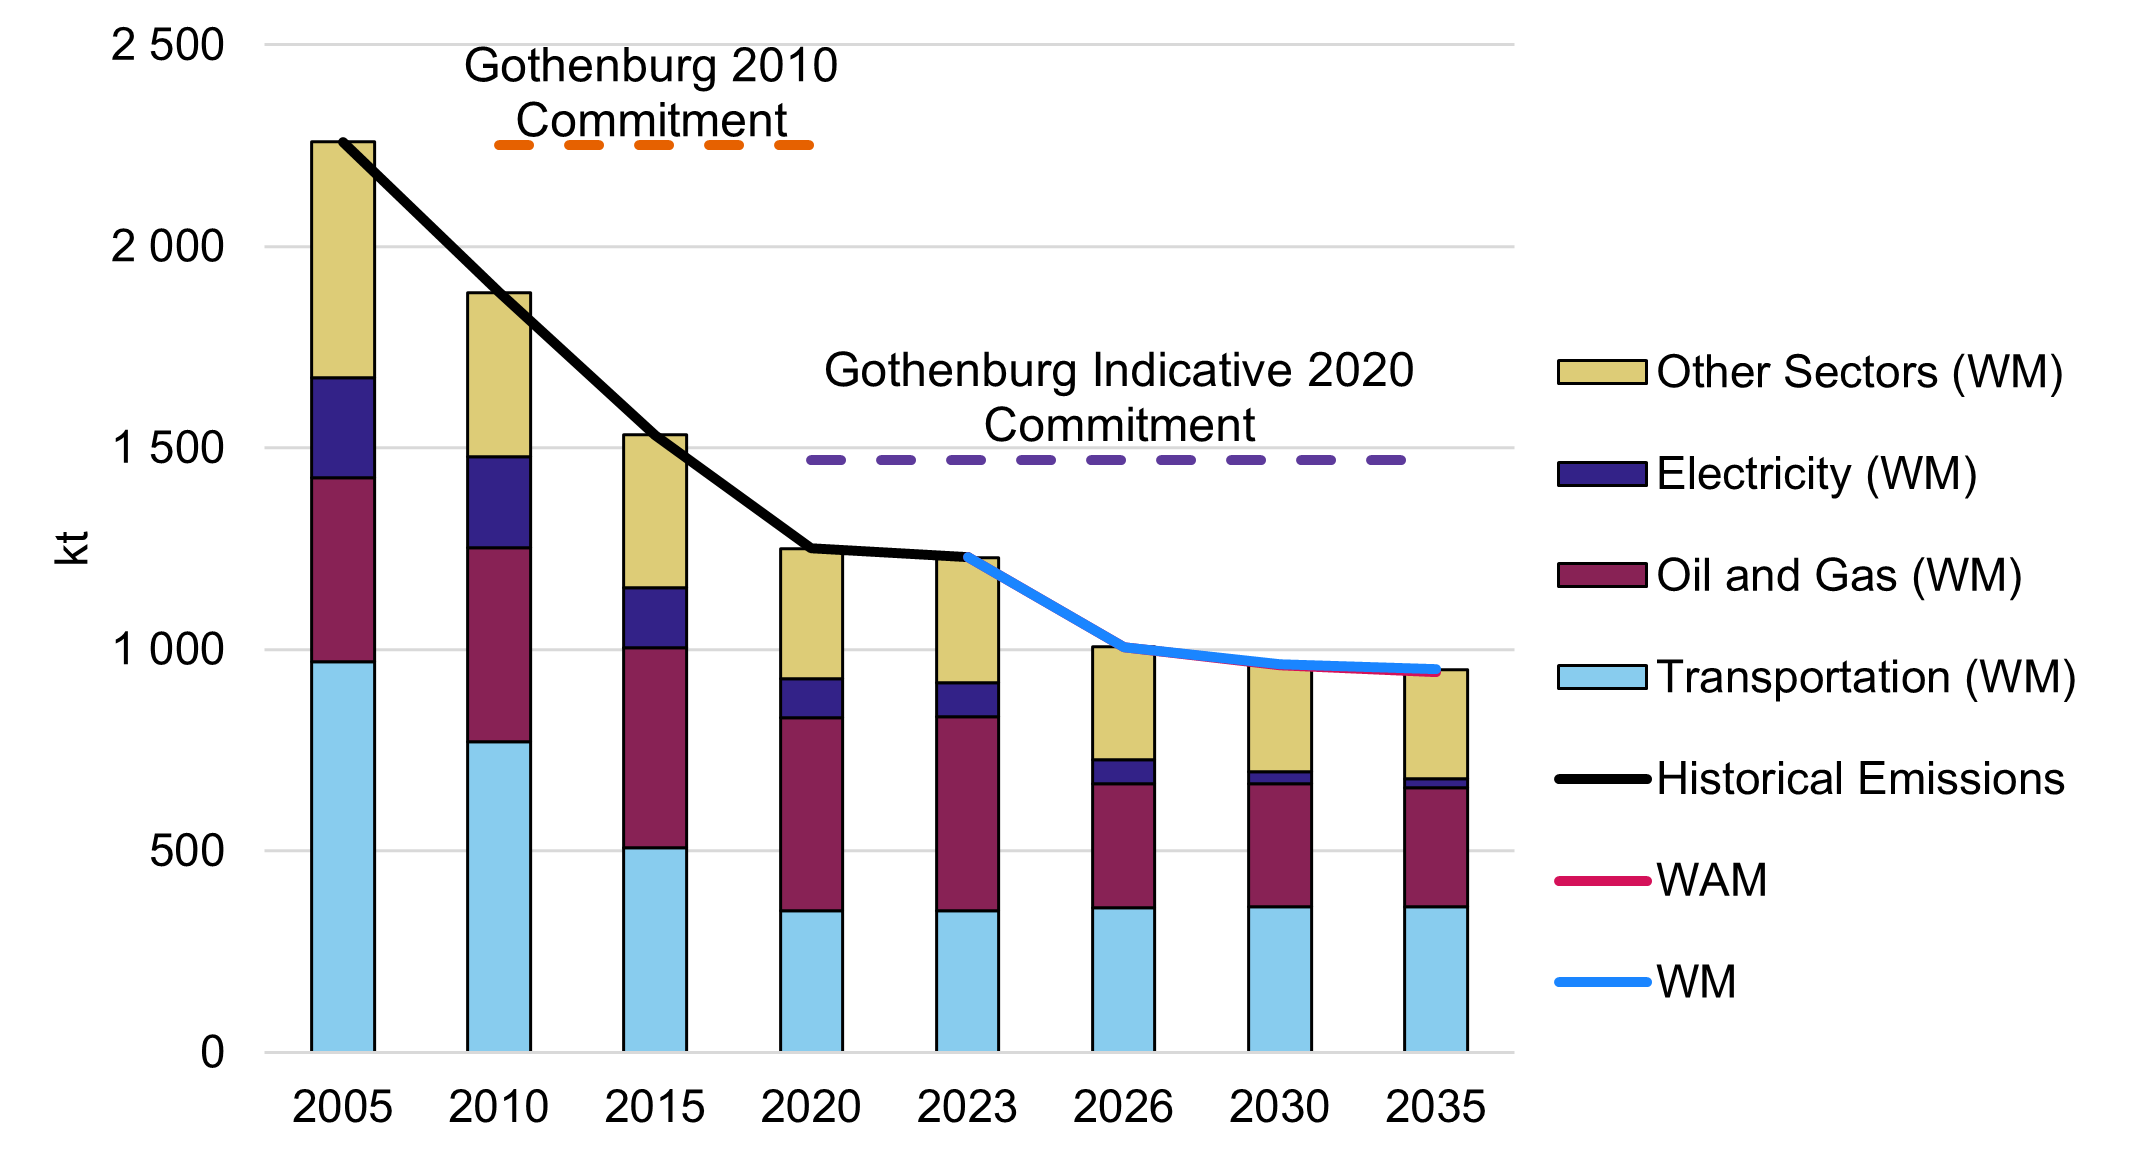
Note: Historical emissions data come from APEI2025. Access more data on the open data portal.
Long description
| Year | Transportation (WM) | Oil and Gas (WM) | Electricity (WM) | Other Sectors (WM) | Historical Emissions | WM | WAM | Gothenburg 2010 Commitment | Gothenburg Indicative 2020 Commitment |
|---|---|---|---|---|---|---|---|---|---|
| 2005 | 970 | 455 | 249 | 585 | 2 259 | - | - | - | - |
| 2010 | 770 | 482 | 227 | 407 | 1 885 | - | - | 2 250 | - |
| 2015 | 507 | 498 | 147 | 380 | 1 532 | - | - | 2 250 | - |
| 2020 | 352 | 478 | 96 | 324 | 1 251 | - | - | 2 250 | 1 468 |
| 2023 | 352 | 481 | 84 | 311 | 1 228 | 1 228 | 1 228 | - | 1 468 |
| 2026 | 359 | 308 | 59 | 280 | - | 1 006 | 1 004 | - | 1 468 |
| 2030 | 362 | 305 | 28 | 269 | - | 963 | 960 | - | 1 468 |
| 2035 | 360 | 296 | 23 | 271 | - | 950 | 944 | - | 1 468 |
3.3 Sulphur oxides (SOx)
The main sources of sulphur oxides (SOₓ) emissions are the metallurgical industry, coal-fired power generation, natural gas processing, and oil sands operations.
SOₓ emissions have declined significantly in recent years and are expected to continue decreasing through 2030. This trend is driven by the phase out of coal in electricity generation, the use of low-sulphur fuels, and the enforcement of SOₓ emission standards across various industries. However, a slight increase in SOx emissions is projected after 2030. This is due to the sunsetting of some reduction measures and anticipated growth in economic activity in the Heavy Industry and Oil and Gas sectors.
Under the WAM scenario, further reductions are expected both before and after 2030. These are mainly driven by reduced fossil fuel use in Heavy Industry and Oil and Gas operations.
Canada’s SOₓ emissions are projected to remain below the Gothenburg Protocol commitment throughout the projection period in both scenarios. The commitment required is a 55% reduction from 2005 levels, which equates to a national level of emissions of 943 kt to be met by 2020 and maintained. Notably, the emissions level associated with meeting the percentage reduction commitment is subject to change when inventory adjustments are made periodically. It is therefore the percentage reduction that is the commitment, not the number itself expressed in absolute terms.
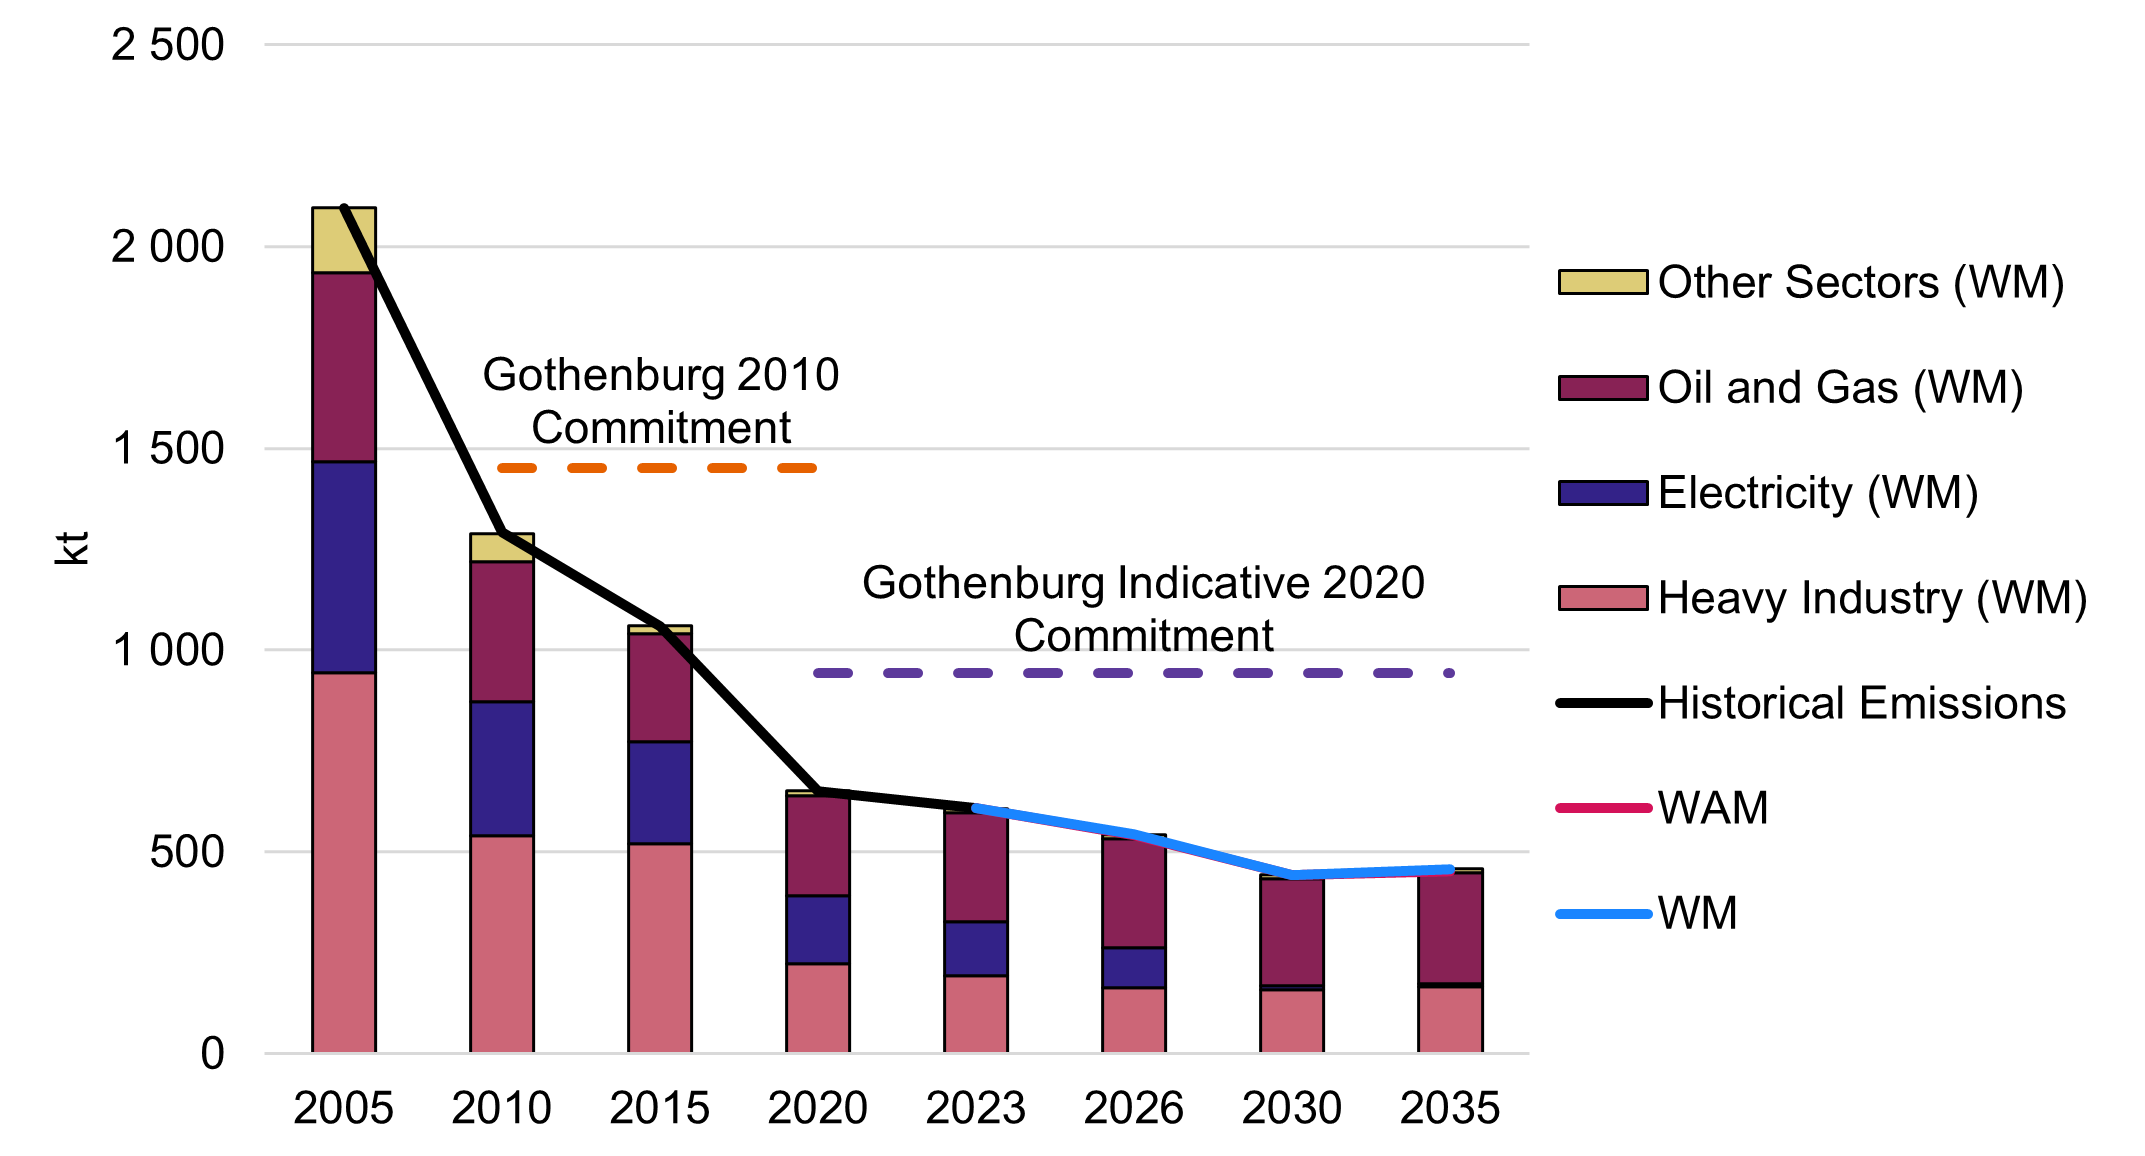
Note: Historical emissions data come from APEI2025. Access more data on the open data portal.
Long description
| Year | Heavy Industry (WM) | Electricity (WM) | Oil and Gas (WM) | Other Sectors (WM) | Historical Emissions | WM | WAM | Gothenburg 2010 Commitment | Gothenburg Indicative 2020 Commitment |
|---|---|---|---|---|---|---|---|---|---|
| 2005 | 944 | 522 | 470 | 160 | 2095 | - | - | - | - |
| 2010 | 540 | 333 | 346 | 70 | 1291 | - | - | 1450 | - |
| 2015 | 521 | 251 | 268 | 21 | 1060 | - | - | 1450 | - |
| 2020 | 223 | 168 | 249 | 11 | 650 | - | - | 1450 | 943 |
| 2023 | 193 | 134 | 270 | 11 | 608 | 608 | 608 | - | 943 |
| 2026 | 162 | 100 | 271 | 10 | - | 544 | 542 | - | 943 |
| 2030 | 159 | 9 | 265 | 10 | - | 443 | 442 | - | 943 |
| 2035 | 165 | 8 | 276 | 10 | - | 458 | 451 | - | 943 |
3.4 Volatile organic compounds (VOCs)
The main sources of VOC emissions in Canada include fugitive emissions from the Oil and Gas sector, light manufacturing, combustion of diesel and gasoline in transportation, and biomass burning for space heating. Additionally, everyday consumer products used in homes and businesses contribute to VOC emissions in the Buildings sector.
VOC emissions have been steadily declining and are expected to continue decreasing through 2030. This trend is driven by regulations targeting methane and VOCs in the Oil and Gas sector, limits on VOC concentrations in certain consumer products, reduced demand for gasoline and diesel in Transportation, and decreased biomass use in residential heating. After 2030, however, VOC emissions are projected to increase slightly in the WM scenario due to increased economic activity in Heavy Industry and light manufacturing.
Under the WAM scenario, even greater reductions are expected to occur after the early projection years. These improvements are driven by reduced fossil fuel use in Heavy Industry and Oil and Gas sectors, combined with the Enhanced Oil and Gas Methane Regulations that also target VOC co-emissions. VOC emissions in Canada are expected to remain below the Gothenburg Protocol commitment throughout the projection period in both scenarios. The commitment is a 20% reduction from 2005 levels, which equates to a national level of emissions of 1,805 kt, to be met by 2020 and maintained. Notably, the emissions level associated with meeting the percentage reduction commitment is subject to change when inventory adjustments are made periodically. It is therefore the percentage reduction that is the commitment, not the number itself expressed in absolute terms.
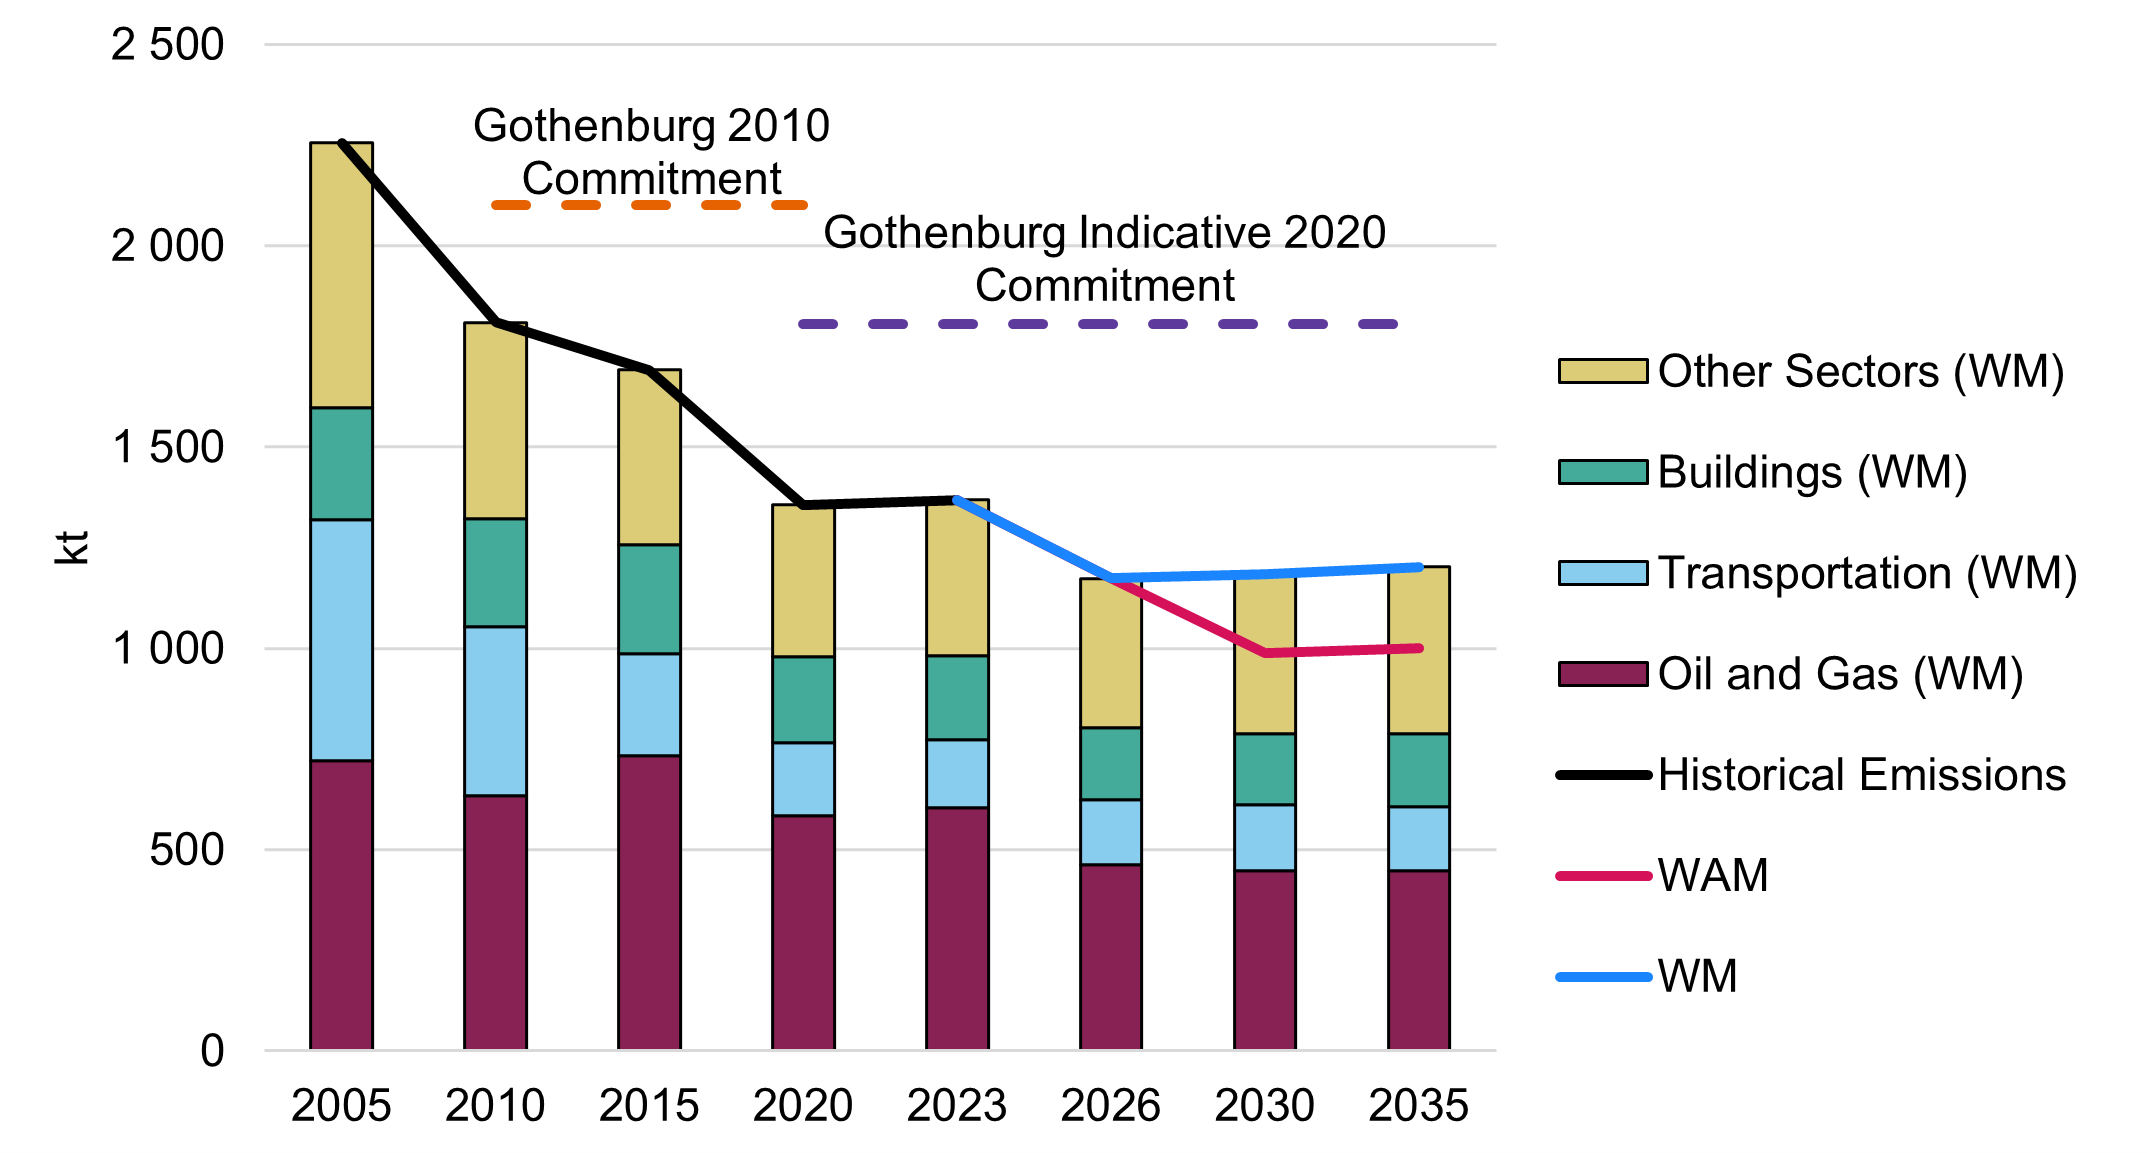
Note: Historical emissions data come from APEI2025. Access more data on the open data portal.
Long description
| Year | Oil and Gas (WM) | Transportation (WM) | Buildings (WM) | Other Sectors (WM) | Historical Emissions | WM | WAM | Gothenburg 2010 Commitment | Gothenburg Indicative 2020 Commitment |
|---|---|---|---|---|---|---|---|---|---|
| 2005 | 721 | 598 | 279 | 658 | 2 256 | - | - | - | - |
| 2010 | 635 | 419 | 268 | 486 | 1 809 | - | - | 2 100 | - |
| 2015 | 733 | 255 | 270 | 434 | 1 691 | - | - | 2 100 | - |
| 2020 | 584 | 181 | 215 | 376 | 1 355 | - | - | 2 100 | 1 805 |
| 2023 | 604 | 169 | 208 | 388 | 1 368 | 1 368 | 1 368 | - | 1 805 |
| 2026 | 462 | 162 | 179 | 370 | - | 1 174 | 1 174 | - | 1 805 |
| 2030 | 449 | 162 | 178 | 394 | - | 1 184 | 989 | - | 1 805 |
| 2035 | 448 | 159 | 181 | 414 | - | 1 202 | 1 000 | - | 1 805 |
3.5 Particulate matter (PM)
Most PM emissions in Canada, including total PM (TPM), PM10, and PM2.5, come from open sources such as construction operations (excluding off-road equipment), crop production, and road dust. These sources account for approximately 98% of total PM emissions. Among these, PM2.5 is the smallest and most harmful to human health, as its fine particle size allows it to penetrate deep into the respiratory system and enter the bloodstream.
Other notable contributors include coal-fired power generation, residential wood heating, non-ferrous metal production, and iron ore pelletizing. In terms of PM2.5 specifically, commercial/residential/institutional sources accounted for 5.2% of total PM2.5 emissions in 2023, with the primary contributor being home firewood burning. While measures that target industrial (non-open-source) PM emissions have been established, overall PM levels are projected to rise. This increase is mainly due to growing emissions from open sources, driven by expected growth in transportation, construction, and agricultural activities.
Under the WAM scenario, PM emissions are projected to be slightly higher than in the WM scenario. This is largely due to increased freight traffic, which contributes to greater road dust emissions.
Despite this, non-open-source PM2.5 emissions are expected to remain below Canada’s Gothenburg Protocol commitment throughout the projection period in both the WM and WAM scenarios (Figure 36). The commitment is a 25% reduction from 2005 levels, which approximately equates to a national level of emissions of 203 kt, to be met by 2020 and maintained. Notably, the emissions level associated with meeting the percentage reduction commitment is subject to change when inventory adjustments are made periodically. It is therefore the percentage reduction that is the commitment, not the number itself expressed in absolute terms.
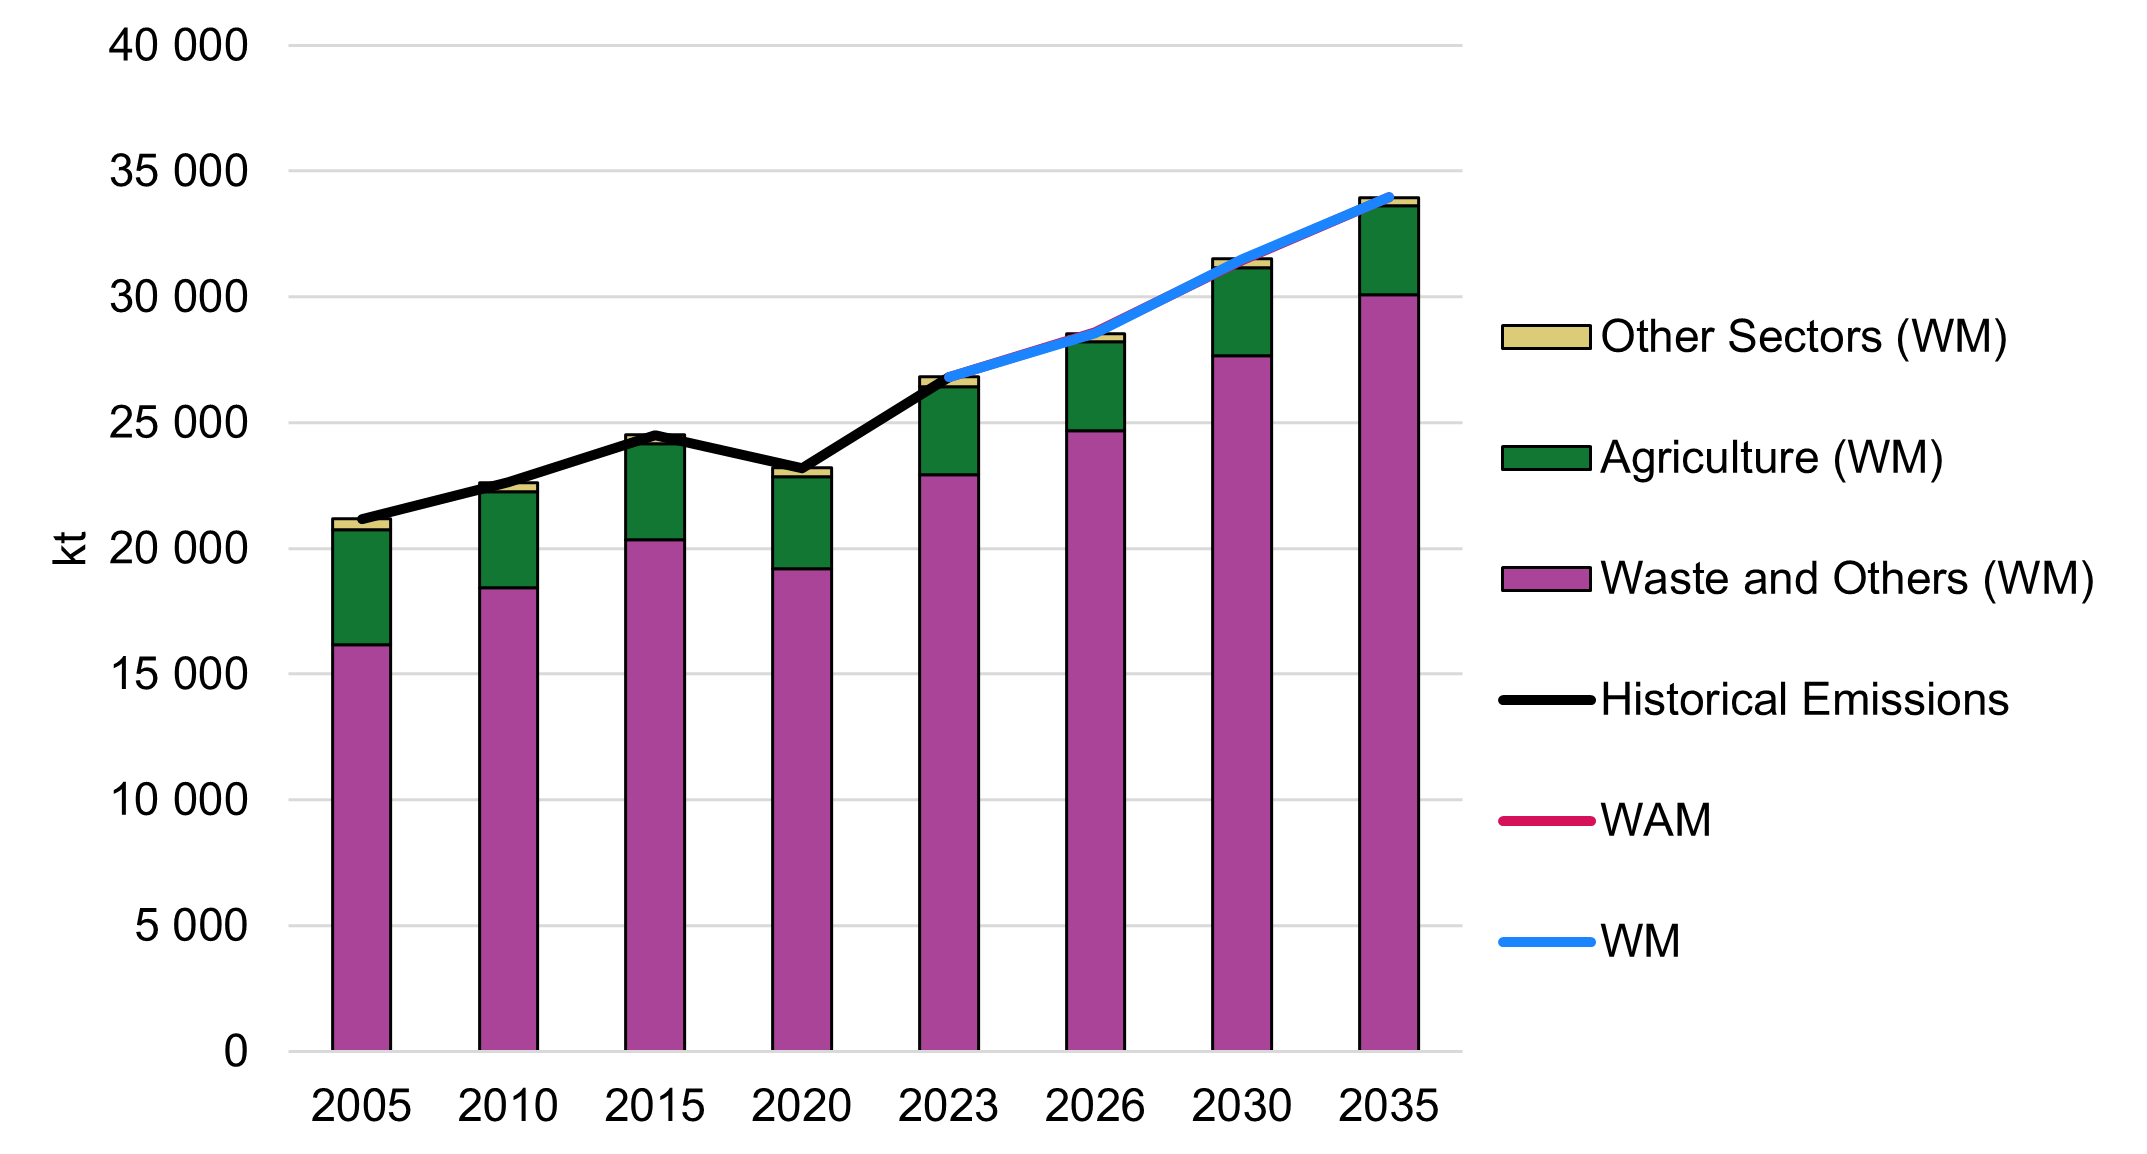
Note: Historical emissions data come from APEI2025. Access more data on the open data portal.
Long description
| Year | Waste and Others (WM) | Agriculture (WM) | Other Sectors (WM) | Historical Emissions | WM | WAM |
|---|---|---|---|---|---|---|
| 2005 | 16 180 | 4 539 | 441 | 21 161 | - | - |
| 2010 | 18 451 | 3 806 | 362 | 22 618 | - | - |
| 2015 | 20 358 | 3 792 | 364 | 24 514 | - | - |
| 2020 | 19 201 | 3 656 | 334 | 23 190 | - | - |
| 2023 | 22 923 | 3 520 | 361 | 26 804 | 26 804 | 26 804 |
| 2026 | 24 685 | 3 519 | 346 | - | 28 550 | 28 575 |
| 2030 | 27 653 | 3 518 | 337 | - | 31 508 | 31 455 |
| 2035 | 30 090 | 3 516 | 340 | - | 33 946 | 33 961 |
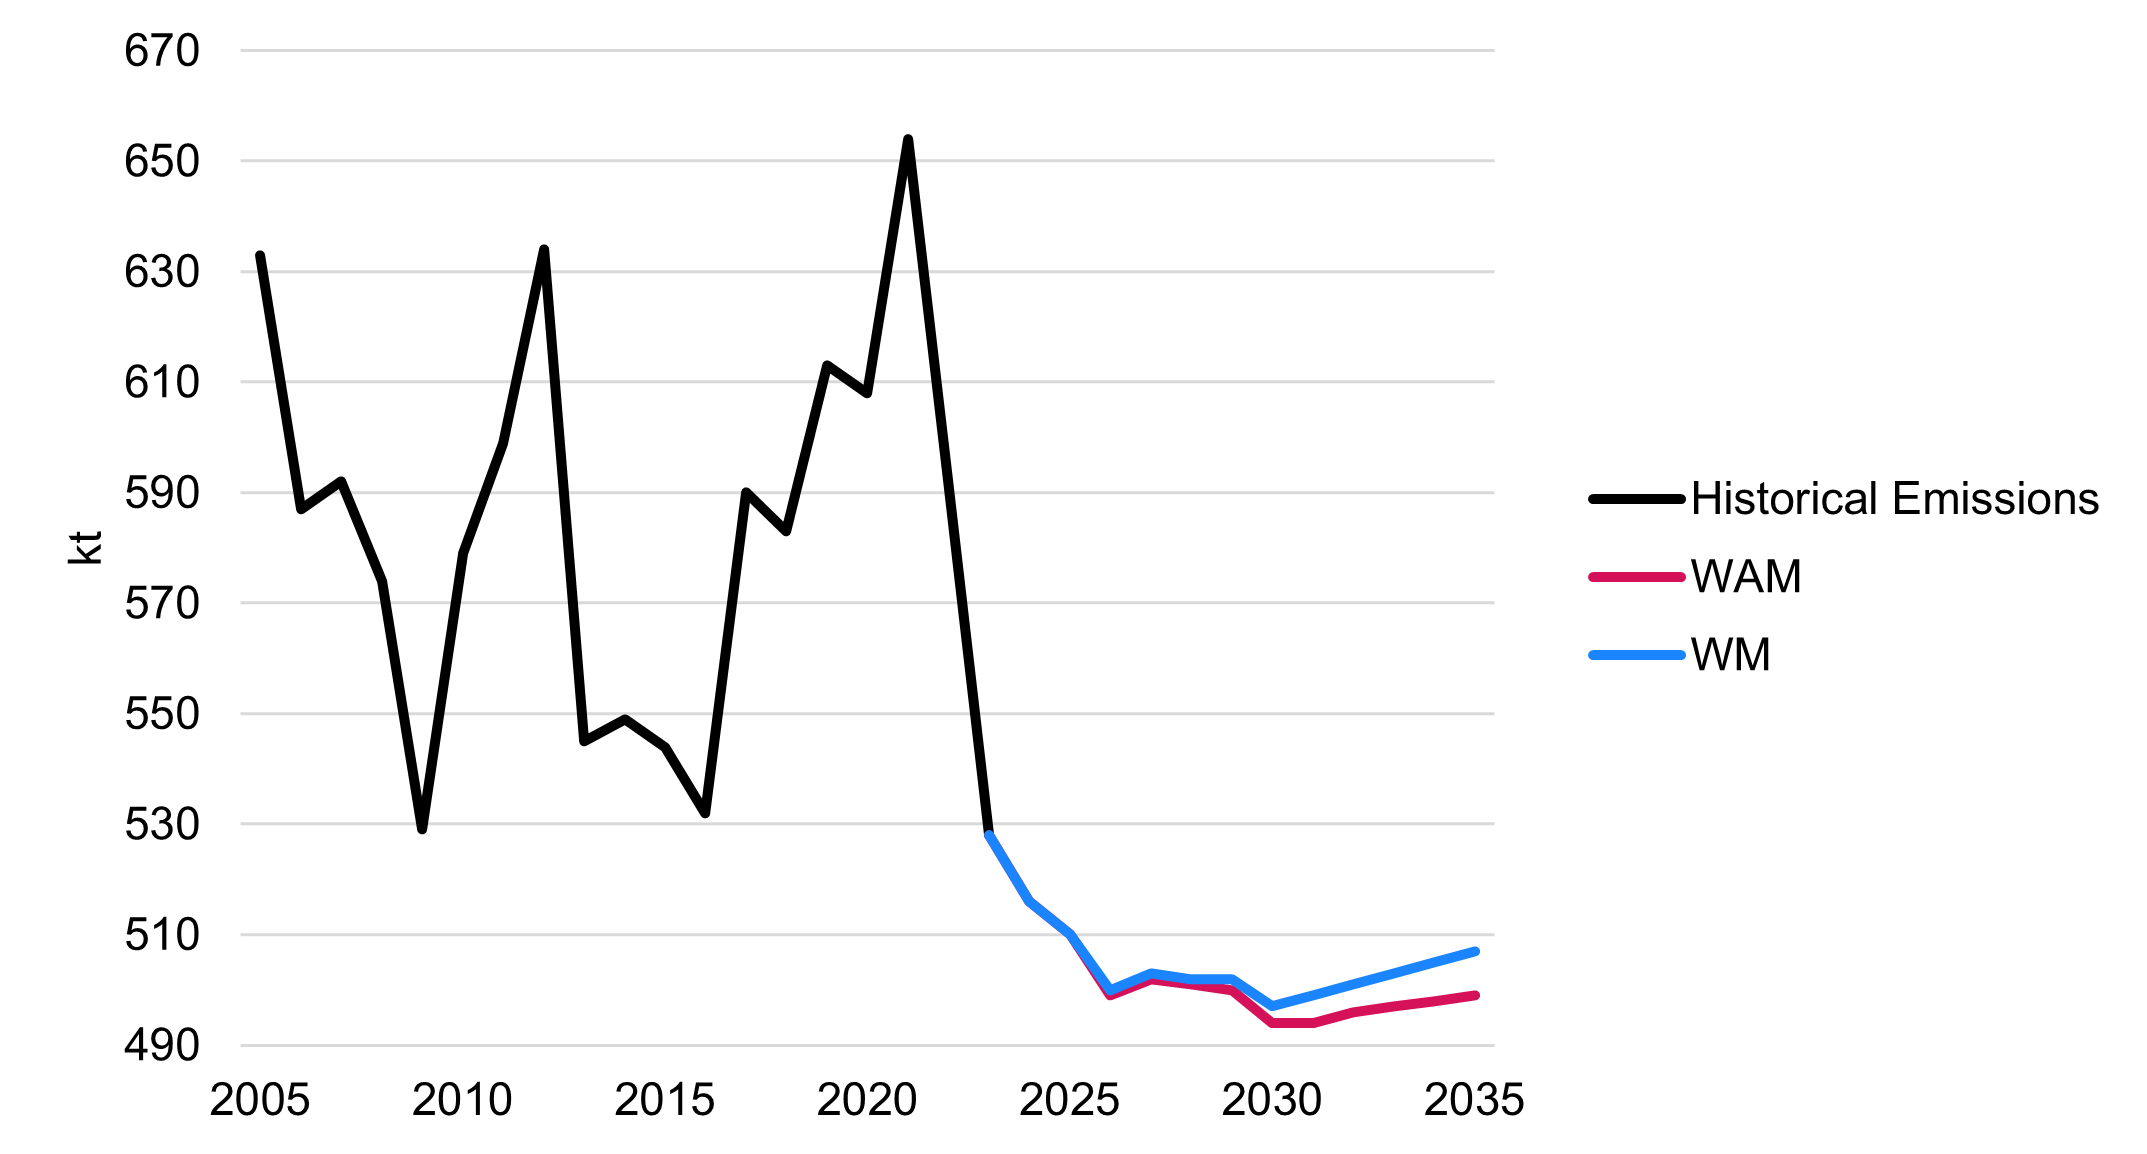
Note: Historical emissions data come from APEI2025. Access more data on the open data portal.
Long description
| Year | Historical Emissions | WM | WAM |
|---|---|---|---|
| 2005 | 633 | - | - |
| 2006 | 587 | - | - |
| 2007 | 592 | - | - |
| 2008 | 574 | - | - |
| 2009 | 529 | - | - |
| 2010 | 579 | - | - |
| 2011 | 599 | - | - |
| 2012 | 634 | - | - |
| 2013 | 545 | - | - |
| 2014 | 549 | - | - |
| 2015 | 544 | - | - |
| 2016 | 532 | - | - |
| 2017 | 590 | - | - |
| 2018 | 583 | - | - |
| 2019 | 613 | - | - |
| 2020 | 608 | - | - |
| 2021 | 654 | - | - |
| 2022 | 592 | - | - |
| 2023 | 528 | 528 | 528 |
| 2024 | - | 516 | 516 |
| 2025 | - | 510 | 510 |
| 2026 | - | 500 | 499 |
| 2027 | - | 503 | 502 |
| 2028 | - | 502 | 501 |
| 2029 | - | 502 | 500 |
| 2030 | - | 497 | 494 |
| 2031 | - | 499 | 494 |
| 2032 | - | 501 | 496 |
| 2033 | - | 503 | 497 |
| 2034 | - | 505 | 498 |
| 2035 | - | 507 | 499 |
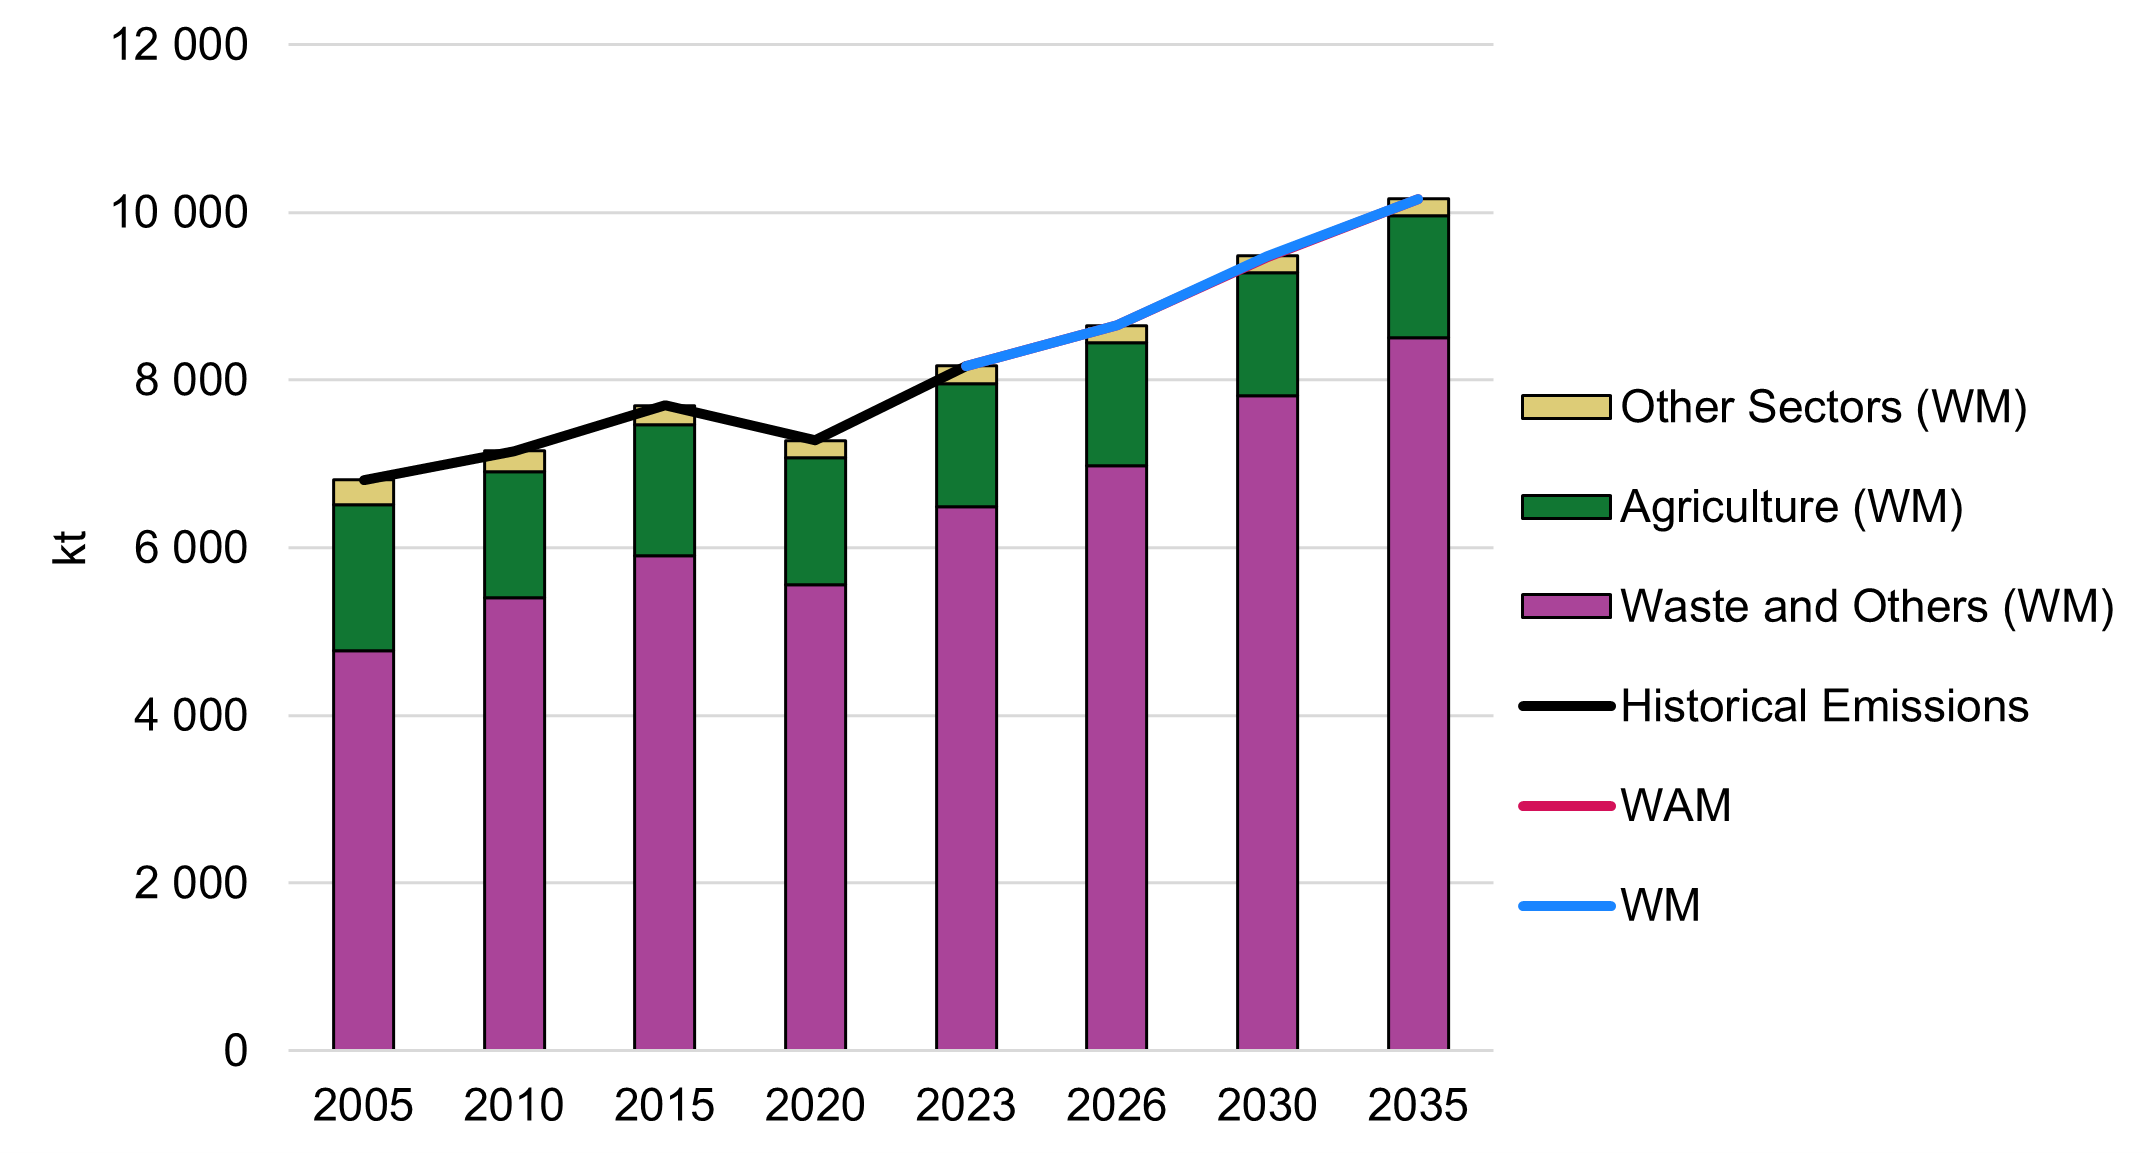
Note: Historical emissions data come from APEI2025. Access more data on the open data portal.
Long description
| Year | Waste and Others (WM) | Agriculture (WM) | Other Sectors (WM) | Historical Emissions | WM | WAM |
|---|---|---|---|---|---|---|
| 2005 | 4 776 | 1 739 | 293 | 6 809 | - | - |
| 2010 | 5 398 | 1 513 | 243 | 7 154 | - | - |
| 2015 | 5 907 | 1 557 | 235 | 7 699 | - | - |
| 2020 | 5 556 | 1 517 | 208 | 7 279 | - | - |
| 2023 | 6 493 | 1 467 | 212 | 8 172 | 8 172 | 8 172 |
| 2026 | 6 982 | 1 466 | 201 | - | 8 650 | 8 656 |
| 2030 | 7 816 | 1 466 | 195 | - | 9 477 | 9 461 |
| 2035 | 8 499 | 1 465 | 194 | - | 10 158 | 10 159 |
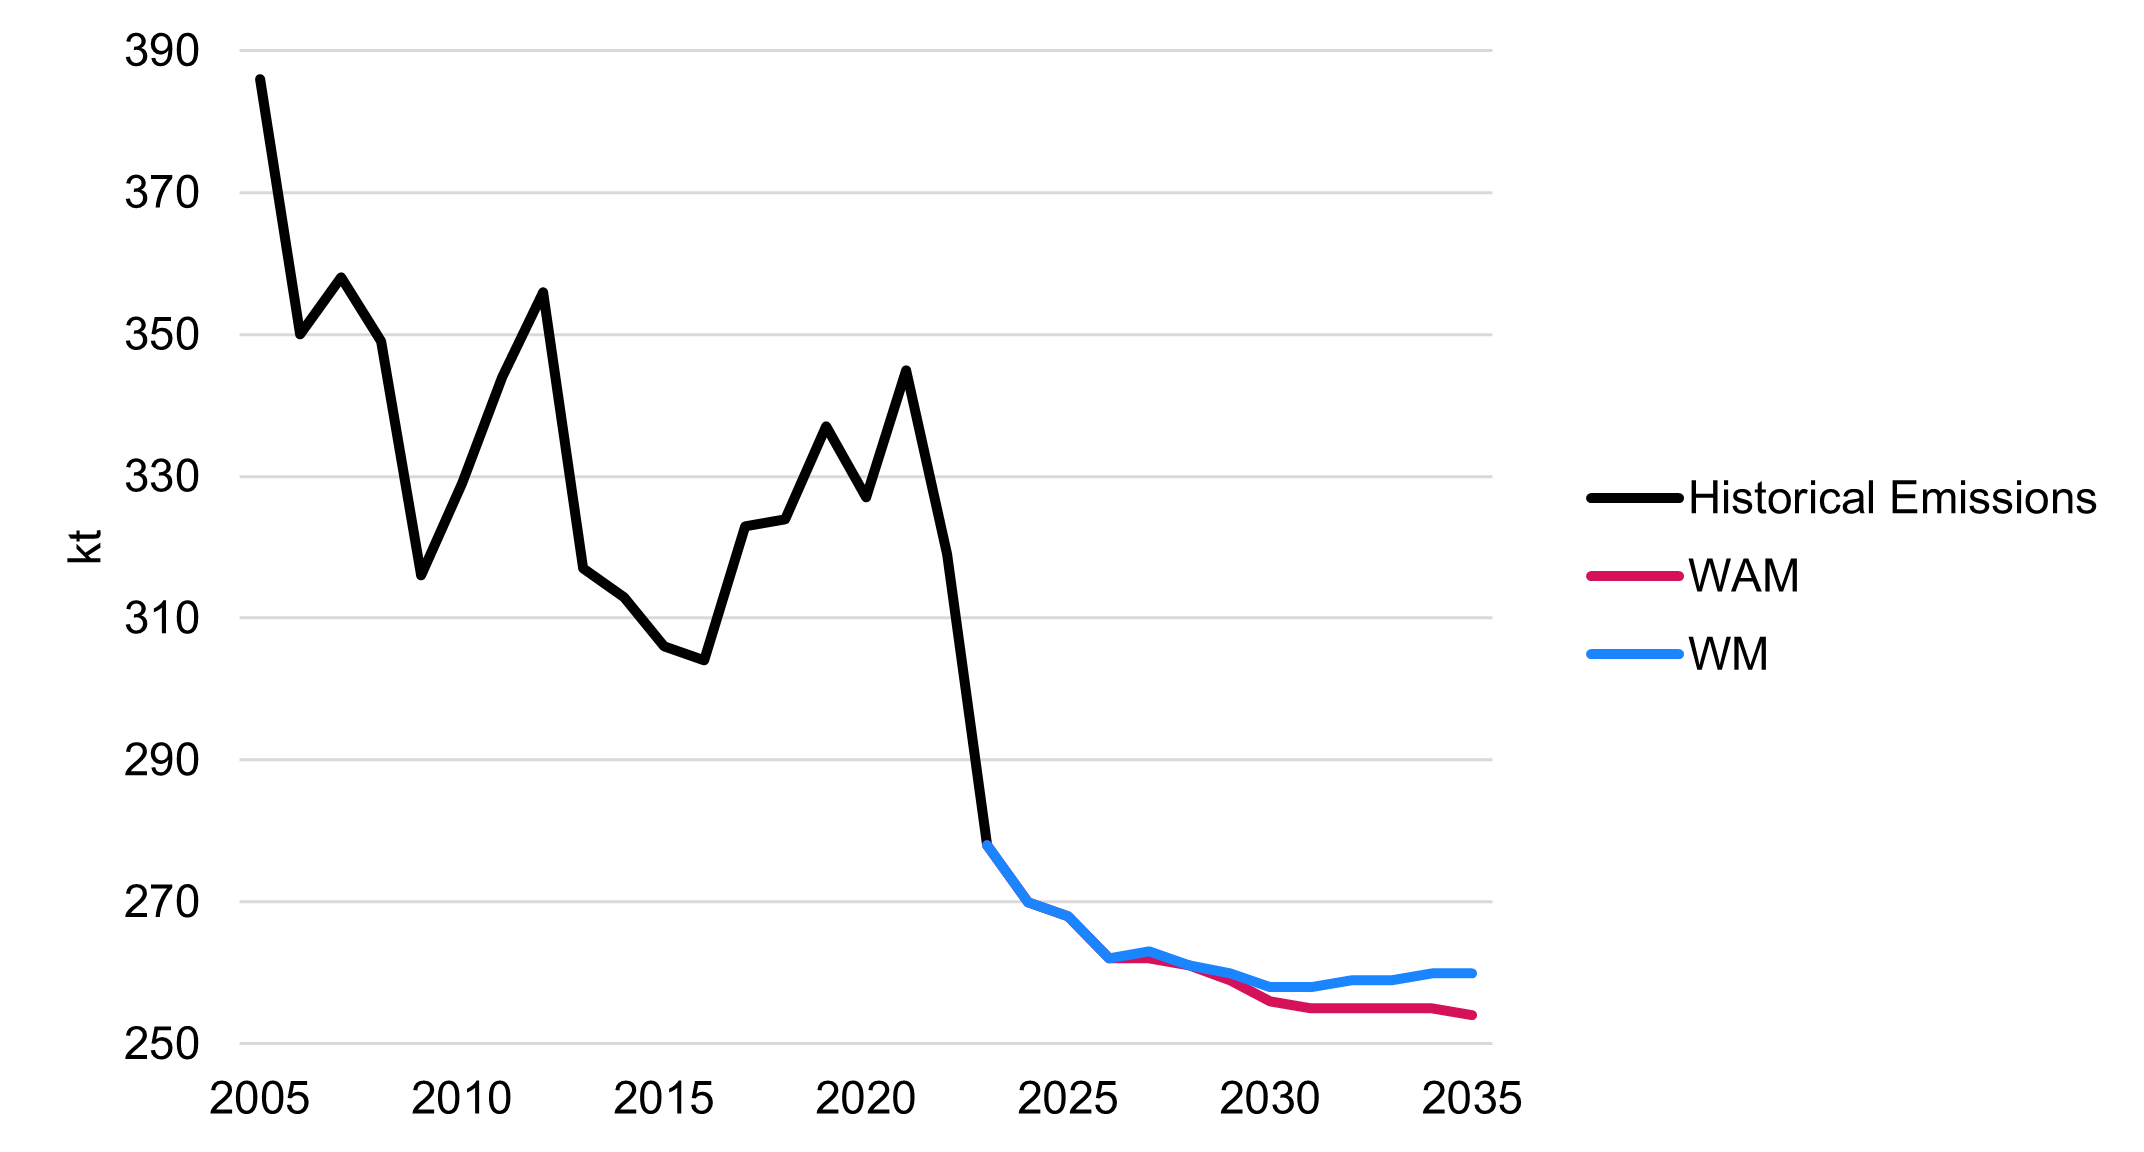
Note: Historical emissions data come from APEI2025. Access more data on the open data portal.
Long description
| Year | Historical | Emissions | WM | WAM |
|---|---|---|---|---|
| 2005 | 386 | - | - | |
| 2006 | 350 | - | - | |
| 2007 | 358 | - | - | |
| 2008 | 349 | - | - | |
| 2009 | 316 | - | - | |
| 2010 | 329 | - | - | |
| 2011 | 344 | - | - | |
| 2012 | 356 | - | - | |
| 2013 | 317 | - | - | |
| 2014 | 313 | - | - | |
| 2015 | 306 | - | - | |
| 2016 | 304 | - | - | |
| 2017 | 323 | - | - | |
| 2018 | 324 | - | - | |
| 2019 | 337 | - | - | |
| 2020 | 327 | - | - | |
| 2021 | 345 | - | - | |
| 2022 | 319 | - | - | |
| 2023 | 278 | 278 | 278 | |
| 2024 | - | 270 | 270 | |
| 2025 | - | 268 | 268 | |
| 2026 | - | 262 | 262 | |
| 2027 | - | 263 | 262 | |
| 2028 | - | 261 | 261 | |
| 2029 | - | 260 | 259 | |
| 2030 | - | 258 | 256 | |
| 2031 | - | 258 | 255 | |
| 2032 | - | 259 | 255 | |
| 2033 | - | 259 | 255 | |
| 2034 | - | 260 | 255 | |
| 2035 | - | 260 | 254 |
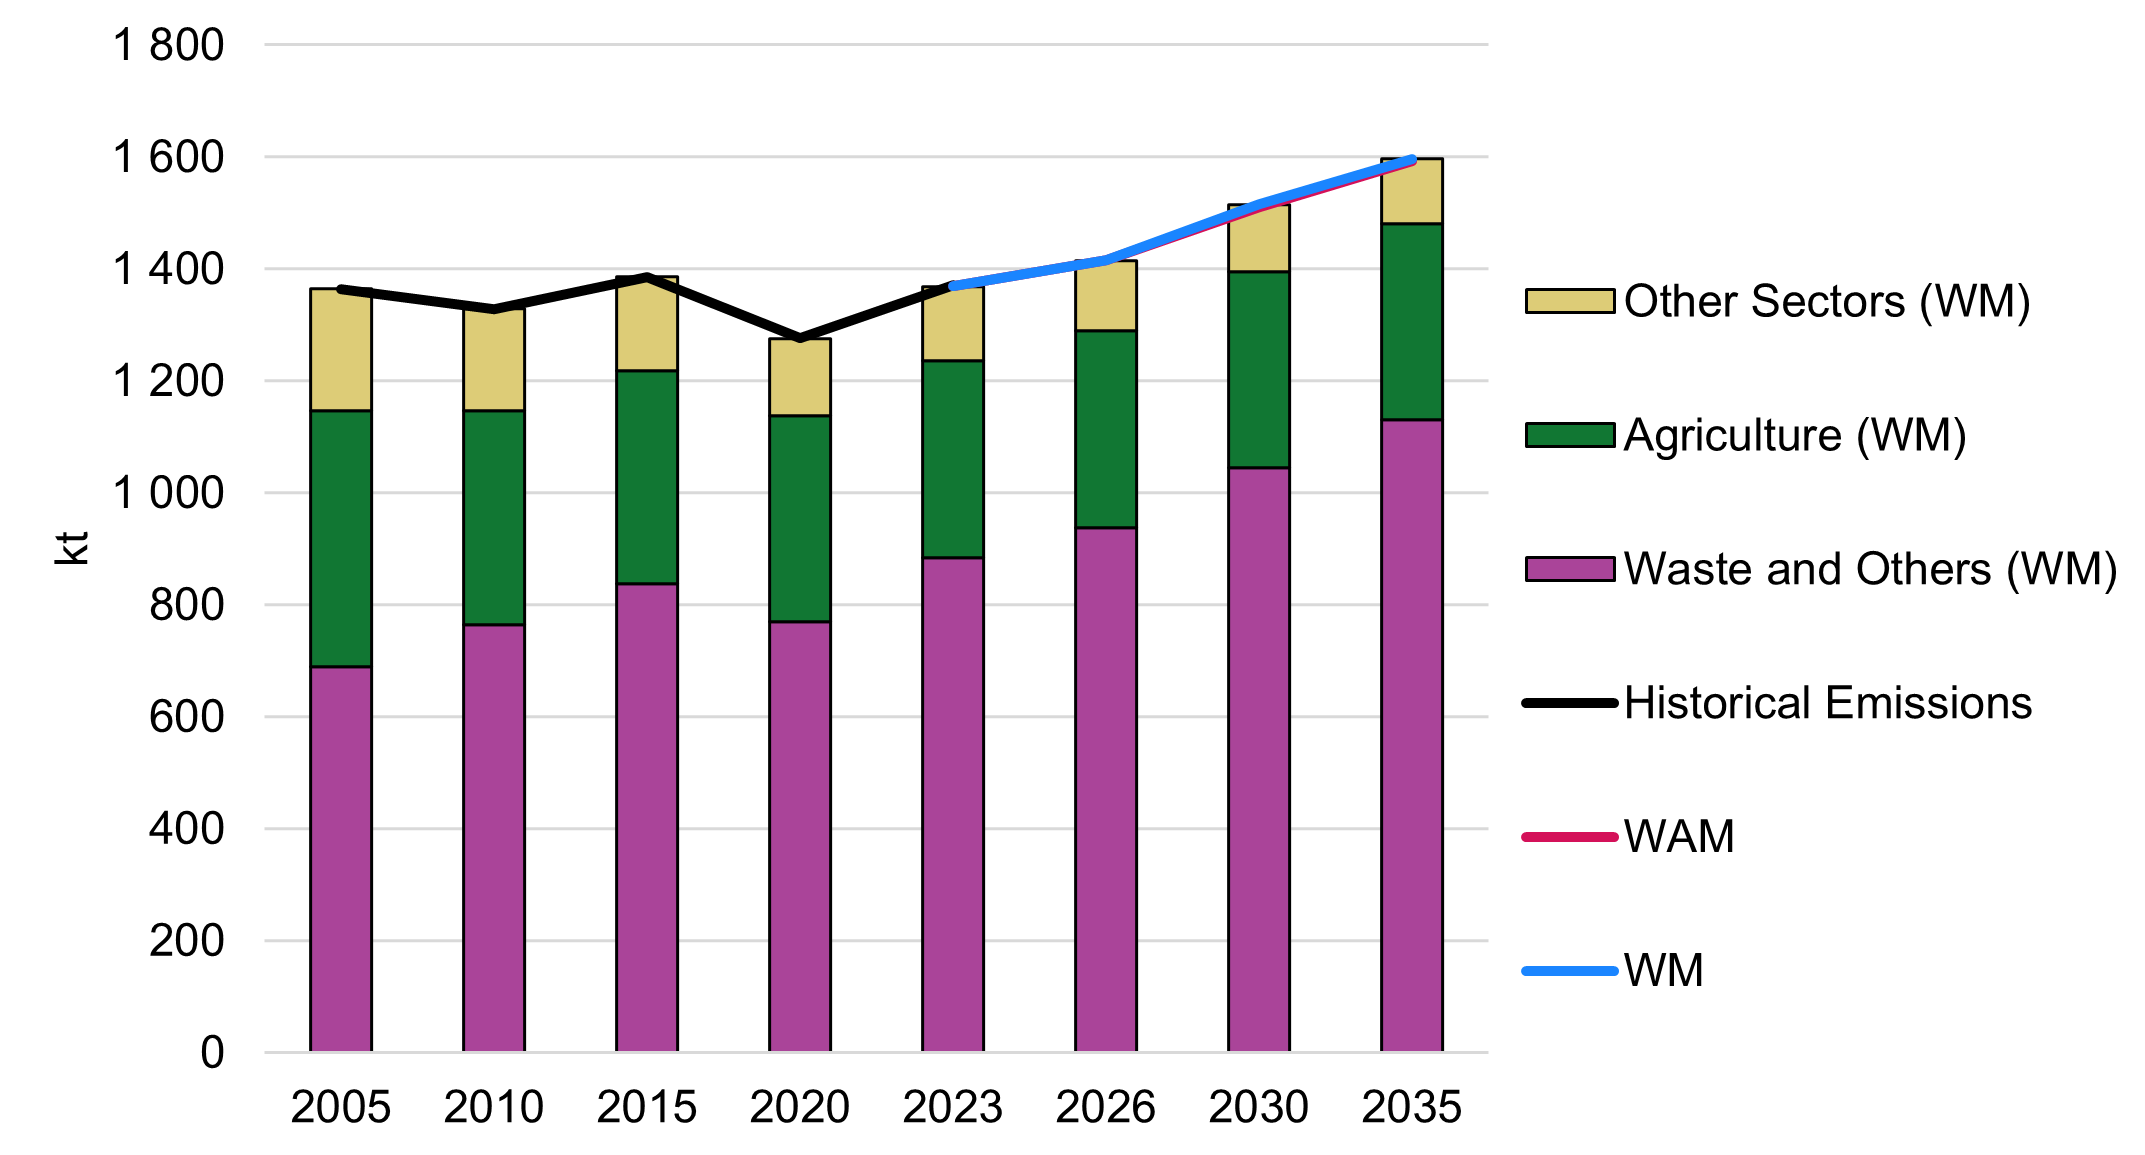
Note: Historical emissions data come from APEI2025. Access more data on the open data portal.
Long description
| Year | Waste and Others (WM) | Agriculture (WM) | Other Sectors (WM) | Historical Emissions | WM | WAM |
|---|---|---|---|---|---|---|
| 2005 | 690 | 457 | 217 | 1 364 | - | - |
| 2010 | 764 | 383 | 181 | 1 328 | - | - |
| 2015 | 837 | 382 | 167 | 1 385 | - | - |
| 2020 | 770 | 367 | 139 | 1 277 | - | - |
| 2023 | 884 | 352 | 133 | 1 370 | 1 370 | 1 370 |
| 2026 | 938 | 352 | 125 | - | 1 415 | 1 416 |
| 2030 | 1 044 | 351 | 120 | - | 1 515 | 1 510 |
| 2035 | 1 130 | 351 | 116 | - | 1 597 | 1 592 |
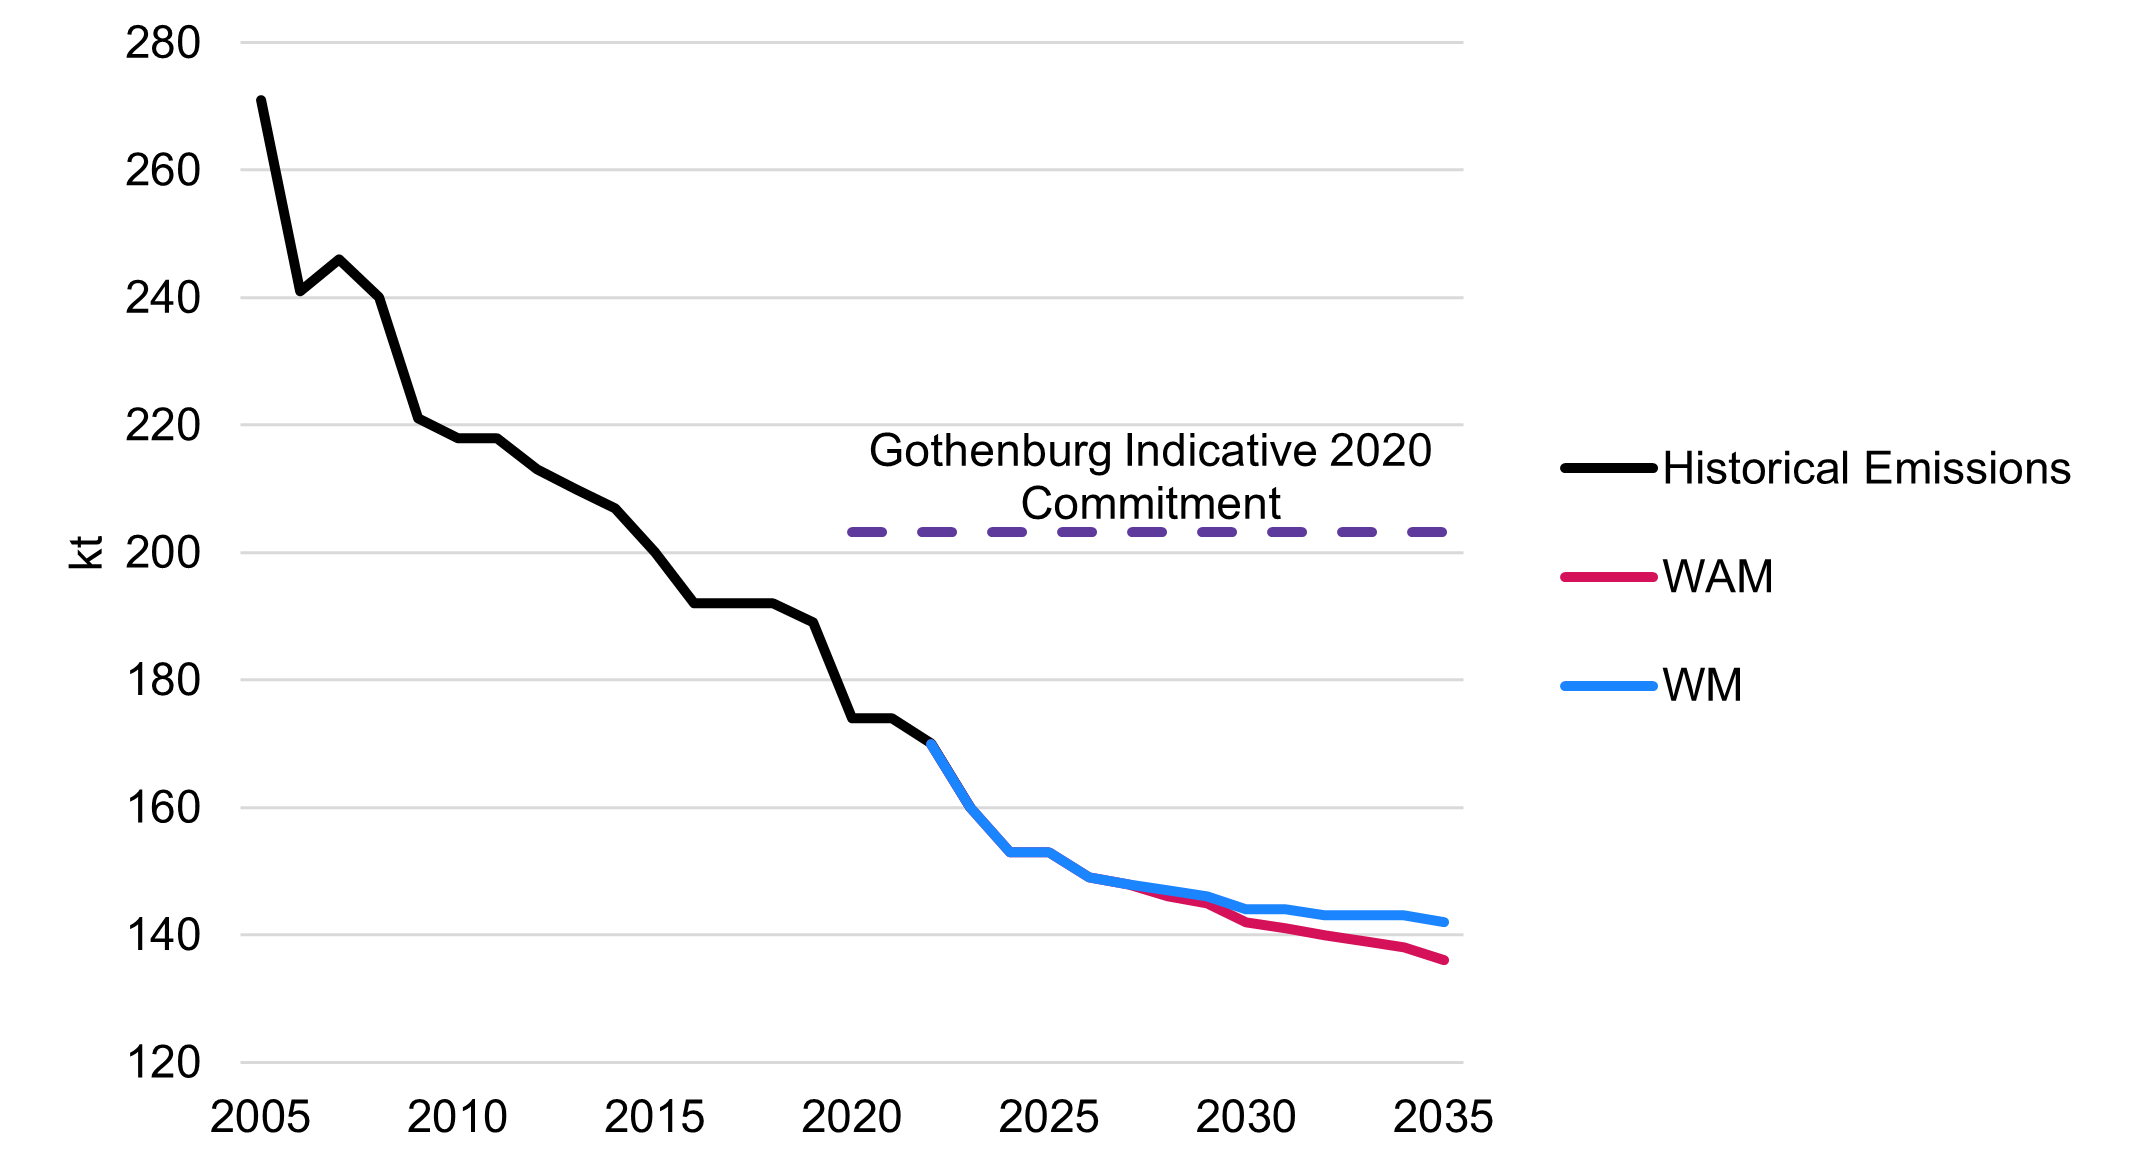
Note: Historical emissions data come from APEI2025. Access more data on the open data portal.
Long description
| Year | Historical Emissions | WM | WAM | Gothenburg Indicative 2020 Commitment |
|---|---|---|---|---|
| 2005 | 271 | - | - | - |
| 2006 | 241 | - | - | - |
| 2007 | 246 | - | - | - |
| 2008 | 240 | - | - | - |
| 2009 | 221 | - | - | - |
| 2010 | 218 | - | - | - |
| 2011 | 218 | - | - | - |
| 2012 | 213 | - | - | - |
| 2013 | 210 | - | - | - |
| 2014 | 207 | - | - | - |
| 2015 | 200 | - | - | - |
| 2016 | 192 | - | - | - |
| 2017 | 192 | - | - | - |
| 2018 | 192 | - | - | - |
| 2019 | 189 | - | - | - |
| 2020 | 174 | - | - | 203 |
| 2021 | 174 | - | - | 203 |
| 2022 | 170 | - | - | 203 |
| 2023 | 160 | 160 | 160 | 203 |
| 2024 | - | 153 | 153 | 203 |
| 2025 | - | 153 | 153 | 203 |
| 2026 | - | 149 | 149 | 203 |
| 2027 | - | 148 | 148 | 203 |
| 2028 | - | 147 | 146 | 203 |
| 2029 | - | 146 | 145 | 203 |
| 2030 | - | 144 | 142 | 203 |
| 2031 | - | 144 | 141 | 203 |
| 2032 | - | 143 | 140 | 203 |
| 2033 | - | 143 | 139 | 203 |
| 2034 | - | 143 | 138 | 203 |
| 2035 | - | 142 | 136 | 203 |
3.6 Black carbon
The primary sources of black carbon emissions in Canada are the combustion of diesel that is primarily used in the Transportation and Agriculture sectors, as well as biomass used for residential heating.
Black carbon emissions have declined steadily over the years and are expected to continue falling. This trend is driven by the adoption of advanced pollution-control technologies, stricter emission standards, and the transition to electric heating systems. These measures will significantly reduce emissions both before and after 2030.
Under the WAM scenario, additional reductions are projected. Between 2023 and 2030, the decline is mainly due to a shift toward hydrogen fuel and lower fossil fuel demand in the Oil and Gas and Heavy Industry sectors. After 2030, emissions are expected to drop even further, supported by improvements in diesel vehicle efficiency and accelerated electrification efforts in the Transportation and Buildings sectors.
By 2025, Canada’s black carbon emissions are projected to be 39% (WM) and 40% (WAM) below 2013 levels. This puts Canada on track to exceed its share of the Arctic Council’s aspirational goal to reduce collective black carbon emissions by 25% to 33% below 2013 levels by 2025. For more information, refer to the Arctic Council Framework for Action on Enhanced Black Carbon and Methane Emissions Reductions.
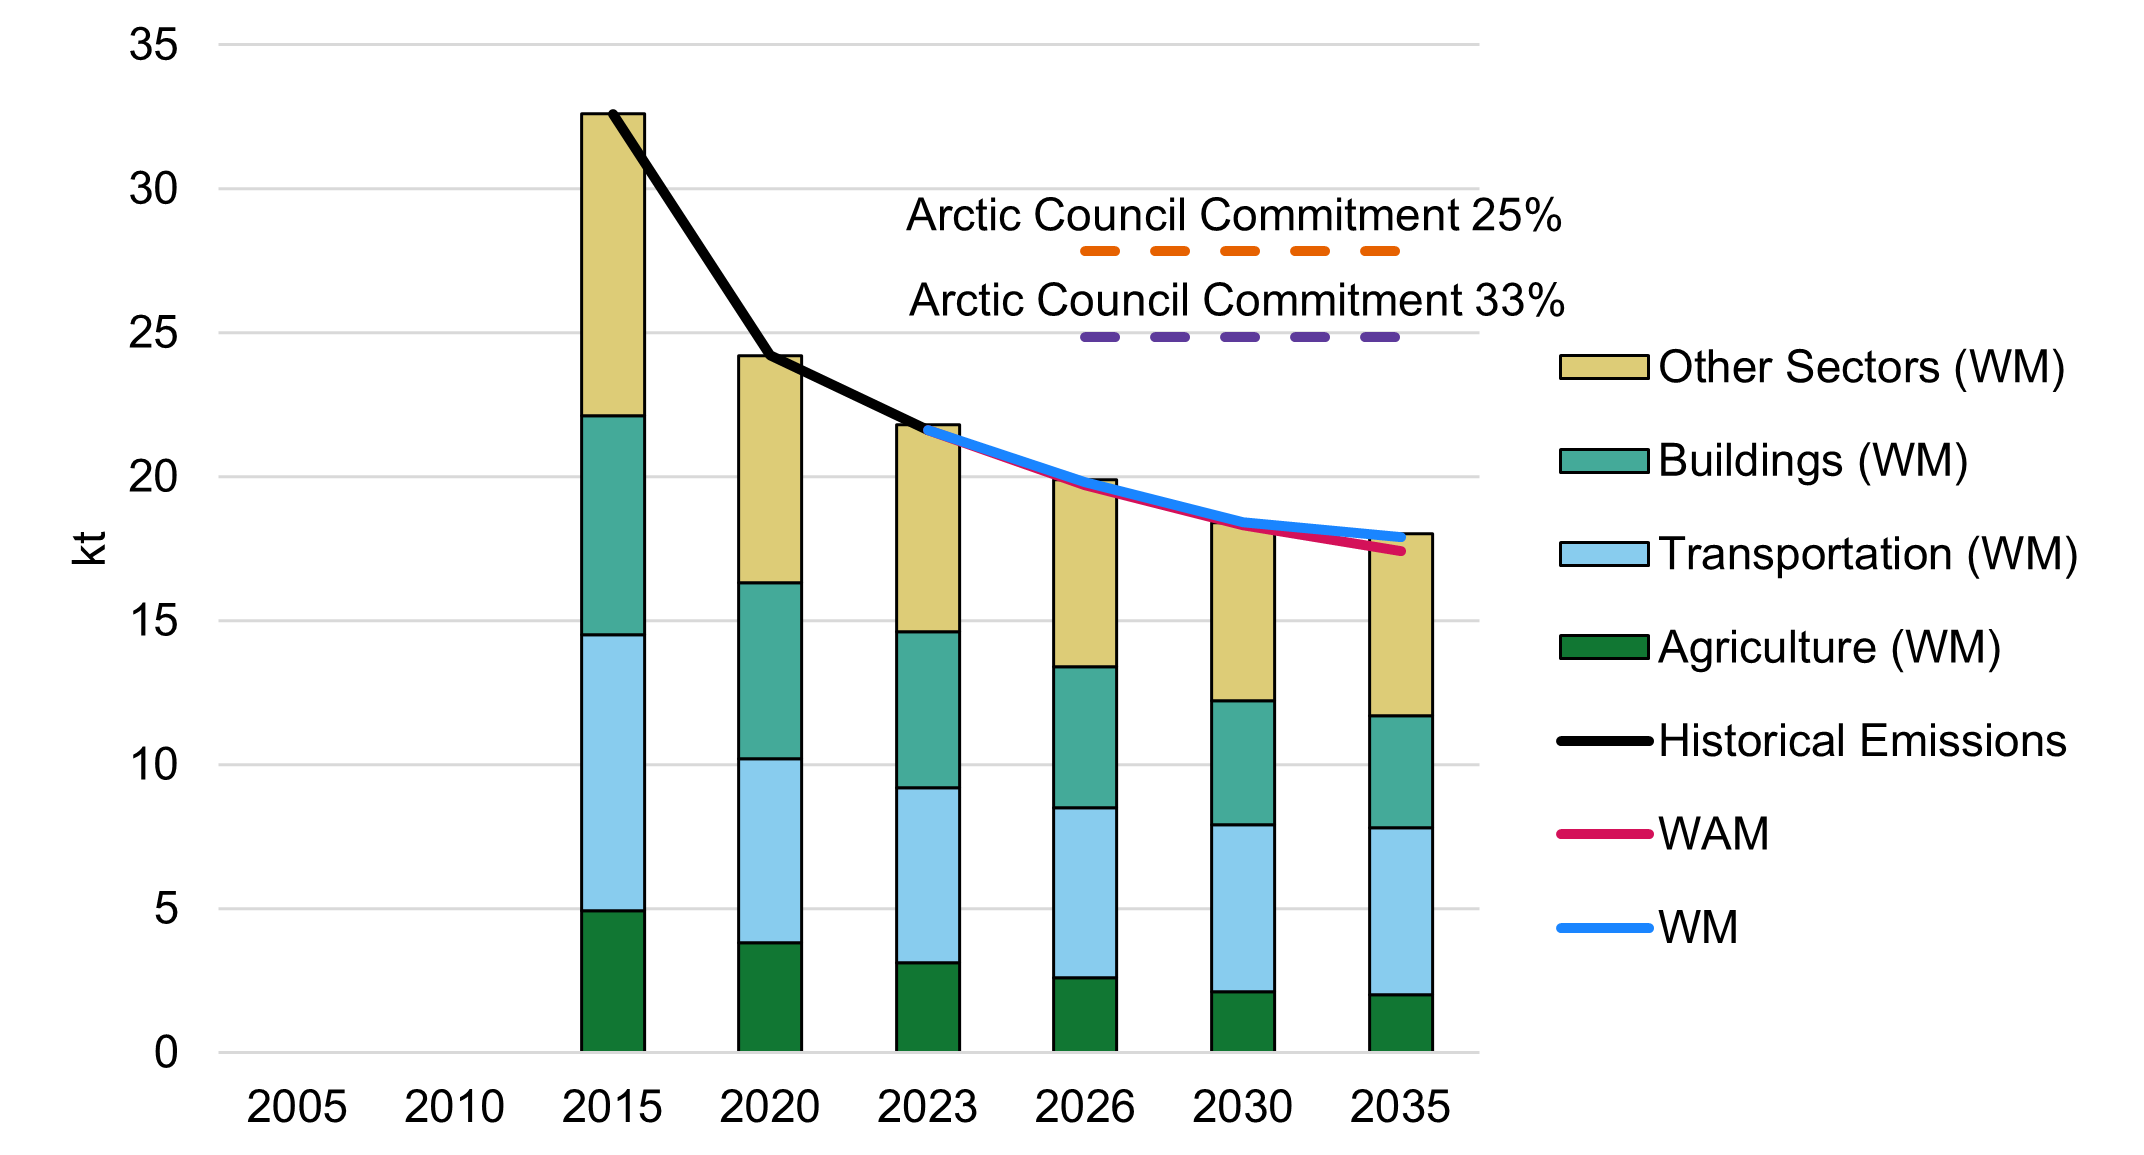
Note: Historical emissions data come from Canada's Black Carbon Inventory Report 2025. Black carbon emissions inventory starts in 2013. Access more data on the open data portal.
Long description
| Year | Transportation (WM) | Buildings (WM) | Agriculture (WM) | Other Sectors (WM) | Historical Emissions | WM | WAM | Arctic Council Commitment 33% | Arctic Council Commitment 25% |
|---|---|---|---|---|---|---|---|---|---|
| 2005 | 0.0 | 0.0 | 0.0 | 0.0 | - | - | - | - | - |
| 2010 | 0.0 | 0.0 | 0.0 | 0.0 | - | - | - | - | - |
| 2015 | 9.6 | 7.6 | 4.9 | 10.5 | 32.6 | - | - | - | - |
| 2020 | 6.4 | 6.1 | 3.8 | 7.9 | 24.2 | - | - | - | - |
| 2023 | 6.1 | 5.4 | 3.1 | 7.2 | 21.6 | 21.6 | 21.6 | - | - |
| 2026 | 5.9 | 4.9 | 2.6 | 6.5 | - | 19.8 | 19.7 | 24.9 | 27.8 |
| 2030 | 5.8 | 4.3 | 2.1 | 6.2 | - | 18.4 | 18.3 | 24.9 | 27.8 |
| 2035 | 5.8 | 3.9 | 2.0 | 6.3 | - | 17.9 | 17.4 | 24.9 | 27.8 |
3.7 Carbon monoxide (CO)
The primary source of carbon monoxide emissions is the incomplete combustion of hydrocarbon-based fuels, mainly from mobile sources. Other notable contributors include the wood industry, smelting and refining operations, and residential wood heating, though to a lesser extent.
Since 2005, carbon monoxide emissions have shown a consistent downward trend, which is expected to continue. Between 2023 and 2030, this decline is largely driven by the increasing use of electric residential heating systems. After 2030, further reductions are anticipated, primarily due to ongoing efficiency improvements and electrification in the Transportation sector. Continued electrification of residential heating will also remain a key factor in reducing emissions beyond 2030.
Under the WAM scenario, additional reductions are expected. Throughout both the pre- and post-2030 periods, the shift in the Heavy Industry and Oil and Gas sectors from hydrocarbon-based fuels to cleaner energy sources plays a major role. Further emission cuts are also expected from improved efficiency in diesel and gasoline passenger vehicles, along with expanded electrification in the Transportation and Buildings sectors.
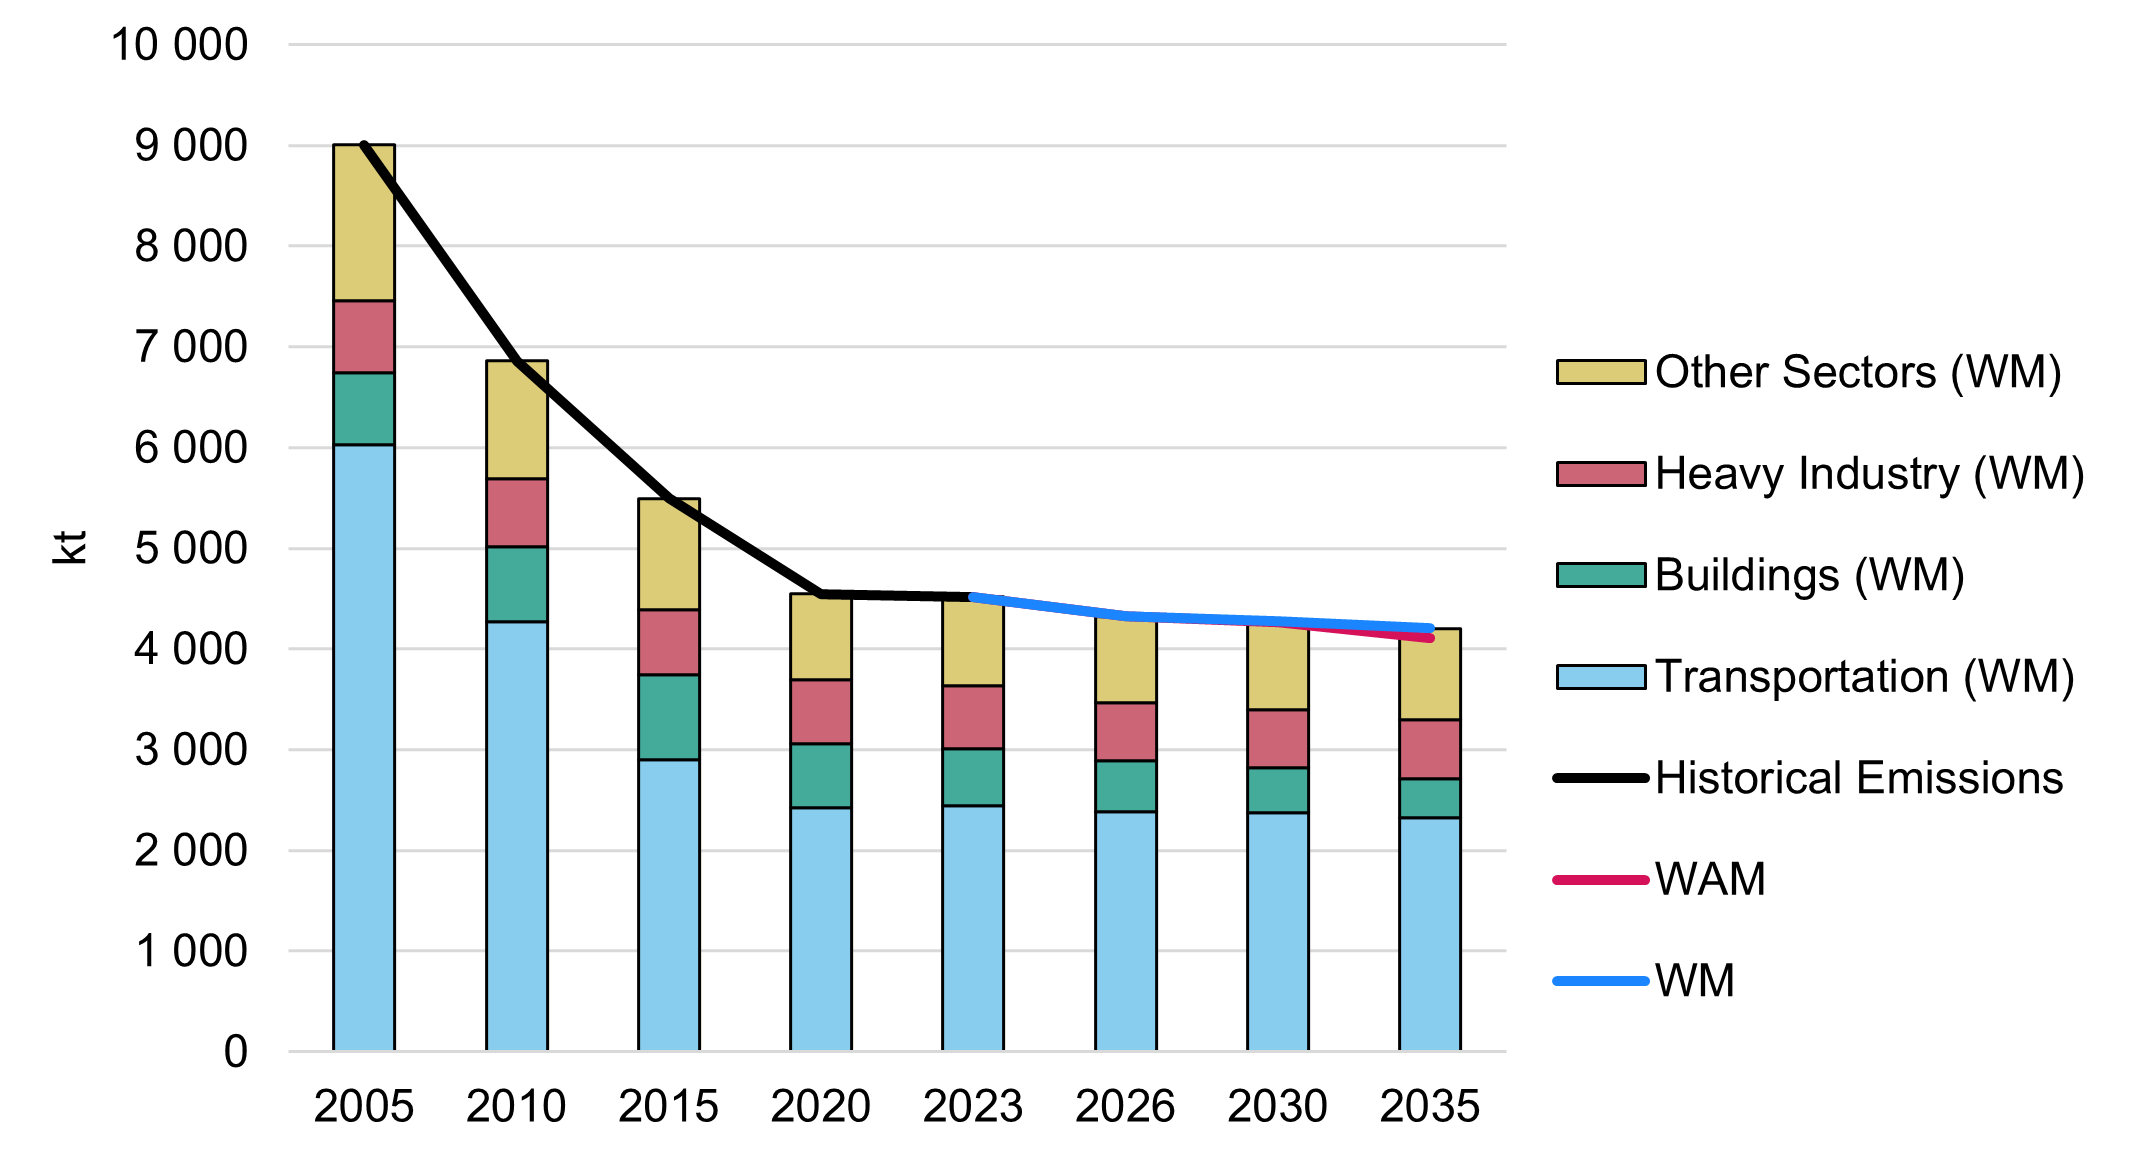
Note: Historical emissions data come from APEI2025. Access more data on the open data portal.
Long description
| Year | Transportation (WM) | Buildings (WM) | Heavy Industry (WM) | Other Sectors (WM) | Historical Emissions | WM | WAM |
|---|---|---|---|---|---|---|---|
| 2005 | 6 025 | 719 | 710 | 1 553 | 9 006 | - | - |
| 2010 | 4 266 | 746 | 676 | 1 174 | 6 861 | - | - |
| 2015 | 2 900 | 839 | 653 | 1 104 | 5 495 | - | - |
| 2020 | 2 428 | 634 | 637 | 847 | 4 547 | - | - |
| 2023 | 2 443 | 568 | 621 | 887 | 4 518 | 4 518 | 4 518 |
| 2026 | 2 383 | 508 | 570 | 858 | - | 4 320 | 4 322 |
| 2030 | 2 378 | 442 | 578 | 876 | - | 4 276 | 4 264 |
| 2035 | 2 326 | 383 | 592 | 901 | - | 4 202 | 4 112 |
3.8 Mercury
The main sources of mercury emissions in Canada include iron and steel production, smelting and refining operations, cement manufacturing, mining activities, coal-fired electric power generation, waste incineration, and various commercial, residential, and institutional sources.
Mercury emissions have declined significantly over time, largely due to reduced activity in the Heavy Industry sector, improved waste management practices, and a decreasing reliance on coal-fired electricity. Between 2023 and 2030, emissions are expected to continue falling as coal-fired power plants are phased out.
After 2030, a slight increase in mercury emissions is projected. This is mainly due to population growth, which is expected to raise emissions from waste incineration, and increased economic activity in the Heavy Industry sector. Although the complete phase out of coal-fired electricity and restrictions on mercury-containing products will continue to reduce emissions, these measures are not expected to fully offset the upward pressures.
Under the WAM scenario, further reductions are expected. Throughout both the pre- and post-2030 periods, mercury emissions are projected to decline due to reduced fossil fuel use in the Heavy Industry and Oil and Gas sectors. After 2030, additional reductions are anticipated from the accelerated electrification of heating systems in the Buildings sector. These efforts may not be enough to fully offset the projected increases driven by population growth and expanding industrial activity.
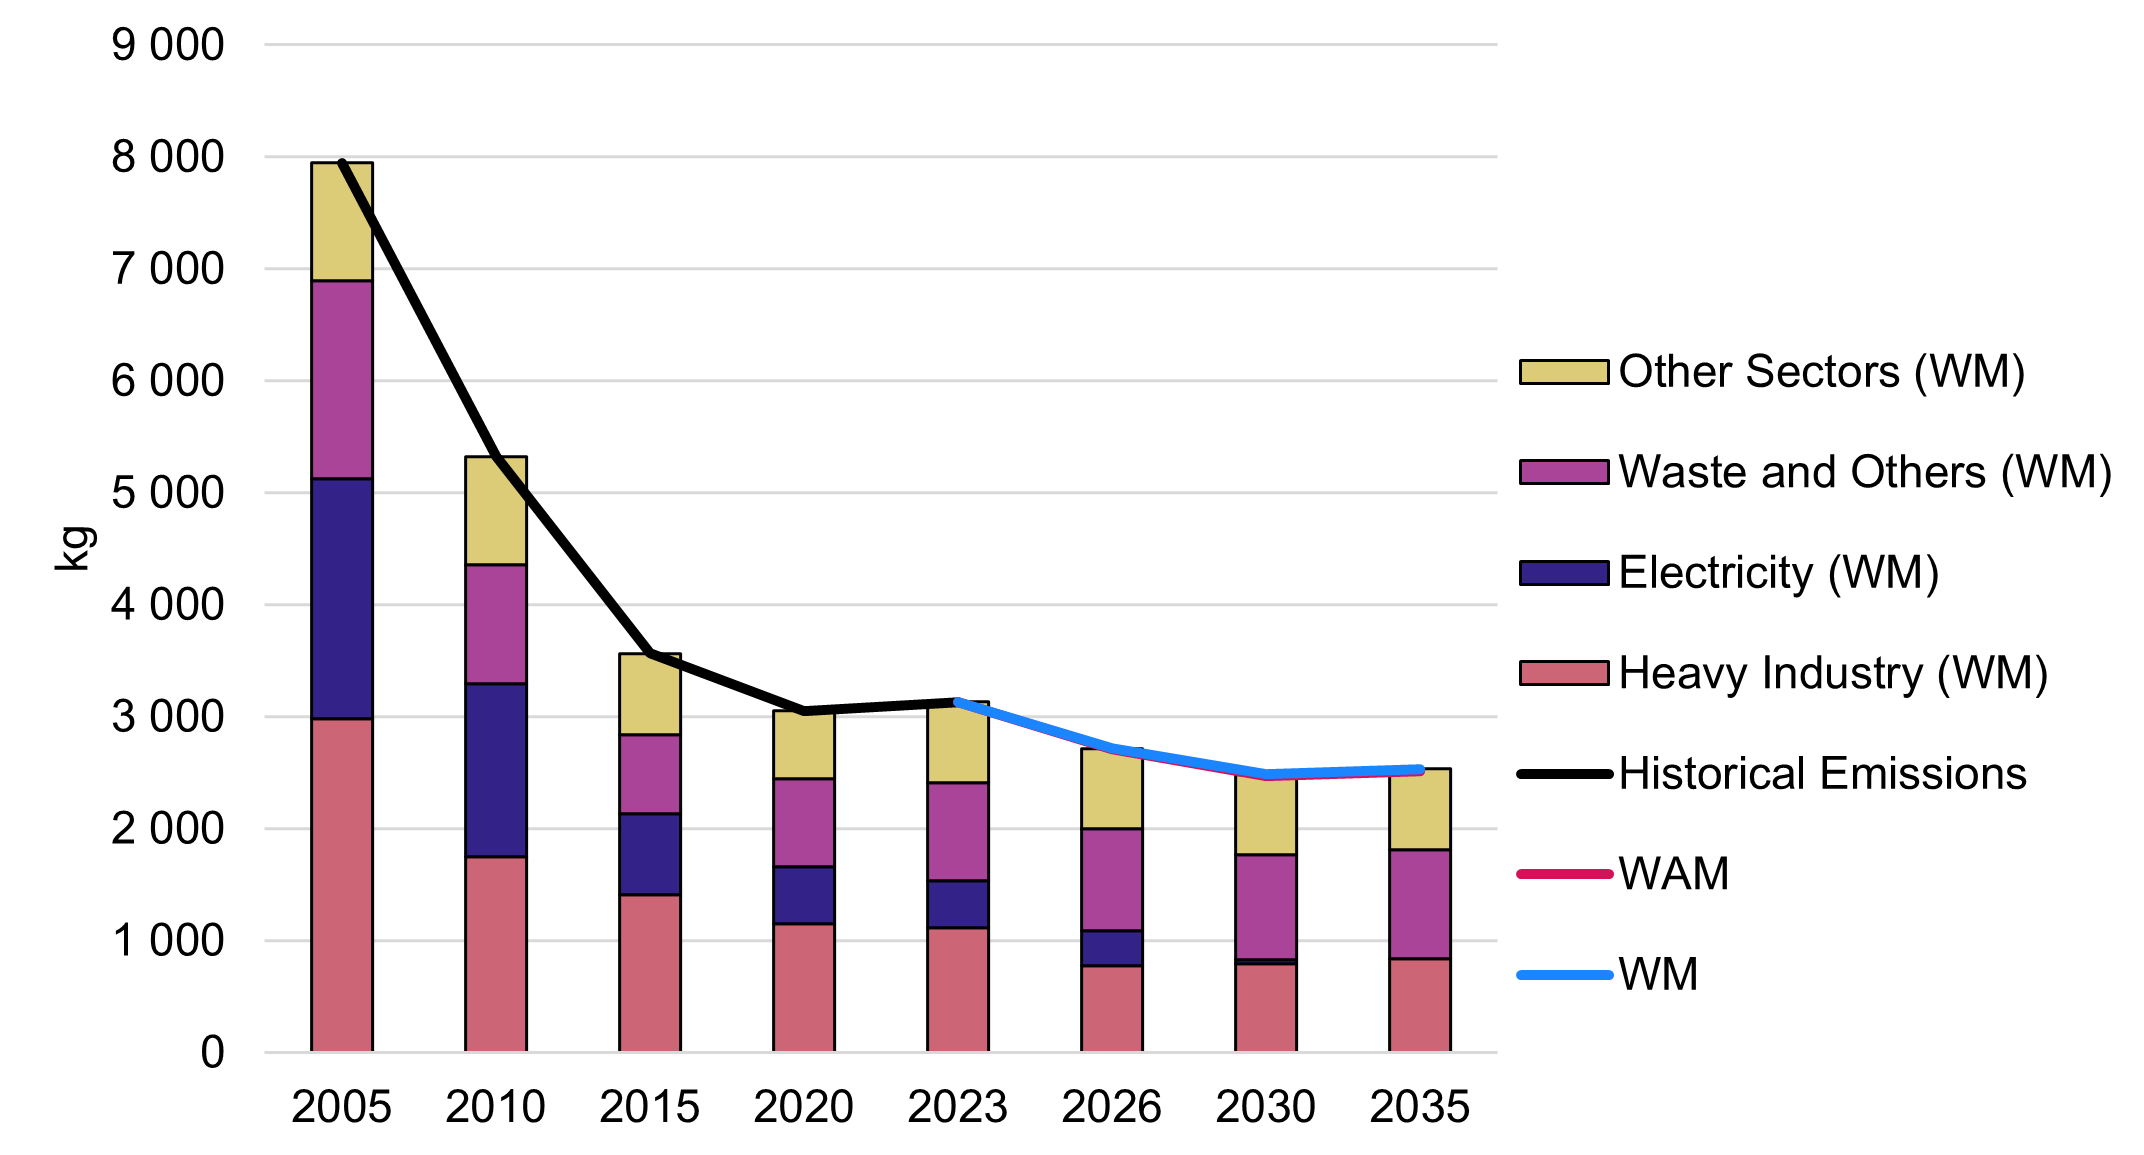
Note: Historical emissions data come from APEI2025. Access more data on the open data portal.
Long description
| Year | Heavy Industry (WM) | Electricity (WM) | Waste and Others (WM) | Other Sectors (WM) | Historical Emissions | WM | WAM |
|---|---|---|---|---|---|---|---|
| 2005 | 2 984 | 2 139 | 1 768 | 1 057 | 7 947 | - | - |
| 2010 | 1 744 | 1 545 | 1 069 | 966 | 5 324 | - | - |
| 2015 | 1 406 | 722 | 707 | 728 | 3 563 | - | - |
| 2020 | 1 151 | 503 | 792 | 602 | 3 048 | - | - |
| 2023 | 1 111 | 419 | 881 | 720 | 3 131 | 3 131 | 3 131 |
| 2026 | 773 | 316 | 912 | 711 | - | 2 713 | 2 707 |
| 2030 | 793 | 38 | 938 | 714 | - | 2 482 | 2 470 |
| 2035 | 834 | 0 | 979 | 718 | - | 2 531 | 2 507 |
3.9 Ammonia
In Canada, the majority of ammonia emissions, about 94% in 2023, come from animal and crop production activities. Fertilizer production is the next largest source, contributing approximately 2% of total emissions that year.
From 2005 to 2023, ammonia emissions remained relatively stable, consistently staying below 500 kt annually. However, emissions are projected to gradually increase, driven by growth in agricultural activity and greater use of nitrogen-based fertilizers.
Under the WAM scenario, ammonia emissions are expected to be slightly higher than in the WM scenario. However, there is no meaningful difference between the two scenarios.
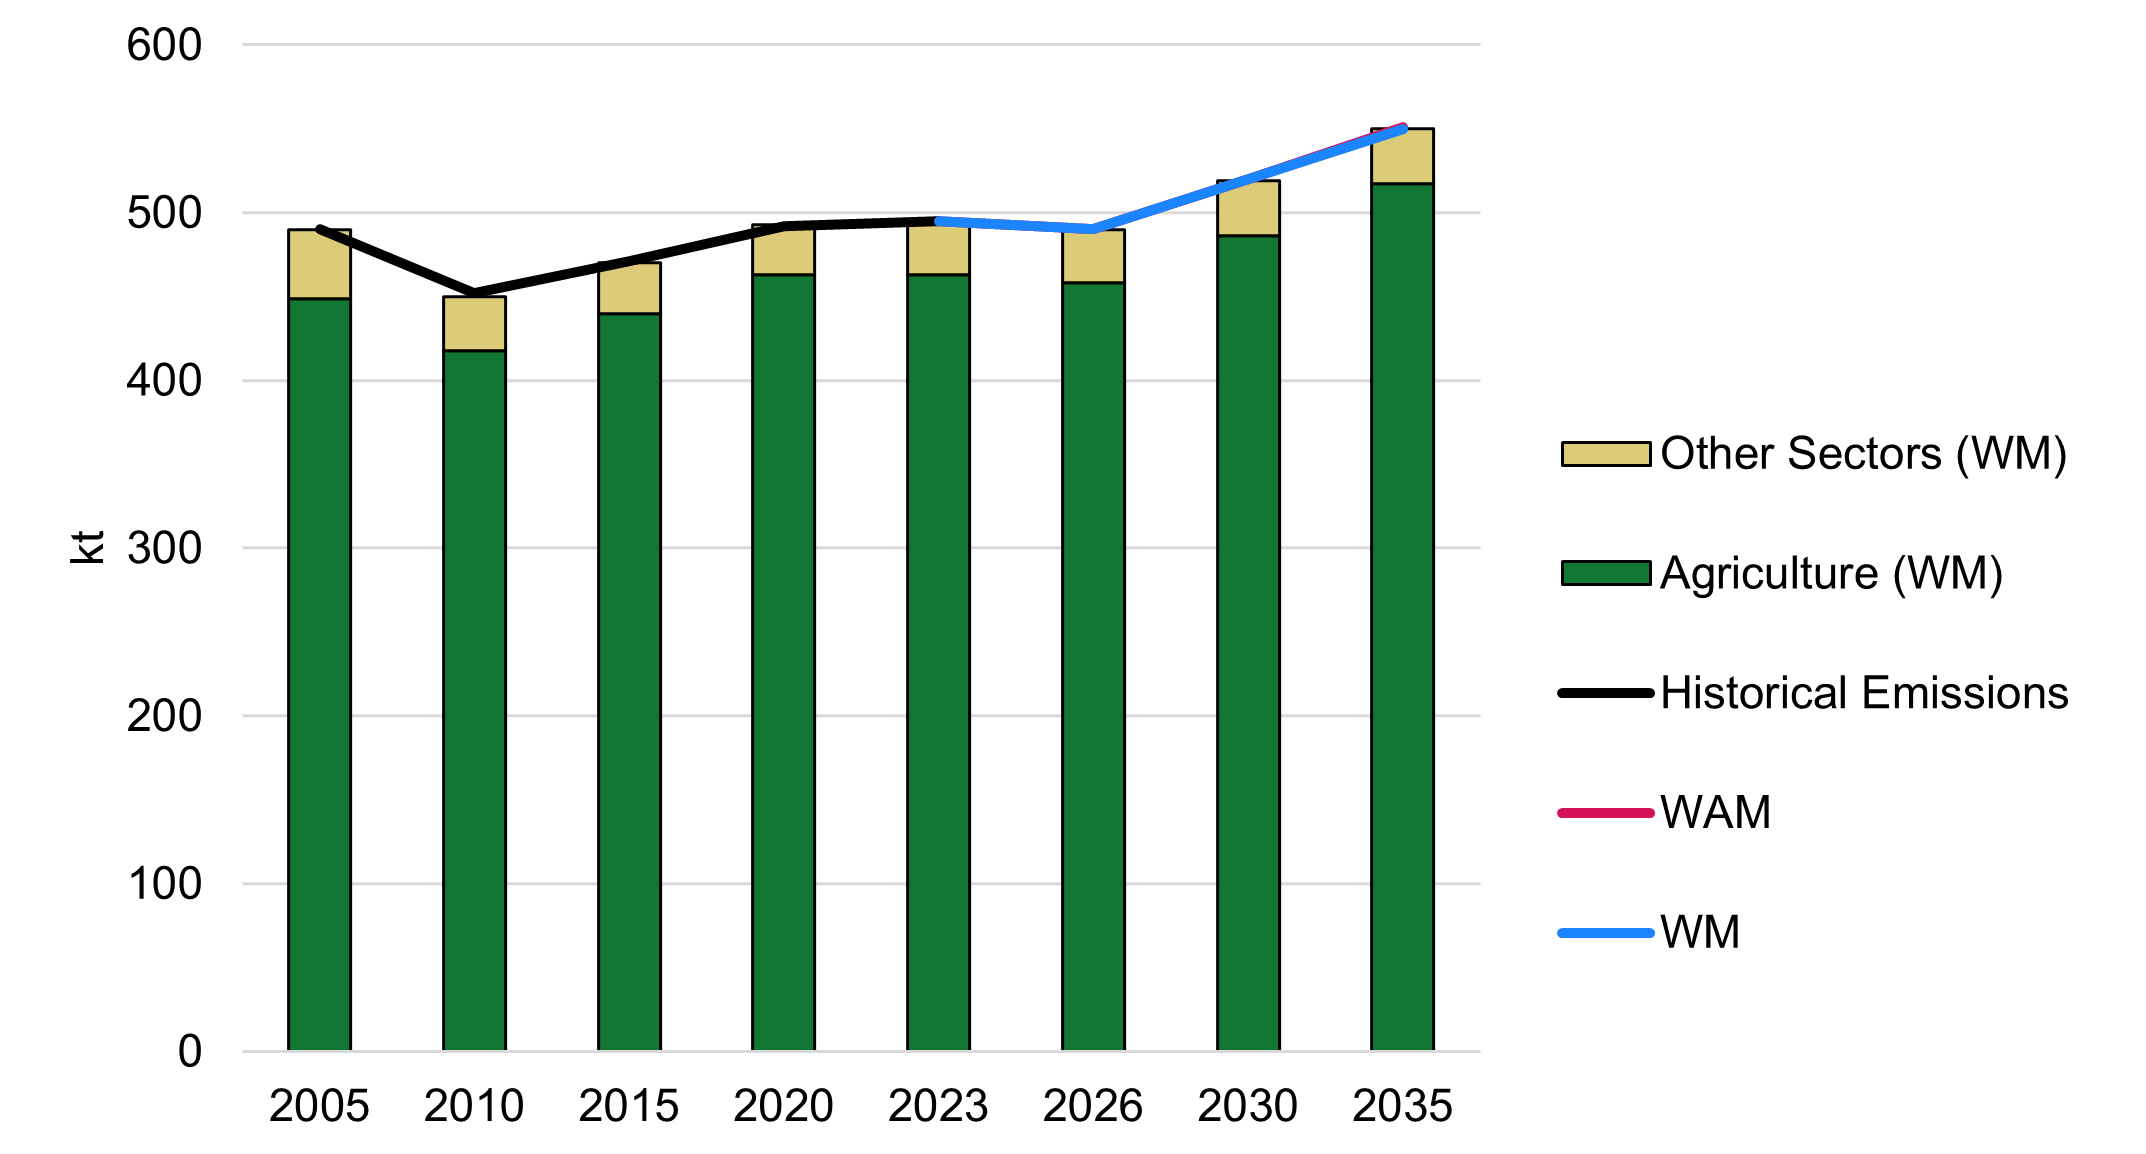
Note: Historical emissions data come from APEI2025. Access more data on the open data portal.
Long description
| Year | Agriculture (WM) | Other Sectors (WM) | Historical Emissions | WM | WAM |
|---|---|---|---|---|---|
| 2005 | 449 | 41 | 490 | - | - |
| 2010 | 418 | 32 | 452 | - | - |
| 2015 | 440 | 30 | 471 | - | - |
| 2020 | 463 | 30 | 492 | - | - |
| 2023 | 463 | 33 | 495 | 495 | 495 |
| 2026 | 458 | 32 | - | 490 | 490 |
| 2030 | 486 | 33 | - | 520 | 520 |
| 2035 | 517 | 33 | - | 550 | 551 |
Annex 1 Methodology and assumptions
A1.1 Overview
The scenarios used to develop Canada’s GHG and air pollutant emissions projections are based on a set of plausible assumptions. These include expectations around population and economic growth, energy prices, energy supply and demand, and the evolution of energy efficiency and clean technologies.
These projections should not be interpreted as forecasts or predictions. Instead, they represent a forward-looking extension of the current economic structure and policy environment. They do not account for future changes in government policy, technological breakthroughs, or shifts in domestic and global economic or political conditions.
The projections follow recognized best practices and are grounded in rigorous methodologies. They incorporate IPCC standards for estimating GHG emissions across a variety of fuels and processes. They utilize the most current data and expert input on key drivers such as economic growth, energy prices, and energy demand and supply. An internationally recognized energy and macroeconomic modelling framework is applied to assess emissions and their economic interactions.
The methodology used to develop the projections and underlying assumptions has been subject to peer review by leading external experts in economic modelling and GHG emissions projections, as well as vetted with key stakeholders to ensure credibility and transparency.
Key features of the approach include:
- using the most recent statistics on GHG emissions and energy use, with assumptions obtained from top public and private expert sources
- developing emissions projections by IPCC categories and economic sectors using E3MC, a detailed and proven model of Canada’s energy, emissions, and economy
- aggregating and reporting results from external models to calculate the accounting contribution of the LULUCF sector
This Annex outlines ongoing efforts to improve Canada’s projections, key data sources and models used, and highlights differences in assumptions between these projections, EPR2023, and BTR1.
A1.2 Modelling framework
Canada’s emissions projections are based on the E3MC model, which integrates two key components:
- ENERGY 2020: A detailed energy model that simulates fuel supply, demand, and pricing across sectors
- NAEM: A macroeconomic model that captures regional economic activity and its interaction with energy use
Together, these models provide a comprehensive view of how policies, prices, and technologies shape Canada’s emissions trajectory and have a detailed breakdown for all provinces and territories.
Within E3MC, analysts use data from Statistics Canada, NRCan’s Office of Energy Efficiency, Canada’s GHG Reporting Program, the Canadian Energy and Emissions Data Centre, and various oil sands reports to assign energy data to individual subsectors. These subsectors are then aggregated into the economic sectors featured in the report. E3MC uses the macroeconomic model variables like GDP, population, and industry growth to drive energy use and GHG emissions across most sectors.
E3MC uses a market-based approach to energy analysis. It balances energy supply and demand for each fuel and sector, ensuring consistency across sectors and regions. The model can operate in two modes: forecasting mode and analytical mode. The forecasting mode generates annual energy and emissions outlooks to 2050 while the analytical mode evaluates policy options, programs, technologies, or other assumptions.
Primary outputs include tables showing energy consumption, production, and prices by fuel type, year, and region. The model also produces macroeconomic indicators such as GDP and unemployment, and a comprehensive set of GHG emissions by gas, by sector, and by province or territory.
Figure A1 illustrates the structure of the ENERGY 2020 model and its integration within the broader E3MC framework. It shows how energy demand and supply interact through market mechanisms, with prices acting as a key feedback signal. Demand sectors (e.g., residential, commercial, industrial, and transportation) respond to macroeconomic inputs like GDP, personal income and gross output. Supply sectors (e.g., electricity, oil, gas, and renewables) adjust their production based on domestic and international demand. These interactions generate outputs such as changes in energy intensity, investment patterns, and energy prices, which are then fed into the macroeconomic model. The macroeconomic model recalculates economic indicators, which in turn influence energy demand in the next iteration. This forms a dynamic feedback loop that ensures consistency between energy and economic projections.
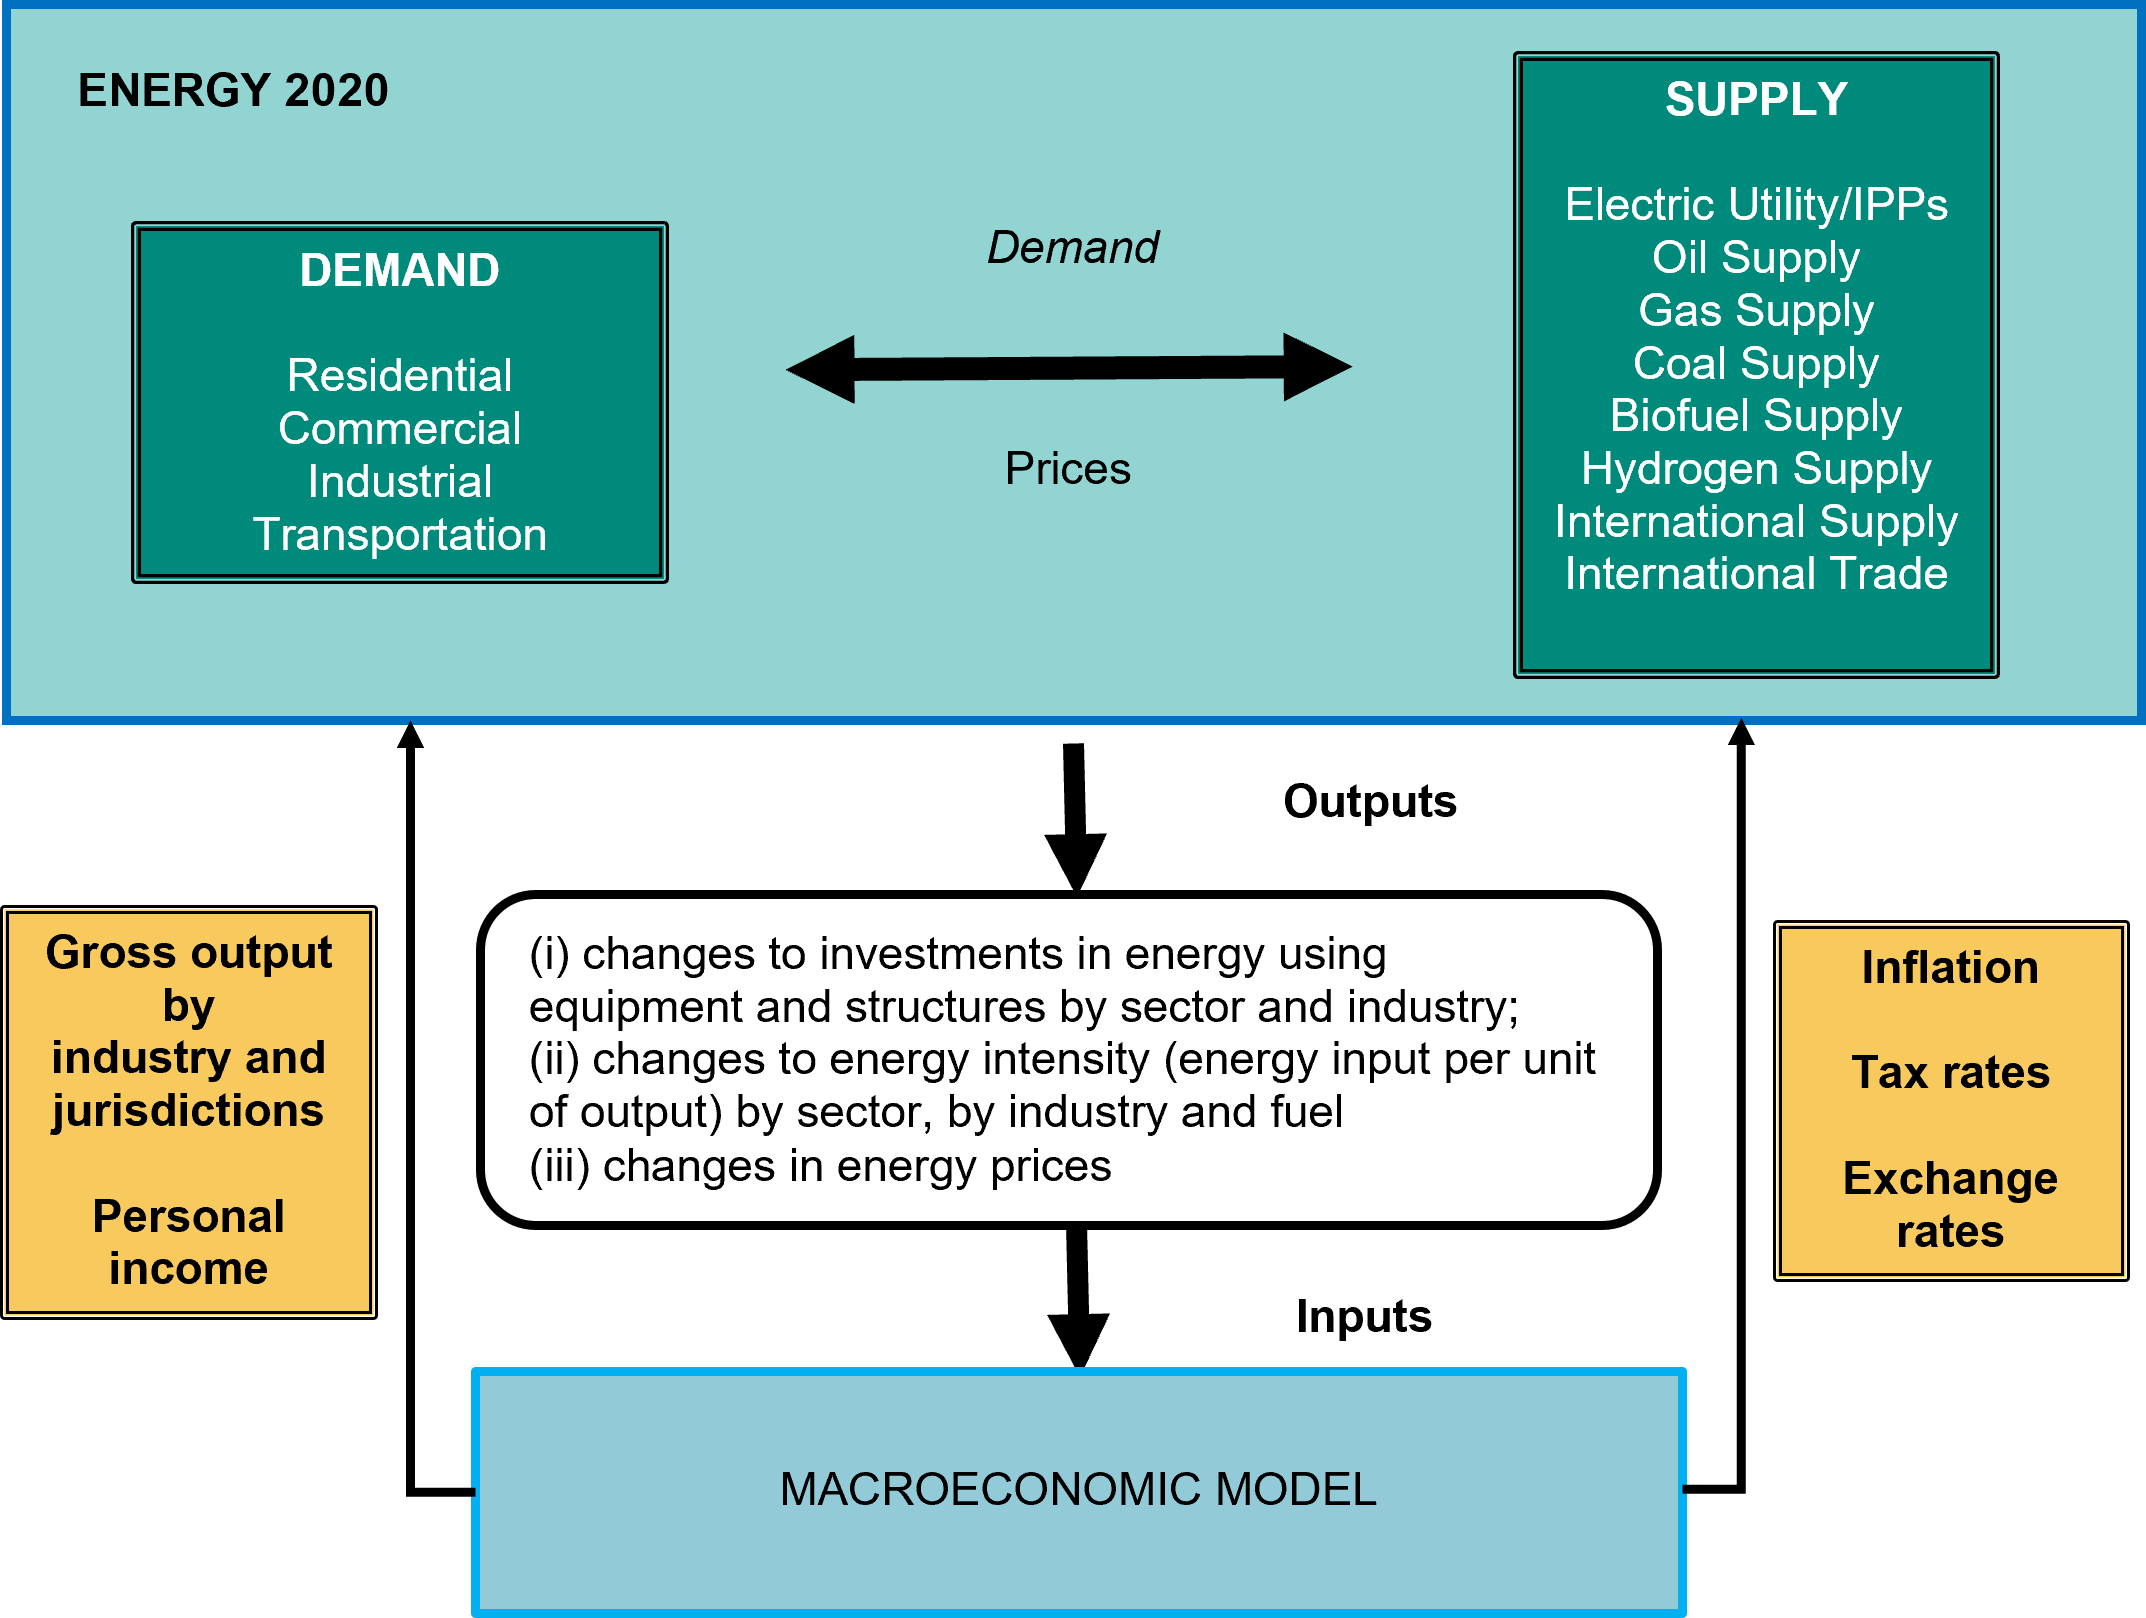
Long description
This figure is a flow chart diagram that illustrates the flows of information in the Energy, Emissions and Economy Model for Canada. It shows what information is exchanged between the two components of the model, ENERGY2020 and the macroeconomic model.
In the ENERGY2020 model, information about demand and prices is exchanged between two components of the model:
Demand: This component includes the residential, commercial, industrial, and transportation sectors.
Supply: This section includes electric utility/IPPs, oil supply, coal supply, gas supply, biofuel supply, hydrogen supply, international supply, and international trade.
The outputs of ENERGY2020 that are passed on to the macroeconomic model include:
- Changes to investments in energy using equipment and structures by sector and industry.
- Changes to energy intensity (energy input per unit of output) by sector, by industry and fuel
- Changes in energy prices.
In turn, the macroeconomic model passes along the following variables back to the ENERGY2020 model:
Gross output by industry and jurisdictions
Personal income
Inflation
Tax rates
Exchange rates
A1.2.1 ENERGY 2020
ENERGY 2020 is an internationally peer-reviewed, integrated, multi-region, multi-sector North American model. It simulates the supply, demand, and pricing of all fuels across multiple regions and sectors. It accounts for both regulated and unregulated markets and models how energy prices and government policies influence consumer and business decisions. The model produces outputs including changes in energy use, prices, GHG emissions, investment costs, and potential cost savings from mitigation measures. These outputs then feed into the macroeconomic model.
ENERGY 2020 is proprietary software developed by Systematic Solutions, Inc. It has been used by government agencies, utilities, and climate organizations for long-term energy and emissions projections and policy analysis. ECCC and the CER have used the model since the early 1990s. Documentation is available from Systematic Solutions, Inc.
A1.2.2 North America Economic Model
The macroeconomic model used in E3MC is the NAEM from Oxford Economics. The model uses a “bottom-up” framework that models each Canadian province and territory, as well as 10 US regions (nine US Census Divisions, with California separated from the Pacific Division). It features detailed behavioural modelling at the regional level, which is then aggregated to produce national and regional economic indicators.
The NAEM is a highly disaggregated model designed to support long-term economic forecasting and assess the impacts of various energy and socioeconomic policies. It examines consumption, investment, production, and trade decisions across the entire economy. The model captures interactions among industries and regions, and reflects changes in producer prices, final prices, and income. It also incorporates government fiscal balances, monetary flows, and interest and exchange rates.
The model is structured around detailed North American Industry Classification System (NAICS) categories, covering approximately 113 goods and service-producing industries and sectoral aggregations per region. Key industry concepts include gross value added, gross output, investment, employment, and interregional trade.
The NAEM projects the direct impacts of policy choices on final demand, output, employment, price formation, and sectoral income. This enables the estimation of the broader economic effects of climate change policies and related measures on the Canadian economy.
A1.2.3 Cross-cutting modelling considerations
A.1.2.3.1 Policy interaction effects
The overall effectiveness of Canada’s emissions-reduction measures depends on how these policies interact. Ideally, any analysis of a policy package, which may comprise federal, provincial, and territorial measures, should account for these interactions to accurately assess its total contribution to emissions reductions. E3MC is designed to capture these dynamics, as it is a comprehensive, integrated model that simulates interactions between sectors and policies. In the demand sectors, it consistently integrates fuel choice, process efficiency, device efficiency, and self-generation of electricity. The model includes detailed equations to ensure that energy flows and efficiencies are preserved across sectors. For example, the Electricity sector responds to demand from other sectors. A policy that reduces electricity use in consumer sectors will, in turn, reduce electricity generation. As the emissions intensity of electricity generation declines, the emissions reduction impact of such demand-side policies also diminishes. E3MC accounts for emissions in both the electricity generation and consumer sectors, ensuring a complete picture of policy impacts.
The model also simulates exports from supply sectors and includes a detailed representation of technologies used to produce goods and services across the economy. It realistically models capital stock turnover and technology choices, and incorporates equilibrium feedback mechanisms so that supply and demand adjust in response to policy changes. E3MC covers all sources of GHG emissions, including those not directly related to energy use.
A.1.2.3.2 Additionality
Additionality refers to the difference in emissions between scenarios with and without a specific initiative. Issues arise when reported emissions reductions do not reflect this difference, particularly if the reductions have already been included in the WM scenario. Without proper adjustments, this can lead to double counting.
The E3MC model addresses additionality by using a structure based on incremental or marginal decision-making. It assumes a baseline energy efficiency or emissions intensity profile for each sector and end-use application (e.g., space heating, lighting, auxiliary power). When a new initiative is introduced, such as one that improves furnace efficiency, the model only adjusts the efficiency of new furnaces. Existing furnaces remain unchanged unless they are retired and replaced. This ensures that any changes are incremental to the business-as-usual assumptions already embedded in the model.
E3MC is designed to accurately capture the cumulative impact of all policies and measures. Challenges, however, can still arise when trying to attribute specific emissions reductions to overlapping or interacting policies.
A.1.2.3.3 Free ridership
Free ridership occurs when reported emissions reductions include actions that would have happened regardless of the policy. For example, if subsidies are offered to all purchasers of a high-efficiency furnace, regardless of whether the subsidy influenced their decision, then some of the resulting emissions reductions may not be attributable to the policy.
The E3MC model accounts for this by incorporating the behaviour of free riders into the WM scenario. As a result, emissions reductions from individuals who would have adopted the technology anyway are not counted toward the policy’s impact. Instead, E3MC only attributes reductions to the incremental uptake of emissions-reducing technologies that occur because of the policy.
A.1.2.3.4 Rebound effect
The rebound effect refers to the increased use of a more efficient product due to the lower cost of its operation. For example, a more fuel-efficient car is cheaper to drive, which may lead people to drive more, partially offsetting the emissions savings.
Within the E3MC model, ECCC incorporates mechanisms that simulate this effect. These include fuel choice, process and device efficiency, short-term budget constraints, and cogeneration. Each of these components responds to changes in energy and emissions costs over time.
In the case of improved vehicle fuel efficiency, the model automatically accounts for the additional kilometres driven due to lower operating costs. This additional usage is netted out of the emissions-reduction estimates, ensuring that the rebound effect is reflected in the final results.
A.1.2.3.5 Capital stock turnover
As a technology vintage model, E3MC tracks the evolution of capital stock over time through retirements, retrofits, and new purchases. Consumers and businesses make sequential investment decisions with limited foresight. This is essential for understanding the timing and pace of emissions reductions under different scenarios.
The model calculates energy use and associated emissions for each energy service in the economy, such as heated commercial floor space or person-kilometres travelled. Capital stock is retired based on an age-dependent function, although retrofitting of existing stock is possible when economic or policy conditions justify it. Demand for new capital stock is influenced by an external forecast of economic output and the interaction between energy supply and demand within the macroeconomic module.
E3MC simulates competition among technologies at each energy service node by comparing their costs and applying technology-specific constraints, such as market share limits due to physical, technical, or regulatory barriers. Technology choices reflect both financial costs and observed consumer and business preferences, based on historical patterns of technology adoption.
A1.2.4 Model strengths and limitations
While E3MC is a sophisticated analytical tool, no model can fully capture the complex interactions that occur within and between markets, or between firms and consumers, in response to specific policy measures.
E3MC has a broad model boundary that reflects the intricate relationships among producers, consumers, and the environment across all energy sectors in Canada. It features an explicit causal structure that helps explain observed behavioural patterns and captures capital stock dynamics. Its calibration to Canadian data adds flexibility and realism to the modelling of energy and environmental policies.
Although E3MC is not a computable general equilibrium (CGE) model, when its energy and macroeconomic components are run in an integrated and dynamic fashion, it functions similarly. In this configuration, all markets in both models return to equilibrium following a policy or price shock.
However, E3MC has limitations. The macroeconomic model relies on fixed inter-industry relationships based on the NAICS, and behavioural equations are derived from historical data. Additionally, the model incorporates endogenous technological change only to a limited extent via generic learning-by-doing parameters, meaning it may not fully capture market dynamics in response to policies that influence innovation or behavioural shifts.
To address these limitations, ECCC complements E3MC with other modelling tools, including Canadian and international CGE models, to support policy design and analysis.
A1.3 Key assumptions
The projections in this report were generated using ECCC’s E3MC model, which consists of two main components: ENERGY 2020 and Oxford Economics’ NAEM. ENERGY 2020 models Canada’s energy supply and demand, and NAEM is a regional macroeconomic model. NAEM operates at the regional level and is based on the current Canadian System of Macroeconomic Accounts.
As noted in Section A1.6.4, projections for the LULUCF accounting contribution are developed separately using a suite of specialized models.
A1.3.1 Historical data and key assumptions
Each year, ECCC updates its models using the most recent data available from Statistics Canada's Report on Energy Supply and Demand in Canada and Canada’s NIR. Historical GHG emissions are aligned with the latest NIR data. For these projections, the most recent historical year available was 2023.
The projections incorporate expert-informed expectations for key drivers such as world oil prices and reflect the latest energy and economic data. Modelling assumptions are aligned with perspectives from the Government of Canada as well as provincial and territorial governments.
The following groups within the federal government provided key datasets and analytical support:
- ECCC’s Science and Technology Branch: historical GHG and air pollutant emissions, HFCs, and LULUCF sector data
- AAFC: Agriculture emissions and LULUCF data
- CER: oil and gas production figures and wholesale price data
- NRCan: historical energy use, mining sector data, and LULUCF
- Statistics Canada: energy supply and demand statistics, macroeconomic indicators
- Transport Canada: ZEV forecast
Future trends in Canada’s GHG and air pollutant emissions are influenced by many factors. Changes in any of these assumptions could significantly affect the emissions outlook.
These factors include:
- macroeconomic considerations: economic growth, population, household formation
- energy prices: world oil prices, refined petroleum products, regional natural gas, and electricity
- technological change
- policy decisions
Oil and natural gas price and production projections are based on a preliminary version of the CER’s Current Measures scenario, to be published in Canada's Energy Future report in early 2026. The CER is an independent federal agency that regulates international and interprovincial aspects of the oil, gas, and electricity sectors.
The WM scenario incorporates the best available information on economic growth, energy demand, and supply. It reflects the projected impacts of future goods and services production in Canada on GHG emissions. To explore a range of possible outcomes, alternate pathways for key emissions drivers were modelled. The WM scenario represents the mid-range of these variations and remains conditional on future developments in the economy, global energy markets, and government policy. Assumptions and key drivers are detailed in this section, with alternative cases explored in Section 2.5.1.
A1.3.2 Macroeconomic assumptions and key economic drivers
The economic and demographic projections in this report are grounded in a structured methodology that draws from both historical data and expert consultations. Economic and household projections are developed through consultations and updates to the macroeconomic model’s historical database. Major indicators are aligned to Budget 2025, and changes to international tariff policies in 2025 through August 2025 are included.
Historical data on key indicators such as GDP, inflation, labour force participation, and population demographics are sourced from Statistics Canada. Population projections rely on provincial and territorial estimates where available, or on Statistics Canada’s medium-growth scenario when such estimates are not provided. These demographic trends, including changes in age distribution and household formation, play a significant role in shaping energy demand and economic activity.
Over the past two decades, the Canadian economy has experienced moderate growth, despite periods of global economic disruption. This trend is expected to continue, with real GDP growth projected to remain steady, though relatively slower than previous projections, over the long term. Labour productivity is anticipated to improve slightly compared to historical averages, supported by ongoing capital formation. This, in turn, contributes to a gradual rise in real disposable personal income.
Population and household growth is expected to slow over time, reflecting broader demographic shifts. These trends are detailed in Table A1.
| Selected Indicators | 2006-2024 | 2025-2030a | 2031-2035a | 2025-2030b | 2031-2035b |
|---|---|---|---|---|---|
| Real GDP | 1.74% | 1.63% | 1.60% | 1.63% | 1.63% |
| Population | 1.31% | 0.62% | 0.84% | 0.62% | 0.84% |
| Labour | 1.31% | 1.02% | 1.10% | 1.02% | 1.10% |
| Consumer Price Index | 2.17% | 2.02% | 2.00% | 2.02% | 2.01% |
| Households | 1.40% | 0.62% | 0.83% | 0.62% | 0.83% |
Note: Historical data up to 2024 are sourced from Statistics Canada (except for Households); Households historical data is sourced from E3MC. All projections data from 2025 to 2035 are from E3MC. Access more data on the open data portal.
a Projections under the WM scenario.
b Projections under the WAM scenario.
The WAM scenario has a similar economic outlook overall when compared to the WM scenario. Regionally, WAM results are somewhat different than the WM scenario, due to different regional policies.
A1.3.3 Energy Prices and Supply
A.1.3.3.1 World crude oil and North American natural gas prices
The methodology for projecting GHG emissions incorporates assumptions about future global oil and natural gas prices, key drivers of Canadian fossil fuel production. Since Canada’s production levels are relatively small in the global context, it is considered a price taker. This means that it responds to, rather than influences, international market prices. The projections use the preliminary Energy Future 2026 oil and gas price assumptions developed by the CER, and include sensitivity analyses that explore a range of price scenarios (Section 2.5.1).
These energy price assumptions underpin the WM and WAM scenarios. Detailed assumptions and projections are available in Table A2.
| Assumption | 2005 | 2023 | 2026a | 2030a | 2035a | 2026b | 2030b | 2035b |
|---|---|---|---|---|---|---|---|---|
| Oil Price WTI (2023 US$/bbl) | 87.12 | 77.66 | 68.56 | 68.56 | 68.56 | 68.56 | 68.56 | 68.56 |
| Oil Price WCS (2023 US$/bbl) | 56.44 | 60.14 | 56.62 | 56.62 | 56.62 | 56.62 | 56.62 | 56.62 |
| Natural Gas Price (2023 US$/MMBtu) | 13.09 | 2.54 | 3.82 | 4.02 | 4.27 | 3.82 | 4.02 | 4.27 |
| CPI (2002 = 100) | 106.97 | 157.11 | 167.51 | 181.32 | 200.18 | 167.51 | 181.32 | 200.24 |
Note: Historical data up to 2023, Consumer Price Index (CPI) historical data up to 2024 are sourced from Statistics Canada. Prices data from 2024 to 2035 are from CER’s Current Measures scenario forecast (preliminary 2026 Energy Future report – EF2026). CPI projection data from 2025 to 2035 are from E3MC; the CPI estimate for the WAM scenario is estimated. Access more data on the open data portal.
a Projections under the WM scenario.
b Projections under the WAM scenario.
North American crude oil prices are primarily tied to the West Texas Intermediate (WTI) benchmark. Increased regional supply and infrastructure constraints have caused WTI prices to diverge from global benchmarks like Brent. Western Canada Select (WCS), represents heavy crude oil, which typically trades at a discount to WTI due to its lower quality and limited access to international markets. This price differential has fluctuated over time in response to global supply conditions and domestic policy interventions. Figure A2 illustrates historical and projected trends for both WTI and WCS prices.
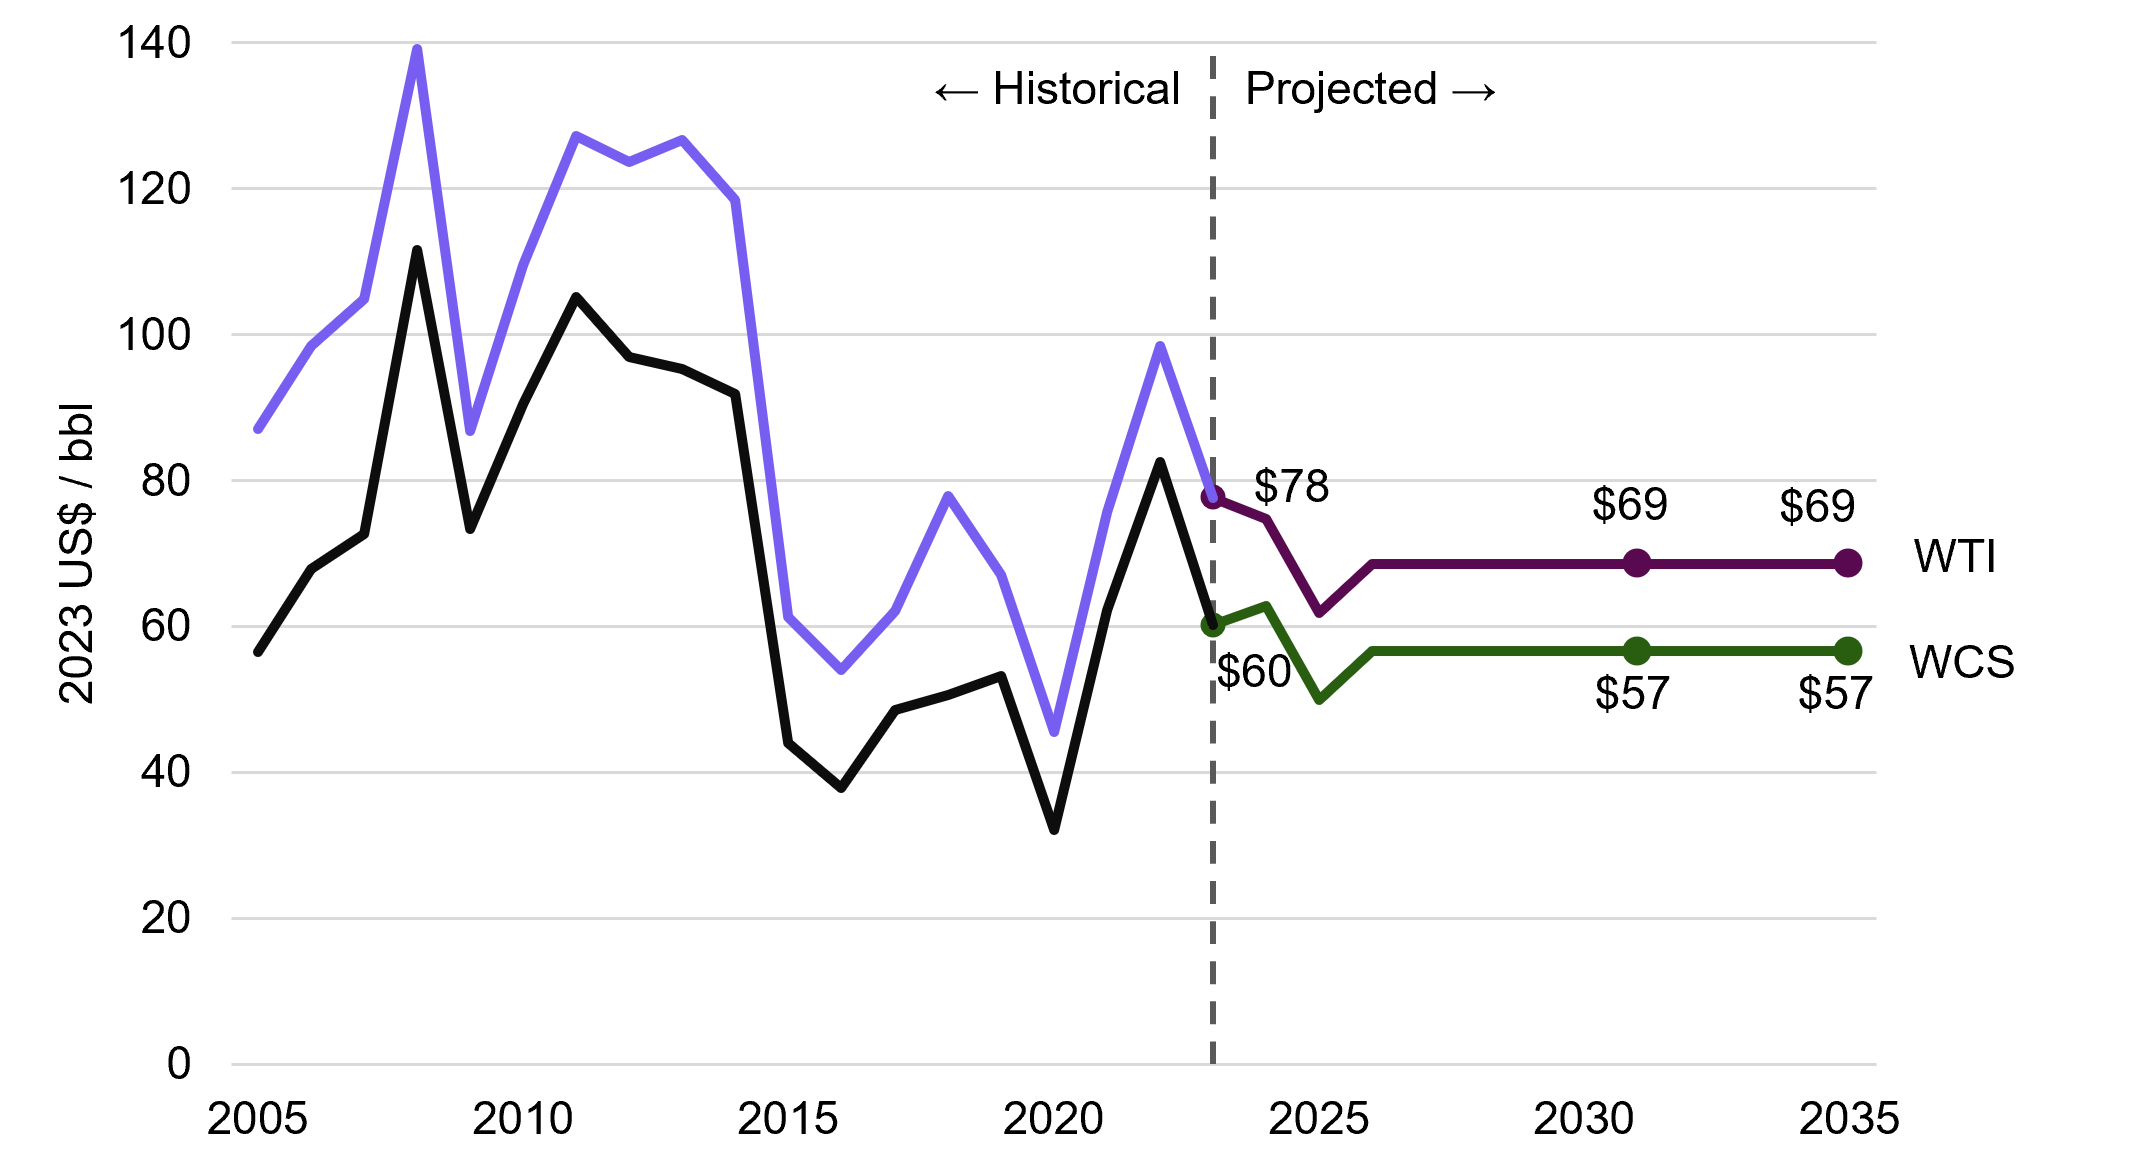
Note: Access more data on the open data portal. 2023 US$ values reported from the CER.
Source: CER’s Current Measures scenario forecast (preliminary 2026 Energy Future report – EF2026)
Long description
| Year | WTI | WCS | WTI History | WCS History |
|---|---|---|---|---|
| 2005 | - | - | $87 | $56 |
| 2006 | - | - | $98 | $68 |
| 2007 | - | - | $105 | $73 |
| 2008 | - | - | $139 | $112 |
| 2009 | - | - | $87 | $73 |
| 2010 | - | - | $110 | $90 |
| 2011 | - | - | $127 | $105 |
| 2012 | - | - | $124 | $97 |
| 2013 | - | - | $127 | $95 |
| 2014 | - | - | $118 | $92 |
| 2015 | - | - | $61 | $44 |
| 2016 | - | - | $54 | $38 |
| 2017 | - | - | $62 | $49 |
| 2018 | - | - | $78 | $51 |
| 2019 | - | - | $67 | $53 |
| 2020 | - | - | $45 | $32 |
| 2021 | - | - | $76 | $62 |
| 2022 | - | - | $98 | $82 |
| 2023 | $78 | $60 | $78 | $60 |
| 2024 | $75 | $63 | - | - |
| 2025 | $62 | $50 | - | - |
| 2026 | $69 | $57 | - | - |
| 2027 | $69 | $57 | - | - |
| 2028 | $69 | $57 | - | - |
| 2029 | $69 | $57 | - | - |
| 2030 | $69 | $57 | - | - |
| 2031 | $69 | $57 | - | - |
| 2032 | $69 | $57 | - | - |
| 2033 | $69 | $57 | - | - |
| 2034 | $69 | $57 | - | - |
| 2035 | $69 | $57 | - | - |
The CER also provides projections for the price gap between light and heavy crude. This is expected to remain relatively stable in the near term before widening later in the forecast period. Improvements in pipeline infrastructure, such as the completion of major projects in Western Canada, are expected to ease transportation bottlenecks and support more stable pricing.
Natural gas prices, represented by the Henry Hub benchmark, have declined over the past several decades. This is largely due to increased supply from unconventional extraction methods like hydraulic fracturing. Although global prices experienced short-term spikes due to geopolitical events, they dipped in 2023 because of warmer than average temperatures combined with high production. They are expected to rise gradually above 2023 levels over the long term as global supply and demand rebalance. Figure A3 provides a visual summary of these historical and projected price trends.
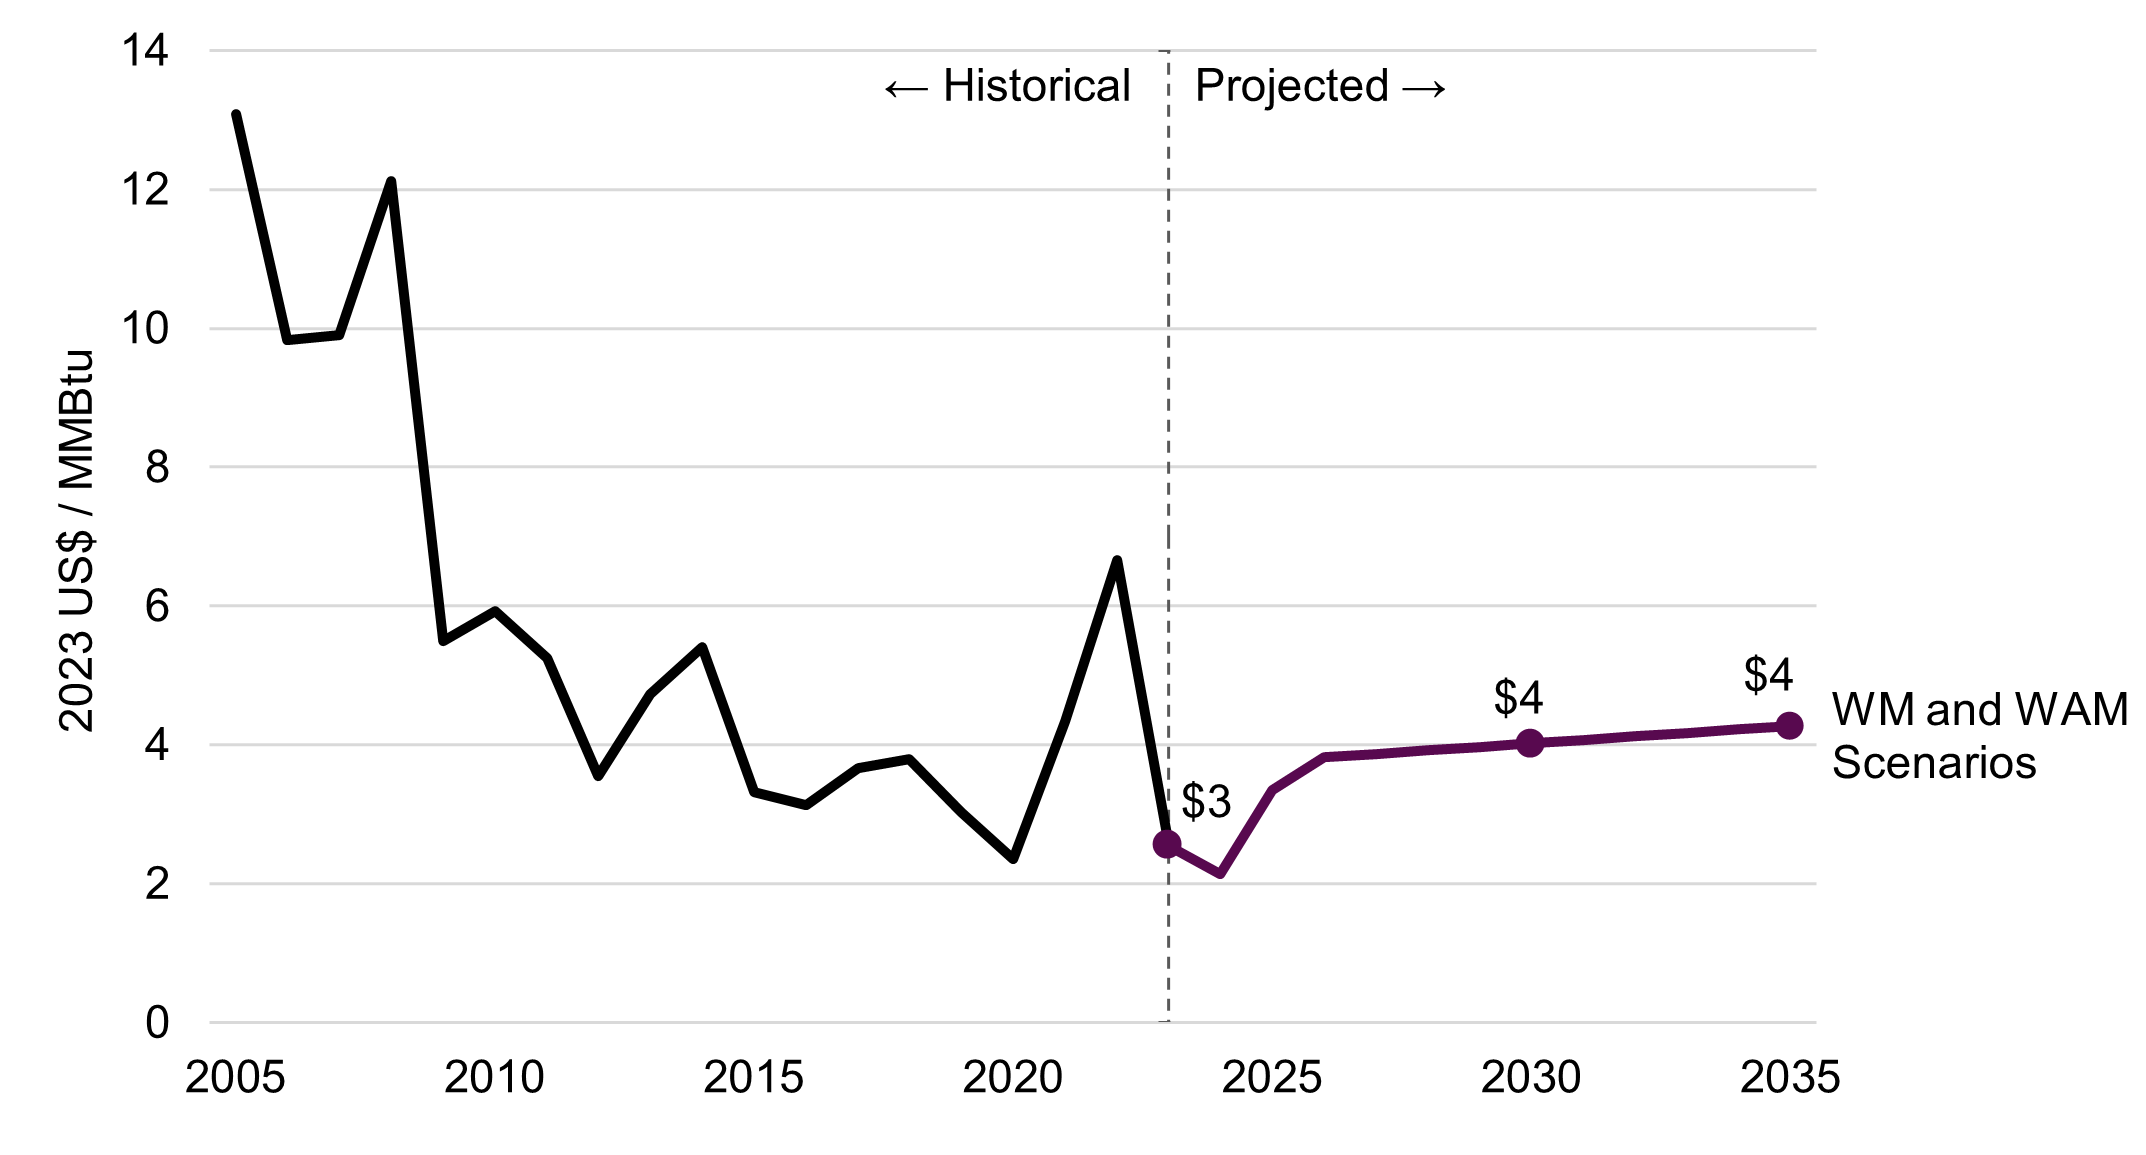
Note: Access more data on the open data portal. 2023 US$ values are converted from the 2023 US$ values reported from the CER.
Source: CER’s Current Measures scenario forecast (preliminary 2026 Energy Future report – EF2026)
Long description
| Year | WM and WAM Scenarios | History |
|---|---|---|
| 2005 | - | $13 |
| 2006 | - | $10 |
| 2007 | - | $10 |
| 2008 | - | $12 |
| 2009 | - | $5 |
| 2010 | - | $6 |
| 2011 | - | $5 |
| 2012 | - | $4 |
| 2013 | - | $5 |
| 2014 | - | $5 |
| 2015 | - | $3 |
| 2016 | - | $3 |
| 2017 | - | $4 |
| 2018 | - | $4 |
| 2019 | - | $3 |
| 2020 | - | $2 |
| 2021 | - | $4 |
| 2022 | - | $7 |
| 2023 | $3 | $3 |
| 2024 | $2 | - |
| 2025 | $3 | - |
| 2026 | $4 | - |
| 2027 | $4 | - |
| 2028 | $4 | - |
| 2029 | $4 | - |
| 2030 | $4 | - |
| 2031 | $4 | - |
| 2032 | $4 | - |
| 2033 | $4 | - |
| 2034 | $4 | - |
| 2035 | $4 | - |
A.1.3.3.2 Oil and gas supply
The methodology for projecting oil and natural gas production draws on preliminary forecasts from the CER’s Energy Futures 2026 report, which will be released in 2026. These projections incorporate updated modelling approaches used by CER, including a new gas deliverability model that accounts for revenues from Natural Gas Liquids (NGL) when evaluating well profitability. This allows for a more nuanced understanding of production trends, particularly under varying price conditions. The projections also reflect announced industry developments and infrastructure expansions, such as expansion of LNG capacity and new pipelines, which are expected to influence production capacity and market access.
The CER’s outlook indicates a shift in Canada’s Oil and Gas sector. Production from unconventional sources is expected to outpace that from conventional reserves. This transition is driven by the depletion of conventional resources and accelerated by advancements in extraction technologies, particularly in the resource-rich Montney formation.
Oil sands production is projected to increase, particularly from in-situ extraction, with a 19% increase in 2030 above 2023 levels. The start-up of major pipeline projects is expected to alleviate transportation constraints, enabling greater access to international markets and stimulating further investment and drilling activity. These trends are detailed in the table below.
| Subsector | 2005 | 2023 | 2026a | 2030a | 2035a | 2026b | 2030b | 2035b |
|---|---|---|---|---|---|---|---|---|
| Crude and Condensates | 1 525 | 1 976 | 2 189 | 2 227 | 2 284 | 2 190 | 2 237 | 2 302 |
| Conventional Heavy | 414 | 486 | 485 | 472 | 441 | 486 | 474 | 448 |
| Conventional Light | 622 | 663 | 708 | 725 | 729 | 708 | 733 | 741 |
| C5 and Condensates | 165 | 741 | 856 | 879 | 918 | 856 | 880 | 918 |
| Frontier Light (offshore + northern) | 324 | 85 | 139 | 150 | 196 | 139 | 150 | 196 |
| Oil Sands | 1 065 | 3 403 | 3 616 | 3 797 | 3 936 | 3 617 | 3 802 | 3 952 |
| Oil Sands: Primary | 150 | 203 | 217 | 234 | 240 | 218 | 234 | 241 |
| Oil Sands: In Situ | 288 | 1 552 | 1 677 | 1 827 | 1 904 | 1 678 | 1 830 | 1 914 |
| Oil Sands In Situ: Steam - assisted Gravity Drainage | 84 | 1 329 | 1 435 | 1 563 | 1 631 | 1 435 | 1 565 | 1 635 |
| Oil Sands In Situ: Cyclic Steam Stimulation | 204 | 223 | 242 | 264 | 273 | 243 | 265 | 279 |
| Oil Sands: Mining | 627 | 1 648 | 1 721 | 1 736 | 1 792 | 1 722 | 1 738 | 1 797 |
| Total Production (gross) | 2 590 | 5 378 | 5 805 | 6 024 | 6 220 | 5 807 | 6 039 | 6 253 |
Note: Numbers may not sum to the total due to rounding. Historical data up to 2023. Data from 2024 to 2035 are modelled projections. Access more data on the open data portal.
a Projections under the WM scenario.
b Projections under the WAM scenario.
Source: Statistics Canada, CER’s Current Measures scenario forecast (preliminary 2026 Energy Future report – EF2026).
Oil sands output consists of two main products: synthetic crude oil and non-upgraded bitumen. Synthetic crude oil is upgraded bitumen, whereas non-upgraded bitumen, is typically sold as heavy oil. While synthetic crude production is expected to remain relatively stable, constrained by existing upgrading capacity, non-upgraded bitumen is projected to grow steadily over the forecast period. This reflects a broader market preference and infrastructure alignment for heavy crude exports, particularly to US refineries. Table A4 provides a breakdown of these production trends.
| Subsector | 1990 | 2005 | 2023 | 2026a | 2030a | 2035a | 2026b | 2030b | 2035b |
|---|---|---|---|---|---|---|---|---|---|
| Oil Sands (gross) | 393 | 1 065 | 3 403 | 3 616 | 3 797 | 3 936 | 3 617 | 3 802 | 3 952 |
| Oil Sands (net) | 348 | 979 | 3 284 | 3 493 | 3 681 | 3 824 | 3 494 | 3 683 | 3 834 |
| Oil Sands (net): Synthetic Crude Oil | 209 | 613 | 1 257 | 1 369 | 1 369 | 1 369 | 1 371 | 1 383 | 1 420 |
| Oil Sands (net): Non-Upgraded Bitumen | 139 | 365 | 2 027 | 2 124 | 2 312 | 2 455 | 2 123 | 2 300 | 2 414 |
| Own Use | 45 | 87 | 118 | 123 | 116 | 112 | 123 | 120 | 118 |
Note: Numbers may not sum to the total due to rounding. Historical data up to 2023. Data from 2024 to 2035 are modelled projections. Access more data on the open data portal.
a Projections under the WM scenario.
b Projections under the WAM scenario.
Source: Statistics Canada, CER’s Current Measures scenario forecast (preliminary 2026 Energy Future report – EF2026).
Natural gas production is also expected to grow, and even when natural gas prices are relatively low, higher NGL revenues can sustain drilling activity. Growth is anticipated from unconventional sources including shale gas and tight gas formations, which continue to offset declines in conventional production. Table A5 outlines these projections.
| Subsector | 1990 | 2005 | 2023 | 2026a | 2030a | 2035a | 2026b | 2030b | 2035b |
|---|---|---|---|---|---|---|---|---|---|
| Natural Gas Supply | 4.92 | 6.72 | 7.65 | 8.08 | 8.72 | 9.39 | 8.08 | 8.72 | 9.39 |
| Marketable Gas | 4.89 | 6.39 | 6.65 | 7.05 | 7.66 | 8.34 | 7.05 | 7.66 | 8.34 |
| Marketable Gas: Natural Gas Production (gross) | 4.89 | 7.73 | 7.89 | 8.28 | 8.96 | 9.72 | 8.28 | 8.98 | 9.74 |
| Marketable Gas: Own Use | 0.00 | -1.34 | -1.24 | -1.23 | -1.30 | -1.38 | -1.23 | -1.32 | -1.40 |
| Imports | 0.02 | 0.34 | 0.99 | 1.02 | 1.06 | 1.06 | 1.02 | 1.06 | 1.06 |
| Liquefied Natural Gas Production | 0.00 | 0.00 | 0.00 | 0.53 | 0.95 | 1.66 | 0.53 | 0.95 | 1.66 |
Note: Numbers may not sum to the total due to rounding. Historical data up to 2023 are sourced from NIR2025. Data from 2024 to 2035 are modelled projections developed using ECCC’s analytical framework and CER’s Current Measures scenario forecast (preliminary 2026 Energy Future report – EF2026). Access more data on the open data portal.
a Projections under the WM scenario.
b Projections under the WAM scenario.
The expansion of the LNG sector in both Canada and the US is another key driver of natural gas production. Increased demand for natural gas as feedstock for LNG facilities supports continued investment and development in the sector. Despite the temporary 2023 dip in prices, higher projected natural gas prices and growing demand from Asian markets are expected to reinforce this trend, contributing to long-term production growth.
A.1.3.3.3 Electricity supply and demand
The methodology for projecting electricity demand and supply is based on how different economic sectors use electricity and how that demand evolves over time. Electricity is used to meet needs in sectors such as Heavy Industry, Buildings and Transportation and electricity demand is influenced by factors like energy prices, technology adoption, energy efficiency improvements, policy measures, and economic growth. Electricity supply considers each province and territory’s generation mix, planned infrastructure changes, industrial generation, and electricity trade with other regions. Government policies, including federal regulations and provincial renewable energy targets, also play a significant role in shaping the electricity supply outlook.
Electricity demand is expected to increase steadily over the projection period. This growth is driven by rising electrification and economic activity, primarily from electric vehicle adoption, LNG production, data centre operations, and iron and steel manufacturing which outpace improvements in energy efficiency which are mainly observed in the Buildings sector. Updated assumptions have been included in the WM scenario to better represent the rapid growth of electricity demand from data centres. More precisely, data centre electricity demand increases from 3 terawatt hours (TWh) in 2025 to 11 TWh in 2030 and eventually reaches the level of 16 TWh in 2035.Utility generation expands to meet this demand, especially wind and nuclear power generation. Electricity trade with the United States also increases, although Canada continues to export more electricity than it imports. These trends are detailed in Table A6.
| Category | 2005 | 2023 | 2026a | 2030a | 2035a | 2026b | 2030b | 2035b |
|---|---|---|---|---|---|---|---|---|
| Electricity Required (Total) | 602 | 618 | 633 | 681 | 752 | 636 | 686 | 753 |
| Total Gross Demand* | 546 | 558 | 569 | 614 | 665 | 568 | 613 | 664 |
| Energy Storage | 0 | 0 | 2 | 4 | 8 | 2 | 4 | 8 |
| Net Exports | 24 | 27 | 30 | 29 | 43 | 33 | 34 | 44 |
| Losses | 32 | 32 | 32 | 34 | 37 | 32 | 34 | 37 |
| Electricity Produced (Total) | 614 | 617 | 632 | 679 | 747 | 634 | 683 | 748 |
| Utility Generation (Emitting**) | 131 | 77 | 73 | 56 | 38 | 76 | 62 | 39 |
| Utility Generation (Non-Emitting***) | 421 | 459 | 472 | 525 | 615 | 472 | 523 | 613 |
| Industrial Generation (Emitting) | 20 | 48 | 49 | 53 | 48 | 49 | 53 | 50 |
| Industrial Generation (Non-Emitting) | 41 | 33 | 38 | 45 | 46 | 38 | 45 | 46 |
Note: Numbers may not sum to the total due to rounding. Access more data on the open data portal.
a Projections under the WM scenario.
b Projections under the WAM scenario.
* Includes electricity purchased from grid and own use.
** Includes electricity generated from coal, coke, refined petroleum products, and natural gas sources.
*** Includes electricity generated from nuclear, hydro, biomass, solar, waste and wind sources.
A1.3.4 Agriculture sector assumptions
Historical and projected emissions estimates for crop production, animal production, and on-farm fuel use, are developed by AAFC. These data are used to calculate annual growth rates. These growth rates are then applied to 2023 historical data to project emissions through to 2035.
| Agricultural Output 2010-2015 | 2015-2020 | 2020-2025 | 2025-2030 | 2030-2035 | |
|---|---|---|---|---|---|
| Total Crops | 2.08 | 0.33 | -0.25 | 0.17 | 0.10 |
| Total Cattle | -1.62 | 0.29 | -1.51 | 0.30 | 0.21 |
| Total Hogs | 0.15 | 0.95 | -0.27 | 0.01 | 0.02 |
| Total Poultry | 1.84 | 3.46 | 2.39 | 1.72 | 2.05 |
Note: Historical data up to 2023. Data from 2024 to 2035 are projected. Access more data on the open data portal.
Source: AAFC
A1.3.5 Emissions factors
Table A8 provides approximate estimates of carbon dioxide equivalent emissions per unit of energy consumed. These estimates are categorized by fossil fuel type for both combustion and industrial processes. The values are based on the most recent available data. However, actual emission factors can vary by year, sector, and province.
Fuel CO2 eq Emission Factor (g/MJ)
| Aviation Gasoline | 73.04 |
|---|---|
| Biodiesel | 5.24 |
| Biomass | 2.77 |
| Coal | 91.51 |
| Coke | 110.28 |
| Coke Oven Gas | 36.71 |
| Diesel | 71.24 |
| Ethanol | 2.07 |
| Gasoline | 71.75 |
| Heavy Fuel Oil | 75.28 |
| Jet Fuel | 69.31 |
| Kerosene | 68.12 |
| Light Fuel Oil | 71.16 |
| LPG | 36.90 |
| Lubricants | 57.72 |
| Naphtha Specialties | 17.77 |
| Natural Gas | 49.44 |
| Natural Gas Raw | 57.17 |
| Other Non-Energy Products | 36.41 |
| Petrochemical Feedstocks | 14.22 |
| Petroleum Coke | 83.95 |
| Renewable Natural Gas | 0.30 |
| Still Gas | 49.52 |
| Waste | 90.61 |
A1.4 Reallocation of IPCC category emissions
Volume 1, Chapter 8 of the 2006 IPCC Guidelines groups emissions and removals into five main sectors: Energy; Industrial Processes and Product Use; Agriculture, Forestry and Other Land Use, Waste, and Other. These sectors are further divided into categories and subcategories.
In general, the reallocation of emissions from IPCC categories to Canadian economic sectors involves aggregating emissions from stationary combustion, fugitive sources, transportation, industrial processes, agriculture and waste into the appropriate economic sector. In many cases, the stationary combustion emissions for specific IPCC categories are the same as that for the corresponding economic sector with some notable exceptions:
- utility-owned cogeneration facilities:
- emissions are moved from the Electricity category to their respective economic sectors (such as natural gas production, oil sands, mining, pulp and paper, chemicals and fertilizers, service industry, and light manufacturing) based on data from the Annual Survey of Electric Power Thermal Generating Station Fuel Consumption
- manufacturing:
- lime and gypsum is split out of the IPCC category “Other Manufacturing” and reported as a separate economic sector, while other industries in the IPCC’s “Other Manufacturing” category are grouped under Light Manufacturing (e.g., automotive, textiles, food and beverage)
- pipeline transport:
- emissions from fuel used in pipeline transport are split between Oil and Natural Gas Transmission and Natural Gas Distribution, using data from an upstream oil and gas study
- mining and upstream oil and gas:
- emissions from the IPCC’s Mining and Upstream Oil and Gas Production category are redistributed across sectors such as Coal Production, Oil Sands, and various oil production types
- a variety of external data sources are used to estimate emissions for the appropriate sectors which are then re-proportioned to align with Canada’s energy balance
- transportation:
- emissions from road, rail, marine, and air transport are divided into passenger and freight components
- off-road transport emissions are reassigned to relevant economic sectors and to the “Other Transportation” category in the Transportation sector
- carbon capture:
- carbon dioxide captured from waste streams at large industrial facilities is presented separately in as a negative number in the relevant economic sector
- the source of the carbon dioxide emissions for the sector is displayed as a gross amount
- process and product use:
- emissions from mineral, chemical, and metal production are allocated to Heavy and Light Manufacturing. HFCs and other fluorinated gases are assigned mainly to Transport and Buildings
- emissions from non-energy product use and solvents are distributed across multiple sectors
- other product-related emissions are mainly allocated to Electricity and commercial buildings
Once all these sector-specific fuel consumption estimates are compiled, the data are reconciled by province and by fuel with the fuel consumption data from the Report on Energy Supply and Demand. This ensures that the economic sector estimates match the IPCC category estimates.
A more detailed description of Canada’s economic sectors and how they are reconciled with IPCC categories can be found in Annex 10 of NIR2025. This Annex includes the following relevant tables:
- Table A10-1 includes a description of Canadian economic sectors
- Table A10-2 provides descriptions of the Canadian economic sectors
- Table A10-3 outlines the relationship between Canadian economic sectors and IPCC categories
A1.5 Export-related emissions
Refinery crude streams volumes from Wood Mackenzie’s Refinery Benchmarking Tool in conjunction with production and import/export data from the CER, Alberta Energy Regulator and Statistics Canada were used to calculate net crude oil exports for 2023. Net crude oil exports for projected years were determined by adding in any changes to projected production to the 2023 net crude export value. The share of net exports as a function of production was applied to total historic and projected GHGs from oil sectors to generate net export emissions from provinces with net oil exports. Imported emissions in provinces with net oil imports were determined by multiplying imported volumes by life-cycle analysis emission intensities reported in a 2023 report commissioned by the National Ocean Industries Association. Imported emissions were netted out from net emissions calculated from provinces with net oil exports to determine national net export emissions.
Statistics Canada and CER import/export and production data on natural gas were used to calculate national net export shares as a function of production. These shares were then applied to total GHGs from natural gas production and processing subsectors, except for natural gas distribution.
A1.6 Land use, land-use change and forestry
This section outlines the methodologies used to project future GHG fluxes and explains the accounting frameworks applied under international reporting standards to account for net GHG fluxes (GHG emissions and carbon removals and transfers) from the LULUCF sector. It consolidates information that was previously dispersed across multiple reports into a single, accessible narrative that supports both transparency and technical rigour. The LULUCF sector includes managed lands such as forests, croplands, wetlands, grasslands, and settlements, as well as HWP and land conversion activities.
A1.6.1 Overview and role of LULUCF in emissions accounting
Canada currently produces GHG flux projections for FLFL and associated HWP, afforestation (conversion of other land categories to forest land), forest conversion (conversion of forest land to other land categories), and associated HWP, and carbon sequestration in agricultural soils. This report includes projections of the LULUCF accounting contribution for subcategories, or components of subsectors, where net GHG flux projections are available.
Work is ongoing to expand the scope of LULUCF projections to include additional components, such as fluxes from managed peatlands and wetland disturbances in the oil sands region in Canada. Future updates will also aim to integrate the GHG impacts of NBCS and agriculture measures into net flux and accounting estimates. Continued development of projections for the remaining subsectors will rely on sound methodologies and a strong understanding of the key drivers of change.
Table A9 outlines the scope of LULUCF reporting in Canada’s NIR and the corresponding accounting coverage used for the 2030 and 2035 emissions reduction targets.
| Land Category | Included in National GHG Inventory Reporting | Included in Accounting Contribution Emissions Reductions Targets* |
|---|---|---|
| Forest Land | Yes | Yes |
| Cropland | Yes | Yes |
| Grassland | Yes | Yes |
| Wetlands | Yes | Yes |
| Settlements | Yes | Yes |
| Harvested Wood Products | Yes | Yes |
| Other Lands | Yes | No |
* Consistent with both NDCs, under the Paris Agreement, Canada intends to account for LULUCF in 2030 and 2035. However, projections are not yet available for all subsectors. The scope of accounting for this report therefore reflects the current availability of data (Section A1.6.3).
A1.6.2 Accounting framework and approaches
Canada applies two accounting approaches within the LULUCF sector. The RL approach is used for FLFL and associated HWP, and the Net-net approach is applied to all other LULUCF categories.
When developing the accounting contribution from the LULUCF sector, Canada uses the GHG inventory categories established by the UNFCCC and, where possible, applies accounting methods consistent with those used for non-LULUCF sectors. Due to the unique characteristics of FLFL, including the influence of past management practices and natural disturbances, which create significant age-class legacy effects, Canada applies the RL approach to account for GHG fluxes from FLFL and associated HWP. This internationally accepted method isolates the impact of human-induced changes by removing the influence of legacy effects.
Under the RL approach, Canada first defines a reference level that represents a projection of GHG flux assuming a continuation of historical forest management practices. Actual or projected GHG flux is then compared to this reference level. The resulting difference, referred to as the accounting contribution, reflects the impact of recent forest management activities, such as changes in harvest rates. This methodology, which excludes afforested land, is consistent with the principles of the UNFCCC and emphasizes recent anthropogenic influences on GHG fluxes.
In its 2012 submission to the UNFCCC, Canada stated its intent to include the LULUCF sector in accounting toward its 2020 target, while excluding GHG fluxes from natural disturbances. As discussed in Section A1.6.4, Canada has implemented an approach to estimate anthropogenic GHG fluxes from FLFL since its Fourth Biennial Report, where emissions from forest stands dominated by natural disturbances are tracked separately in the NIR. Canada's enhanced NDCs for 2030 and 2035 reaffirm this approach.
In 2023-24, Canada conducted a review of its GHG accounting approach for the LULUCF sector, with specific focus on FLFL and associated HWP accounting. Based on internal analysis and on feedback received from stakeholders and experts, the Government of Canada made the decision to maintain the current approach that applies reference level accounting to FLFL and the associated HWP and net-net accounting to all other land categories, while continuing to monitor developments related to LULUCF accounting.
A.1.6.2.1 Reference level approach
The RL approach is consistent with methodologies used in Canada’s First, Fourth, and Fifth Biennial Reports, its First Biennial Transparency Report, as well as its enhanced NDC for 2030 and 2035. It also aligns with Canada's Forest Management Reference Levels, which were developed following UNFCCC guidance, submitted in 2011, and reviewed by international experts in 2012. To maintain accuracy, Canada recalculates its RL scenario annually to reflect the most recent historical data available (NIR2025 for this year’s projections).
For reporting purposes, Canada divides its RL approach into two periods: 2010 to 2020 and 2021 to 2035. The first period is based on average harvest activity from 1990 to 2009, with a policy cut-off date of 2009. This ensures that only policies implemented before 2009 are reflected in the RL. The second period uses average activity from 1990 to 2016, with a cut-off date of 2016, the year Canada ratified the Paris Agreement. This structure ensures that each RL period reflects the impact of policy changes implemented after the respective cut-off dates.
In defining future harvest volumes for the RL, Canada considers only those policies and practices in place before the cut-off dates. The Annual Allowable Cut (AAC) sets the maximum sustainable harvest level, but this is influenced by natural disturbances such as wildfires and mountain pine beetle outbreaks. If projected RL harvest volumes exceed what is deemed sustainable, a “sustainability safeguard” is applied to reduce them below the AAC. This conservative measure prevents overestimating the impact of post-cut-off policy changes.
HWP from FLFL are included in the RL using the IPCC Simple Decay approach, with the HWP pool assumed to begin in 1900. The future distribution of HWP across product categories is based on historical shares: 2000 to 2009 for the first RL period and 2007 to 2016 for the second. This ensures consistency with past practices and supports accurate accounting of emissions from wood products over time.
A.1.6.2.2 Net-net approach
The Net-net approach compares actual or projected net GHG flux against a historical reference point to isolate the impact of recent human activities. Canada uses 2005 as the base year, and thus the accounting contribution in a given year is the net GHG flux in that year minus the net GHG flux in 2005. The Net-net approach is used for all land categories and subcategories other than FLFL (not originating from afforestation) and the associated HWP.
A1.6.3 Historical and projected net flux estimates
As described in Chapter 6 of NIR2025, the LULUCF sector reports GHG fluxes between the atmosphere and managed lands in Canada, as well as fluxes associated with land-use changes and the net change in carbon storage from HWP.
Reported fluxes are associated with land-use and land management change (LMC). Reporting on the changes in the pool of carbon associated with HWP aims to consider all fluxes from managed lands. For more detailed information on sources of GHG emissions and carbon removals from LULUCF, see Chapter 6 of NIR2025. The time series of LULUCF sector estimates is available in Table 10 of Canada's 2025 Common Reporting Tables. GHG fluxes from FLFL are further disaggregated by origin (depending on whether the land was initially afforested or not) since each is accounted for using a different accounting approach.
Consistent with the 2019 IPCC Refinement to the 2006 Guidelines for GHG Inventories, Canada employs a Tier 3 approach for estimating anthropogenic GHG fluxes from FLFL. Under this approach, fluxes from managed forest affected by recent significant natural disturbances, such as wildfires and insect infestations, are tracked separately from anthropogenic fluxes. When the recovering forest stands reach commercial maturity or pre-disturbance above-ground biomass, depending on the type of disturbance, they return to the anthropogenic GHG flux category. As a result, the FLFL estimates reported in Canada's NIR represent anthropogenic GHG fluxes only.
Natural disturbances and their GHG fluxes associated with significant disturbance events are also reported separately in the NIR for general information and transparency purposes. For further information, please refer to Chapter 6, Section 6.3.1 and Annex 3.5, Section 3.5.2 of NIR2025.
A.1.6.3.1 Forest Land
Canada's National Forest Carbon Monitoring Accounting and Reporting System (NFCMARS) builds on information in Canada's National Forest Inventory and on additional provincial and territorial forest inventory information. NRCan developed and maintains the Carbon Budget Model of the Canadian Forest Sector (CBM-CFS3) as the core model of NFCMARS. CBM-CFS3 is a Tier 3 forest carbon dynamics estimation tool that is fully consistent with the IPCC inventory guidelines (see section A1.4.4 for more information).
NFCMARS provides annual estimates of GHG fluxes as affected by forest management, natural disturbances, and land-use change. In collaboration with the Canadian Space Agency, NRCan uses remote sensing and other data to monitor areas disturbed by wildfires and maintains a deforestation monitoring program to estimate the area annually affected by conversion of forest to non-forest land uses. NFCMARS has been in place since 2006 and is described in detail in NIR2025.
The projections presented here are generated using NFCMARS and are based on assumptions about future human activities, ensuring consistency with historical emission estimates. For FLFL, projections follow the same methodologies used in NIR2025. Harvesting is the most significant human activity affecting this subcategory. Canada’s projections rely on the most recent projected harvest estimates from provincial and territorial governments. Due to the high variability of natural disturbances from year to year, projections from 2023 onward assume that wildfire occurs at the average annual rate of area burned from 1990 to 2023. GHG fluxes from severe natural disturbances and subsequent regrowth are tracked separately to isolate the effects of human activities.
In NIR2024, major recalculations for pre-1990 forest land disturbances occurred after a review of the entire harvested land base had been completed. As a result, activity data on historical harvest areas (1890 to 1989) were updated. While this had a significant impact on historical GHG fluxes, it has little impact on projected GHG fluxes and reference level estimates because of the timeframe of the updated activity data.
For land converted to forest land (LFL), projections are based on historical averages, consistent with NIR2025, and include the projected GHG impact of afforestation from the 2 Billion Trees program (as estimated prior to Budget 2025 announcements). However, due to the lack of LFL activity data from 2019 onward, projections conservatively assume no afforestation beyond 2019, except for that funded under the 2 Billion Trees Program. This conservative assumption likely underestimates LFL removals from 2019 onward and, consequently, Canada’s progress towards its emissions reductions targets. These projections are expected to evolve as planned enhancements to LFL estimates are implemented and incorporated into future NIRs.
Wetlands managed for forestry are currently excluded from the Forest Land subsector. Efforts are underway to develop appropriate activity data and estimation methods for future inclusion.
Forest Land projections are impacted by a recent change to the approach for reporting harvested biomass carbon, implemented in NIR2025. Please refer to Section A.1.6.3.7 for additional details.
A.1.6.3.2 Cropland
GHG estimates for CLCL are generated AAFC using two models: the Canadian Regional Agriculture Model (CRAM) and the Canadian Agricultural Greenhouse Gas Monitoring Accounting and Reporting System (CanAG-MARS). CRAM estimates resource use patterns in the Agriculture sector for projections, which are then input into CanAG-MARS to calculate the net GHG flux. More detail on both models is provided in Section A1.6.4.
CRAM is a static partial equilibrium economic model that provides a detailed characterization of agriculture activities in Canada. CRAM's features include coverage of all major cropping activities, livestock production and some processing, detailed provincial or sub-provincial breakdown of activities and a detailed breakdown of cropping production practices including choice of tillage regime, use of summer fallow, and stubble. CRAM is calibrated to the 2016 Census of Agriculture and all resource use patterns are aligned to the census. As CRAM is a static model, crop and livestock production estimates from AAFC's Medium-Term Outlook are used to set future resource use patterns for 2025, 2030, and 2035.
The amount of organic carbon retained in soil represents the balance between the rate of primary production (carbon transfer from the atmosphere to the soil) and soil organic carbon decomposition (carbon transfer from the soil to the atmosphere). How the soil is managed can determine whether the amount of organic carbon stored is increasing or decreasing. The estimation procedure is based on the premise that primary production and changes in soil management influence the rate of soil carbon gains or losses in soils over time.
Carbon emissions and removals from changes in soil management on mineral soils are estimated by applying country-specific, spatially disaggregated carbon emission and removal factors multiplied by the relevant area of land that undergoes a management change. The carbon factor represents the rate of change in soil carbon per unit area for each LMC as a function of time since the management change. Carbon input from primary production is measured using information on crop productivity and crop residue management and information on carbon retention from the application of manure to annual cropland. The impact of crop production and crop residue management on soil organic carbon is estimated using the IPCC Tier 2 Steady State approach as described in the 2019 refinement to the 2006 IPCC guidelines for national greenhouse gas inventories. Regional factors representing the annual change in soil carbon per unit area are generated and applied to the total area of land under annual cropland management. The impact of manure application to annual cropland is estimated using manure-induced carbon retention coefficients. These coefficients represent the average fraction of carbon input from manure that is retained in the soil.
For CLCL, projections are based on CRAM-generated resource use patterns for 2025, 2030, and 2035. Crop yields are fixed at the 2019 to 2023 average across the projection period. These resource use patterns are integrated with activity data used by CanAG-MARS to produce the emissions and removals estimates reported in NIR2025, ensuring consistency with historical estimates.
Projected emissions of Forest Land Converted to Cropland subcategory are provided by ECCC’s Science and Technology Branch as part of estimates for forest land converted to other subcategories (Section A.1.6.3.8). No methodology has been developed yet to make projections for the conversion of Grassland to Cropland.
Wetlands under agricultural management practices and conversion of wetlands to cropland are not reported in historical cropland estimates. Work is ongoing to develop suitable activity data and associated estimates.
A.1.6.3.3 Grassland
Little information is available on management practices on Canadian agricultural grassland and there is no evidence to suggest that current management practices are degrading grasslands. As a result, grasslands are assumed to remain in a steady state. Emissions of methane and nitrous oxide from prescribed burning in managed grassland are reported in Canada's NIR. To date, no methodology has been developed to project GHG emissions from the Grassland Remaining Grassland subcategory.
A.1.6.3.4 Wetlands
In Canada's NIR the Wetlands category is restricted to those wetlands that are not already in the Forest Land, Cropland or Grassland categories. Fluxes of carbon dioxide, methane, and nitrous oxide from extracted peat, peatlands drained for peat extraction, rewetted peatlands, and flooded lands (hydroelectric reservoirs) are reported in Canada's NIR. To date, no methodology has been developed to project fluxes from managed peatlands or from the surface of existing hydroelectric reservoirs. However, projected emissions of CO2 from the Forest Land Converted to Wetlands (LWL) subcategory (woody biomass decaying as the result of the creation of new hydroelectric reservoirs) are provided by ECCC’s Science and Technology Branch as part of estimates for Forest Land converted to other categories (Section A.1.6.3.8).
A.1.6.3.5 Settlements
The drivers of urban tree cover change are currently not sufficiently well understood to provide reliable projections of the resulting GHG fluxes. However, the projected impact of urban tree planting from the 2 Billion Trees program (as estimated prior to Budget 2025 announcements) is reflected in open data Table A32. Projected emissions from the Forest Land Converted to Settlements (LSL) subcategory are provided by ECCC’s Science and Technology Branch as part of estimates for Forest Land converted to other categories (Section A.1.6.3.8).
A.1.6.3.6 Other land
As defined in Section 6.2 of NIR2025, other land comprises areas of rock, ice or bare soil, and all land areas that do not fall into any of the other five subsectors (e.g., A to E in open data Table A32 and Table A33), and which are classified as unmanaged. Currently, fluxes from the conversion of Other Land to flooded land and managed peatlands are reported under the Wetlands category. Emissions for the Other Land Remaining Other Land subcategory are not currently estimated (hence the use of "NE" in the tables), whereas the conversion from other subsectors to other land does not occur in Canada (hence the use of "NO" in the tables).
A.1.6.3.7 Harvested wood products
Canada has developed a country-specific model, the NFCMARS for HWP, to monitor and quantify the end use of carbon from domestic harvest. The HWP category is reported following the Simple Decay approach, as described in the 2006 IPCC Guidelines. The approach is similar to the Production Approach but differs in that the HWP pool is treated as a carbon transfer related to forest harvest proportion estimates and therefore does not assume instant oxidation of wood in the year of harvest (for further detail see NIR2025, Annex 3.5.3).
This category reports emissions and transfers to the waste stream after the use and disposal of HWP manufactured from wood coming from forest harvest in FLFL and from forest conversion (Sections A.1.6.3.1 and A.1.6.3.8) in Canada, consumed either domestically or elsewhere in the world.
Carbon stocks in the HWP category are to increase slightly over the projection period resulting from increasing projected harvest rates over time. Projections for the HWP category use the same assumptions as those used for HWP estimates for NIR2025. For example, the pool of HWP from FLFL starts in 1900 (1990 for HWP from forest conversion). These projections also reflect assumptions about future harvests (as provided by provincial and territorial governments), future forest conversion rates, and future end-uses of the harvest.
End-use assumptions are based on the most recent (2023) distribution of harvest across four HWP commodity categories: sawnwood, panels, pulp and paper, and other products. For forest conversion, the categories include: roundwood, milling waste, pulpwood, and firewood. Using the latest commodity shares helps reflect emerging trends in wood product use, such as the decline in certain types of paper.
To address the most recent Technical Expert Review Team recommendations, revisions were made to the approach to reporting estimates for Forest Land and HWP. As of NIR2025, harvested biomass carbon is reported in the contributing land category as a flux out and in the HWP category as a flux in. As a result, the HWP category is now reported as the net change in the carbon stored in HWP. Such a reporting change affects accounting of the contributing land category, predominantly the Forest Land and the HWP categories equally but in opposite directions. The net result is no impact on the overall LULUCF accounting contribution. For more information on the change to HWP reporting, see NIR2025, Chapter 6. Finally, biomass gain is newly reported in lands undergoing land-use change, a carbon change that was not previously reported and was recommended by the UNFCCC expert review team.
A.1.6.3.8 Forest land converted to other land categories – forest conversion
Forest conversion is not a LULUCF reporting category in the NIR, as it overlaps with the reporting subcategories of CLCL, Land converted to Cropland, Wetlands remaining Wetlands, LWL, LSL, and HWP. Forest conversion is nevertheless reported as an information item in Canada's NIR and is therefore reported as an information item in this section. For the purposes of this report, forest conversion includes all immediate and residual emissions from FL converted to CL, WL, and SL and from the net change of carbon storage from HWP resulting from these forest conversion activities (open data Table A32 and Table A33).
Historical estimates for forest conversion are developed using an earth observation sampling approach. Emission impacts are calculated using NRCan's Carbon Budget Model and ECCC's Peat-Extraction and Hydroelectric Reservoir models. These estimates cover activity from 1970 to 2023 and were developed by drivers and end land use categories (CL, WL, and SL).
Projected forest conversion areas for 2024 to 2035 are developed by NRCan based on a business-as-usual scenario, using the best available knowledge of drivers, policies and practices. Emissions projections are generated using an empirical model, with parameters derived by drivers and ecological regions, based on the relationship between areas converted and resulting emissions as reported in the most recent NIR submission.
As mentioned above, due to revisions made to the approach to reporting estimates for Forest Land and HWP, biomass gain is newly reported in lands undergoing land-use change, a carbon change that was not previously reported and was recommended by the UNFCCC expert review team.
A1.6.4 Models used
This section outlines the models used to estimate and project net GHG flux within the LULUCF sector. These models are tailored to reflect the unique characteristics of Canada’s managed lands and are essential for producing consistent, transparent, and policy-relevant projections. The section describes the CBM-CFS3, which simulates forest carbon dynamics; the CRAM, which estimates agricultural activity patterns; and CanAG-MARS, which calculates net GHG flux from cropland.
A.1.6.4.1 Carbon budget model of the Canadian forest sector
CBM-CFS3 is an aspatial, stand- and landscape-level modelling framework used for international reporting of the forest carbon balance of Canada’s managed forest. It is the central component of Canada’s NFCMARS.
The CBM-CFS3 uses forest management information provided by users to calculate forest carbon stocks and stock changes for monitoring or projection purposes. Model users can create, simulate and compare various forest management scenarios to assess impacts on carbon. By considering the effects of planned activities on forest carbon stocks and stock changes, reductions in GHG emissions and increases in carbon sequestration and storage are possible.
CBM-CFS3 simulates the dynamics of all forest carbon stocks required by the UNFCCC: above-ground biomass, below-ground biomass, litter, dead wood, and, soil organic carbon.
CBM-CFS3 complies with carbon estimation methods outlined in the 2003 IPCC Good Practice Guidance for Land Use, Land-Use Change and Forestry, and the 2006 IPCC Guidelines for National Greenhouse Gas Inventories (including the 2019 Refinement).
A.1.6.4.2 Canadian regional agricultural model (CRAM)
CRAM is a sectoral (that is, partial) equilibrium static model for Canadian agriculture implemented using the General Algebraic Modeling System. It is a non-linear optimization model that maximizes the sum of producer and consumer surplus, minus transport costs. Through a calibration process, the model is aligned precisely with production levels observed in the Census of Agriculture. The current version of the model reflects baseline conditions for the year 2016. CRAM is disaggregated by both commodities and geography, covering 55 crop regions and 10 livestock regions.
CRAM covers all major production activities in the agricultural sector, including:
- crop production of all major grains and oilseeds, special crops, forage production and pasture use
- livestock, including beef and hogs, dairy and poultry production
- some processing activities such as biofuel, oil crushing, red meat slaughter, dairy products
- potato production
Key features of CRAM include:
- the ability to provide detailed snapshots of the agricultural sector before and after the application of shocks to the model
- coverage of both land and water resources, enabling analysis of agri-environmental impacts associated with agricultural production practices
- detailed regional breakdown of agricultural production, allowing for the examination of distributional impacts (that is, interprovincial trade)
- considerable flexibility for modelling value chains specific to Canadian agriculture
A.1.6.4.3 Canadian Agricultural Greenhouse Gas Monitoring Accounting and Reporting System (CanAG-MARS)
CanAG-MARS reports on GHG sources and sinks accounting for the effects of organic carbon input and changes in land use and land management practices in Canada's agricultural sector. The estimation procedure follows a Tier 2 methodology under the 2006 IPCC Guidelines and is described in detail in Annex 3.5 of NIR2025.
A1.7 Nature-based climate solutions and agriculture measures
NBCS in forest lands, grasslands, wetlands, and agricultural lands can help mitigate the impacts of climate change while providing important benefits to biodiversity and communities. NBCS includes the Government of Canada’s support for incremental tree planting (2 Billion Trees program with impacts estimated prior to Budget 2025 announcements, and reported under the LULUCF sector), restoring degraded ecosystems, improving land management practices (including on agricultural lands), and conserving land at risk of being converted to other uses.
For Nature Smart Climate Solutions Fund (NSCSF) activities, GHG impact of activities funded under the initial round of funding was estimated as net changes in carbon stocks over time, following guidelines established by the IPCC and NIR data, or variations on these methodologies when source specific methodologies were not available. The net carbon stock change approach is used to estimate carbon dioxide equivalent fluxes because changes in ecosystem carbon stocks predominately occur through carbon dioxide exchange between the land surface and the atmosphere. Specifically, increases in total carbon stocks over time result in the removal of carbon dioxide from the atmosphere, while decreases lead to carbon dioxide emissions (IPCC, 2006). Variations in carbon pools were estimated for biomass, dead organic matter and soils. GHG impact estimates for the extension of these activities in a second round of funding are assumed to be equal to those in the first round of funding.
For programs listed under “agriculture measures,” GHG abatement cost information for individual beneficial management practices (BMPs) is drawn from the studies by Nature United, Farmers for Climate Solutions, and available program performance data, where applicable. Additional required information, such as spending allocations, emissions factors, average project costs and maximum mitigation potentials, are drawn from the same studies along with AAFC scientists, expert opinion, and available program data. Program parameters, including administrative costs and cost-share ratios, were also considered where relevant.
GHG emissions reductions from non-nitrogen management BMPs are considered permanent as these practices often involve significant capital investments and/or are expected to yield clear agronomic benefits during the program period. Consequently, these BMPs are assumed to remain in use on farms after the program concludes. For nitrogen management BMPs in certain programs, it is assumed that farmers who experience increased net profits from BMP adoption will continue the practice post-funding. Conversely, farmers who incur reduction in profits (excluding program funding) are assumed to revert to previous practices once funding ends. Therefore, only a portion of the emissions reductions from nitrogen management BMPs are considered permanent. The remainder are assumed to persist only while program funding is available. These practices are considered reversible, as they typically do not require capital investment and can be discontinued at no cost, unless strong peer-reviewed scientific evidence demonstrates sustained economic benefits that would justify assuming full permanence. The GHG reduction estimates presented in Table 15 include only permanent reductions.
Estimates for reductions from certain agriculture measures have been revised since BTR1, based on availability of program performance data for the 2023 to 2024 fiscal year.
A1.8 Air pollutant emissions projections modelling
Since 2018, ECCC has published annual projections of air pollutant emissions. These projections include key pollutants such as carbon monoxide, mercury, ammonia, nitrogen oxides, sulphur oxides, various forms of particulate matter (including PM10 and PM2.5), VOCs, and black carbon.
The projections are updated each year to reflect the latest assumptions about economic drivers, including oil and gas production and broader macroeconomic trends (Annex 1 for more details). ECCC uses the E3MC model to generate these projections, following a structured process.
First, historical air pollutant emissions data are sourced from APEI2025 and Canada's Black Carbon Inventory Report 2025. These data are then processed and mapped to the economic sectors and fuel types used in the E3MC model. Once mapped, emissions drivers are identified and emissions coefficients are calculated for each economic sector and pollutant included in the model.
For combustion or energy-related emissions, the primary driver is energy use by fuel across all sectors. For non-combustion or process-related emissions, the drivers vary by sector. In the Buildings sector, residential emissions are driven by population, while commercial emissions are based on floor space. Emissions from Heavy Industry and light manufacturing are linked to gross output. Oil and Gas emissions are driven by production levels. Transportation emissions are influenced by population (passenger transport), personal income (air passengers), and gross regional product (air freight, freight transport, and off-road equipment). Waste sector emissions are based on the number of households. Black carbon emissions are estimated as a proportion of PM2.5 emissions.
Historical emission coefficients, the ratio of emissions to their respective drivers, are calculated for each combination of pollutant, fuel, sector, and province. These coefficients are then used to project future emissions by multiplying the most recent historical coefficient by the projected value of the corresponding driver for each year, fuel type, sector, and province or territory.
The projections also incorporate policy measures. The WM scenario includes all federal, provincial, and territorial air pollution regulations and policies that are fully funded or legislated. This scenario reflects both the direct impacts of air pollutant-specific measures and the indirect effects of GHG mitigation policies, such as improvements in energy efficiency or changes in fuel use. The WAM scenario includes policies that have been announced but are not yet fully implemented.
A1.9 Continuous modelling improvements
This section outlines Canada’s ongoing efforts to improve the accuracy, transparency, and relevance of its GHG and air pollutant emissions projections. It highlights recent updates to the modelling framework, including enhancements to data sources, assumptions, and methodologies. The section also provides an overview of planned improvements and revisions, such as updates to the Modelling Improvement Action Plan, integration of new scientific insights, and refinements to sectoral estimates.
A1.9.1 Update on Action Plan
In the 2030 Emissions Reduction Plan (released in 2022), ECCC committed to improving transparency in modelling and reporting. In response, ECCC undertook a two-phase consultation process. Phase 1 gathered input on objectives, scope, and milestones for a formal consultation process, which led to the development of an Independent Modelling Review Action Plan. Phase 2 expanded consultation on the proposed plan, leading to its final version which was released in EPR2023. A progress update was included in BTR1, which was submitted to the UNFCCC in 2024.
In 2025, ECCC implemented a series of targeted improvements to its modelling framework. These enhancements reflect a broader effort to increase transparency, strengthen analytical rigour, and align Canada’s modelling practices with international best standards. This section documents the improvements that were implemented for this update cycle.
A.1.9.1.1 Transparency and accessibility
Improvements are continuously being made on the documentation of the assumptions used in policy modelling and progress is being made toward standardizing the way this information is presented, while respecting confidentiality requirements for certain inputs.
In parallel, data available through the Government of Canada’s open data portal has been expanded and restructured to separate English and French in their respective folders. Furthermore, this year, for the first time, all tables from the report are published online and include the full time series for every year covered, rather than the select years shown in this report due to space limitations.
A.1.9.1.2 Technical enhancements to modelling framework
During the development of the 2025 emissions projections, ECCC implemented several modernization initiatives to improve the E3MC framework. To enhance traceability and align with contemporary software development practices, the team adopted Git for version control. This enables collaborative development and robust tracking of model changes.
Another major technical transition involved rewriting the ENERGY 2020 model from the legacy PROMULA programming language to Julia. Julia is an open-source language known for its speed and modern development tools. This change was motivated by the potential to improve model runtimes, enhance maintainability, and support integration with widely used development environments. Julia’s broader user community and stronger representation in modern large language models training data also enhance our ability to leverage AI-based support for coding and troubleshooting. The Julia version of ENERGY 2020, used to prepare the projections presented in this report, was validated through parallel runs of the 2024 WM scenario. The results were comparable to the PROMULA version across GHG and air pollutant emissions, and macroeconomic indicators. While runtime improvements are expected over time, the initial focus was on translation accuracy. Future work will explore opportunities to improve model speed and streamline the model and code structure.
A.1.9.1.3 Scenario development and policy analysis
Over the past year, ECCC developed methodologies to isolate the contributions to emissions reductions of certain key individual climate policies, enhancing transparency and supporting strategic decision-making (Section 2.4). The scenario analysis was also expanded to include pathways reflecting trade uncertainty and potential tariff impacts, providing a broader view of how these factors could influence emissions outcomes (Section 2.5.1).
A1.9.2 Planned enhancements
A.1.9.2.1 ENERGY 2020
ECCC plans to continue improving the Julia-based ENERGY 2020 model beyond its initial translation. Future enhancements will target optimization of model runtimes. Efforts will also focus on enabling cross-platform functionality to allow model execution on Linux-based virtual machines, which are more cost-effective than Windows-based systems, in particular when the model is operated on the Virtual Machines (on the cloud). Additional work will explore parallel computing to further reduce runtimes and improve scalability.
Enhancements to model structure and integration with modern developer tools will support better maintainability and facilitate the use of AI-assisted coding tools. These improvements are expected to support more efficient scenario development for future emissions projections.
Planned future enhancements focus on optimizing model runtimes, enabling cross-platform functionality, leveraging cloud computing efficiencies, and exploring parallel computing. These efforts aim to support more efficient scenario development and policy analysis.
A.1.9.2.2 LULUCF
Data and methods used to estimate forest GHG inventories and projections are continually improved based on peer-reviewed science and following the principle of continuous improvement while adhering to the protocols established by the UNFCCC and the IPCC. Planned improvements for FL are outlined in Canada’s NIR, Chapter 8, section 8.3.1 and Table 8-5. Further information may be found in the Improvement Plan for Forest and Harvested Wood Products Greenhouse Gas Estimates.
A1.9.3 Historical data revisions
Since EPR2023, Canada’s historical GHG and air pollutant inventories have undergone several updates to ensure consistency with the most current scientific methods, activity data, and international reporting standards. These updates reflect both routine improvements to estimation practices and more substantial methodological shifts (particularly in methane measurement, land‑use accounting, and select sectoral activity datasets). To clearly outline how historical estimates have evolved across reporting cycles, this section presents all revisions first by comparing changes introduced between EPR2025 and BTR1, followed by those that occurred between BTR1 and EPR2023.
A.1.9.3.1 Cross-sectoral
- Changes between Canada’s EPR2025 and BTR1:
- No significant changes occurred, though minor updates may have been made
- Changes between BTR1 and EPR2023:
- NIR2024 adopts the Fifth IPCC Assessment Report (AR5) GWP values, replacing the AR4 GWP values that were used in previous NIRs
- Significant revisions to methane emissions estimates have been made in NIR2024, with a new approach that incorporates atmospheric measurement data
- This methodological improvement has led to an upward revision of historical methane emissions, reflecting a more accurate representation of past emissions based on enhanced observational evidence.
A.1.9.3.2 Oil and gas
- Changes between Canada’s EPR2025 and BTR1:
- Historical revisions were made to Oil and Gas emissions driven by two factors:
- Updates to emissions factors for producer-consumed natural gas (affecting stationary combustion) and improvements to methodologies and activity data (affecting fugitive emissions)
- Combined, these changes led to significant downward revisions ranging from –1.2 Mt in 1990 to –7.7 Mt in 2022
- Historical revisions were made to Oil and Gas emissions driven by two factors:
- Changes between BTR1 and EPR2023:
- Historical Oil and Gas emissions have risen throughout the period, with a 26 Mt increase in 2020
- Approximately 55% of this increase is due to revised measurement methods for historical methane emissions and 45% is due to changes to GWPs
- Historical Oil and Gas emissions have risen throughout the period, with a 26 Mt increase in 2020
A.1.9.3.3 Electricity
- Changes between Canada’s EPR2025 and BTR1:
- Historical emissions for 2021 have been increased by 0.9 Mt, increased by 0.8 Mt for natural gas and by 0.1 for other fuels
- Changes between BTR1 and EPR2023:
- Historical emissions for 2020 have been increased by 0.5 Mt, increased by 0.7 Mt from coal and decreased by 0.2 Mt for natural gas
A.1.9.3.4 Transportation
- Changes between Canada’s EPR2025 and BTR1:
- No significant changes occurred, though minor updates may have been made
- Changes between BTR1 and EPR2023:
- No significant changes occurred, though minor updates may have been made
A.1.9.3.5 Heavy industry
- Changes between Canada’s EPR2025 and BTR1:
- No significant changes occurred, though minor updates may have been made
- Changes between BTR1 and EPR2023:
- No significant changes occurred, though minor updates may have been made
A.1.9.3.6 Buildings
- Changes between Canada’s EPR2025 and BTR1:
- Historical emissions in 2022 have been revised downwards by 0.5 Mt due to changes in residential buildings emissions
- Changes between BTR1 and EPR2023:
- Historical emissions in 2021 have been revised downwards by 2 Mt due to changes in commercial buildings emissions
A.1.9.3.7 Waste and others
- Changes between Canada’s EPR2025 and BTR1:
- No significant changes occurred, though minor updates may have been made
- Changes between BTR1 and EPR2023:
- No significant changes occurred, though minor updates may have been made
A.1.9.3.8 Agriculture
- Changes between Canada’s EPR2025 and BTR1:
- No significant changes occurred, though minor updates may have been made
- Changes between BTR1 and EPR2023:
- No significant changes occurred, though minor updates may have been made
A.1.9.3.9 LULUCF
- Changes between Canada’s EPR2025 and BTR1:
- Transfers of carbon to the HWP pool are now reported as the difference between annual inputs of new products into the pool and outputs from the pool at the end of the products’ useful life
- This change causes an apparent downward revision in the HWP category, with corresponding apparent upward revisions in other categories from which the wood was harvested
- The total net GHG flux of the sector is not affected by this change.
- Recalculations in the wetlands category due to updated activity data as well as an updated peat extraction emission model
- Other minor recalculations to cropland remaining cropland, cropland converted to forest land, and grassland converted to cropland
- Inclusion of cultivated histosols for perennial crop production and revisions of the IPCC default emission factors for annual crop production
- Transfers of carbon to the HWP pool are now reported as the difference between annual inputs of new products into the pool and outputs from the pool at the end of the products’ useful life
- Changes between BTR1 and EPR2023:
- A review of the harvested land base reduced the managed forest area and decreased carbon removals, shifting LULUCF from a net sink to a net source (1990 to 2021)
- This change has only a small impact on the 2030 accounting contribution
- A review of the harvested land base reduced the managed forest area and decreased carbon removals, shifting LULUCF from a net sink to a net source (1990 to 2021)
A.1.9.3.10 Air pollutants
- Changes between Canada’s EPR2025 and BTR1:
- The APEI2025 was updated with improved estimation methodologies, activity data and more accurate emission factors
- Notable revisions were made to nitrogen oxides, particulate matter and volatile organic compounds emissions from various sources, including:
- Marine Transportation
- Road Dust
- Residential wood combustion and general solvent use
- Notable revisions were made to nitrogen oxides, particulate matter and volatile organic compounds emissions from various sources, including:
- For detailed impacts, see Annex 3 of the APEI2025 report
- The APEI2025 was updated with improved estimation methodologies, activity data and more accurate emission factors
- Changes between BTR1 and EPR2023:
- The APEI2024 was updated using improved estimation methods, updated statistics and more accurate emission factors
- Notable revisions were made to ammonia and particulate matter emissions from various sources, including:
- Agriculture
- Incineration and Waste
- Construction and Road Dust
- Notable revisions were made to ammonia and particulate matter emissions from various sources, including:
- For detailed impacts, see Annex 3 of the APEI2024 report
- The APEI2024 was updated using improved estimation methods, updated statistics and more accurate emission factors
A1.9.4 Policy revisions
Between EPR2023, BTR1, and EPR2025, Canada’s emissions projections were influenced by numerous adjustments to federal, provincial, and territorial policies incorporated in the WM and WAM scenarios. These adjustments include newly implemented programs, updated timelines, policy removals, scenario reallocations, and refined assumptions about funding, regulatory design, and sector‑specific initiatives. To allow readers to understand how the policy landscape evolved over time, this section presents all policy‑related updates first for the period between EPR2025 and BTR1, followed by the changes made earlier between BTR1 and EPR2023.
A.1.9.4.1 Cross-sectoral
- Changes between Canada’s EPR2025 and BTR1:
- The federal fuel charge no longer applies as of April 1, 2025, and provinces and territories are no longer required to have a consumer-facing carbon price as of that date
- These systems have been removed in both WM and WAM scenarios
- In the WAM scenario, modelling of carbon pollution pricing returns has been updated to reflect the removal of the federal fuel charge
- The WAM scenario no longer reflects unallocated funding from the SIF-NZA program as the program funding has been exhausted
- The federal fuel charge no longer applies as of April 1, 2025, and provinces and territories are no longer required to have a consumer-facing carbon price as of that date
- Changes between BTR1 and EPR2023:
- The WM scenario now includes Newfoundland and Labrador’s Green Technology Tax Credit
- In the WAM scenario, modelling of both the Canada Growth Fund and Carbon Revenue Returns has been updated with improved proxies for energy efficiency and electrification
A.1.9.4.2 Oil and gas
- Changes between Canada’s EPR2025 and BTR1:
- The Oil and Gas Emissions Cap was removed from the WAM scenario
- In the WAM scenario, the start year for the Enhanced Oil and Gas Methane Regulations has been revised from 2027 to 2028
- Changes between BTR1 and EPR2023:
- The WAM scenario includes the Oil and Gas Emissions Cap and the Alberta Carbon Capture Incentive Program
- In the WAM scenario, the start year for the Enhanced Oil and Gas Methane Regulations has been revised from 2026 to 2027
A.1.9.4.3 Electricity
- Changes between Canada’s EPR2025 and BTR1:
- The Clean Electricity Regulations are included in both the WM and WAM scenarios
- Changes between BTR1 and EPR2023:
- Modelling of the Clean Electricity Regulations in the WAM scenario has been revised to reflect the latest changes to the regulation
A.1.9.4.4 Transportation
- Changes between Canada’s EPR2025 and BTR1:
- Canada’s EVAS has been paused by one year, now beginning in 2027
- Canada’s target of 100% where feasible medium- and heavy-duty vehicle ZEV sales by 2040 has been removed from the WAM scenario
- Changes between BTR1 and EPR2023:
- Canada’s EVAS has been moved from the WAM to the WM scenario
- Policies on the electrification of lawn and garden equipment and sustainable aviation fuel blending have been removed from the WAM scenario
- The Science-Based Targets Initiative for the rail sector was revised in the WM scenario to reflect greater emissions reductions
- ZEV sales targets in the WM scenario were updated to align with British Columbia’s accelerated targets under the Light-Duty Zero-Emission Vehicles Act
A.1.9.4.5 Heavy industry
- Changes between Canada’s EPR2025 and BTR1:
- Industrial process improvements under Manitoba’s, Ontario’s and New Brunswick’s electricity conservation frameworks have been modelled in the WM scenario
- Modelling of the conversion of Ontario’s Algoma and ArcelorMittal Dofasco steel facilities has been updated in the WM scenario to reflect anticipated levels of fuel switching. Other minor updates have been made
- Changes between BTR1 and EPR2023:
- Two SIF-NZA projects, the Dow petrochemicals project and the Heidelberg CCS project, have been moved to the WM scenario
- Québec-based decarbonization programs have been remodelled in the WM scenario to align with the province’s updated 2024–2029 Implementation Plan
- FortisBC’s natural gas demand-side management program is now included in the WM scenario
- Electricity demand-side management programs from BC Hydro and Hydro-Québec are now included in the WM scenario
- Updated modelling of Ontario’s natural gas demand-side management framework (delivered by Enbridge) is included in the WM scenario
- Electricity demand-side management in Ontario has also been updated in the WM scenario
- The Energy Innovation Program has been updated in the WM scenario to reflect the impacts of funded projects to date
- The recapitalized Low Carbon Economy Fund has been updated in the WM scenario to include Challenge Program projects and revised Leadership Program impacts
- Modelling of the conversion of Ontario’s Algoma and ArcelorMittal Dofasco steel facilities has been updated in the WM scenario to reflect anticipated timelines
- The Air Products hydrogen production facility is now modelled in the WM scenario, including expected production volumes
- The CleanBC Industry Fund has been updated in the WM scenario to include funded projects
- Emissions Reduction Alberta-funded projects in the cement and pulp and paper sectors are now included in the WM scenario
- In the WAM scenario, SIF-NZA modelling has been updated with new proxies for energy efficiency and electrification; clean fuels adoption assumptions have been removed
- The Alberta Carbon Capture Incentive Program is now included in the WAM scenario
A.1.9.4.6 Buildings
- Changes between Canada’s EPR2025 and BTR1:
- The Regulations Amending the Products Containing Mercury Regulations and Canada Greener Homes Grant have been moved to the WM scenario
- Revisions to the Net-Zero Energy Ready Building Codes have been implemented in the WAM scenario
- The WAM scenario no longer includes more stringent Energy Efficiency Standards for appliances and equipment, nor labelling requirements and building codes for existing commercial buildings
- The future electric demand of data centres was reviewed and increased
- Changes between BTR1 and EPR2023:
- The Canada Green Buildings Strategy and British Columbia’s Highest Efficiency Standards for Space and Water Heating have been added to the WAM scenario
- Electricity demand-side management programs from BC Hydro and Hydro-Québec are now included in the WM scenario
- The recapitalized Low Carbon Economy Fund has been updated in the WM scenario to reflect projects funded to date through the Challenge Program and revised impacts from the Leadership Program
A.1.9.4.7 Waste and others
- Changes between Canada’s EPR2025 and BTR1:
- In the WAM scenario, collection efficiencies have been revised to reflect the federal Landfill Methane Regulations
- The implementation timeline for the federal Landfill Methane Regulations was updated to start in 2028, rather than 2027
- Changes between BTR1 and EPR2023:
- In the WAM scenario, collection efficiencies have been revised to reflect the federal Landfill Methane Regulations
A.1.9.4.8 Agriculture
- Changes between Canada’s EPR2025 and BTR1:
- Voluntary fertilizer reduction target removed from WAM scenario
- GHG impacts of nitrogen management activities now included in WM scenario
- Changes between BTR1 and EPR2023:
- Reductions from the Agricultural Clean Technology Program are now included in the WM scenario
A.1.9.4.9 LULUCF
- Changes between Canada’s EPR2025 and BTR1:
- No changes
- Changes between BTR1 and EPR2023:
- No changes
A.1.9.4.10 Air pollutants
- Changes between Canada’s EPR2025 and BTR1:
- The Reduction in the Release of Volatile Organic Compounds (Storage and Loading of Volatile Petroleum Liquids) Regulations have been added to the WM scenario
- Ontario’s Carbon Black Industry Standard has been added to the WM scenario
- Changes between BTR1 and EPR2023:
- The Regulations Amending the Products Containing Mercury have been added to the WM scenario
A1.9.5 Methodological revisions
Canada’s emissions‑modelling framework continues to evolve as analytical tools, data sources, and modelling architectures are refined. Between EPR2023, BTR1, and EPR2025, revisions were made to improve the representation of technology costs, sector‑specific capital stock dynamics, land‑use accounting, transmission modelling, and the structure of key models such as ENERGY 2020. These changes influence how projections respond to policies, economic drivers, and technological developments. To present these improvements transparently, this section outlines all methodological updates first by describing changes introduced between EPR2025 and BTR1, and then by detailing those introduced between BTR1 and EPR2023.
A.1.9.5.1 Cross-sectoral
- Changes between Canada’s EPR2025 and BTR1:
- Rewrote the ENERGY 2020 model from the PROMULA programming language to Julia (Section A.1.9.1.2)
- Changes between BTR1 and EPR2023:
- No changes
A.1.9.5.2 Oil and gas
- Changes between Canada’s EPR2025 and BTR1:
- No changes
- Changes between BTR1 and EPR2023:
- Projected gas production from the CER has increased due to a new profitability model that incorporates revenues from NGLs
A.1.9.5.3 CCS
- Changes between Canada’s EPR2025 and BTR1:
- No changes
- Changes between BTR1 and EPR2023:
- CCS adoption cost curves have been updated
A.1.9.5.4 Electricity
- Changes between Canada’s EPR2025 and BTR1:
- The transmission capacities between regions are modelled using the North American Electric Reliability Corporation Interregional Transfer Capability Studies (Canada and US) instead of data from various public sources
- Changes between BTR1 and EPR2023:
- In both the WM and WAM scenarios, electricity sector parameters related to the Clean Electricity Regulations have been updated, including technology costs, development rates, and power plant operating parameters
A.1.9.5.5 Transportation
- Changes between Canada’s EPR2025 and BTR1:
- Revised methodology for the calculation of energy demand from electric vehicles
- Changes between BTR1 and EPR2023:
- Capital stock retirements are now modelled using an improved methodology:
- Each year introduces new capital stock vintages with specific energy efficiency and retirement rates
- Vintages retire a portion of their stock annually based on age and survival curves, with replacements added to meet both retirements and growing demand
- This allows for more accurate fleet turnover modelling, enhancing the projected impact of policies like ZEV sales targets
- On-road freight sector activity rates are now modelled alongside vintaging, with demand weighted by capital age using an activity curve
- Passenger ZEV assumptions are based on updated vehicle sales projections
- Medium- and heavy-duty vehicle assumptions reflect updated zero-emission sales projections
- Capital stock retirements are now modelled using an improved methodology:
A.1.9.5.6 Heavy industry
- Changes between Canada’s EPR2025 and BTR1:
- Hydrogen production technology costs have been updated
- Costs associated with the transportation of hydrogen have been updated
- Changes between BTR1 and EPR2023:
- Hydrogen production technology costs have been updated
A.1.9.5.7 Buildings
- Changes between Canada’s EPR2025 and BTR1:
- Update to projected residential floor space per dwelling assumptions to better reflect historical trends
- Changes between BTR1 and EPR2023:
- A vintaging approach, similar to that used in the transportation sector, has been adopted for buildings
- The model now tracks each building’s construction year and associated characteristics (e.g., process and device energy requirements), enabling more accurate simulation of capital stock turnover
- A vintaging approach, similar to that used in the transportation sector, has been adopted for buildings
A.1.9.5.8 Waste and others
- Changes between Canada’s EPR2025 and BTR1:
- The annual increases to waste diversion for provinces and territories with diversion policies have been updated to reflect a province or territory’s highest annual increase from the historical period
- This change better reflects historical trends in a province or territory’s capacity to increase waste diversion year-to-year
- The annual increases to waste diversion for provinces and territories with diversion policies have been updated to reflect a province or territory’s highest annual increase from the historical period
- Changes between BTR1 and EPR2023:
- No changes
A.1.9.5.9 Agriculture
- Changes between Canada’s EPR2025 and BTR1:
- No changes
- Changes between BTR1 and EPR2023:
- No changes
A.1.9.5.10 LULUCF
- Changes between Canada’s EPR2025 and BTR1:
- Transfers of carbon to the HWP pool are now reported as the difference between annual inputs of new products into the pool and outputs from the pool at the end of the products’ useful life
- This change has no impact on total LULUCF net GHG flux or accounting contribution
- Recalculations to historical estimates of afforestation from inclusion of biomass losses from conversion of croplands to forestlands
- Recalculations to historical estimates of the Wetlands category with implementation of an updated peat extraction emission model that incorporates new domestic emission factors
- Transfers of carbon to the HWP pool are now reported as the difference between annual inputs of new products into the pool and outputs from the pool at the end of the products’ useful life
- Changes between BTR1 and EPR2023:
- No changes
A.1.9.5.11 Air pollutants
- Changes between Canada’s EPR2025 and BTR1:
- No changes
- Changes between BTR1 and EPR2023:
- No changes
Annex 2 Policies and measures included in WM and WAM scenarios
Table A10: GHG policies and measures included in the WM scenario influences the cost competitiveness and deployment of clean hydrogen systems in the energy sector. Revisions for energy efficiency of housing and small buildings (Part 9) (reg # 173/2013) Revisions for energy efficiency of large residential and commercial buildings (Part 3) (reg # 167/2013) Step Code: Increased Energy Efficiency Requirements in the Building Code
| Policy Name | Jurisdiction | Economic Sector* | IPCC Sector | Modelling Assumptions / Description | GHG Abatement Channel | PaMs Identifier |
|---|---|---|---|---|---|---|
| Agricultural Clean Technology Program | Canada | Agriculture | Agriculture | This policy supports the development and adoption of clean technologies in Canada’s agriculture and agri-food sector through the ACT program, which allocates $429.4 million from 2021 to 2028. The program aims to reduce GHG, fertilizer, and methane emissions while promoting sustainable growth and a transition to a low-carbon economy. The Adoption Stream funds the purchase and installation of commercially available clean technologies and equipment upgrades. The Research and Innovation Stream supports pre-market innovation, including research, development, demonstration, and commercialization in three priority areas: green energy and energy efficiency, precision agriculture, and the bioeconomy. A pilot initiative under this stream—the Accelerator—provides funding to not-for-profit organizations to further distribute funds in alignment with ACT’s sustainability priorities. In the E3MC framework, this policy is modelled by calibrating device efficiencies. |
Efficiency | AGR 02, AGR 02.1. AGR 02.2 |
| Canada Greener Homes Grant | Canada | Buildings | Energy – Stationary Combustion and Fugitive Sources | The Canada Greener Homes Grant provides financial support to homeowners undertaking energy efficiency retrofits. The program offers up to 700,000 grants of up to $5,000 for eligible upgrades and up to $600 for EnerGuide home evaluations. To qualify, homeowners must complete both pre- and post-retrofit evaluations with a registered energy advisor. The program is retroactive to December 2020 and runs through March 2027. In the E3MC framework, the Canada Greener Homes Grant is modelled by applying reductions in residential energy demand, reflecting the impact of funded retrofits. Together with complementary loan programs, the policy is assumed to reduce residential energy demand by approximately 40 PJ in 2026 compared to a scenario without these measures. | Efficiency | BDG 04.1 |
| Canada Greener Homes Loan program in the residential sector | Canada | Buildings | Energy – Stationary Combustion and Fugitive Sources | This policy targets energy efficiency improvements in existing buildings through the Canada Greener Homes Loan program in the residential sector. It aims to reduce energy consumption by encouraging retrofits and upgrades that enhance building performance. The policy includes financial incentives to support the adoption of energy-efficient technologies and practices. In the E3MC framework, the policy is modelled by calibrating the process efficiency variable for existing buildings in the residential sector. ECCC adjusts these efficiencies to meet targeted energy reductions, simulating the impact of financial incentives. The current modelling results achieve energy demand reductions of 48 PJ in the residential sector, based on assumptions shared by NRCan. | Efficiency | BDG 04.2 |
| Equipment Standards | Canada | Buildings | Energy – Stationary Combustion and Fugitive Sources | This policy strengthens energy efficiency standards and labelling programs for residential, commercial, and industrial equipment. More stringent performance requirements and ENERGY STAR certification drive improvements in device efficiency, measured in energy output per unit of energy input (e.g., square feet per MMBtu). The objective is to reduce energy consumption across sectors by promoting the adoption of higher-efficiency technologies.In the E3MC framework, the policy is modelled by calibrating device efficiencies to align with energy-savings assumptions provided by NRCan. Energy demand reductions are applied across residential, commercial, and industrial sectors, with fuel-specific targets for electricity and natural gas (heating oil is grouped with natural gas). Projected energy savings include 38 PJ in the residential sector and 20 PJ in the commercial sector by 2030, increasing to 74 PJ and 41 PJ, respectively, by 2035, compared to a scenario without these measures. | Efficiency | BDG 09.3 |
| Oil to Heat Pump Affordability Program | Canada | Buildings | Energy – Stationary Combustion and Fugitive Sources | This federal program supports the transition of low- to median-income Canadian households from oil-based heating systems to electric heat pumps. The objective is to reduce household energy use and GHG emissions while improving affordability and energy efficiency in the residential sector. In the E3MC framework, the policy is modelled by simulating the replacement of oil heating systems with heat pumps in eligible homes. Energy savings are estimated to range between 1 PJ and 4 PJ annually by October 2028, depending on the extent of oil-use reduction (partial vs. full transitions). |
End-use fuel switching | BDG 04.4 |
| Regulations Amending the Products Containing Mercury Regulations | Canada | Buildings | Energy – Stationary Combustion and Fugitive Sources | The Regulations prohibit the manufacture and import of products containing mercury or any of its compounds. The Amendments lower the mercury content limit currently allowed for straight fluorescent lamps for general lighting purposes, cold cathode fluorescent lamps, and external electrode fluorescent lamps. In the E3MC framework, this policy is modelled by phasing out affected lighting technologies and adjusting the market share of compliant alternatives. The model reflects the transition toward lower-mercury or mercury-free lighting options, which influences electricity demand and associated emissions in the Buildings sector. |
Efficiency | NA |
| Clean Hydrogen Investment Tax Credit | Canada | Cross-Sectoral | Energy – Stationary Combustion and Fugitive Sources; Industrial Processes; Transport | Introduced in the 2022 Fall Economic Statement, the Clean Hydrogen ITC provides refundable tax credits covering between 15% and 40% of eligible capital costs for clean hydrogen production projects. The level of support is determined by the life cycle carbon intensity of the hydrogen produced, with lower-emission projects receiving higher credits. The objective is to accelerate investment in clean hydrogen technologies and support Canada’s transition to a low-carbon economy. In the E3MC framework, the policy is modelled by applying a capital cost discount to hydrogen production technologies, reflecting the range of ITC support levels. This adjustment |
End-use fuel switching | ECW 07 |
| Accelerating Industry Energy Management | Canada | Cross-Sectoral | Energy – Stationary Combustion and Fugitive Sources | This policy supports the adoption of structured energy management systems in the industrial sector, including ENERGY STAR, ISO 50001, and Superior Energy Performance programs. These initiatives promote energy efficiency through benchmarking, best practices, and third-party certification, helping facilities identify and implement cost-effective energy-saving measures. In the E3MC framework, the policy is modelled as energy retrofits that reduce device-level energy requirements in industrial operations. These retrofits are reflected in improved energy efficiency assumptions, contributing to reduced energy demand and associated emissions in the industrial sector. |
Efficiency | HVI 07 |
| Clean Fuel Regulations | Canada | Cross-Sectoral | Energy – Stationary Combustion and Fugitive Sources | The CFR requires fuel producers and importers to reduce the life cycle carbon intensity of liquid fuels (primarily gasoline and diesel) used in Canada. The objective is to drive emissions reductions across the fuel supply chain by encouraging cleaner production and use of transportation fuels. Obligated parties include fuel distributors and refineries. Compliance is achieved through a credit market system, with credits generated via approved pathways such as biofuel blending, upstream emissions intensity improvements, CCS (for domestically produced petroleum products), and the use of EVs. In the E3MC framework, the CFR is modelled by applying reductions in the life cycle emissions intensity of liquid fuels, based on projected credit generation and compliance behaviour. These reductions are reflected in the Transportation sector’s emissions profile over time. |
Energy Source Decarbonization | ECW 03 |
| Energy Innovation Program | Canada | Cross-Sectoral | Energy – Stationary Combustion and Fugitive Sources | The Energy Innovation Program supports the development and deployment of clean energy technologies to help Canada meet its climate targets and transition to a low-carbon economy. The program funds research, development, and demonstration projects across a range of areas, including industrial efficiency, CCS, renewable fuels, energy storage, and fugitive emissions reductions. In the E3MC framework, the policy is modelled through assumed process efficiency improvements in key sectors. In the industrial sector, this includes efficiency gains in cement production and increased electrification in the petrochemical and other chemical industries. In the Buildings sector, the program’s impact is reflected through enhanced process efficiency, contributing to reduced energy demand and emissions. Efficiency; Negative Emissions; |
Energy Source Decarbonization | ENB 02, ENB 02.1 |
| Federal Backstop Carbon Pollution Pricing – Output-Based Pricing System | Canada | Cross-Sectoral | Energy – Stationary Combustion and Fugitive Sources; Industrial Processes | The OBPS is a federal performance-based emissions trading system designed for industrial emitters. It places a price signal on all covered emissions by requiring facilities to pay for emissions that exceed a specified annual limit, which is determined using output-based emissions intensity standards. Facilities emitting below their limit receive surplus credits that can be sold or banked for future compliance. The carbon price for excess emissions under the OBPS increases by $15 per t CO2 eq annually from 2023, reaching $170 per t CO2 eq in 2030. For modelling purposes, the price is held constant at $170 per t CO2 eq beyond 2030 in nominal terms, as no post-2030 pricing decisions have been announced. It is assumed that the OBPS credit market continues to function effectively, with net positive demand from covered sectors, clearing at this established carbon price. This assumption reflects anticipated tightening of benchmarks and limited surplus credit availability, which ensure that the OBPS remains an effective incentive for emissions reductions. The federal OBPS currently applies in Manitoba, Prince Edward Island, Yukon, and Nunavut. An interim review of the federal benchmark is planned for 2026 to ensure continued alignment of industrial fuel charge stringency across jurisdictions. In the E3MC framework, the policy is operationalized by applying sector-specific emissions intensity standards alongside a progressively increasing carbon price. This approach simulates the rising cost of GHG emissions over time. The model assumes that sectors respond by adopting cleaner technologies and enhancing operational efficiency when such investments are more cost-effective than incurring carbon compliance costs. |
Efficiency; Energy Source Decarbonization; End-use fuel switching; Non-energy Process Emission Reductions | ECW 01 |
| Green Industrial Facilities and Manufacturing Program | Canada | Cross-Sectoral | Energy – Stationary Combustion and Fugitive Sources | The Green Industrial Facilities and Manufacturing Program provides financial assistance to industrial facilities to implement energy efficiency and energy management solutions. The program aims to maximize energy performance, reduce GHG emissions, and enhance the competitiveness of Canadian industry. In the E3MC framework, the policy is modelled in combination with NRCan’s Energy Management Program. Together, they are represented through assumed improvements in industrial energy efficiency over time, contributing to reduced energy demand and emissions in the industrial sector. |
Efficiency | HVI 07 |
| Investment Tax Credit for Carbon Capture, Utilization, and Storage | Canada | Cross-Sectoral | Energy – Stationary Combustion and Fugitive Sources | This federal policy provides a 50% ITC for capital costs associated with eligible CCUS projects, excluding those related to Enhanced Oil Recovery. The objective is to accelerate the deployment of CCUS technologies by reducing upfront investment barriers and supporting emissions reductions in hard-to-abate sectors. In the E3MC framework, the policy is modelled by reducing the capital costs of qualifying CCUS technologies by 50%, thereby improving their cost-competitiveness relative to conventional emissions management options. This adjustment influences technology adoption rates and emissions trajectories in the industrial and energy sectors. | Negative Emissions | ECW 15 |
| Low Carbon Economy Fund - Leadership and Challenge Envelopes | Canada | Cross-Sectoral | Energy – Stationary Combustion and Fugitive Sources | The Low Carbon Economy Fund provides targeted funding to support GHG emissions reductions across Canada. The Leadership Envelope supports provinces and territories in delivering on their climate commitments, while the Challenge Envelope funds a broad range of recipients (including municipalities, Indigenous communities, and businesses) to implement cost-effective, low-carbon projects. The Québec portion of the Leadership Envelope, which expands the ÉcoPerformance program, is excluded from modelling. In the Buildings sector, the policy is modelled in the E3MC framework as process investments and energy efficiency improvements, with reductions specified by province and sector. These adjustments reflect the expected impact of funded projects on energy use and emissions across multiple sectors. In the Buildings sector, the Challenge Envelope policies are modelled through increasing the market share of heat pumps in commercial buildings and using exogenous assumptions to reduce emissions of HFCs. In the heavy industry, the policy is modelled by modifying the market share of fuel to meet the mandated energy demand targets. The model is calibrated to reflect reductions in energy demand and depending on type of project under the Low Carbon Economy Fund program, these policies are either modelled through process energy reductions (process efficiency improvements), device energy reductions (device efficiency improvements), or direct electrification |
Efficiency; End-use fuel switching | ECW 05.1, ECW 05.2 |
| Regulations Amending the Ozone-depleting Substances and Halocarbon Alternatives Regulations | Canada | Cross-Sectoral | Industrial Processes | These amendments aim to reduce the environmental impact of HFCs by limiting their supply and use in Canada. The objective is to curb future emissions by phasing down consumption of HFCs and reducing demand in manufactured products such as refrigeration and air conditioning systems. In the E3MC framework, the policy is modelled as a phasedown of consumption of HFCs to 85% below 2018 baseline levels by 2036. This reduction is applied to the modelled supply and use of HFCs across relevant sectors, contributing to projected emissions reductions in line with international commitments. |
Energy Source Decarbonization | HVI 01 |
| Clean Electricity Regulations | Canada | Electricity | Energy – Stationary Combustion and Fugitive Sources | The Clean Electricity Regulations establish performance standards aimed at reducing GHG emissions from fossil fuel-generated electricity, beginning in 2035. The policy is modelled in the E3MC framework using the latest available information on the regulatory framework. Modelling is conducted jointly with ECCC’s NextGrid model. E3MC incorporates assumptions about compliance pathways, technology deployment and system-level impacts from NextGrid’s detailed electricity system analysis. |
Energy Source Decarbonization | ELE 10 |
| Clean Energy for Rural and Remote Communities Program | Canada | Electricity | Energy – Stationary Combustion and Fugitive Sources | The Clean Energy for Rural and Remote Communities program provides funding for renewable energy and capacity-building projects to reduce the reliance on fossil fuels for heating and electricity in Indigenous, rural and remote communities across Canada. In the E3MC framework, the policy is modelled using assumptions and data about project installations provided by NRCan. These projects are incorporated into the model as exogenous increases in renewable generation capacity, influencing the electricity supply mix and associated emissions trajectories. |
Energy Source Decarbonization; Efficiency | ELE 05, ELE 05.1, ELE 05.2 |
| Emerging Renewable Power Program | Canada | Electricity | Energy – Stationary Combustion and Fugitive Sources | The Emerging Renewable Power Program provides up to $200 million to expand the portfolio of commercially viable renewable energy sources available to provinces and territories as they work to reduce GHG emissions from their electricity sectors. In the E3MC framework, the policy is modelled based on information provided by NRCan. It is assumed that the program results in the installation of 5 MW of geothermal capacity in Saskatchewan and 6 MW in British Columbia. These additions are incorporated into the model as exogenous increases in renewable generation capacity, influencing the electricity supply mix and associated emissions trajectories. |
Energy Source Decarbonization | ELE 03 |
| Investment Tax Credits for CCUS, Clean Electricity, and Clean Technology | Canada | Electricity | Energy – Stationary Combustion and Fugitive Sources | This suite of federal ITCs, introduced through Budget 2022, the 2022 Fall Economic Statement, and Budget 2023, is designed to accelerate the deployment of clean energy technologies across Canada. The ITCs support capital investments in CCUS, energy storage, nuclear, hydro, wind, solar, geothermal, wave, tidal, biomass, and waste-to-energy technologies. In the E3MC framework, the ITCs are modelled by reducing the capital costs of eligible technologies over the duration of the tax credit programs. These cost reductions influence technology adoption rates and investment decisions in the electricity sector, contributing to increased deployment of low- and zero-emission generation capacity. | Energy Source Decarbonization; Efficiency; Negative Emissions | ECW 15, ELE 14, ENB 08 |
| Regulations Amending the Reduction of Carbon Dioxide Emissions from Coal-fired Generation of Electricity Regulations | Canada | Electricity | Energy – Stationary Combustion and Fugitive Sources | These amendments establish a federal emissions performance standard requiring all coal-fired electricity generating units to limit emissions to 420 t CO2 eq gigawatt-hour (GWh) of electricity produced by 2030. The regulation aims to accelerate the phase out of unabated coal-fired electricity generation and support Canada’s broader decarbonization objectives in the electricity sector. In the E3MC framework, the policy is modelled by having coal-fired generation units retire by 2030 for those units which aren’t equipped with CCUS. |
Energy Source Decarbonization | ELE 01 |
| Regulations Limiting Carbon Dioxide Emissions from Natural Gas-fired Generation of Electricity | Canada | Electricity | Energy – Stationary Combustion and Fugitive Sources | The policy sets a performance standard of 420 t CO₂/GWh for natural gas-fired power plants and a standard of 550 t CO₂/GWh for natural gas-fired plants with a capacity of 150 MW or less. This policy is not explicitly modelled. It is assumed that the heat rates of gas-fired power plants subject to this policy are within the required performance standards. |
Energy Source Decarbonization | NA |
| Smart Renewables and Electrification Pathways Program | Canada | Electricity | Energy – Stationary Combustion and Fugitive Sources | The Smart Renewables and Electrification Pathways Program, launched in 2021, is a $4.5-billion program designed to support the deployment of grid modernization, energy storage and renewable energy technologies in every region of Canada, helping to grow the grid in a sustainable, affordable and reliable manner. The program works with provinces, territories and Indigenous Peoples to support critical regional priority projects that will reduce dependence on fossil fuel generation and create pathways for a stronger electricity grid system. The program includes support for transmission and distribution infrastructure, and continues to support grid modernization activities, energy storage, and Indigenous-led clean energy projects. The policy is modelled in the E3MC framework based on an assessment of the projects expected to be implemented using the remaining unspent funds under the With Measures scenario. The framework incorporates assumptions about the scale and type of renewable energy and grid modernization projects that could be supported, adjusting electricity generation and emissions accordingly. Calibration ensures that the model reflects the emissions reductions and system impacts associated with the deployment of these projects. |
Energy Source Decarbonization | ELE 04 |
| Strategic Interconnections in electricity | Canada | Electricity | Energy – Stationary Combustion and Fugitive Sources | This policy supports the extension of electricity transmission agreements between Manitoba and Saskatchewan, and between Québec and New Brunswick, for the period 2041 to 2050. In the E3MC framework, the policy is modelled using information provided by NRCan. The extended contracts are represented as sustained interprovincial electricity flows over the 2041 to 2050 period, influencing the regional supply mix and emissions profiles. These flows are treated as exogenous inputs to reflect the expected continuation of electricity trade under the renewed agreements. |
Energy Source Decarbonization | ELE 08 |
| Net Zero Accelerator (Iron and Steel) | Canada | Heavy Industry | Energy – Stationary Combustion and Fugitive Sources | This policy supports the decarbonisation of Canada’s iron and steel sector through targeted investments in low-emission production technologies. Specifically, it models the conversion of two integrated steel facilities in Ontario (Algoma and ArcelorMittal Dofasco) from traditional blast furnace–basic oxygen furnace operations to electric arc furnace and natural gas-based direct reduced iron with electric arc furnace, respectively. These projects are funded through SIF–NZA. In the E3MC framework, the policy is modelled by adjusting technology shares and emissions intensities for steel production in Ontario. The transition to electric arc furnace and direct reduced iron technologies is reflected in reduced process emissions and energy use, contributing to sectoral GHG reductions. |
End-use fuel switching | HVI 03 |
| NZA Critical Minerals | Canada | Heavy Industry | Energy – Stationary Combustion and Fugitive Sources | This policy represents a federal investment of $222 million through the SIF–NZA to support Rio Tinto Iron and Titanium in expanding its production of critical minerals (including lithium, titanium, and scandium) while decarbonizing its operations in Sorel-Tracy, Québec. The objective is to strengthen Canada’s critical minerals supply chain and reduce emissions from industrial processes. In the E3MC framework, the policy is modelled by adjusting production capacity and emissions intensity for the targeted facility. The investment is assumed to enable increased output of critical minerals alongside reductions in process-related GHG emissions, contributing to both economic and environmental objectives. |
End-use fuel switching | HVI 03 |
| 2 Billion Trees Program | Canada | LULUCF | LULUCF | The 2 Billion Trees program is a federal initiative aimed at planting two billion trees across Canada by 2031. With an investment of up to $3.2 billion over 10 years, the program supports provinces, territories, municipalities, Indigenous organizations, and third-party groups (both for-profit and not-for-profit) in undertaking large-scale tree planting projects. The objective is to enhance carbon sequestration, restore ecosystems, and contribute to Canada’s climate and biodiversity goals. The GHG impact estimates of this policy are developed outside of the E3MC framework using a combination of actual planting data and projected future activities, categorized by afforestation, reforestation, and urban planting. These are modelled using the Carbon Budget Model and the Urban Tree Growth Model, incorporating factors such as tree species, planting location, and land type, with assumptions based on funding allocations and implementation costs. The projected GHG impact estimates were calculated before Budget 2025 announcements and will be revised in later reports based on new information. |
Negative Emissions | NBS01-.2 |
| Regulations Respecting Reduction in the Release of Methane and Certain Volatile Organic Compounds (Upstream Oil and Gas sector) | Canada | Oil & Gas | Industrial Processes | This federal regulation serves as a backstop to reduce methane emissions in the upstream Oil and Gas sector. It targets reductions in methane and certain volatile organic compounds through regulatory measures, with implementation timelines and compliance requirements defined at the federal level. Provincial systems were considered in the development of the WM scenario projections, ensuring alignment with regional approaches. In the E3MC framework, reductions are modelled using an ECCC bottom-up methane emissions model, assuming a 40% to 45% decrease in methane emissions by 2025 relative to 2012 levels. The model estimates reductions as a percentage of technically achievable methane abatement, disaggregated by province and subsector. These estimates are used to tune E3MC model variables to reflect expected emissions outcomes under the policy. |
Energy Source Decarbonization | OIG-02 |
| Decarbonization of the rail sector – Memorandum of Understanding | Canada | Transportation | Transport | This policy represents emissions intensity reduction targets for 2030 that have been committed to by Class 1 freight railways under the Memorandum of Understanding. In the E3MC framework, this policy is modelled by applying a declining emissions intensity constraint to freight rail operations. The model reflects improvements in fuel efficiency and the adoption of lower-emission technologies, which reduce the emissions per unit of freight transported and contribute to overall emissions reductions in the Transportation sector. |
Efficiency | TRN-10 |
| Electric Vehicle Availability Standard | Canada | Transportation | Transport | EVAS establishes mandatory sales targets for ZEVs in the light-duty vehicle segment. The regulation requires that ZEVs make up 20% of new vehicle sales by 2026, 60% by 2030, and 100% by 2035. These targets are designed to accelerate the transition to cleaner transportation technologies and reduce GHG emissions from passenger vehicles and light trucks. The policy is modelled in the E3MC framework by adjusting the market share of vehicle technologies to meet the mandated ZEV sales targets. The model is calibrated to reflect the increasing share of ZEVs over time, ensuring that the projected vehicle fleet composition aligns with the mandated sales trajectory and associated emissions reductions. Although the policy was initially scheduled to begin in 2026, a fall 2025 announcement confirmed it will be amended to remove the 2026 model year target to ease economic pressures from tariffs and conduct a broader review. Pending further developments, internal modelling assumes implementation in 2027 with the original sales target maintained, except for 2026. Future modelling will be updated once final standards are confirmed. |
End-use fuel switching | TRN-02 |
| Green Freight Program | Canada | Transportation | Transport | This federal initiative provides $200 million in funding over five years (2023 to 2027) to support retrofits of large trucks in the freight sector. The program aims to improve fuel efficiency and reduce GHG emissions from on-road freight through fleet energy assessments, fleet retrofits, engine repowers, best-practice implementation and the purchase of low-carbon vehicles. In the E3MC framework, the policy is modelled by applying efficiency improvements to the heavy-duty vehicle (HDV) stock, based on assumed uptake of retrofit technologies. These improvements are reflected in reduced fuel consumption and emissions in the freight transportation sector over the funding period. |
Efficiency | TRN-08 |
| Heavy-duty vehicles GHG emissions standards for heavy-duty vehicle model years 2014 to 2018 (HDV-1) and 2021 to 2027 (HDV-2) | Canada | Transportation | Transport | These federal regulations set GHG emissions standards for new HDVs and aim to improve fuel efficiency and reduce emissions from new gasoline and diesel HDVs. In the E3MC framework, HDV-2 (which covers model years 2021 to 2027) is modelled by applying efficiency improvements to new HDV gasoline and diesel engines over the 2021 to 2027 period. These improvements are incorporated into the vehicle stock turnover and emissions projections, influencing fuel consumption and GHG emissions in the freight transportation sector. HDV-1 applied to model years 2014 to 2018 and is now fully reflected in historical data; as such, it is no longer explicitly modelled. |
Efficiency | TRN-04 |
| Incentives for Medium- and Heavy-Duty Zero-Emission Vehicles | Canada | Transportation | Transport | This federal policy provides purchase incentives for medium- and heavy-duty ZEVs, aiming to accelerate the adoption of cleaner technologies in the commercial transportation sector. The incentives reduce the upfront cost of ZEVs, supporting emissions reductions and air quality improvements. Funding through this program is scheduled to conclude in March 2026. The policy is modelled in the E3MC framework by adjusting the market share of vehicle technologies to meet the mandated ZEV sales targets. The model is calibrated to reflect the increasing share of ZEVs over time, ensuring that the projected vehicle fleet composition aligns with the mandated sales trajectory and associated emissions reductions. |
End-use fuel switching | TRN-05.2 |
| Incentives to Zero Emission Vehicles | Canada | Transportation | Transport | This federal policy provides financial incentives to support the purchase of ZEVs, aiming to accelerate the transition to cleaner transportation technologies in the light-duty vehicle market. The incentives reduce the upfront cost of ZEVs, encouraging consumer adoption and contributing to national GHG reduction goals. Funding through this program was concluded January 2025. The policy is modelled in the E3MC framework by adjusting the market share of vehicle technologies to meet the mandated ZEV sales targets. The model is calibrated to reflect the increasing share of ZEVs over time, ensuring that the projected vehicle fleet composition aligns with the mandated sales trajectory and associated emissions reductions. |
End-use fuel switching | TRN-03 |
| Light-duty vehicles (LDV) GHG emissions standards for the light-duty vehicle model years 2011 to 2016 (LDV-1) and 2017 to 2026 (LDV-2) | Canada | Transportation | Transport | These federal regulations establish GHG emissions standards for new passenger cars and light-duty trucks. The standards mandate annual improvements in new vehicle fuel efficiency: 10% for 2022 to 2023, 5% for 2023 to 2025, and 10% for 2025 to 2026. The standards apply uniformly to all vehicle types, including internal combustion engine vehicles and ZEVs, with no carve-out for ZEVs. In the E3MC framework, LDV-2 (which covers model years 2017 to 2026.) is modelled by applying annual fuel efficiency improvements to new vehicle cohorts over the specified years. These improvements are incorporated into the vehicle stock turnover and emissions projections, influencing fuel consumption and GHG emissions in the light-duty transportation sector. LDV-1 applied to model years 2011 to 2016 and is now fully reflected in historical data; as such, it is no longer explicitly modelled. |
Efficiency | TRN-01 |
| Voluntary emission reductions for planes | Canada | Transportation | Transport | This policy reflects voluntary initiatives aimed at reducing GHG emissions from the aviation sector. The objective is to improve fuel efficiency and reduce the carbon intensity of air travel through operational and technological improvements. In the E3MC framework, the policy is modelled by applying an annual aviation efficiency improvement rate of 1.6%. This assumption influences fuel consumption and emissions projections for the aviation sector, reflecting the expected impact of voluntary measures on overall sector performance. |
Efficiency; End-use fuel switching | TRN-13 |
| Adoption of the National Energy Code for Buildings of Canada (2010 to 2012) | Alberta | Buildings | Energy – Stationary Combustion and Fugitive Sources | These provincial-level policies mandate the adoption of energy efficiency standards for new commercial buildings, based on the 2010 to 2012 versions of the National Energy Code for Buildings of Canada. The objective is to improve the energy performance of new construction by requiring buildings to be approximately 40% more efficient than a defined reference level. In the E3MC framework, the policy is modelled by improving the efficiency of new buildings. These new efficiencies are incorporated into projections for new building stock, contributing to lower energy consumption and GHG emissions over time. |
Efficiency | NA |
| Energy efficiency requirements for housing and small buildings, section 9.36 of the 2014 Alberta Building Code edition | Alberta | Buildings | Energy – Stationary Combustion and Fugitive Sources | The energy efficiency requirements for housing and small buildings under Section 9.36 of the 2014 Alberta Building Code are designed to improve the energy performance of new residential construction. These requirements aim to reduce energy consumption and associated GHG emissions by mandating higher standards for building envelope performance, heating and cooling systems, and ventilation. This policy is not explicitly modelled in the E3MC framework. Instead, its impact is reflected in historical data used for model calibration, which captures the observed changes in energy use patterns resulting from the implementation of the code. |
Efficiency | NA |
| Alberta Large Emitter GHG Regulations – Alberta’s Technology Innovation and Emissions Reduction regulation | Alberta | Cross-Sectoral | Energy – Stationary Combustion and Fugitive Sources; Industrial Processes | The Alberta Large Emitter GHG Regulations, implemented through the Technology Innovation and Emissions Reduction regulation, establish Alberta’s industrial fuel charge and emissions trading system. It requires large industrial facilities to reduce their emissions intensity by meeting either a facility-specific benchmark or a sectoral high-performance benchmark. Facilities that emit below their benchmark can generate credits, while those exceeding their benchmark must purchase credits or pay into the fund. The fund price increases by $15/t CO2 eq annually after 2022, reaching $170/t CO2 eq by 2030. This price trajectory aligns with federal benchmarks and provides a consistent carbon price signal to drive emissions reductions and innovation. In the E3MC framework, the policy is operationalized by applying sector-specific emissions intensity standards alongside a progressively increasing carbon price. This approach simulates the rising cost of GHG emissions over time. The model assumes that sectors respond by adopting cleaner technologies and enhancing operational efficiency when such investments are more cost-effective than incurring carbon compliance costs. |
Efficiency; End-use fuel switching; Energy Source Decarbonization; Negative Emissions; Non-energy Process Emission Reductions | AB-ENG-01 |
| Funding to Emissions Reductions Alberta | Alberta | Cross-Sectoral | Energy – Stationary Combustion and Fugitive Sources | This policy models investments made by Emissions Reductions Alberta into decarbonizing the Heavy Industry sector. In the E3MC framework, this policy is represented as a capital cost reduction for selected industrial technologies. The funding support improves the financial viability of low-carbon solutions in heavy industry, encouraging earlier and broader adoption of emissions-reducing technologies within the model. Calibration is applied where necessary to ensure that projected emissions reductions align with the expected outcomes of the regulations. |
Efficiency; End-use fuel switching; Energy Source Decarbonization | NA |
| Industry – SIF/NZA – Air Products Hydrogen Production | Alberta | Cross-Sectoral | Energy – Stationary Combustion and Fugitive Sources; Industrial Processes | The Industry – SIF/NZA – Air Products Hydrogen Production project was officially announced in November 2022. Under this initiative, Air Products is receiving funding from the SIF-NZA program and the Government of Alberta to construct a hydrogen production complex. The facility is expected to come online in 2024 and will contribute to the development of low-carbon hydrogen as part of Canada’s broader decarbonization strategy. The policy is modelled in the E3MC framework by incorporating the projected hydrogen production capacity and associated emissions reductions from the facility. The framework accounts for the displacement of higher-emission fuels with low-carbon hydrogen in relevant sectors and adjusts emissions accordingly to reflect the impact of the project once operational. |
End-use fuel switching | NA |
| Alberta Coal-Fired Electricity Generation phase out | Alberta | Electricity | Energy – Stationary Combustion and Fugitive Sources | The Alberta Coal-Fired Electricity Generation phase out policy originally aimed to eliminate coal use in electricity generation by 2030. However, this objective was achieved ahead of schedule in 2024. The policy supports GHG emissions reductions in the electricity sector by transitioning away from coal-fired generation toward lower-emitting sources such as natural gas and renewables. The policy is modelled in the E3MC framework through the implementation of retirement and conversion dates for coal-fired electricity plants in Alberta. These changes are reflected in the generation mix and emissions profile of the electricity sector, capturing the impact of the accelerated coal phase out on overall emissions. |
Energy Source Decarbonization | AB-ENG-04 |
| SIF-NZA Assistance to Heidelberg Materials | Alberta | Heavy Industry | Energy – Stationary Combustion and Fugitive Sources; Industrial Processes | This policy represents the federal government’s investment through the SIF-NZA fund to support the decarbonization efforts of Heidelberg Materials in Alberta. The assistance is financial in nature, enabling Heidelberg Materials to implement decarbonization measures that may not have proceeded without government support. In the E3MC framework, the policy is modelled by adjusting industrial emissions trajectories to reflect the expected impact of the funded decarbonization measures. The model incorporates assumptions about technology adoption rates and emissions intensity improvements based on available project data and stakeholder input. Calibration is applied to align emissions reductions with the anticipated outcomes of the investment. |
Negative Emissions | NA |
| Alberta Carbon Capture, Storage and Utilization - Carbon Trunk Line Project – carbon capture and use for enhanced oil recovery | Alberta | Oil & Gas | Energy – Stationary Combustion and Fugitive Sources | The Alberta Carbon Capture, Storage and Utilization – Carbon Trunk Line Project involves the implementation of a large-scale carbon capture and transportation system designed to support enhanced oil recovery and long-term storage. The project captures carbon from industrial sources and transports it via a dedicated pipeline to oil fields for injection. The policy is modelled in the E3MC framework by incorporating the implementation of the Carbon Trunk Line Project into the projections. This includes accounting for the volume of carbon captured and utilized or stored, and adjusting emissions from participating facilities accordingly. The framework reflects the emissions reductions associated with the captured carbon and its diversion from the atmosphere. |
Negative Emissions | AB-CRC-01 |
| Alberta Carbon Capture, Storage and Utilization – Quest, Sturgeon, and Nutrien carbon capture and storage project | Alberta | Oil & Gas | Energy – Stationary Combustion and Fugitive Sources | The Alberta Carbon Capture, Storage and Utilization projects—Quest, Sturgeon, and Nutrien—are large-scale CCS initiatives implemented to reduce GHG emissions from industrial sources. These projects capture carbon from facilities such as hydrogen production and fertilizer plants and store it underground in geological formations, preventing its release into the atmosphere. The policy is modelled in the E3MC framework by incorporating the implementation of these CCS projects into the projections. The framework accounts for the volume of carbon captured and stored by each project and adjusts emissions from the associated facilities accordingly. These reductions are reflected in the sector’s emissions profile over time. |
Negative Emissions | AB-CRC-01 |
| Alberta Oil Sands Emissions Limit Act | Alberta | Oil & Gas Industrial Processes; | Energy – Stationary Combustion and Fugitive Sources | The Alberta Oil Sands Emissions Limit Act establishes a legislated cap on oil sands emissions, limiting them to a maximum of 100 Mt in any year. The Act includes provisions to account for emissions from cogeneration and new upgrading capacity. This policy is not explicitly modelled in the E3MC framework because projected emissions in ECCC’s scenarios remain below the legislated limit. As a result, the cap does not act as a binding constraint within the model’s projections. |
Energy Source Decarbonization | AB-ENG-13 |
| Alberta reduction of methane emissions – Directive 060: Upstream Petroleum Industry Flaring, Incinerating and Venting | Alberta | Oil & Gas | Energy – Stationary Combustion and Fugitive Sources | The Alberta reduction of methane emissions under Directive 060: Upstream Petroleum Industry Flaring, Incinerating and Venting is the province’s regulatory framework targeting methane emissions from the Oil and Gas sector. The directive aims to achieve a 40% to 45% reduction in methane emissions relative to 2012 levels. The policy is modelled in the E3MC framework by applying exogenous reductions in methane emissions from the upstream Oil and Gas sector. These reductions are calibrated to align with the 40% to 45% target relative to 2012 levels. The framework reflects the anticipated impact of regulatory compliance and operational changes on methane emissions over time. |
Energy Source Decarbonization | AB-ENG-14 |
| Alberta Renewable Fuels Standard | Alberta | Transportation | Transport | The Alberta Renewable Fuels Standard mandates a minimum renewable content of 5% ethanol in gasoline and 2% biodiesel in diesel. This policy is designed to reduce GHG emissions in the Transportation sector by displacing a portion of fossil fuels with lower-carbon biofuels. In the E3MC framework, the policy is implemented by modifying the blend ratios of ethanol in gasoline and biodiesel in diesel to align with the mandated renewable fuel content over the policy’s implementation timeline. The model incorporates assumptions regarding the relative carbon intensities of biofuels and conventional fuels to quantify the associated GHG emissions reductions. |
End-use fuel switching | AB-ENG-05 |
| British Columbia Building Green Code | British Columbia | Buildings | Energy – Stationary Combustion and Fugitive Sources | The British Columbia Building Green Code mandates that new buildings are 67% more energy efficient than a defined reference level. This policy is designed to significantly reduce energy consumption and GHG emissions in the building sector by promoting high-performance construction practices and technologies across residential and commercial developments. In the E3MC framework, the policy is modelled by adjusting energy intensity assumptions for new buildings. These adjustments are based on the efficiency improvements mandated by the code and are calibrated using building simulation data and provincial implementation timelines. The impact of several related policies is not explicitly modelled but is reflected in historical data used for calibration. These include:
|
Efficiency | BC-ENG-04 |
| British Columbia Technology and Retrofit Incentive Programs: CleanBC Better Homes and Better Buildings – Heat Pump Incentive | British Columbia | Buildings | Energy – Stationary Combustion and Fugitive Sources | British Columbia’s Technology and Retrofit Incentive Programs under the CleanBC Better Homes and Better Buildings initiative provides $38 million (in 2015$) annually from 2021 to 2030 to support the adoption of electric heat pumps in residential and commercial buildings. The incentives target both space and water heating applications, encouraging a shift away from natural gas appliances. While no specific assumptions are made about how incentives are distributed across building types or end-uses, the program anticipates the installation of 160,000 new residential heat pumps for space heating—representing a 60% increase—covering over 600,000 m2 of floor space annually from 2019 to 2030. By 2030, 53 million m2 of commercial floor space is expected to be heated by heat pumps, a fifteenfold increase compared to 2018 levels. Additionally, 150,000 new residential heat pumps for water heating are projected to replace natural gas systems by 2030. The policy is modelled in the E3MC framework by increasing the adoption of electric heat pumps in both residential and commercial sectors. The framework adjusts technology shares and energy demand profiles to reflect the projected uptake of heat pumps for space and water heating. These adjustments are based on program funding levels and expected market penetration, using the assumptions discussed above. Calibration ensures that the model captures the resulting shift in energy use and associated emissions reductions from reduced reliance on natural gas. |
End-use fuel switching | BC-ENG-06 |
| City of Vancouver Building Codes | British Columbia | Buildings | Energy – Stationary Combustion and Fugitive Sources | The City of Vancouver Building Codes are developed within the broader framework of provincial standards and mandate that new buildings achieve progressively higher levels of energy efficiency. These codes are designed to reduce energy consumption and GHG emissions in the building sector by aligning with or exceeding provincial energy performance requirements. The policy supports the transition to net-zero-ready buildings through the adoption of advanced construction practices and technologies. In the E3MC framework, this policy is not explicitly modelled because the model cannot capture sub-provincial policies. |
Efficiency | NA |
| Revisions for energy efficiency of housing and small buildings (Part 9) (reg # 173/2013) | British Columbia | Buildings | Energy – Stationary Combustion and Fugitive Sources | In the E3MC framework, the effects of this policy are captured through historical energy consumption and emissions trends in the residential building sector. No direct modelling or tuning is applied, as the regulation’s influence is embedded in the data used to calibrate the model. | Efficiency | NA |
| Revisions for energy efficiency of large residential and commercial buildings (Part 3) (reg # 167/2013) | British Columbia | Buildings | Energy – Stationary Combustion and Fugitive Sources | In the E3MC framework, the effects of this policy are captured through historical energy consumption and emissions trends in the residential building sector. No direct modelling or tuning is applied, as the regulation’s influence is embedded in the data used to calibrate the model. | Efficiency | NA |
| Step Code: Increased Energy Efficiency Requirements in the Building Code | British Columbia | Buildings | Energy – Stationary Combustion and Fugitive Sources | In the E3MC framework, the effects of this policy are captured through historical energy consumption and emissions trends in the residential building sector. No direct modelling or tuning is applied, as the regulation’s influence is embedded in the data used to calibrate the model. | Efficiency | BC-BDG 02 |
| BC Output-Based Pricing System | British Columbia | Cross-Sectoral | Energy – Stationary Combustion and Fugitive Sources; Industrial Processes | Effective April 1, 2024, the BC OBPS ensures there is a price incentive for industrial emitters to reduce GHG emissions while promoting innovation and protecting competitiveness. The system establishes GHG emissions performance standards that facilities are required to meet. Facilities that do not meet their standard incur a compliance obligation, with the compliance price increasing annually by $15/t CO₂ eq until it reaches $170/t CO₂ eq in 2030. In the E3MC framework, the policy is operationalized by applying sector-specific emissions intensity standards alongside a progressively increasing carbon price. This approach simulates the rising cost of GHG emissions over time. The model assumes that sectors respond by adopting cleaner technologies and enhancing operational efficiency when such investments are more cost-effective than incurring carbon compliance costs. |
Efficiency; End-use fuel switching; Energy Source Decarbonization; Non-energy Process Emission Reductions | BC-CRC-06 |
| British Columbia Clean Energy Act: Demand Side Management – BC Hydro Demand Side Management Measures | British Columbia | Cross-Sectoral | Energy – Stationary Combustion and Fugitive Sources; Agriculture | This policy is designed to reduce electricity consumption in British Columbia by providing various incentives for consumers to do so. It is implemented by BC Hydro. In the E3MC framework, the policy is modelled by adjusting peak demand profiles and load shapes in the electricity sector. Modelling relies on historical demand data and program performance metrics to estimate the impact on peak load reduction and system efficiency. |
Behavioural Change; Efficiency | BC-ENG-10 |
| British Columbia Clean Energy Act: Demand Side Management – Natural Gas Demand Side Management Measures | British Columbia | Cross-Sectoral | Energy – Stationary Combustion and Fugitive Sources | This policy is designed to reduce natural gas consumption in British Columbia by providing various incentives for consumers to do so. In the E3MC framework, this policy is modelled as a reduction in natural gas demand through increased adoption of energy-efficient technologies and conservation measures. The model reflects the impact of incentives on consumer behaviour, leading to lower natural gas use and associated emissions in the residential, commercial, and industrial sectors. |
Behavioural Change; Efficiency | BC-ENG-10 |
| CleanBC Program for Industry | British Columbia | Cross-Sectoral | Energy – Stationary Combustion and Fugitive Sources; Industrial Processes | Through the CleanBC Program for Industry, British Columbia allocates a portion of carbon tax revenues paid by industrial emitters to support cleaner operations. This includes investments in infrastructure such as transmission grids and access to low-carbon fuels. The program also funds the CleanBC Industry Fund, which supports GHG reduction projects and promotes the adoption of innovative clean technologies across industrial sectors. The policy is modelled in the E3MC framework by calibrating emissions trajectories in the industrial sector to reflect the expected impact of funded projects and technology adoption. The framework incorporates assumptions about emissions reductions based on historical program performance, funding levels, and technology deployment rates. Calibration ensures that the model captures the emissions reductions associated with cleaner industrial operations supported by the program. |
Efficiency; End-use fuel switching; Negative Emissions | BC-ENG-12 |
| British Columbia Clean Energy Act: Clean or Renewable Electricity Requirement | British Columbia | Electricity | Energy – Stationary Combustion and Fugitive Sources | The British Columbia Clean Energy Act sets a target for 100% of electricity generated and supplied to the integrated grid to come from clean or renewable resources by 2030. This is an increase from the previous 93% target. This policy is not explicitly modelled in the E3MC framework because ECCC does not model targets or objectives directly. Instead, the framework represents practical measures such as the construction of new power plants and interties, which are the mechanisms through which the goals of the Clean Energy Act are operationalised. |
Behavioural Change; Efficiency; Energy Source Decarbonization | BC-ENG-09 |
| Demand side management in British Columbia | British Columbia | Electricity | Energy – Stationary Combustion and Fugitive Sources | This policy includes programs implemented in British Columbia to reduce electricity demand during peak periods. These initiatives target residential, commercial, and industrial consumers and aim to shift or lower electricity use during high-demand times through incentives, smart technologies, and behavioural interventions. In the E3MC framework, the policy is modelled by adjusting peak demand profiles and load shapes in the electricity sector. Modelling relies on historical demand data and program performance metrics to estimate the impact on peak load reduction and system efficiency. |
Behavioural Change | NA |
| British Columbia Electrification of the Natural Gas Sector | British Columbia | Heavy Industry | Energy – Stationary Combustion and Fugitive Sources; Industrial Processes | British Columbia’s Electrification of the Natural Gas Sector policy assumes a 15% reduction in natural gas consumption from the province’s natural gas production and processing sectors. This reduction is expected to be achieved through the electrification of operations, replacing fossil fuel-based energy use with electricity to lower sectoral GHG emissions. The policy is modelled in the E3MC framework by reducing natural gas demand in the production and processing sectors by 15% relative to the WM scenario. The framework incorporates this reduction as an exogenous adjustment to energy consumption, based on provincial policy assumptions. Calibration ensures that the model reflects the anticipated shift in energy use and captures the associated emissions reductions from electrification. |
End-use fuel switching | BC-ENG-14 |
| BC New Energy Action Framework | British Columbia | Oil & Gas | Energy – Stationary Combustion and Fugitive Sources | British Columbia’s New Energy Action Framework limits new LNG projects to be net zero by 2030. This requirement applies to future LNG developments, with specific exemptions granted to LNG Canada Phase 1, LNG Canada Phase 2, Cedar LNG, and Woodfibre LNG. The policy is modelled in the E3MC framework by applying emissions constraints to new LNG projects beginning in 2030, excluding the exempted facilities. The framework adjusts emissions trajectories for the natural gas sector by incorporating assumptions about the deployment of emissions abatement technologies and offset mechanisms. |
Energy Source Decarbonization; Negative Emissions | NA |
| British Columbia Methane Reduction Policy / Regulations | British Columbia | Oil & Gas | Industrial Processes | British Columbia’s provincial methane regulations aim to reduce methane emissions by 40% to 45% relative to 2012 levels. The policy targets the Oil and Gas sector, particularly upstream activities such as production, processing, and transmission. The policy is modelled in the E3MC framework by calibrating methane emissions from the upstream Oil and Gas sector to reflect the targeted 40% to 45% reduction, ensuring that the framework aligns with the expected emissions trajectory under full implementation of the policy. |
Energy Source Decarbonization | BC-ENG-15 |
| British Columbia Light-Duty Zero-Emission Vehicles Act/Mandate | British Columbia | Transportation | Transport | British Columbia’s Light-Duty Zero-Emission Vehicles Act/Mandate is designed to increase the market share of hybrid and electric passenger cars and light-duty trucks. The policy establishes annual sales and lease targets for new light-duty ZEVs, requiring that they comprise 26% of new vehicle sales by 2026, 90% by 2030, and 100% by 2035. The policy is modelled in the E3MC framework by adjusting the market share of light-duty vehicle technologies to meet the mandated ZEV sales targets. The model is calibrated to reflect the increasing share of ZEVs over time, ensuring that the projected vehicle fleet composition aligns with the mandated sales trajectory and associated emissions reductions. |
End-use fuel switching | BC-TRN-03 |
| British Columbia Low Carbon Fuel Standard | British Columbia | Transportation | Transport | British Columbia’s Low Carbon Fuel Standard mandates a 30% reduction in carbon intensity for transportation fuels and a 10% reduction for aviation fuels. The policy is modelled in the E3MC framework by adjusting the carbon intensity of fuels used in the transportation and aviation sectors to reflect the mandated reductions. The framework incorporates assumptions about fuel blending, technology adoption, and market responses based on provincial policy documents and industry data. Calibration ensures that the model captures the expected shift toward lower-carbon fuels and the associated emissions reductions over time. |
End-use fuel switching; Energy Source Decarbonization | BC-TRN-04 |
| British Columbia Low Carbon Fuel Standard – Renewable Fuel Content | British Columbia | Transportation | Transport | British Columbia’s Low Carbon Fuel Standard – Renewable Fuel Content mandates minimum renewable fuel blending requirements, specifically 5% ethanol in gasoline and 8% biodiesel in diesel. These blending levels are intended to reduce the carbon intensity of fuels used in the province and support the broader objectives of the standard by promoting the use of renewable alternatives in the Transportation sector. In the E3MC framework, the policy is implemented by modifying the blend ratios of ethanol in gasoline and biodiesel in diesel to align with the mandated renewable fuel content over the policy’s implementation timeline. The model incorporates assumptions regarding the relative carbon intensities of biofuels and conventional fuels to quantify the associated GHG emissions reductions. |
End-use fuel switching | BC-TRN-04 |
| British Columbia Transport Infrastructure Investments – Municipal Electric Bus Goals | British Columbia | Transportation | Transport | Models municipal targets of 100% of new bus sales be electric by 2029. The policy is modelled in the E3MC framework by adjusting the market share of vehicle technologies to meet the mandated ZEV sales targets. The model is calibrated to reflect the increasing share of ZEVs over time, ensuring that the projected vehicle fleet composition aligns with the mandated sales trajectory and associated emissions reductions. |
End-use fuel switching | BC-TRN-07 |
| CleanBC Go Electric program – HDV | British Columbia | Transportation | Transport | This policy provides rebates to support the adoption of zero-emission medium- and heavy-duty vehicles under the CleanBC Go Electric program. It is intended to reduce emissions from the commercial transportation sector by making clean vehicle technologies more accessible and cost-effective for fleet operators and businesses. In the E3MC framework, this policy is not explicitly modelled, as its effects are implicitly included in the ZEV sales projections provided by Transport Canada. These projections inform the model’s assumptions about ZEV uptake and its associated emissions reductions. |
End-use fuel switching | BC-TRN-08 |
| CleanBC Go Electric program – LDV | British Columbia | Transportation | Transport | This policy provides rebates to encourage the adoption of zero and low emission vehicles under the CleanBC Go Electric program. The program is designed to make zero-emission vehicles more accessible and affordable for consumers. In the E3MC framework, this policy is not explicitly modelled, as its effects are implicitly included in the ZEV sales projections provided by Transport Canada. These projections inform the model’s assumptions about ZEV uptake and its associated emissions reductions. |
End-use fuel switching | BC-TRN-08 |
| British Columbia Landfill Gas Management Regulation | British Columbia | Waste & Others | Waste | British Columbia’s Landfill Gas Management Regulation requires landfills that dispose of 10,000 tonnes of waste per year, or more than 100,000 tonnes in total, to evaluate their methane emissions. If a landfill is found to release more than 1,000 tonnes of methane annually, it must install landfill gas capture systems with a targeted capture rate of 75%. This policy is not explicitly modelled in the E3MC framework because its impacts are already reflected in the historical data used to calibrate the model. As such, no additional adjustments or calibration are applied to represent this regulation separately. |
Behavioural Change | BC-WST-02 |
| CleanBC Organics Infrastructure and Collection Program | British Columbia | Waste & Others | Waste | The program is part of the CleanBC strategy and targets 95% organic waste diversion. In the E3MC framework, this policy is modelled by increasing the diversion rate of organic waste from landfills. |
Behavioural Change | BC-WST-04 |
| Adoption of the National Energy Code for Buildings of Canada (2010 to 2012) | Manitoba | Buildings | Energy – Stationary Combustion and Fugitive Sources | These provincial-level policies mandate the adoption of energy efficiency standards for new commercial buildings, based on the 2010 to 2012 versions of the National Energy Code for Buildings of Canada. The objective is to improve the energy performance of new construction by requiring buildings to be approximately 20% more efficient than a defined reference level. In the E3MC framework, the policy is modelled by improving the efficiency of new buildings. These new efficiencies are incorporated into projections for new building stock, contributing to lower energy consumption and GHG emissions over time. |
Efficiency | NA |
| Manitoba Building Code Section 9.36 (for housing) | Manitoba | Buildings | Energy – Stationary Combustion and Fugitive Sources | The Manitoba Building Code Section 9.36 sets energy efficiency requirements for new housing construction, mandating that new buildings are approximately 20% more energy efficient than a defined reference level. This policy aims to reduce energy consumption and associated GHG emissions in the residential sector by improving the thermal performance of building envelopes and the efficiency of mechanical systems. In the E3MC framework, the policy is modelled by adjusting energy intensity assumptions for new buildings. These adjustments are based on the efficiency improvements mandated by the code and are calibrated using building simulation data and provincial implementation timelines. |
Efficiency | NA |
| The Efficiency Manitoba Act and Energy Efficiency Programing | Manitoba | Cross-Sectoral | Energy – Stationary Combustion and Fugitive Sources | The Efficiency Manitoba Act establishes Efficiency Manitoba Inc., which is mandated to deliver sustained energy savings across the province. The organization is tasked with achieving annual electrical energy savings of 1.5% and natural gas savings of 0.75% during the first 15 years of its operations. These targets are intended to reduce energy consumption and GHG emissions through the implementation of cost-effective energy efficiency programs. Additional savings targets are to be set by regulation for subsequent 15-year periods. The policy is modelled in the E3MC framework by applying exogenous reductions in electricity and natural gas demand in the residential, commercial, and industrial sectors. These reductions are based on the annual savings targets outlined in the Act. The framework adjusts energy consumption trajectories to reflect the cumulative impact of Efficiency Manitoba’s programming, capturing the long-term effects of sustained energy efficiency improvements. |
Behavioural Change; Efficiency | MB-ENG-02 |
| Manitoba electricity demand side management | Manitoba | Electricity | Energy – Stationary Combustion and Fugitive Sources | This policy supports demand side management initiatives in Manitoba aimed at reducing overall electricity consumption and mitigating peak demand. The objective is to enhance energy efficiency and system reliability by encouraging behavioural changes, adoption of energy-efficient technologies, and load-shifting practices among electricity consumers. The policy applies across residential, commercial, and industrial sectors. Implementation is ongoing, with a range of programs and incentives designed to promote energy conservation and demand response. The policy is modelled in the E3MC framework by adjusting electricity demand projections to reflect anticipated reductions in consumption and peak load. These adjustments are informed by provincial program data and historical demand side management performance. The model incorporates assumptions related to efficiency improvements and consumer behaviour, with tuning applied to align with expected energy savings targets and ensure consistency with policy objectives. |
Behavioural Change; Efficiency | NA |
| Manitoba biofuel mandates | Manitoba | Transportation | Transport | The Manitoba biofuel mandates require a minimum renewable fuel content of 10% ethanol in gasoline and 5% biodiesel in diesel by 2022. This policy is intended to reduce GHG emissions from the Transportation sector by displacing a portion of fossil fuels with lower-carbon biofuels. It supports the development of the biofuels industry while maintaining compatibility with existing fuel infrastructure and vehicle technologies. In the E3MC framework, the policy is implemented by modifying the blend ratios of ethanol in gasoline and biodiesel in diesel to align with the mandated renewable fuel content over the policy’s implementation timeline. The model incorporates assumptions regarding the relative carbon intensities of biofuels and conventional fuels to quantify the associated GHG emissions reductions. |
End-use fuel switching | MB-TRN-01 |
| Manitoba Electric Vehicle Rebate Program | Manitoba | Transportation | Transport | This policy offers financial incentives to encourage the adoption of zero-emission vehicles in Manitoba. Eligible Manitobans can receive up to $4,000 for the purchase of a new battery electric or plug-in hybrid vehicle, and up to $2,500 for a used battery electric or plug-in hybrid vehicle. The objective is to accelerate the transition to cleaner transportation by lowering the upfront cost of electric vehicles. The policy targets the Transportation sector and operates through direct consumer rebates. In the E3MC framework, the policy is not explicitly modelled, as its effects are implicitly captured in the zero-emission vehicle sales projections provided by Transport Canada. |
End-use fuel switching | MB-TRN-03 |
| Manitoba Waste Reduction and Recycling Support Payment | Manitoba | Waste & Others | Waste | The Manitoba Composts Program within the Waste Reduction and Recycling Support Payment is an incentivisation program that provides financial support to composting facilities across the province for processing organic waste. The strategy sets an organic waste diversion target of 85 kg/capita. In the E3MC framework, this policy is modelled by increasing the diversion rate of organic materials from landfills. |
Behavioural Change | MB-WST-01 |
| Waste Reduction and Recycling Support Program | Manitoba | Waste & Others | Waste | The Waste Reduction and Recycling Support Program was introduced to discourage landfill disposal and promote waste diversion in Manitoba. Beginning July 1, 2009, a levy of $10 per tonne was applied to all solid waste disposed of at Manitoba landfills. This includes residential, industrial, commercial, institutional, construction, renovation, demolition, and other solid waste materials. The levy generates funds to support waste reduction and recycling initiatives, encouraging more sustainable waste management practices. This policy is not explicitly modelled in the E3MC framework. Its impacts are reflected in historical data used for model calibration, which captures observed changes in waste disposal patterns and associated emissions reductions. |
Behavioural Change | NA |
| Building Codes – Adoption of the National Energy Code for Buildings of Canada (2010 to 2012) | New Brunswick | Buildings | Energy – Stationary Combustion and Fugitive Sources | These provincial-level policies mandate the adoption of energy efficiency standards for new commercial buildings, based on the 2010 to 2012 versions of the National Energy Code for Buildings of Canada. The objective is to improve the energy performance of new construction by requiring buildings to be approximately 25% more efficient than a defined reference level. In the E3MC framework, the policy is modelled by adjusting energy intensity assumptions for new buildings. These adjustments are based on the efficiency improvements mandated by the code and are calibrated using building simulation data and provincial implementation timelines. |
Efficiency | NB-ENG-04 |
| Building Codes – National Building Code of Canada 2015 | New Brunswick | Buildings | Energy – Stationary Combustion and Fugitive Sources | This policy sets energy efficiency requirements for new residential buildings, typically mandating that they are at least 20% more efficient than a defined reference level. While the National Building Code provides the framework, implementation occurs at the provincial level, where jurisdictions adopt and enforce the code through permitting and inspection processes. The policy applies to residential, commercial, and institutional buildings. In the E3MC framework, the policy is modelled by adjusting energy intensity assumptions for new buildings. These adjustments are based on the efficiency improvements mandated by the code and are calibrated using building simulation data and provincial implementation timelines. |
Efficiency | NB-ENG-04 |
| New Brunswick Climate Change Fund | New Brunswick | Cross-Sectoral | Energy – Stationary Combustion and Fugitive Sources | This policy directs carbon tax revenues toward initiatives that reduce GHG emissions, enhance climate resilience, and support climate-related education in New Brunswick. Funded projects span multiple sectors and are updated regularly. Many of these initiatives are captured under other policies in this list. In the E3MC framework, this policy is not explicitly modelled. Since the fund supports a range of measures already represented in other policies, its effects are considered indirectly through the modelling of those specific initiatives. |
Efficiency; End-use fuel switching | NB-CRC-03 |
| New Brunswick Output Based Pricing for Industry and Electricity | New Brunswick | Cross-Sectoral | Energy – Stationary Combustion and Fugitive Sources; Industrial Processes | This policy regulates GHG emissions from large emitters in New Brunswick’s industrial and electricity generation sectors through OBPS. Facilities emitting over a specified threshold are assigned GHG emissions performance standards (EPS) they must meet. Facilities that exceed their EPS face compliance obligations. The compliance price increases by $15 /t CO2 eq annually after 2022, reaching $170 /t CO2 eq by 2030. In the E3MC framework, the policy is operationalized by applying sector-specific emissions intensity standards alongside a progressively increasing carbon price. This approach simulates the rising cost of GHG emissions over time. The model assumes that sectors respond by adopting cleaner technologies and enhancing operational efficiency when such investments are more cost-effective than incurring carbon compliance costs. |
Efficiency; End-use fuel switching; Energy Source Decarbonization; Non-energy Process Emission Reductions | NB-CRC-05 |
| New Brunswick Electricity Act, Renewable Portfolio Standard Regulation, and Energy Efficiency Mandate | New Brunswick | Electricity | Energy – Stationary Combustion and Fugitive Sources | This policy aimed to ensure that 40% of NB Power’s in-province electricity sales were supplied by renewable energy sources by 2020. It applies to the electricity generation and distribution sectors and supports the province’s broader clean energy and efficiency goals. The policy is implemented through regulatory mandates and utility obligations. In the E3MC framework, this policy is not explicitly modelled. ECCC focuses on modelling practical measures (such as new power plants and interties) rather than targets or objectives. As such, the effects of this policy are considered indirectly through the modelling of infrastructure and supply-side developments. |
Energy Source Decarbonization | NB-ENG-08 |
| New Brunswick electricity demand side management | New Brunswick | Electricity | Energy – Stationary Combustion and Fugitive Sources | This policy supports demand side management initiatives in New Brunswick aimed at reducing overall electricity consumption and mitigating peak demand. The objective is to enhance energy efficiency and system reliability by encouraging behavioural changes, adoption of energy-efficient technologies, and load-shifting practices among electricity consumers. The policy applies across residential, commercial, and industrial sectors. Implementation is ongoing, with a range of programs and incentives designed to promote energy conservation and demand response. The policy is modelled in the E3MC framework by adjusting electricity demand projections to reflect anticipated reductions in consumption and peak load. These adjustments are informed by provincial program data and historical demand side management performance. The model incorporates assumptions related to efficiency improvements and consumer behaviour, with tuning applied to align with expected energy savings targets and ensure consistency with policy objectives. |
Behavioural Change; Efficiency | NA |
| Electrify Rebate Program | New Brunswick | Transportation | Transport | This policy provides provincial rebates to support the adoption of zero-emission vehicles. A $5,000 rebate is available for the purchase or lease of a new battery-electric vehicle or a long-range plug-in hybrid electric vehicle. A $2,500 rebate is available for the purchase or lease of a shorter-range plug-in hybrid or a used battery-electric or plug-in hybrid vehicle. In the E3MC framework, the policy is not explicitly modelled, as its effects are implicitly captured in the zero-emission vehicle sales projections provided by Transport Canada. |
End-use fuel switching | NB-TRN-02 |
| Building Codes – Adoption of the National Energy Code for Buildings of Canada (2010 to 2012) | Newfoundland and Labrador | Buildings | Energy – Stationary Combustion and Fugitive Sources | These provincial-level policies mandate the adoption of energy efficiency standards for new commercial buildings, based on the 2010 to 2012 versions of the National Energy Code for Buildings of Canada. The objective is to improve the energy performance of new construction by requiring buildings to be approximately 20% more efficient than a defined reference level. In the E3MC framework, the policy is modelled by adjusting energy intensity assumptions for new buildings. These adjustments are based on the efficiency improvements mandated by the code and are calibrated using building simulation data and provincial implementation timelines. |
Efficiency | NA |
| Fuel oil to electricity incentive program | Newfoundland and Labrador | Buildings | Energy – Stationary Combustion and Fugitive Sources | This program is a collaborative initiative between the provincial government, NRCan, and ECCC. It aims to encourage fuel switching from oil to electricity by providing financial incentives for the adoption of electric heating technologies. Eligible technologies include mini-split and multi-split heat pumps, central heat pumps, electric furnaces, and electric boilers. In the E3MC framework, the policy is modelled by simulating the replacement of oil-based heating systems with electric alternatives in the Buildings sector. This transition results in reduced fossil fuel consumption and associated GHG emissions, contributing to decarbonization of home heating. |
End-use fuel switching | NL-ENG-02 |
| Green Technology Tax Credit | Newfoundland and Labrador | Cross-Sectoral | Energy – Stationary Combustion and Fugitive Sources; Industrial Processes; Agriculture; Transport | Canadian Controlled Private Corporations that invest in equipment that generates or conserves renewable-source energy, uses fuels from waste, or makes efficient use of fossil fuels may be entitled to a credit equal to 20% of the capital cost of that equipment. In the E3MC framework, this policy is modelled as an investment cost reduction applied to eligible technologies. The credit lowers the effective capital cost of qualifying equipment, thereby improving its economic attractiveness and influencing technology adoption decisions within the model. Calibration is applied where necessary to ensure that projected emissions reductions align with the expected outcomes of the regulations. |
Efficiency; End-use fuel switching | NL-ENG-01 |
| Newfoundland and Labrador carbon pricing | Newfoundland and Labrador | Cross-Sectoral | Energy – Stationary Combustion and Fugitive Sources; Industrial Processes | This policy establishes a performance standards system for large industrial facilities and large-scale electricity generators in Newfoundland and Labrador that emit more than 25 kt CO2 eq annually. Under this regulatory framework, facilities are assigned GHG EPS that they must meet. Facilities exceeding their EPS face compliance obligations, with the compliance price increasing by $15 /t CO2 eq annually after 2022, reaching $170 /t CO2 eq by 2030. The policy applies to the industrial and electricity generation sectors and is enforced through annual emissions reporting and verification. In the E3MC framework, the policy is operationalized by applying sector-specific emissions intensity standards alongside a progressively increasing carbon price. This approach simulates the rising cost of GHG emissions over time. The model assumes that sectors respond by adopting cleaner technologies and enhancing operational efficiency when such investments are more cost-effective than incurring carbon compliance costs. |
Efficiency; End-use fuel switching; Energy Source Decarbonization; Non-energy Process Emission Reductions | NL-CRC-01 |
| Maritime Transmission Link Project | Newfoundland and Labrador | Electricity | Energy – Stationary Combustion and Fugitive Sources | The Maritime Transmission Link Project delivers renewable electricity from Muskrat Falls in Labrador through Newfoundland to Nova Scotia. In the E3MC framework, the policy is modelled by adding exogenous contracts consisting of increased exports of hydropower from Muskrat Falls in Labrador to Nova Scotia. |
Energy Source Decarbonization | NA |
| Electric vehicle incentive program | Newfoundland and Labrador | Transportation | Transport | Newfoundland and Labrador delivers an EV incentive program for residential and commercial sector battery and plug-in hybrid electric vehicles. Rebates are available for 100% all-electric and plug-in hybrid vehicles purchased or leased between April 1, 2023, and March 15, 2025. In the E3MC framework, the policy is not explicitly modelled, as its effects are implicitly captured in the zero-emission vehicle sales projections provided by Transport Canada. |
End-use fuel switching | NL-TRN-01 |
| Waste Management Strategy | Newfoundland and Labrador | Waste & Others | Waste | This policy aims to increase the provincial solid waste diversion rate to 50%. It also targets a reduction in the number of waste disposal sites across the province. In the E3MC framework, the policy is modelled by adjusting waste diversion rates over time. Modelling uses waste management data, diversion targets, and historical trends to estimate the impact on GHG emissions from the waste sector. |
Behavioural Change | NA |
| Biomass Strategy | Northwest Territories | Buildings | Energy – Stationary Combustion and Fugitive Sources | The Biomass Strategy outlines a plan to reduce emissions and energy costs by increasing the use of biomass products, such as locally sourced and imported wood, in place of fossil fuels. The policy is modelled in the E3MC framework by adjusting fuel shares in relevant sectors to reflect increased biomass use. Calibration ensures that the model captures the emissions reductions and energy system impacts associated with the shift from fossil fuels to biomass. |
End-use fuel switching | NA |
| Building Codes – Adoption of the National Energy Code for Buildings of Canada (2010 to 2012) | Northwest Territories | Buildings | Energy – Stationary Combustion and Fugitive Sources | These provincial-level policies mandate the adoption of energy efficiency standards for new commercial buildings, based on the 2010 to 2012 versions of the National Energy Code for Buildings of Canada. The objective is to improve the energy performance of new construction by requiring buildings to be approximately 20% more efficient than a defined reference level. In the E3MC framework, the policy is modelled by improving the efficiency of new buildings. These new efficiencies are incorporated into projections for new building stock, contributing to lower energy consumption and GHG emissions over time. |
Efficiency | NA |
| NWT 2030 Energy Strategy | Northwest Territories | Cross-Sectoral | Energy – Stationary Combustion and Fugitive Sources | The policy provides a framework for developing secure, affordable, and sustainable energy in the Northwest Territories across transportation, heating, and electricity. It supports energy efficiency and conservation programs, local renewable and alternative energy solutions, and large-scale energy projects. This policy is not explicitly modelled because the projects it funds are included under other policies in this list. |
Energy Source Decarbonization; End-use fuel switching; Efficiency; Behavioural Change | NT-ENG-03 |
| NWT Carbon Tax | Northwest Territories | Cross-Sectoral | Energy – Stationary Combustion and Fugitive Sources | The Northwest Territories carbon tax establishes a gradually increasing price on carbon emissions, with the rate rising by $15 per t CO₂ eq annually after 2022. This escalation continues until the tax reaches $170 per tonne by 2030. The policy is designed to incentivise emissions reductions across sectors by making carbon-intensive activities costlier and encouraging the adoption of cleaner alternatives. The carbon tax has been eliminated for all consumers except large emitters effective April 1, 2025. In the E3MC framework, the policy is implemented by applying a price on GHG emissions across covered sectors. This carbon price increases over time. The model assumes that sectors respond by reducing emissions through fuel switching, energy efficiency improvements, and the adoption of low-carbon technologies, whenever these measures are more cost-effective than paying the carbon costs. |
Behavioural Change; Efficiency; End-use fuel switching | NT-CRC-02 |
| Building Codes – Adoption of the National Energy Code for Buildings of Canada (2010 to 2012) | Nova Scotia | Buildings | Energy – Stationary Combustion and Fugitive Sources | These provincial-level policies mandate the adoption of energy efficiency standards for new commercial buildings, based on the 2010 to 2012 versions of the National Energy Code for Buildings of Canada. The objective is to improve the energy performance of new construction by requiring buildings to be approximately 20% more efficient than a defined reference level. In the E3MC framework, the policy is modelled by adjusting energy intensity assumptions for new buildings. These adjustments are based on the efficiency improvements mandated by the code and are calibrated using building simulation data and provincial implementation timelines. |
Efficiency | NA |
| Nova Scotia’s Output-based Pricing System for Industry | Nova Scotia | Cross-Sectoral | Energy – Stationary Combustion and Fugitive Sources; Industrial Processes | Nova Scotia’s OBPS for Industry is a regulatory system that establishes GHG EPS for industrial facilities. Facilities that do not meet their EPS are subject to a compliance obligation. The compliance price increases annually by $15/t CO₂ eq after 2022, reaching $170/t CO₂ eq by 2030. In the E3MC framework, the policy is operationalized by applying sector-specific emissions intensity standards alongside a progressively increasing carbon price. This approach simulates the rising cost of GHG emissions over time. The model assumes that sectors respond by adopting cleaner technologies and enhancing operational efficiency when such investments are more cost-effective than incurring carbon compliance costs. |
Efficiency; End-use fuel switching; Energy Source Decarbonization; Non-energy Process Emission Reductions | NS-CRC-02 |
| Nova Scotia electricity demand side management | Nova Scotia | Electricity | Energy – Stationary Combustion and Fugitive Sources | This policy includes programs implemented in Nova Scotia to reduce electricity demand during peak periods. These initiatives target residential, commercial, and industrial consumers and aim to shift or lower electricity use during high-demand times through incentives, smart technologies, and behavioural interventions. In the E3MC framework, the policy is modelled by adjusting peak demand profiles and load shapes in the electricity sector. Modelling relies on historical demand data and program performance metrics to estimate the impact on peak load reduction and system efficiency. |
Behavioural Change | NA |
| Nova Scotia GHG Emissions Regulations | Nova Scotia | Electricity | Energy – Stationary Combustion and Fugitive Sources | This policy establishes a declining cap on annual GHG emissions from Nova Scotia’s electricity sector. The cap is designed to progressively reduce emissions over time, supporting the province’s broader climate objectives. It applies to electricity generators and is enforced through regulatory limits and compliance reporting. In the E3MC framework, the policy is modelled by applying annual emissions caps to the electricity generation sector. The model adjusts generation mixes and emissions factors to reflect compliance with the cap, using provincial regulatory data and historical emissions trends to calibrate the trajectory of reductions. |
Energy Source Decarbonization | NS-ENG-04 |
| Nova Scotia Renewable Electricity Regulations | Nova Scotia | Electricity | Energy – Stationary Combustion and Fugitive Sources | This policy mandates increasing shares of electricity generation from renewable sources (such as wind, solar, biomass, and hydro) within Nova Scotia’s electricity sector. The targets are set at 40% renewable electricity by 2023, 70% by 2026, and 80% by 2030. These requirements apply to electricity generators and are enforced through regulatory compliance mechanisms. In the E3MC framework, the policy is modelled by adjusting the electricity generation mix to meet the specified renewable energy targets. The model incorporates changes in capacity and generation shares for renewable technologies, using provincial energy plans and historical generation data to calibrate the transition and associated emissions impacts. |
Energy Source Decarbonization | NS-ENG-04 |
| Nova Scotia’s 2030 Clean Power Plan | Nova Scotia | Electricity | Energy – Stationary Combustion and Fugitive Sources | This policy commits Nova Scotia to phasing out all coal-fired electricity generation by 2030. In the E3MC framework, the policy is not explicitly modelled as it is already indirectly modelled through the Regulations Amending the Reduction of Carbon Dioxide Emissions from Coal-fired Generation of Electricity Regulations. |
Energy Source Decarbonization | NS-ENG-05 |
| Building Codes – Adoption of the National Energy Code for Buildings of Canada (2010 to 2012) | Nunavut | Buildings | Energy – Stationary Combustion and Fugitive Sources | These provincial-level policies mandate the adoption of energy efficiency standards for new commercial buildings, based on the 2010 to 2012 versions of the National Energy Code for Buildings of Canada. The objective is to improve the energy performance of new construction by requiring buildings to be approximately 20% more efficient than a defined reference level. In the E3MC framework, the policy is modelled by adjusting energy intensity assumptions for new buildings. These adjustments are based on the efficiency improvements mandated by the code and are calibrated using building simulation data and provincial implementation timelines. |
Efficiency | NA |
| Ontario's Building Code | Ontario | Buildings | Energy – Stationary Combustion and Fugitive Sources | These provincial-level policies mandate the adoption of energy efficiency standards for new buildings, based on the 2010 to 2012 versions of the National Energy Code for Buildings of Canada. The objective is to improve the energy performance of new construction by requiring buildings to be approximately 20% more efficient than a defined reference level. In the E3MC framework, the policy is modelled by adjusting energy intensity assumptions for new buildings. These adjustments are based on the efficiency improvements mandated by the code and are calibrated using building simulation data and provincial implementation timelines. |
Efficiency | ON-ENG-03 |
| Cleaner Transportation Fuels: Renewable Content Requirements for Gasoline and Diesel Fuels | Ontario | Cross-Sectoral | Transport | The Cleaner Transportation Fuels policy establishes renewable content requirements for transportation fuels in Ontario, targeting a 4% biodiesel content in diesel and a 15% ethanol content in gasoline by 2030. This policy aims to reduce GHG emissions from the Transportation sector by increasing the use of lower-carbon biofuels. It supports the transition to cleaner fuels while maintaining compatibility with existing vehicle technologies and fuel distribution infrastructure. In the E3MC framework, the policy is implemented by modifying the blend ratios of ethanol in gasoline and biodiesel in diesel to align with the mandated renewable fuel content over the policy’s implementation timeline. The model incorporates assumptions regarding the relative carbon intensities of biofuels and conventional fuels to quantify the associated GHG emissions reductions. |
End-use fuel switching | ON-TRN-01 |
| 2021 to 2024 Conservation and Demand Management Framework – Electricity | Ontario | Cross-Sectoral | Energy – Stationary Combustion and Fugitive Sources | The 2021 to 2024 Conservation and Demand Management Framework was established by Ontario to support energy efficiency programs aimed at reducing electricity consumption and peak demand in the residential, commercial, and agriculture sectors. These programs are designed to improve energy performance, lower electricity bills, and contribute to GHG emissions reductions by encouraging the adoption of efficient technologies and practices. The policy is modelled in the E3MC framework as a process retrofit, using exogenous reductions in electricity process energy demand relative to the base case. Electricity savings from 2020 to 2040 are derived from the Independent Electricity System Operator’s Annual Planning Outlook Demand Forecast 2020, which provides estimates for both Near-Term Framework Energy Savings and Long-Term Framework Energy Savings. These savings are incorporated into the framework to reflect the expected impact of the conservation programs on electricity demand over time. |
Behavioural Change; Efficiency | ON-ENG-12 |
| Ontario GHG Emissions Performance Standards Regulation | Ontario | Cross-Sectoral | Energy – Stationary Combustion and Fugitive Sources | The Ontario GHG EPS is a regulatory program that holds large facilities in manufacturing, resource and electricity generation industries accountable for their GHG emissions by applying emissions performance standards. These standards set annual GHG emissions limits for regulated facilities. A facility can comply with the program by either:
The carbon price under the EPS increases by $15/t CO2 eq annually after 2022, reaching $170/t CO2 eq for 2030. This price path aligns with federal benchmarks and provides a clear signal to encourage investment in emissions-reducing technologies. In the E3MC framework, the policy is operationalized by applying sector-specific emissions intensity standards alongside a progressively increasing carbon price. This approach simulates the rising cost of GHG emissions over time. The model assumes that sectors respond by adopting cleaner technologies and enhancing operational efficiency when such investments are more cost-effective than incurring carbon compliance costs. |
Efficiency; End-use fuel switching; Energy Source Decarbonization | ON-CRC-02 |
| Ontario Natural Gas Demand Side Management Programs | Ontario | Cross-Sectoral | Energy – Stationary Combustion and Fugitive Sources | The Ontario Natural Gas Demand Side Management Programs support the delivery of natural gas conservation and energy efficiency initiatives across the province. These programs are implemented by Ontario’s two largest natural gas distributors (Enbridge Gas Distribution and Union Gas) under the Demand Side Management Framework. The objective is to reduce natural gas consumption in residential, commercial, and industrial sectors through measures such as equipment upgrades, process improvements, and behavioural changes, thereby contributing to GHG emissions reductions. The policy is modelled in the E3MC framework as a process retrofit, using exogenous reductions in natural gas process energy demand relative to the base case. These reductions are inferred from GHG savings data provided by the Government of Ontario. The framework also incorporates exogenous program-related process investments, which are based on the approved budgets for the participating natural gas distributors. This approach allows the model to reflect the impact of Demand Side Management programs on energy use and emissions without explicitly modelling each individual measure. |
Efficiency; Behavioural Change | ON-ENG-04 |
| Feed-in tariff program | Ontario | Electricity | Energy – Stationary Combustion and Fugitive Sources | This policy was developed to encourage and promote the use of renewable energy sources for electricity generation in Ontario. It supported small-scale projects ranging from 10 kW to 500 kW by offering guaranteed pricing for electricity fed into the grid. The program aimed to stimulate investment in renewable technologies such as solar, wind, and biomass. In the E3MC framework, this policy is not explicitly modelled. ECCC does not model targets or program objectives directly but rather incorporates practical measures such as new power plants and interties. The renewable energy projects resulting from this program are reflected in the historical electricity generation data used for model calibration. |
Energy Source Decarbonization | NA |
| Ontario Electricity Demand Side Management | Ontario | Electricity | Energy – Stationary Combustion and Fugitive Sources | This policy supports demand side management initiatives in Ontario aimed at reducing overall electricity consumption and mitigating peak demand. The objective is to enhance energy efficiency and system reliability by encouraging behavioural changes, adoption of energy-efficient technologies, and load-shifting practices among electricity consumers. The policy applies across residential, commercial, and industrial sectors. Implementation is ongoing, with a range of programs and incentives designed to promote energy conservation and demand response. The policy is modelled in the E3MC framework by adjusting electricity demand projections to reflect anticipated reductions in consumption and peak load. These adjustments are informed by provincial program data and historical Demand Side Management performance. The model incorporates assumptions related to efficiency improvements and consumer behaviour, with tuning applied to align with expected energy savings targets and ensure consistency with policy objectives. |
Efficiency; Behavioural Change | NA |
| Ontario Municipal Bus Electrification Goals | Ontario | Transportation | Transport | This policy sets a target for 50% of new municipal bus sales in Ontario to be electric by 2030. It supports the decarbonisation of public transit fleets and applies to municipal transit agencies across the province. The policy is implemented through funding programs, procurement guidelines, and infrastructure support for electric vehicle deployment. In the E3MC framework, the policy is modelled by increasing the share of electric buses in the municipal transit fleet over time. Modelling incorporates vehicle turnover rates and program targets to estimate impacts on energy use and GHG emissions in the Transportation sector. |
End-use fuel switching | NA |
| Renewable Fuel Content | Ontario | Transportation | Transport | This policy mandates minimum renewable content in transportation fuels, requiring 4% biodiesel in diesel and 15% ethanol in gasoline by 2030. It targets fuel suppliers and aims to reduce GHG emissions from the Transportation sector by increasing the use of bio-based, low-carbon fuels. In the E3MC framework, the policy is implemented by modifying the blend ratios of ethanol in gasoline and biodiesel in diesel to align with the mandated renewable fuel content over the policy’s implementation timeline. The model incorporates assumptions regarding the relative carbon intensities of biofuels and conventional fuels to quantify the associated GHG emissions reductions. |
End-use fuel switching | ON-TRN-01 |
| Food and Organic Waste Policy Statement | Ontario | Waste & Others | Waste | The policy statement establishes sector-specific waste reduction and resource recovery targets to assess progress in addressing food and organic waste. Municipalities and specified industrial, commercial, and institutional facilities must achieve 50% to 70% waste reduction and resource recovery of food and organic waste generated. In the E3MC framework, this policy is modelled by adjusting organic waste diversion rates. The model reflects increased recovery of organic materials, which reduces landfill emissions. |
Behavioural Change | NA |
| Landfill Gas Regulation | Ontario | Waste & Others | Waste | This policy requires that any new or expanding landfill site in Ontario with a capacity greater than 1.5 million cubic metres must install landfill gas collection systems. The regulation aims to reduce methane emissions from landfills by capturing and managing landfill gas. It applies to landfill operators and is enforced through permitting and compliance inspections. In the E3MC framework, this policy is not explicitly modelled. Its impacts are reflected in the historical emissions data used for model calibration, as the effects of landfill gas capture are already embedded in observed trends. |
Negative Emissions | NA |
| Strategy for a Waste-free Ontario | Ontario | Waste & Others | Waste | This policy outlines Ontario’s long-term strategy to transition to a circular economy, with the goal of eliminating GHG emissions from the waste sector. It sets interim diversion targets of 30%, 50%, and 80%. The strategy applies across residential, commercial, and industrial waste streams and promotes waste reduction, reuse, recycling, and recovery through regulatory, economic, and educational measures. In the E3MC framework, the policy is modelled by adjusting waste diversion rates over time. Modelling uses waste management data, diversion targets, and historical trends to estimate the impact on GHG emissions from the waste sector. |
Behavioural Change | NA |
| Prince Edward Island Building Code Act | Prince Edward Island | Buildings | Energy – Stationary Combustion and Fugitive Sources | This policy mandates that new buildings in Prince Edward Island achieve energy performance levels at least 20% higher than a defined reference standard. It applies to the residential and commercial building sectors and is implemented through updates to the provincial building code. Compliance is enforced through permitting and inspection processes. In the E3MC framework, the policy is modelled by adjusting new building energy intensity assumptions, based on provincial code specifications and national energy efficiency benchmarks. Modelling relies on data from building energy simulations and regulatory documents to estimate the impact on energy demand and associated GHG emissions. |
Efficiency | PE-ENG-06 |
| PEI Electric Vehicle Rebate Program | Prince Edward Island | Transportation | Transport | This policy provides rebates to support the adoption of electric vehicles in Prince Edward Island. The Electric Vehicle Rebate Program offers between $2,500 and $5,000 for the purchase of a plug-in hybrid or a new or used electric vehicle. The objective is to reduce transportation-related GHG emissions by making zero-emission vehicles more financially accessible to residents. In the E3MC framework, the policy is not explicitly modelled, as its effects are implicitly captured in the zero-emission vehicle sales projections provided by Transport Canada. |
End-use fuel switching | PE-TRN-06 |
| Building Codes – Adoption of the National Energy Code for Buildings of Canada (2010 to 2012) | Québec | Buildings | Energy – Stationary Combustion and Fugitive Sources | These provincial-level policies mandate the adoption of energy efficiency standards for new commercial buildings, based on the 2010 to 2012 versions of the National Energy Code for Buildings of Canada. The objective is to improve the energy performance of new construction by requiring buildings to be approximately 28% more efficient than a defined reference level. In the E3MC framework, the policy is modelled by adjusting energy intensity assumptions for new buildings. These adjustments are based on the efficiency improvements mandated by the code and are calibrated using building simulation data and provincial implementation timelines. |
Efficiency | NA |
| Eco-performance program for commercial buildings | Québec | Buildings | Energy – Stationary Combustion and Fugitive Sources | This policy provides financial and technical support to companies, institutions, and municipalities in Québec to reduce GHG emissions from fossil fuel consumption and fugitive process emissions. It targets both small and large energy consumers and aims to improve energy efficiency in buildings and industrial processes. The program’s objectives include reducing GHG emissions, lowering fossil fuel use, enhancing energy efficiency, and minimising fugitive emissions from operations. In the E3MC framework, the policy is modelled by adjusting process energy efficiency for commercial and institutional buildings, as well as relevant industrial processes. Modelling relies on reduction estimates provided by the province to quantify the policy’s impact. |
Efficiency | QC-BDG 02 |
| GHG Challenge Program – Industry | Québec | Cross-Sectoral | Energy – Stationary Combustion and Fugitive Sources | The program focuses on the implementation of major industrial projects that can significantly reduce Québec’s GHG emissions in both the short and long term. In the E3MC framework, this policy is modelled as a targeted investment incentive that reduces the capital cost of specific industrial technologies or processes. The model incorporates these incentives by adjusting technology adoption parameters, leading to increased uptake of lower-emission industrial solutions and contributing to overall emissions reductions. Calibration is applied where necessary to ensure that projected emissions reductions align with the expected outcomes of the regulations. |
Efficiency; End-use fuel switching; Energy Source Decarbonisation | NA |
| Québec Bioenergy Program | Québec | Cross-Sectoral | Energy – Stationary Combustion and Fugitive Sources | This policy aims to reduce GHG emissions and fossil fuel consumption by funding energy conversion projects that switch from fossil fuels to residual forest biomass and other bioenergy sources. It targets industrial sectors such as cement, food, and tobacco, supporting the adoption of cleaner, renewable fuels through financial incentives and technical assistance. In the E3MC framework, the policy is modelled through fuel switching to biomass in the cement and food and tobacco sectors. Modelling incorporates sector-specific energy use data and fuel substitution rates to estimate the resulting GHG reductions. |
End-use fuel switching | QC-ENG-01 |
| Québec ÉcoPerformance Program | Québec | Cross-Sectoral | Energy – Stationary Combustion and Fugitive Sources | This policy provides financial incentives to support emissions reductions through fuel switching and energy efficiency improvements in Québec’s industrial, commercial, and institutional sectors. It targets both process and building-related energy use. The program also incorporates funding from the federal Low Carbon Economy Fund Leadership component to enhance its impact. In the E3MC framework, the policy is modelled by adjusting energy intensity and fuel mix assumptions for participating sectors. Modelling uses program uptake data, emission reduction estimates, and funding levels to quantify the impact on energy consumption and GHG emissions. |
Efficiency | QC-ENG-02 |
| Québec Green Hydrogen and Bioenergy Strategy | Québec | Cross-Sectoral | Transport | This policy promotes the integration of renewable natural gas into Québec’s energy system, with blending targets of 5% by 2025 and 10% by 2030. It supports the development of green hydrogen and bioenergy infrastructure to decarbonise the natural gas supply and reduce GHG emissions in the residential, commercial, and industrial sectors. In the E3MC framework, the policy is modelled by adjusting the share of renewable natural gas in the natural gas supply to estimate the impact on GHG emissions across end-use sectors. |
End-use fuel switching | QC-ENG-03 |
| Québec Industrial Electrification | Québec | Cross-Sectoral | Energy – Stationary Combustion and Fugitive Sources; Industrial Processes | This policy temporarily supports operating costs for energy conversion projects in industrial applications, with a focus on electrification. In the E3MC framework, this policy is modelled as an operating cost reduction for electrification technologies in the industrial sector. The model reflects the improved cost competitiveness of electric solutions, encouraging their adoption and contributing to emissions reductions by displacing fossil fuel use. |
End-use fuel switching | NA |
| Québec’s Cap-and-Trade System for GHG Emission Allowances | Québec | Cross-Sectoral | Energy – Stationary Combustion and Fugitive Sources; Industrial Processes | This economy-wide cap-and-trade program regulates GHG emissions across multiple sectors in Québec and is currently linked with California’s system under WCI. The system sets a declining cap on total emissions and allows trading of allowances and offset credits to meet compliance obligations. From 2017 to 2024, Canada included emissions reductions from the WCI in its WAM scenario and counted them toward its 2030 target in both domestic and international reports. Under Article 6 of the Paris Agreement, countries can trade emissions reductions as ITMOs if both parties authorise the exchange. However, the recent announcement that the US will withdraw from the Paris Agreement means it can no longer authorise ITMO trades, preventing Canada from counting WCI credit flows as ITMOs. Going forward, Canada will continue working with Québec to monitor and track WCI credit flows but will no longer formally count them toward its NDC target. Instead, Canada will highlight these net flows in public reports, including this one and the Second Biennial Transparency Report in 2026, to acknowledge their role in a credible and well-documented emissions trading system. In the E3MC framework, the policy is modelled by applying sector-specific emissions caps and carbon prices consistent with the cap-and-trade system. Modelling incorporates allowance prices, trading behaviour, and emissions data to estimate reductions across covered sectors. The model assumes that sectors respond by adopting cleaner technologies and enhancing operational efficiency when such investments are more cost-effective than incurring carbon compliance costs. |
Efficiency; End-use fuel switching; Energy Source Decarbonisation; Non-energy Process Emission Reductions | QC-CRC-02 |
| Regulation respecting the integration of low-carbon-intensity fuel content into gasoline and diesel fuel | Québec | Cross-Sectoral | Transport | This policy mandates minimum renewable fuel content in transportation fuels sold in Québec. By 2030, gasoline must contain at least 15% low-carbon-intensity fuel, and diesel must contain at least 10%. The regulation targets fuel suppliers and aims to reduce GHG emissions from the Transportation sector through increased use of biofuels and other low-carbon alternatives. In the E3MC framework, the policy is modelled by adjusting the renewable fuel share in gasoline and diesel consumption. Modelling uses blending targets and historical supply trends to estimate the impact on sectoral emissions. |
End-use fuel switching | QC-ENG-05 |
| Support measure for the decarbonisation of the Québec industrial sector | Québec | Cross-Sectoral | Energy – Stationary Combustion and Fugitive Sources | This measure aims to provide financial support to 54 companies subject to the Regulation respecting the cap-and-trade system for GHG emission allowances. The companies concerned will be able to obtain financing to implement projects to reduce GHG emissions. In the E3MC framework, this policy is modelled as a capital cost reduction for emissions-reducing technologies in the industrial sector. The model reflects the impact of financial support on accelerating the adoption of low-carbon solutions, contributing to emissions reductions among regulated facilities. Efficiency; End-use fuel switching NA Demand-side management program to reduce power peak demand Québec Electricity Energy – Stationary Combustion and Fugitive Sources This policy includes programs implemented in Québec to reduce electricity demand during peak periods. These initiatives target residential, commercial, and industrial consumers and aim to shift or lower electricity use during high-demand times through incentives, smart technologies, and behavioural interventions. In the E3MC framework, the policy is modelled by adjusting peak demand profiles and load shapes in the electricity sector. Modelling relies on historical demand data and program performance metrics to estimate the impact on peak load reduction and system efficiency. |
Behavioural Change | QC-ENG-06 |
| Energy Efficiency Program for Marine, Air and Railway Transportation | Québec | Transportation | Transport | This policy supports investments in new technologies aimed at reducing GHG emissions from the marine, air, and rail transportation sectors. The focus is on electrification and other innovative solutions to improve energy efficiency in the movement of people and goods. The initiative targets both passenger and freight transport and is implemented through funding programs and technology deployment support. In the E3MC framework, the policy is modelled by adjusting the market penetration of electric modes of transportation. |
Efficiency; End-use fuel switching | QC-TRN-03 |
| Program to reduce/avoid GHG emissions by using intermodal transportation | Québec | Transportation | Transport | This policy supports investments in the development and enhancement of intermodal infrastructure and centres in order to increase the use of less energy-intensive modes of transport, such as rail and marine, and to optimise freight and passenger travel. The initiative targets the Transportation sector and aims to reduce GHG emissions by shifting traffic away from more carbon-intensive modes like road transport. In the E3MC framework, the policy is modelled by adjusting mode shares in freight transport to reflect increased use of intermodal systems. Modelling relies on infrastructure investment data, modal efficiency assumptions, and historical transport trends to estimate emissions reductions. |
Behavioural Change | NA |
| Québec Assistance Program to Improve Public Transit Services | Québec | Transportation | Transport | This policy supports the electrification of public transit in Québec by setting a target for 50% of new bus sales to be electric by 2030. It applies to municipal and regional transit agencies and is implemented through financial assistance for the purchase of electric buses and related infrastructure. In the E3MC framework, the policy is modelled by adjusting the share of electric buses in the public transit fleet. Modelling uses vehicle stock turnover rates, and program targets to estimate the impact on energy use and GHG emissions in the Transportation sector. |
End-use fuel switching | QC-TRN-01 |
| Québec Transportation Electrification Initiatives | Québec | Transportation | Transport | This policy provides subsidies to support the adoption of EVs in Québec, aiming to accelerate the transition to low-emission transportation. The subsidy program is scheduled to be fully phased out by 2027. In the E3MC framework, the policy is not explicitly modelled as it is a supporting measure to reach the mandated market shares of ZEVs. |
End-use fuel switching | QC-TRN-05 |
| Québec Zero-Emission Vehicle Regulation | Québec | Transportation | Transport | This policy establishes a credit-based regulatory system to encourage the sale of ZEVs in Québec. Automakers are required to meet increasing ZEV credit thresholds over time, culminating in a mandate that 90% of new light-duty vehicles sold be ZEVs by 2035. The regulation applies to vehicle manufacturers and importers and is enforced through credit trading and compliance penalties. The policy is modelled in the E3MC framework by adjusting the market share of vehicle technologies to meet the mandated ZEV sales targets. The model is calibrated to reflect the increasing share of ZEVs over time, ensuring that the projected vehicle fleet composition aligns with the mandated sales trajectory and associated emissions reductions. In the E3MC framework, the policy is modelled by adjusting the market share of new ZEVs over time, aligned with the regulatory targets. Modelling incorporates vehicle turnover rates and technology adoption trends to estimate impacts on energy use and GHG emissions in the Transportation sector. |
End-use fuel switching | QC-TRN-06 |
| Renewable Fuel Content | Québec | Transportation | Transport | This policy sets minimum renewable content requirements for transportation fuels in Québec. By 2030, gasoline must contain at least 15% renewable fuel, and diesel must contain at least 10%. The policy targets the transportation fuel supply chain and is implemented through federal and provincial regulations. In the E3MC framework, the policy is modelled by adjusting the renewable fuel share in gasoline and diesel consumption. Modelling uses fuel blending targets and historical fuel supply data to estimate the impact on GHG emissions from the Transportation sector. |
End-use fuel switching | NA |
| Québec’s Organic Materials Reclamation Strategy | Québec | Waste & Others | Waste | The strategy sets an organic waste diversion target of 70%. In the E3MC framework, this policy is modelled by increasing the diversion rate of organic materials from landfills. |
Behavioural Change | QC-WST-04 |
| Regulation respecting landfill methane reclamation and destruction projects eligible for the issuance of offset credits | Québec | Waste & Others | Waste | This policy requires landfills with a capacity greater than 1.5 million cubic metres to install landfill gas collection systems. In the E3MC framework, the policy is not explicitly modelled, as its impacts are already captured in the historical emissions data used to calibrate the model. |
Negative Emissions | NA |
| Saskatchewan Energy Efficiency Standards for Buildings – Adoption of the National Energy Code for Buildings of Canada (2010 to 2012) | Saskatchewan | Buildings | Energy – Stationary Combustion and Fugitive Sources | These provincial-level policies mandate the adoption of energy efficiency standards for new commercial buildings, based on the 2010 to 2012 versions of the National Energy Code for Buildings of Canada. The objective is to improve the energy performance of new construction by requiring buildings to be approximately 20% more efficient than a defined reference level. In the E3MC framework, the policy is modelled by improving the efficiency of new buildings. These new efficiencies are incorporated into projections for new building stock, contributing to lower energy consumption and GHG emissions over time. |
Efficiency | SK-ENG-04 |
| Saskatchewan Energy Efficiency Standards for Buildings – National Building Code of Canada 2015 | Saskatchewan | Buildings | Energy – Stationary Combustion and Fugitive Sources | This policy sets energy efficiency requirements for new residential buildings, typically mandating that they are at least 20% more efficient than a defined reference level. While the National Building Code provides the framework, implementation occurs at the provincial level, where jurisdictions adopt and enforce the code through permitting and inspection processes. The policy applies to residential, commercial, and institutional buildings. In the E3MC framework, the policy is modelled by adjusting energy intensity assumptions for new buildings. These adjustments are based on the efficiency improvements mandated by the code and are calibrated using building simulation data and provincial implementation timelines. |
Efficiency | SK-ENG-04 |
| Saskatchewan Regulation Respecting the Management and Reduction of GHGs (Standards and Compliance) | Saskatchewan | Cross-Sectoral | Energy – Stationary Combustion and Fugitive Sources; Industrial Processes | The Saskatchewan Regulation Respecting the Management and Reduction of GHGs (Standards and Compliance) expands the province’s OBPS program. Effective January 1, 2022, industrial facilities in additional sectors became eligible for coverage under the provincial OBPS. The regulation aims to reduce GHG emissions by setting sector-specific performance standards and allowing facilities to trade compliance units. The credit price under the OBPS increases by $15/t CO₂ eq annually after 2022, reaching $170/t CO₂ eq by 2030. This price trajectory aligns with federal benchmarks and provides a consistent carbon price signal to encourage emissions reductions. In the E3MC framework, the policy is operationalised by applying sector-specific emissions intensity standards alongside a progressively increasing carbon price. This approach simulates the rising cost of GHG emissions over time. The model assumes that sectors respond by adopting cleaner technologies and enhancing operational efficiency when such investments are more cost-effective than incurring carbon compliance costs. |
Efficiency; End-use fuel switching; Energy Source Decarbonisation | SK-ENG-04 |
| Management and Reduction of Greenhouse Gases (General and Electricity Producer) Regulations | Saskatchewan | Electricity | Energy – Stationary Combustion and Fugitive Sources | The regulations allow for the equivalency agreement between the province and the federal government, enabling the federal coal-fired electricity regulation to stand down. The regulations place the following emissions cap on the electricity sector: 33.5 Mt in 2018 to 2019, 77.0 Mt in 2020 to 2024, 29.4 Mt in 2025 to 2026, and 35.1 Mt in 2027 to 2029. The equivalency agreement, which terminates December 31, 2026, also requires Saskatchewan to expand non-emitting generation capacity to 30% to 34% by the end of 2024, 25% to 40% by the end of 2027, and 40% to 50% by the end of 2030. Within the E3MC framework, the policy is not explicitly modelled for two reasons. First, its historical impacts are already reflected in the emissions data used to calibrate the model. Second, for projection years, the model does not directly incorporate electricity sector targets. Instead, it represents the practical measures implemented to achieve these targets, such as adding and/or removing power plants from the grid. |
Energy Source Decarbonisation | NA |
| SaskPower Electricity Initiatives | Saskatchewan | Electricity | Energy – Stationary Combustion and Fugitive Sources | The SaskPower Electricity Initiatives represent Saskatchewan’s commitment to reducing GHG emissions from the electricity sector. SaskPower has set a target to reduce electricity-related emissions by 50% below 2005 levels by 2030. This target is expected to be met through practical measures such as the development of new power generation facilities, integration of renewable energy sources, and construction of interties to enhance grid reliability and flexibility. This policy is not explicitly modelled in the E3MC framework, as ECCC does not model targets and objectives directly. Instead, the framework incorporates the practical measures (such as new power plants and interties) that are implemented to meet these targets, and their associated impacts are reflected in the modelling of the electricity sector. |
Energy Source Decarbonisation | SK-ENG-07 |
| Saskatchewan Oil and Gas Emissions Management Regulations | Saskatchewan | Oil & Gas | Industrial Processes | The Saskatchewan Oil and Gas Emissions Management Regulations are the province’s methane-specific regulations targeting the Oil and Gas sector. The policy aims to achieve a 40% to 45% reduction in methane emissions relative to 2012 levels. The policy is modelled in the E3MC framework by applying exogenous reductions in methane emissions from the Oil and Gas sector. These reductions are calibrated to align with the 40% to 45% reduction target relative to 2012 levels. |
Energy Source Decarbonisation | SK-ENG-13 |
| Renewable Fuel Content | Saskatchewan | Transportation | Transport | The Renewable Fuel Content policy ensures that Saskatchewan’s current mandate of 7.5% ethanol blending in gasoline and 2% biodiesel blending in diesel is maintained throughout the projection period. In the E3MC framework, the policy is implemented by modifying the blend ratios of ethanol in gasoline and biodiesel in diesel to align with the mandated renewable fuel content over the policy’s implementation timeline. The model incorporates assumptions regarding the relative carbon intensities of biofuels and conventional fuels to quantify the associated GHG emissions reductions. |
End-use fuel switching | NA |
| Solid Waste Management Strategy | Saskatchewan | Waste & Others | Waste | This policy outlines Saskatchewan’s strategy to reduce the amount of solid waste deposited in landfills. The policy targets the reduction of total waste generated and incorporates a waste diversion target of 30%. In the E3MC framework, the policy is modelled by adjusting waste diversion rates over time. Modelling uses waste management data, diversion targets, and historical trends to estimate the impact on GHG emissions from the waste sector. |
Behavioural Change | NA |
| Building Codes – Adoption of the National Energy Code for Buildings of Canada (2010 to 2012) | Yukon | Buildings | Energy – Stationary Combustion and Fugitive Sources | These provincial-level policies mandate the adoption of energy efficiency standards for new commercial buildings, based on the 2010 to 2012 versions of the National Energy Code for Buildings of Canada. The objective is to improve the energy performance of new construction by requiring buildings to be approximately 20% more efficient than a defined reference level. In the E3MC framework, the policy is modelled by adjusting energy intensity assumptions for new buildings. These adjustments are based on the efficiency improvements mandated by the code and are calibrated using building simulation data and provincial implementation timelines. |
Efficiency | NA |
| Our Clean Future: A Yukon strategy for climate change, energy and a green economy | Yukon | Waste & Others | Waste | The strategy includes a circular economy approach with a 40% waste diversion target. In the E3MC framework, the policy is modelled by adjusting waste diversion rates over time. Modelling uses waste management data, diversion targets, and historical trends to estimate the impact on GHG emissions from the waste sector. |
Efficiency | YT-CRC-01 |
*Note: LULUCF is not considered an 'economic' sector, but is included with the list of sectors within Canada's Economic Sectors for completeness.
Marine Spark-Ignition Engine, Vessel and Off-road Recreational Vehicle Emission Regulations (SOR/2011-10)
| Policy Name | Jurisdiction | Economic Sector | Modelling Assumptions / Description |
|---|---|---|---|
| Regulations Amending the Products Containing Mercury Regulations | Canada | Buildings | The Regulations prohibit the manufacture and import of products containing mercury or any of its compounds. The Amendments lower the mercury content limit currently allowed for straight fluorescent lamps for general lighting purposes, cold cathode fluorescent lamps, and external electrode fluorescent lamps. In the E3MC framework, this policy is modelled by adjusting the availability and characteristics of affected lighting technologies. The model reflects the phase out of higher-mercury lighting products and shifts consumer and commercial choices toward compliant, lower-emission alternatives, influencing energy demand and emissions in the Buildings sector. |
| Canadian Council of Ministers of the Environment Acid Rain Strategy | Canada | Cross-Sectoral | This strategy is a national policy framework aimed at preventing the recurrence of acid rain damage in Canada. Its primary objective is to maintain critical environmental loads by capping sulphur dioxide and nitrogen oxides emissions, particularly in sensitive ecosystems such as those in eastern Canada. The strategy focuses on industrial sectors and encourages regional coordination and long-term emissions monitoring. Implementation began in the 1990s, with ongoing updates and commitments supported through regulatory caps, emissions trading systems, and collaborative federal-provincial actions. In the E3MC framework, the strategy is modelled by applying provincial emission caps to key industrial sectors. Emissions trajectories are adjusted to reflect compliance with these caps, using historical emissions data and province-specific targets as inputs. Calibration is conducted to ensure that projected emissions align with the cap levels established under the strategy, incorporating regional variations in emissions intensity and sectoral contributions. |
| Multi-Sector Air Pollutants Regulations | Canada | Cross-Sectoral | These Regulations establish nationally consistent emission standards for nitrogen oxides and sulphur dioxide from key types of industrial equipment across multiple sectors. Introduced under the Canadian Environmental Protection Act, 1999, the regulations apply to boilers, heaters, stationary spark-ignition engines, and cement kilns used in sectors such as aluminium, cement, chemicals, electricity, oil sands, pulp and paper, and petroleum refining. Phased in beginning in 2016, MSAPR implementation timelines vary by equipment type and sector, with emission reductions achieved through performance-based limits, operational standards, and mandatory reporting requirements. In the E3MC framework, MSAPR is modelled by adjusting emission factors for affected sectors to reflect the adoption of performance-based standards for nitrogen oxides. These adjustments apply to emissions from regulated equipment types, such as boilers, heaters, stationary engines, and cement kilns, across the targeted industrial sectors. Emission reductions are calibrated using sector-specific data, compliance schedules, and regulatory expectations to ensure projections reflect the phased implementation and operational impact of the regulations. |
| Reduction in the Release of Volatile Organic Compounds (Storage and Loading of Volatile Petroleum Liquids) Regulations: SOR/2025-88 | Canada | Cross-Sectoral | These Regulations require facilities with petroleum liquid storage tanks and loading racks to install, inspect, maintain, and repair emissions control equipment to ensure proper performance. The Regulations also include record-keeping and reporting requirements. Affected facilities include petroleum terminals and bulk plants, refineries, upgraders, iron and steel plants, and petrochemical facilities across Canada. In the E3MC framework, these regulations are modelled by applying projected volatile organic compound emissions reductions in the impacted sectors based on the regulatory requirements. Calibration ensures that modelled outcomes align with the regulation’s expected reductions and compliance timelines. |
| Volatile Organic Compound Concentration Limits for Certain Products Regulations | Canada | Cross-Sectoral | These Regulations aim to reduce emissions of volatile organic compounds from consumer and commercial products in Canada by setting maximum concentration limits for over 130 product categories, including personal care, automotive, and cleaning products. They apply to manufacturers, importers, and sellers, with most provisions coming into force in 2024, and a full compliance starting in 2025. Compliance is achieved through direct regulatory limits, as well as labelling, record-keeping, and reporting requirements. In the E3MC framework, these regulations are represented by adjusting emission factors for volatile organic compounds in the relevant economic sectors where the regulated products are often used. Calibration is applied as needed to align projected emissions with the anticipated reductions from the regulation’s implementation, considering regional population shares and the non-combustion volatile organic compound emissions shares of the targeted sectors. |
| Volatile Organic Compounds Concentration Limits for Architectural Coatings Regulations | Canada | Cross-Sectoral | These Regulations aim to reduce air pollution by limiting the amount of volatile organic compounds in paints, stains, varnishes, and other coatings used in residential, commercial, institutional, and industrial settings. They apply to manufacturers, importers, and sellers of architectural coatings, setting maximum volatile organic compound concentration limits for 53 product categories. Introduced in 2009, the regulations were phased in between 2010 and 2016, depending on the category. In the E3MC framework, the policy is modelled implicitly through historical emissions trends. No additional tuning or variable adjustments are applied, as the impacts of the regulation are embedded in the historical data used to calibrate the model. |
| Base-Level Industrial Emissions Requirements | Canada | Heavy Industry | BLIERs is a set of nationally consistent performance standards developed to reduce air pollutant emissions from key industrial sectors across Canada. Developed under the Air Quality Management System, BLIERs target pollutants such as nitrogen oxides, sulphur dioxide, and particulate matter, and apply to sectors including cement, pulp and paper, iron and steel, and oil sands. Implementation began in the mid-2010s through a combination of regulatory and non-regulatory instruments, including codes of practice, environmental performance agreements, pollution prevention plans, and MSAPR, which formalise BLIERs for certain sectors. In the E3MC framework, BLIERs are currently modelled only for the “Other non-ferrous” sector. Emissions impacts in other industrial sectors are primarily captured through the modelling of the MSAPR. Emission reductions are represented by applying sector-specific emissions ceilings that reflect the expected impacts of BLIER implementation on pollutant levels. These ceilings are derived from regulatory guidance, sector-level analysis, and stakeholder input, and are used to calibrate emissions trajectories in sectors not fully regulated under other instruments. |
| Reduction in the Release of Volatile Organic Compounds Regulations (Petroleum Sector) | Canada | Oil & Gas | These Regulations, enacted in 2020 under the Canadian Environmental Protection Act, 1999, target volatile organic compound emissions from petroleum refineries, upgraders, and specific petrochemical facilities. They require the implementation of leak detection and repair programs, equipment standards, and perimeter monitoring to control fugitive emissions. Implementation is phased, with key provisions coming into force in 2022 and 2023. In the E3MC framework, the policy is modelled by applying projected volatile organic compound emissions reductions in the petroleum sector based on the regulatory requirements. Calibration ensures that modelled outcomes align with the regulation’s expected reductions and compliance timelines. |
| Canada and USA Emission Control Area for Ships | Canada | Transportation | This policy sets stringent standards for nitrogen oxides, sulphur oxides, and particulate matter emissions from marine vessels, operating in designated Emission Control Areas. It requires the use of low-sulphur fuels and emission control technologies to reduce air pollution. In the E3MC framework, the policy is not explicitly modelled, as its impacts are already reflected in historical data. Emission reductions are captured through past trends in marine fuel sulphur content and associated emissions. |
| Locomotive Emissions Regulations | Canada | Transportation | These Regulations, introduced in 2017, aim to reduce emissions of criteria air contaminants from locomotives operating in Canada. They apply to railway companies and other regulated entities that own or operate locomotives, setting emission standards aligned with US Environmental Protection Agency Tier standard. Compliance is ensured through certification, testing, and reporting requirements. In the E3MC framework, these regulations are modelled by adjusting emission factors in the rail transport sector to reflect the phased adoption of cleaner locomotive technologies. Emission reductions are calibrated using regulatory impact assessments and stakeholder input to ensure alignment with expected outcomes and compliance timelines. |
| Marine Spark-Ignition Engine, Vessel and Off-road Recreational Vehicle Emission Regulations (SOR/2011-10) | Canada | Transportation | These Regulations aim to reduce air pollutants and toxic substances from gasoline-fuelled marine engines, fuel systems used in recreational marine vessels, and off-road recreational vehicles such as ATVs and snowmobiles. They apply to manufacturers and importers, aligning Canadian standards with US Environmental Protection Agency emission standards for 2012 and later model years. Enacted under the Canadian Environmental Protection Act, 1999, the regulations include performance-based emission limits and certification and labelling requirements to ensure compliance. |
| Off-Road Compression-Ignition (Mobile and Stationary) and Large Spark-Ignition Engine Emission Regulations | Canada | Transportation | These Regulations, enacted in 2020 under the Canadian Environmental Protection Act, 1999, aim to reduce air pollutant emissions from new off-road diesel (compression ignition) and large spark-ignition engines used in mobile and stationary applications. They apply to manufacturers and importers of engines used in construction, industrial, agricultural, and other off-road equipment. The regulations align Canadian standards with US Environmental Protection Agency requirements to ensure regulatory consistency and reduce barriers to trade. The regulations include performance-based emission limits, certification requirements, and compliance testing. In the E3MC framework, the regulations are modelled by adjusting emission factors for relevant off-road equipment and large spark-ignition engine categories to reflect the gradual adoption of compliant engine technologies. These adjustments are based on regulatory timelines, expected fleet turnover rates, and market adoption trends. |
| Off-Road Small Spark-Ignition Engine Emission Regulations | Canada | Transportation | These Regulations aim to reduce air pollutant emissions from small spark-ignition engines used in off-road equipment such as lawn and garden tools, light-duty industrial machines, and recreational vehicles. They apply to manufacturers and importers, aligning Canadian standards with US Environmental Protection Agency Phase 2 emission standards for 2005 and later model years. Enacted under the Canadian Environmental Protection Act, 1999, the regulations include performance-based emission limits, certification, and labelling requirements to ensure compliance. In the E3MC framework, the regulations are modelled by adjusting emission factors for relevant off-road small spark-ignition engine categories to reflect the gradual adoption of compliant engine technologies. These adjustments are guided by regulatory timelines, expected fleet turnover rates, and market adoption trends. |
| On-Road Vehicle and Engine Emission Regulations | Canada | Transportation | The regulations set air pollutants emission standards for new on-road vehicles by aligning Canadian standards with those of the US Environmental Protection Agency. They apply to manufacturers and importers of light-duty vehicles, heavy-duty vehicles and engines. Introduced under the Canadian Environmental Protection Act, 1999, the regulations came into force in 2004 and have since been updated to reflect increasingly stringent emission standards. Compliance is achieved through certification, testing, and reporting requirements to ensure that vehicles meet prescribed emission limits before entering the Canadian market. In the E3MC framework, vehicle emissions regulations are modelled based on the Motor Vehicle Emission Simulator (MOVES). Emission coefficients from MOVES are applied to the on-road vehicle fleet, segmented by vehicle class, fuel type, and model year. The MOVES model captures the phased implementation of Tier 2 and Tier 3 emission standards, reflecting their increasingly stringent limits on nitrogen oxides, particulate matter, volatile organic compounds, and carbon monoxide. Assumptions about fleet turnover, technology adoption, and vehicle activity are integrated to simulate the gradual penetration of cleaner vehicles. Emissions projections are calibrated using regulatory benchmarks and MOVES outputs to ensure consistency with observed trends and expected policy outcomes. |
| Sulphur in Gasoline Regulations | Canada | Transportation | These regulations aim to reduce air pollutant emissions from vehicles by limiting the sulphur content in gasoline produced or imported in Canada. Introduced in 2002 under the Canadian Environmental Protection Act, 1999, the regulations have been progressively tightened, with a current average sulphur limit of 10 mg/kg (10 ppm). Compliance is enforced through fuel sampling, reporting, and a regulatory framework that previously included a temporary sulphur compliance unit trading system. These regulations are not explicitly modelled in the E3MC framework, as their impacts are already embedded in historical emissions data. Improvements in vehicle emissions performance due to lower sulphur content are reflected in the baseline assumptions for the Transportation sector. |
| Alberta Review and Assessment of Provincial Clean Air Policies | Alberta | Electricity | The policy captures improvements in air pollutant emissions from Alberta’s utility electric generation sector, excluding the Clean Air Strategic Alliance policy. In the E3MC framework, the policy is represented implicitly through historical emissions trends. No direct modelling or tuning is applied, as the effects of the policy are embedded in the historical data used to calibrate the model. |
| Newfoundland and Labrador Air Control Regulations | Newfoundland and Labrador | Heavy Industry | These regulations aim to limit air pollutant emissions from industrial and commercial sources by setting limits for contaminants such as particulate matter, sulphur dioxide, and nitrogen oxides. They apply primarily to industrial operations, including power generation, manufacturing, and combustion processes. Introduced in 2004, the regulations are enforced through permitting, emissions monitoring, and compliance inspections, with updates implemented as needed. These regulations are modelled in the E3MC framework with a focus on the Iron Ore Mining sector, targeting emissions reductions from industrial activities within the province. Emissions constraints specific to iron ore mining operations are applied, and emissions trajectories are adjusted to reflect compliance with these limits. Historical emissions data and provincial targets serve as key inputs, while calibration ensures that projected emissions align with regulatory expectations and observed trends. |
| Nova Scotia Air Quality Regulations for Utility Electric Generation | Nova Scotia | Electricity | These regulations establish emission limits for sulphur dioxide, nitrogen oxides, and mercury from fossil fuel-fired electricity generation facilities. Emission reductions are achieved through regulatory caps, facility-specific emission limits, and mandatory reporting and monitoring requirements, with key milestones aligned with Nova Scotia’s broader climate and air quality goals. In the E3MC framework, these regulations are modelled by applying emissions caps to the province’s electricity generation sector. Emissions trajectories are adjusted to reflect compliance with these caps, using historical emissions data and regulatory targets as key inputs. Calibration is performed to ensure that projected emissions align with the cap levels established under the regulations, accounting for facility-specific performance and provincial energy trends. |
| Discharge of Sulphur Dioxide from Nickel Smelting and Refining Facilities in the Sudbury Area | Ontario | Heavy Industry | This regulation establishes emission limits for facilities operated by Glencore and Vale. The policy’s objective is to significantly reduce sulphur dioxide emissions to meet Ontario’s updated air quality standards, which became more stringent in 2023. The policy targets nickel smelting and refining operations, with compliance deadlines of January 1, 2022, for Glencore and July 1, 2023, for Vale. Compliance is enforced through continuous emissions monitoring, mandatory public reporting, and health risk assessments. In the E3MC framework, the policy is modelled by applying a sector- and region-specific cap on sulphur dioxide emissions for nickel facilities in the Sudbury area. This cap reflects the estimated regulatory impact on sulphur dioxide emissions within the sector. Emissions trajectories are then adjusted to ensure compliance with the cap, using historical emissions data and expected facility-level impacts as key inputs. Calibration is applied to ensure that projected emissions align with the reduction targets established under the policy. |
| Requirements for the Carbon Black Industry in Environmental Compliance Approvals | Ontario | Heavy Industry | This policy aims to significantly reduce sulphur dioxide emissions from two carbon black manufacturing facilities in Ontario: Cabot Canada in Sarnia and Birla Carbon in Hamilton. It requires the installation of air pollution control systems that can either achieve a 95% reduction in the sulphur dioxide emissions or maintain certain in-stack concentration levels. The policy applies specifically to industrial carbon black operations and outlines two compliance pathways, each with a different schedule and emission limits, with full implementation required by 2030. Compliance is enforced through mandated pollution control technologies, continuous emissions monitoring, public reporting, and enforceable corrective actions. In the E3MC framework, the policy is modelled by first estimating facility-level sulphur dioxide emissions reductions resulting from the regulation, based on control technology performance and compliance timelines outlined in the regulatory proposal. These reductions are then extrapolated to estimate the overall impact on sector-wide sulphur dioxide emissions from Ontario’s Chemical and Fertilizer sector in E3MC. Emissions trajectories are adjusted accordingly, using historical emissions data and regulatory benchmarks to reflect compliance. Calibration ensures that the modelled projections align with the reduction targets established under the policy. |
| Reducing sulphur dioxide emissions from Ontario’s petroleum facilities (O. Reg. 530/18, O. Reg. 88/22, and O. Reg. 89/22) | Ontario | Oil & Gas | These regulations require five petroleum facilities in the Sarnia, Nanticoke, Mississauga area to reduce sulphur dioxide emissions through facility-specific annual limits and detailed emissions control plans. The policy applies to petroleum refining and related industrial operations. Emission reductions are achieved through enforceable regulatory limits, continuous emissions monitoring, and mandatory planning and reporting requirements. In the E3MC framework, these regulations are represented by imposing a sector-specific emissions cap on petroleum refining operations in Ontario. This cap reflects the estimated regulatory impact on sulphur dioxide emissions within the sector. Emissions trajectories are then adjusted to ensure compliance with the cap, using historical emissions data and expected facility-level impacts as key inputs. A calibration process is applied to align projected emissions with the capped levels, considering operational characteristics and regional emission trends. |
| Québec Clean Air Regulation | Québec | Cross-Sectoral | This Regulation is a comprehensive provincial policy aimed at reducing air pollutant emissions from industrial, commercial, and institutional sources. It sets emission limits for a wide range of contaminants, including particulate matter, sulphur dioxide, nitrogen oxides, volatile organic compounds, and black carbon, across multiple sectors. It applies to activities such as fuel combustion, manufacturing, waste incineration, and solvent use. Implementation is phased in through permitting, emissions monitoring, and technology standards. Compliance is enforced through regulatory limits, mandatory reporting, and inspections, with periodic updates to reflect evolving environmental standards and technologies. In the E3MC framework, the Québec Clean Air Regulation is modelled by applying sector-specific adjustments to emissions factors based on the regulation’s standards. Emissions trajectories are modified to reflect compliance with these adjusted factors, using historical emissions data and regulatory benchmarks as inputs. Calibration is conducted to ensure that projected emissions align with the levels established under the regulation, accounting for sectoral activity, technological performance, and regional emission patterns. |
| Policy Name | Jurisdiction | Economic Sector* | IPCC Sector Modelling Assumptions / Description | GHG Abatement Channel | PaMs Identifier | |
|---|---|---|---|---|---|---|
| Canada Green Building Strategy | Canada | Buildings | Energy - Stationary Combustion and Fugitive Sources | The policy is implemented in the model by modifying consumer choices. Under the policy, which includes a ban on oil heating in new construction starting in 2028, any consumer who would have chosen to install a fossil fuel heater (Oil) instead chooses to install an electric heat pump. In the E3MC framework, this policy is modelled by adjusting the technology choice algorithm for residential heating systems. The model redirects consumer selections away from oil-based systems toward electric heat pumps in new buildings from 2028 onward, reflecting the regulatory constraint and its impact on energy demand and emissions. |
Behavioural Change; End-use fuel switching | BDG 09 |
| Net-zero energy ready building codes (for new commercial and residential buildings) by 2030 | Canada | Buildings | Energy - Stationary Combustion and Fugitive Sources | The net-zero energy ready building codes aim to ensure that all new commercial and residential buildings constructed by 2030 are built to a standard that significantly reduces energy consumption and GHG emissions. While provinces, territories, and municipalities have the authority to adopt and enforce energy codes, the federal government supports this transition by providing tools and guidance through the National Building Code. This policy simulates a pathway toward net-zero-ready construction by increasing process efficiency standards and assumes progressive adoption and compliance improvements across jurisdictions. The policy is modelled in the E3MC framework by applying exogenous improvements in energy intensity for new buildings, based on projected adoption rates and compliance with net-zero-ready standards. Between 2030 and 2050, it is assumed that energy intensities will improve by 22% to 90% in the residential sector and by 30% to 80% in the commercial sector, depending on the province or territory. |
Efficiency | BDG 01 |
| Agricultural Climate Solutions – Living Labs | Canada | Cross-Sectoral | LULUCF | This policy supports the establishment of a national network of Living Labs through the Agricultural Climate Solutions – Living Labs Program, with $185 million in funding from 2021 to 2031. Each Living Lab brings together farmers, scientists, and sector partners to co-develop and test innovative technologies and practices directly on farms. The objective is to reduce GHG emissions and enhance carbon sequestration under real-world agricultural conditions, fostering collaborative innovation and knowledge sharing across regions. The impact of the policy is estimated by AAFC and is included in the E3MC framework as an exogenous input. |
Negative Emissions; Efficiency | AGR 01.1 |
| Agricultural Climate Solutions – On-Farm Climate Action Fund | Canada | Cross-Sectoral | Agriculture | This policy supports the adoption of proven BMPs on farms through the Agricultural Climate Solutions – On-Farm Climate Action Fund, which provides $704.1 million in funding from 2021 to 2028. The objective is to reduce GHG emissions and enhance carbon sequestration in the agricultural sector. In addition to direct support for BMP implementation, the program funds enabling activities such as training for agricultural professionals, knowledge transfer and translation, and peer-to-peer education to facilitate widespread adoption. The impact of the policy is estimated by AAFC and is included in the E3MC framework as an exogenous input. |
Non-energy Process Emission Reductions; Negative Emissions | AGR 01.2 |
| Canada Growth Fund | Canada | Cross-Sectoral | Energy - Stationary Combustion and Fugitive Sources | This policy supports the development of Canada’s clean economy through the Canada Growth Fund, which is designed to attract private capital by using investment instruments that absorb certain risks. The objective is to encourage private investment in low-carbon projects, technologies, and businesses by improving the financial viability of such ventures. In the E3MC framework, the policy is modelled by assuming increasing electrification and energy efficiency across numerous industrial sectors over time. These assumptions are reflected through adjustments to energy use patterns and emissions intensities. |
Efficiency; End-use fuel switching | ECW 16 |
| Output-Based Pricing System Proceeds Fund / Decarbonization Incentive Program / Future Electricity Fund | Canada | Cross-Sectoral | Energy - Stationary Combustion and Fugitive Sources | This policy models emissions reductions resulting from the reinvestment of proceeds from OBPS through programs such as the OBPS Proceeds Fund, the Decarbonization Incentive Program, and the Future Electricity Fund. These programs aim to return industrial fuel charge revenues in ways that support emissions reductions and energy transition, particularly through investments that enhance energy efficiency and support clean technology adoption across industrial sectors. In the E3MC framework, the policy is modelled by assuming steadily increasing energy efficiency in numerous industrial sectors over time. The model adjusts energy demand and emissions intensity parameters to reflect the expected impact of funded initiatives, simulating the cumulative effect of reinvested proceeds on reducing GHG emissions. |
Efficiency; End-use fuel switching | ECW 01.2, ECW 01.6, ECW 01.6a, ECW 01.6b |
| Sustainable Canadian Agricultural Partnership | Canada | Cross-Sectoral | Agriculture; LULUCF | This policy establishes the Sustainable Canadian Agricultural Partnership, a five-year initiative (2023 to 2028) between federal, provincial, and territorial governments to enhance the competitiveness, innovation, and resilience of Canada’s agriculture and agri-food sector. One of its five core priorities is addressing climate change and environmental protection. Under this priority, Sustainable Canadian Agricultural Partnership supports the adoption of BMPs, accelerates technological uptake, and promotes actions that reduce GHG emissions, improve carbon sequestration, protect soil, water, and air quality, and enhance biodiversity and habitat conservation. The partnership also includes the $250 million Resilient Agricultural Landscapes Program, which supports the delivery of ecological goods and services by the agriculture sector. The impact of the policy is estimated by AAFC and is included in the E3MC framework as an exogenous input. |
Negative Emissions; Efficiency | AGR 03b |
| Nature Smart Climate Solutions Fund | Canada | LULUCF | LULUCF | This policy aims to reduce Canada’s net GHG emissions through the use of natural climate solutions, while also delivering co-benefits for biodiversity and human well-being. NSCSF supports activities such as avoided conversion, improved management, and restoration of ecosystems including wetlands, grasslands, and forest lands. These actions are designed to enhance carbon sequestration and prevent emissions from land-use change and degradation. The impact of the policy is estimated by ECCC`s Canadian Wildlife Service and is included in the E3MC framework as an exogenous input. |
Negative Emissions | NBS-0.1, NBS-01.1a |
| Enhanced Oil and Gas Methane Regulations | Canada | Oil & Gas | Industrial Processes | The Enhanced Oil and Gas Methane Regulations target a 75% reduction in methane emissions from the Oil and Gas sector by 2030, relative to 2012 levels. This enhanced regulation builds on previous methane policies and aims to significantly curb emissions through stricter requirements and improved mitigation technologies. The policy is designed with a focus on fugitive emissions, it includes measures such as mandatory leak detection and repair, reduction in venting and methane destruction in some cases. In the E3MC framework, the policy is modelled using ECCC bottom-up methane emissions model. The model estimates reductions as a percentage of technically achievable methane abatement, disaggregated by province and subsector. These estimates are used to tune E3MC model variables to reflect the 75% reduction target stated in the regulations. Although the policy is currently expected to begin in 2027, an internal modelling decision was made to shift the implementation year to 2028. This adjustment reflects delays in the regulatory process and the proximity of 2026. Once the final regulations are in place, future modelling will be updated to reflect the confirmed implementation date. |
Energy Source Decarbonisation | OIG-02 |
| Extension of passenger vehicle efficiency improvements | Canada | Transportation | Transport | Under this policy, internal combustion engine vehicles improve efficiency by 1.5% annually from 2026 to 2032, aligned with US passenger vehicle efficiency standards. In the E3MC framework, this policy is modelled by applying annual improvements to the fuel economy of new ICE passenger vehicles. These adjustments reduce fuel consumption and associated emissions over time, influencing energy demand and emissions trajectories in the Transportation sector. |
Efficiency | TRN-01 |
| Measures to reduce emissions from air, marine and rail through efficiency gains and low-carbon fuel blending | Canada | Transportation | Transport | This policy includes the electrification of new passenger ferries, beginning in 2025. The policy targets a 10% market share for new electric ferries by 2030. The policy is modelled in the E3MC framework by adjusting the technology share of new marine vessels to reflect the increasing adoption of electric ferries. The framework incorporates assumptions about market penetration, vessel turnover rates, and operational efficiency improvements. These assumptions are informed by policy targets and sector-specific data. Calibration ensures that the model captures the emissions reductions and energy system impacts associated with the shift toward electrified marine transport. |
End-use fuel switching | TRN-09.1 |
| National Active Transportation Strategy | Canada | Transportation | Transport | This policy supports the National Active Transportation Strategy through investments in infrastructure such as bike lanes and pedestrian pathways. The objective is to encourage a shift from car and truck usage to active transportation modes, thereby reducing energy consumption and emissions in the passenger Transportation sector. The policy targets a 0.33% reduction in energy demand in passenger transportation by 2030. In the E3MC framework, the policy is modelled by calibrating energy demand in the passenger transportation sector to reflect a 0.33% reduction by 2030. This is achieved by adjusting travel activity shares to account for increased uptake of active transportation modes. This is based on the assumption that infrastructure investments lead to measurable behavioural shifts away from motorised transport, and these shifts are reflected in the energy demand projections. |
Behavioural Change | TRN-11.3 |
| Landfill Methane Regulations | Canada | Waste & Others | Waste | This policy requires municipal solid waste facilities to increase landfill gas capture in a stepwise manner starting in 2027. The objective is to reduce methane emissions from landfills by improving gas collection systems across provinces and territories. With full implementation, collection efficiencies are expected to range between 39% and 79%, depending on regional conditions and capacity. In the E3MC framework, the policy is modelled by adjusting methane emissions from municipal solid waste landfills to reflect the regulatory targets. The model incorporates a phased increase in collection efficiency beginning in 2027, with regional variation in the final efficiency levels. These adjustments reduce methane emissions from the waste sector in line with the expected outcomes of the regulations. Although the policy is currently expected to begin in 2027, an internal modelling decision was made to shift the implementation year to 2028. This adjustment reflects delays in the regulatory process and the proximity of 2026. Once the final regulations are in place, future modelling will be updated to reflect the confirmed implementation date. |
Negative Emissions | WST-06 |
| Alberta Carbon Capture, Storage and Utilization | Alberta | Cross-Sectoral | Energy - Stationary Combustion and Fugitive Sources | This policy provides a grant of 12% for new eligible CCUS capital costs to support hard-to-abate industries. In the E3MC framework, this policy is modelled as a capital cost reduction applied to qualifying CCUS technologies. The grant lowers the upfront investment required, improving the cost competitiveness of CCUS and encouraging its deployment in industrial applications within the model. Calibration is applied where necessary to ensure that projected emissions reductions align with the expected outcomes of the regulations. |
Negative Emissions | AB-CRC-01 |
| Energy Efficiency Standards Regulation – Highest Efficiency Equipment Standards for Space and Water Heating | British Columbia | Buildings | Energy - Stationary Combustion and Fugitive Sources | The policy will prohibit the sale of new and replacement conventional gas- and oil-fired equipment in 2030. This includes residential forced air systems (furnaces), residential hydronic heating systems (boilers), domestic water heaters (both storage and instantaneous types), and weatherised gas-fired packaged units (such as rooftop and makeup air units). In the E3MC framework, the policy is modelled by phasing out the availability of conventional gas- and oil-fired space and water heating equipment starting in 2030. Equipment choice sets are adjusted to reflect the regulatory ban, and assumptions regarding technology adoption and efficiency improvements are incorporated. |
Efficiency; End-use fuel switching | BC-ENG-07 |
| British Columbia Medium- and Heavy-Duty Zero-Emission Vehicle Mandate | British Columbia | Transportation | Transport | This policy establishes a mandate in British Columbia requiring that 30% of new on-road medium- and heavy-duty vehicle sales—excluding class 7–8 tractor trailers—be zero emission by 2030, increasing to 100% by 2040. The objective is to accelerate the decarbonisation of the freight and commercial vehicle sectors by promoting the adoption of zero-emission technologies such as battery electric and hydrogen fuel cell vehicles. In the E3MC framework, the policy is modelled by adjusting the sales shares of zero-emission vehicles within the medium- and heavy-duty vehicle categories in British Columbia to meet the 2030 and 2040 targets. These changes are reflected in the vehicle stock turnover and fuel use patterns, resulting in reduced emissions from the Transportation sector over time. |
End-use fuel switching | BC-TRN-05 |
| Merit-based Low Carbon Economy Fund | Manitoba | Cross-Sectoral | Energy - Stationary Combustion and Fugitive Sources | The program is intended to support building and process improvements that reduce GHG emissions and the use of fossil fuels. It does not fund projects that qualify for or are already supported by Efficiency Manitoba, nor does it support transportation-related initiatives such as ZEVs or charging infrastructure. In the E3MC framework, this policy is modelled as a capital cost reduction applied to eligible building and industrial technologies. The incentive enhances the cost effectiveness of low-carbon investments, encouraging their adoption and contributing to emissions reductions in the targeted sectors. Calibration is applied where necessary to ensure that projected emissions reductions align with the expected outcomes of the regulations. |
Efficiency; End-use fuel switching | NA |
| Renewable Fuel Regulations | Yukon | Transportation | Transport | This policy mandates the blending of renewable fuels into conventional transportation fuels, requiring a 10% ethanol blend in gasoline and a 20% biodiesel blend in diesel by 2025. In the E3MC framework, the policy is implemented by modifying the blend ratios of ethanol in gasoline and biodiesel in diesel to align with the mandated renewable fuel content over the policy’s implementation timeline. The model incorporates assumptions regarding the relative carbon intensities of biofuels and conventional fuels to quantify the associated GHG emissions reductions. |
End-use fuel switching | YT-TRN-01 |
*Note: LULUCF is not considered an 'economic' sector, but is included with the list of sectors within Canada's Economic Sectors for completeness.
| Province / Territory | Target in 2020 | Target in 2030 | Target in 2050 |
|---|---|---|---|
| Newfoundland and Labrador | 10% below 1990 | 30% below 2005 | Net-zero by 2050 |
| Prince Edward Island | 10% below 1990 | 40% below 2005 (1.2 Mt CO2 eq or less total emissions) | Net-zero by 2040 |
| Nova Scotia | 10% below 1990 | 53% below 2005 | Net-zero by 2050 |
| New Brunswick | 10% below 1990 | 46% below 2005 (total emissions output of 10.7 Mt CO2 eq) | Net-zero by 2050 |
| Québec | 20% below 1990 | 37.5% below 1990 | Carbon neutrality by 2050 |
| Ontario | 15% below 1990 | 30% below 2005 (142 Mt CO2 eq total emissions) | N/A |
| Manitoba | 15% below 2005 | 5.6 Mt CO2 eq cumulative reduction (2023-2027) | N/A |
| Saskatchewan | N/A | N/A | N/A |
| Alberta | 50 Mt below business-as-usual scenario | NA | Carbon neutrality by 2050 |
| British Columbia | 33% below 2007 | 40% below 2007 (60% below 2007 by 2040) | Net-zero by 2050 |
| Nunavut | N/A | N/A | N/A |
| Yukon | N/A | 45% below 2010 | Net-zero by 2050 |
| Northwest Territories | N/A | 30% below 2005 | N/A |