
Air quality
Air pollutants cause adverse health and environmental effects. Key air quality problems such as smog and acid rain result from the release of pollutants into the atmosphere. Many of these pollutants come from human activities, such as the burning of fuels for transportation, electricity, heating and industry. Pollutants from wildfires can also contribute substantially to poor air quality. The air quality indicators track the change, over 15 years, in concentrations in Canada of 5 key air pollutants: fine particulate matter (PM2.5), ground-level ozone (O3), nitrogen dioxide (NO2), sulphur dioxide (SO2) and volatile organic compounds (VOCs).
National
National air quality trends
This section presents a summary of outdoor air quality trends for 5 key air pollutants averaged across monitoring stations in Canada. Air quality trends are measured by average and peakFootnote 1 ambient levels (concentrations) of PM2.5, O3, NO2, SO2 and VOCs. Average concentrations are representative of chronic, prolonged or repeated exposure to air pollutants, while peak concentrations are representative of immediate or acute short-term exposure to air pollutants.
Key results
From 2009 to 2023,
- NO2, SO2 and VOCFootnote 2 average and peak national concentrations generally decreased
- no significant change occurred in O3 national concentrations (average and peak)
- PM2.5 national concentrations (average and peak) were significantly higher than 2009 levels in multiple years, especially in 2017, 2018 and 2023, corresponding to severe wildfire seasons
Relative air pollutant concentration changes, Canada, 2009 to 2023

Data tables for the long description
| Year | PM2.5 average concentration (percentage change from 2009 level) |
PM2.5 peak (98th percentile) 24-hour concentration (percentage change from 2009 level) |
O3 average 8-hour concentration (percentage change from 2009 level) |
O3 peak (4th highest) 8-hour concentration (percentage change from 2009 level) |
NO2 average concentration (percentage change from 2009 level) |
NO2 peak (98th percentile) 1-hour (percentage change from 2009 level) |
SO2 average concentration (percentage change from 2009 level) |
SO2 peak (99th percentile) 1-hour concentration (percentage change from 2009 level) |
VOC average concentration (percentage change from 2009 level) |
|---|---|---|---|---|---|---|---|---|---|
| 2009 | 0.0 | 0.0 | 0.0 | 0.0 | 0.0 | 0.0 | 0.0 | 0.0 | 0.0 |
| 2010 | 13.1 | 33.4 | 3.8 | 2.9 | -7.4 | -8.1 | 0.3 | -10.9 | -11.9 |
| 2011 | 6.7 | 7.7 | 4.0 | -0.7 | -9.0 | -12.7 | -21.1 | -13.4 | -12.3 |
| 2012 | 6.7 | 5.6 | 5.5 | 4.7 | -16.2 | -17.5 | -15.7 | -18.0 | -28.5 |
| 2013 | 18.7 | 12.5 | 3.3 | -1.8 | -13.1 | -17.5 | -17.6 | -21.3 | -27.7 |
| 2014 | 21.7 | 24.7 | 3.3 | -5.7 | -10.0 | -18.3 | -27.5 | -26.1 | -26.4 |
| 2015 | 22.6 | 28.5 | 3.9 | 1.5 | -13.4 | -21.7 | -32.3 | -35.1 | -26.2 |
| 2016 | 5.2 | 8.7 | 1.7 | -2.0 | -18.8 | -26.0 | -30.7 | -39.9 | -38.6 |
| 2017 | 16.6 | 49.6 | 5.5 | -1.0 | -16.8 | -24.2 | -32.3 | -42.7 | -30.0 |
| 2018 | 26.5 | 82.4 | 6.3 | 3.0 | -14.6 | -24.5 | -34.3 | -46.6 | -39.3 |
| 2019 | 5.0 | 1.1 | 3.1 | -6.8 | -13.6 | -26.1 | -40.6 | -46.0 | -37.4 |
| 2020 | 2.2 | 12.2 | 2.2 | -6.0 | -22.5 | -35.7 | -39.2 | -48.4 | n/a |
| 2021 | 13.6 | 39.9 | 6.4 | 0.6 | -22.9 | -34.2 | -39.2 | -49.7 | -22.1 |
| 2022 | 7.1 | 10.5 | 4.6 | -5.8 | -20.3 | -32.9 | -40.1 | -49.0 | -33.7 |
| 2023 | 62.0 | 166.9 | 6.9 | 2.8 | -24.5 | -34.5 | -38.1 | -51.2 | -40.7 |
How this indicator was calculated
Note: n/a = not available. No VOC concentration is being reported for 2020 in this indicator. For more information, consult the Data sources and Methods section.
Source: Environment and Climate Change Canada (2025) National Air Pollution Surveillance (NAPS) Program - Open Government Portal and the Canadian Air and Precipitation monitoring network.
In 2023, the national SO2 and NO2 (average and peak) and average VOC concentrations were lower than in 2009, by 38% for SO2 average, 51% for SO2 peak, 25% for NO2 average, 35% for NO2 peak and 41% for VOC.
Between 2009 and 2023, the levels of O3 concentrations (average and peak) remained similar to 2009 levels, (±7% for peak concentrations), with minor year-to-year variation recorded.
The PM2.5 concentrations in 2023 were larger than in 2009: by 62% and 167% for average and peak concentrations, respectively. Wildfires over the past decade, notably in 2017, 2018 and 2023, resulted in increased average and peak concentrations of PM2.5. In 2023, more than 14 million hectares across Canada were affected by wildfires, which was the largest area burned since 1970, according to the Canadian National Fire database.
The concentrations of these pollutants are influenced by many factors, including the proximity to local emission sources, wildfire activity, weather conditions, chemical reactions in the air and the transboundary transport of air pollutants over long distances by wind.
By pollutant
Air quality trends by pollutant
This section presents a summary of outdoor air quality trends by air pollutant, for average and peak concentrations, at national and regional levels.Footnote 3 When Canadian Ambient Air Quality StandardsFootnote 4 (CAAQS, “the standards”) exist for a pollutant (average and peak concentrations for PM2.5, NO2 and SO2, and peak O3 concentrations), its concentrations in the outdoor air are compared to the corresponding standard. The comparison to the CAAQS is provided for illustrative purposes only.
Fine particulate matter
Fine particulate matter
Fine particulate matter (PM2.5) is emitted directly to the air and can also be formed in the air through the interactions of other pollutants, such as nitrogen oxides, sulphur oxides, ammonia and volatile organic compounds. The largest human-caused emission sources of PM2.5 are open sources, mainly dust from unpaved roads, construction operations and agriculture (crop production). Home firewood burning is the largest non-open source contributor to PM2.5 emissions. PM2.5 is also emitted in wildfire smoke. PM2.5 is one of the major components of smog and one of the most widespread outdoor pollutants. Exposure to PM2.5 can lead to the onset or development of adverse respiratory and cardiovascular effects, such as asthma attacks, chronic bronchitis, heart attacks as well as lung cancer.Footnote 5 Fine particulate matter can also damage vegetation and structures, contribute to acidification and eutrophicationFootnote 6 of ecosystems, contribute to haze and reduce visibility.
National annual average fine particulate matter concentrations
Key results
- From 2009 to 2023,
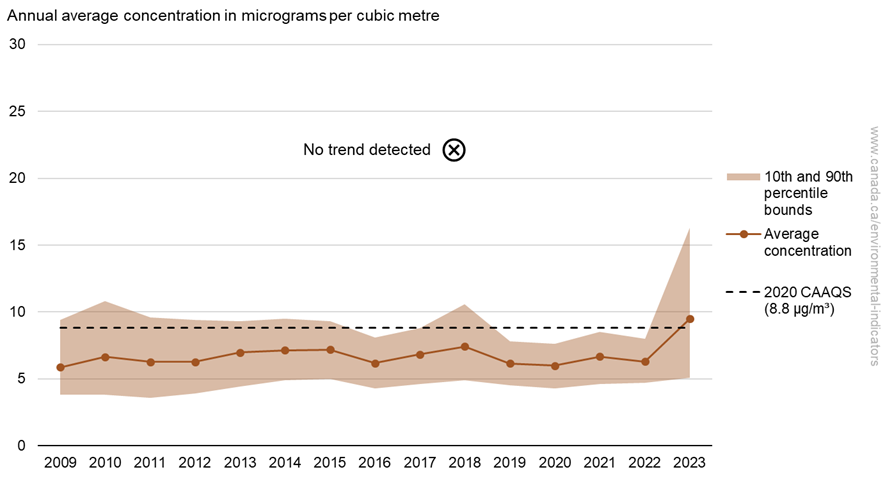
- no significant trend was detected in the national average PM2.5 concentrations
- the national average PM2.5 concentration exceeded the 2020 standard of 8.8 micrograms per cubic metre (µg/m3) only in 2023
- In 2023, the national average PM2.5 concentration was the highest over the 15-year record, consistent with the unprecedented wildfire season
National average fine particulate matter concentrations, Canada, 2009 to 2023
Data table for the long description
| Year | Average concentration (micrograms per cubic metre) |
10th percentile (micrograms per cubic metre) |
90th percentile (micrograms per cubic metre) |
|---|---|---|---|
| 2009 | 5.9 | 3.8 | 9.4 |
| 2010 | 6.6 | 3.8 | 10.8 |
| 2011 | 6.3 | 3.6 | 9.6 |
| 2012 | 6.3 | 3.9 | 9.4 |
| 2013 | 7.0 | 4.4 | 9.3 |
| 2014 | 7.1 | 4.9 | 9.5 |
| 2015 | 7.2 | 5.0 | 9.3 |
| 2016 | 6.2 | 4.3 | 8.1 |
| 2017 | 6.8 | 4.6 | 8.8 |
| 2018 | 7.4 | 4.9 | 10.6 |
| 2019 | 6.2 | 4.5 | 7.8 |
| 2020 | 6.0 | 4.3 | 7.6 |
| 2021 | 6.7 | 4.6 | 8.5 |
| 2022 | 6.3 | 4.7 | 8.0 |
| 2023 | 9.5 | 5.1 | 16.3 |
| 2020 standard | 8.8 | n/a | n/a |
| Annual trend | No trend | n/a | n/a |
How is this indicator calculated
Note: n/a = not applicable. The national average PM2.5 concentration indicator is based on the annual average of the daily 24-hour average concentrations recorded at 161 monitoring stations across Canada. The comparison to the Canadian Ambient Air Quality Standard is provided for illustrative purposes only. A statistically significant trend is reported when the Mann-Kendall test indicates the presence of a trend at the 95 percent confidence level. For more information, consult the Methods section.
Source: Environment and Climate Change Canada (2025) National Air Pollution Surveillance (NAPS) Program - Open Government Portal.
From 2009 to 2023, no trend was observed in the national average PM2.5 concentration. The highest concentration was recorded in 2023 (9.5 micrograms per cubic metre), which was the only year in the 15-year reporting period when the concentration was above the 2020 standard. The 2023 national average PM2.5 concentration was 62 percent larger than 2009. This was consistent with the 2023 wildfire season, which had the largest area burned by wildfires since 1970.
Year-to-year variation in average PM2.5 concentrations are related not only to changes in the quantity of emissions of PM2.5 and its precursors, but also to wildfire conditions and annual variations in weather conditions that influence the formation, dispersion and transport of PM2.5, including transboundary movement of PM2.5 from the United States.
The variations observed in average PM2.5 concentrations were also affected by the progressive introduction of monitoring equipment, from the mid 2000s to 2013, that uses newer measurement technologies. These new instruments measure an additional (semi-volatile) portion of the PM2.5 mass not captured by the older instruments. This should be considered when comparing measurements from newer monitors with those from years in which older instruments were used.
Regional annual average fine particulate matter concentrations
Key results
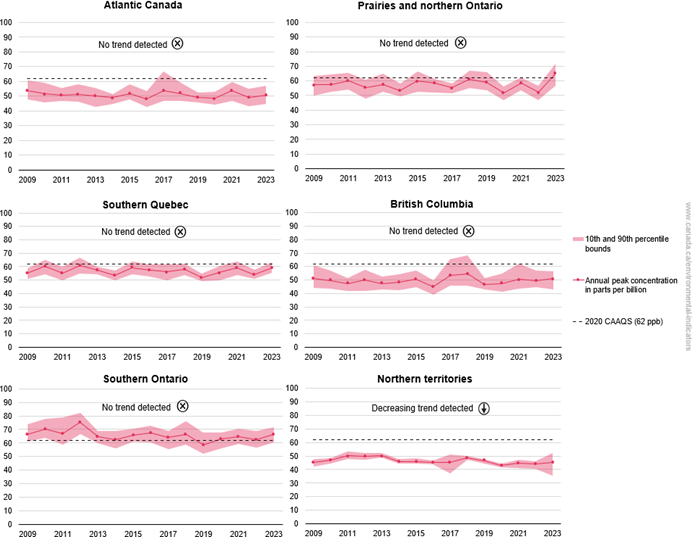
- From 2009 to 2023,
- an increasing trend was detected for annual average PM2.5 concentrations in British Columbia
- decreasing trends were detected in the Atlantic Canada and southern Quebec regions
- no trends were detected in other regions
- In 2023, the annual average PM2.5 concentrations exceeded the 2020 standard of 8.8 micrograms per cubic metre in the northern territories and the Prairies and northern Ontario regions
Regional annual average fine particulate matter concentrations, Canada, 2009 to 2023

Data table for the long description
| Year | Atlantic Canada | Southern Quebec | Southern Ontario | Prairies and northern Ontario | British Columbia | Northern territories | ||||||||||||
|---|---|---|---|---|---|---|---|---|---|---|---|---|---|---|---|---|---|---|
| Average concentration (micrograms per cubic metre) |
10th percentile (micrograms per cubic metre) |
90th percentile (micrograms per cubic metre) |
Average concentration (micrograms per cubic metre) |
10th percentile (micrograms per cubic metre) |
90th percentile (micrograms per cubic metre) |
Average concentration (micrograms per cubic metre) |
10th percentile (micrograms per cubic metre) |
90th percentile (micrograms per cubic metre) |
Average concentration (micrograms per cubic metre) |
10th percentile (micrograms per cubic metre) |
90th percentile (micrograms per cubic metre) |
Average concentration (micrograms per cubic metre) |
10th percentile (micrograms per cubic metre) |
90th percentile (micrograms per cubic metre) |
Average concentration (micrograms per cubic metre) |
10th percentile (micrograms per cubic metre) |
90th percentile (micrograms per cubic metre) |
|
| 2009 | 6.0 | 3.7 | 7.9 | 7.8 | 4.0 | 12.4 | 5.5 | 3.8 | 6.7 | 4.7 | 3.3 | 6.8 | 5.5 | 3.9 | 6.7 | 4.9 | 4.3 | 5.5 |
| 2010 | 5.6 | 3.9 | 7.2 | 7.9 | 4.7 | 11.4 | 5.9 | 4.0 | 7.7 | 7.5 | 4.4 | 14.5 | 5.8 | 3.7 | 9.2 | 3.4 | 1.9 | 4.9 |
| 2011 | 6.1 | 5.0 | 8.5 | 7.7 | 4.0 | 10.5 | 6.0 | 4.2 | 7.7 | 6.6 | 3.6 | 10.4 | 5.0 | 3.3 | 8.0 | 4.4 | 2.5 | 6.2 |
| 2012 | 5.6 | 3.9 | 6.9 | 7.7 | 3.9 | 10.0 | 6.0 | 4.1 | 7.4 | 6.4 | 4.1 | 9.4 | 5.2 | 3.3 | 8.0 | 5.1 | 3.5 | 6.2 |
| 2013 | 6.1 | 4.5 | 7.3 | 7.5 | 4.6 | 10.1 | 7.8 | 5.6 | 9.4 | 6.4 | 4.0 | 8.2 | 6.6 | 3.9 | 8.9 | 5.4 | 3.5 | 6.4 |
| 2014 | 6.2 | 5.2 | 8.1 | 7.2 | 4.9 | 9.5 | 8.1 | 5.8 | 9.9 | 6.9 | 4.6 | 9.0 | 6.6 | 4.6 | 9.0 | 9.8 | 3.7 | 15.8 |
| 2015 | 6.0 | 5.5 | 7.4 | 7.1 | 5.0 | 9.1 | 7.8 | 5.7 | 9.4 | 7.2 | 4.9 | 9.4 | 7.2 | 5.0 | 9.3 | 6.2 | 4.6 | 8.5 |
| 2016 | 5.6 | 4.5 | 6.7 | 6.3 | 4.4 | 8.4 | 6.5 | 4.8 | 8.1 | 6.8 | 4.4 | 9.5 | 5.5 | 3.8 | 7.8 | 4.6 | 2.6 | 7.8 |
| 2017 | 5.6 | 4.5 | 6.8 | 6.5 | 4.3 | 8.5 | 6.4 | 4.6 | 7.8 | 6.8 | 5.1 | 8.8 | 8.3 | 5.8 | 11.8 | 4.0 | 3.2 | 4.5 |
| 2018 | 5.1 | 4.3 | 5.8 | 6.5 | 4.3 | 8.8 | 6.8 | 5.4 | 8.2 | 8.8 | 6.5 | 11.6 | 8.8 | 5.4 | 13.8 | 3.5 | 2.9 | 4.3 |
| 2019 | 5.0 | 4.4 | 5.5 | 6.2 | 4.5 | 7.7 | 6.5 | 4.5 | 7.8 | 6.2 | 4.6 | 7.8 | 6.3 | 4.5 | 8.6 | 4.4 | 4.3 | 4.4 |
| 2020 | 5.1 | 4.0 | 5.7 | 6.3 | 4.5 | 7.6 | 6.2 | 4.5 | 7.4 | 5.2 | 4.0 | 6.7 | 6.9 | 5.7 | 8.2 | 4.7 | 4.0 | 5.6 |
| 2021 | 5.1 | 4.2 | 5.8 | 6.8 | 5.1 | 8.5 | 6.9 | 5.4 | 8.3 | 7.3 | 5.4 | 9.1 | 6.6 | 4.4 | 11.5 | 5.2 | 4.5 | 6.6 |
| 2022 | 5.1 | 3.8 | 5.7 | 6.3 | 4.5 | 7.8 | 6.4 | 4.7 | 7.7 | 6.3 | 5.0 | 7.8 | 6.7 | 5.0 | 8.8 | 5.6 | 5.1 | 6.0 |
| 2023 | 5.4 | 4.4 | 6.2 | 8.3 | 6.7 | 10.1 | 8.8 | 7.6 | 10.1 | 16.1 | 9.1 | 23.3 | 7.0 | 4.3 | 12.1 | 15.7 | 5.6 | 25.7 |
| 2020 standard | 8.8 | n/a | n/a | 8.8 | n/a | n/a | 8.8 | n/a | n/a | 8.8 | n/a | n/a | 8.8 | n/a | n/a | 8.8 | n/a | n/a |
| Annual trend | -0.07 | n/a | n/a | -0.12 | n/a | n/a | No trend | n/a | n/a | No trend | n/a | n/a | 0.15 | n/a | n/a | n/a | n/a | |
How is this indicator calculated
Note: n/a = not applicable. The regional annual average PM2.5 concentration indicator is based on the annual average of the daily 24-hour average concentrations recorded at 16 monitoring stations in the Atlantic Canada region, 35 in the southern Quebec region, 37 in the southern Ontario region, 35 in the Prairies and northern Ontario region, 35 in British Columbia and 3 in northern territories region. The comparison to the Canadian Ambient Air Quality Standard is provided for illustrative purposes only. A statistically significant trend is reported when the Mann-Kendall test indicates the presence of a trend at the 95 percent confidence level. For more information, consult the Methods section.
Source: Environment and Climate Change Canada (2025) National Air Pollution Surveillance (NAPS) Program - Open Government Portal.
In 2023, the regions of the Prairies and northern Ontario and the northern territories exceeded the 2020 standard of 8.8 micrograms per cubic metre, with concentrations of 16.1 micrograms per cubic metre and 15.7 micrograms per cubic metre, respectively. The southern Ontario, Atlantic Canada and British Columbia regions reported regional average concentrations of 8.8 micrograms per cubic metre, 5.4 micrograms per cubic metre and 7.0 micrograms per cubic metre, respectively.
Average fine particulate matter concentrations at monitoring stations
The National Air Pollution Surveillance program measures air pollutant concentrations at monitoring stations across Canada. The Canadian Environmental Sustainability Indicators program provides access to this information through an interactive map. The map allows users to explore average PM2.5 concentrations at specific monitoring stations.
Key results
In 2023, annual average PM2.5 concentrations were recorded at 201 monitoring stations across Canada.
- 92 stations recorded annual average concentrations above the 2020 standard of 8.8 micrograms per cubic metre. These stations were in Alberta (38), Ontario (20), Quebec (15), British Columbia (12), Saskatchewan (6) and the Northwest Territories (1)
- 2 stations recorded annual average concentrations below 4.0 micrograms per cubic metre, both located in British Columbia
- no monitoring station data were available for Manitoba or Nunavut
Average fine particulate matter concentrations by monitoring station, Canada, 2023

Long description
The map of Canada shows the average concentrations of fine particulate matter in 2023 by monitoring station. Stations are categorized by the concentration of PM2.5 measured in the air. The categories are as follows: 0 to less than 4 micrograms per cubic metre, 4 to less than 6 micrograms per cubic metre, 6 to less than 8 micrograms per cubic metre, 8 to 8.8 micrograms per cubic metre and over 8.8 micrograms per cubic metre.
Navigate data using the interactive map
How this indicator was calculated
Source: Environment and Climate Change Canada (2025) National Air Pollution Surveillance (NAPS) Program - Open Government Portal.
National annual average peak fine particulate matter concentrations
Key results
- From 2009 to 2023,
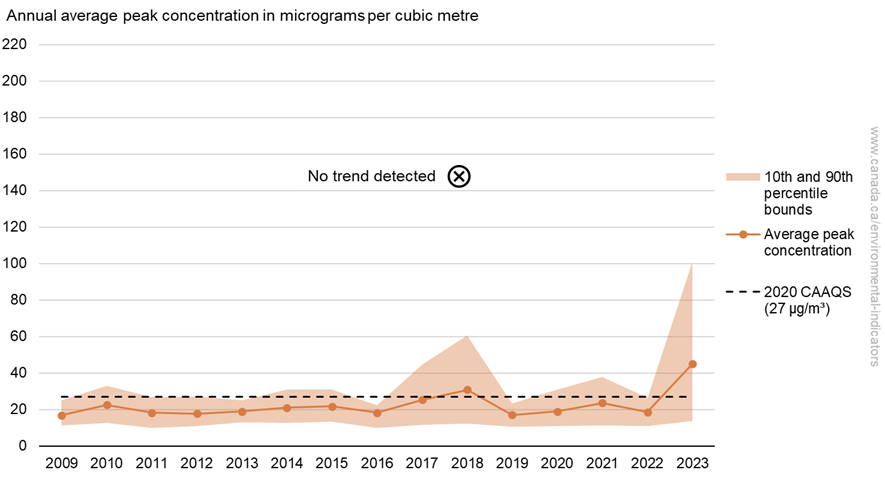
- no trend was detected in the national average peak PM2.5 concentration
- national average peak concentrations exceeded the 2020 standard of 27 micrograms per cubic metre in 2018 and 2023
- In 2023, the national average peak PM2.5 concentration was the highest over the 15-year record, largely due to the unprecedented wildfire season
National average peak fine particulate matter concentrations, Canada, 2009 to 2023
Data table for the long description
| Year | Average peak (98th percentile) 24-hour concentration (micrograms per cubic metre) |
10th percentile (micrograms per cubic metre) |
90th percentile (micrograms per cubic metre) |
|---|---|---|---|
| 2009 | 16.9 | 11.3 | 25.2 |
| 2010 | 22.5 | 12.6 | 33.1 |
| 2011 | 18.2 | 10.0 | 26.8 |
| 2012 | 17.8 | 11.1 | 27.0 |
| 2013 | 19.0 | 13.1 | 25.2 |
| 2014 | 21.1 | 12.8 | 31.0 |
| 2015 | 21.7 | 13.5 | 30.8 |
| 2016 | 18.4 | 9.9 | 22.2 |
| 2017 | 25.3 | 11.5 | 44.9 |
| 2018 | 30.8 | 12.3 | 60.5 |
| 2019 | 17.1 | 10.6 | 23.4 |
| 2020 | 19.0 | 10.8 | 30.8 |
| 2021 | 23.6 | 11.4 | 37.9 |
| 2022 | 18.7 | 11.1 | 26.3 |
| 2023 | 45.1 | 13.8 | 101.1 |
| 2020 standard | 27 | n/a | n/a |
| Annual trend | No trend | n/a | n/a |
How is this indicator calculated
Note: n/a = not applicable. The national average peak PM2.5 concentration indicator is based on the annual 98th percentile of the daily 24-hour average concentrations recorded at 161 monitoring stations across Canada. The comparison to the Canadian Ambient Air Quality Standard is provided for illustrative purposes only. A statistically significant trend is reported when the Mann-Kendall test indicates the presence of a trend at the 95 percent confidence level. For more information, consult the Methods section.
Source: Environment and Climate Change Canada (2025) National Air Pollution Surveillance (NAPS) Program - Open Government Portal.
In 2023, the national average peak PM2.5 concentration was 45.1 micrograms per cubic metre, the highest in the last 15 years and 167 percent and 141 percent larger than 2009 and 2022 respectively. It also exceeded the 2020 standard of 27 micrograms per cubic metre. This record-high concentration was the result of the wildfire affecting all regions in Canada that year. These wildfires saw the largest area burned since 1970.
From 2009 to 2023, no trend was detected in the national average peak PM2.5 concentrations. Over that period, concentrations remained relatively stable except for the years 2017, 2018 and 2023. The higher concentrations observed for those years can be attributed primarily to wildfire activity.
Changes in peak PM2.5 concentrations are linked not only to changes in the quantity of emissions, but also to annual variations in wildfire activity and in weather conditions that influence the formation, dispersion, and transport of PM2.5 including transboundary movement of PM2.5 from the United States.
The PM2.5 concentrations were also influenced by the progressive introduction of monitoring equipment that uses newer measurement technologies. From 2000 to 2013, new PM2.5 monitoring equipment was progressively introduced across Canada to replace older monitoring equipment. These new instruments measure an additional (semi-volatile) portion of the PM2.5 mass not captured by the older instruments. This should be considered when comparing measurements from newer monitors with those from years in which older instruments were used.
Regional annual average peak fine particulate matter concentrations
Key results
- From 2009 to 2023,
- a decreasing trend was detected in annual average peak PM2.5 concentrations in the Atlantic Canada region
- no trend was detected for the other regions
- In 2023,
- annual average peak PM2.5 concentrations exceeded the 2020 standard of 27 micrograms per cubic metre in all regions, except Atlantic Canada.
- the southern Quebec and southern Ontario regions recorded concentrations exceeding the standard for the first time in last 15 years
Regional annual average peak fine particulate matter concentrations, Canada, 2009 to 2023

Data table for the long description
| Year | Atlantic Canada | Southern Quebec | Southern Ontario | Prairies and northern Ontario | British Columbia | Northern territories | ||||||||||||
|---|---|---|---|---|---|---|---|---|---|---|---|---|---|---|---|---|---|---|
| Average peak (98th percentile) concentration (micrograms per cubic metre) |
10th percentile (micrograms per cubic metre) |
90th percentile (micrograms per cubic metre) |
Average peak (98th percentile) concentration (micrograms per cubic metre) |
10th percentile (micrograms per cubic metre) |
90th percentile (micrograms per cubic metre) |
Average peak (98th percentile) concentration (micrograms per cubic metre) |
10th percentile (micrograms per cubic metre) |
90th percentile (micrograms per cubic metre) |
Average peak (98th percentile) concentration (micrograms per cubic metre) |
10th percentile (micrograms per cubic metre) |
90th percentile (micrograms per cubic metre) |
Average peak (98th percentile) concentration (micrograms per cubic metre) |
10th percentile (micrograms per cubic metre) |
90th percentile (micrograms per cubic metre) |
Average peak (98th percentile) concentration (micrograms per cubic metre) |
10th percentile (micrograms per cubic metre) |
90th percentile (micrograms per cubic metre) |
|
| 2009 | 16.1 | 10.6 | 18.7 | 22.3 | 11.5 | 33.0 | 14.8 | 11.3 | 17.5 | 14.2 | 10.3 | 17.1 | 16.8 | 12.0 | 24.7 | 16.7 | 11.2 | 22.2 |
| 2010 | 16.6 | 11.2 | 22.0 | 24.8 | 17.6 | 32.0 | 20.9 | 13.6 | 25.0 | 24.7 | 14.6 | 37.5 | 23.4 | 10.9 | 46.8 | 10.9 | 6.3 | 15.4 |
| 2011 | 15.9 | 11.0 | 18.8 | 20.5 | 12.3 | 26.8 | 18.0 | 13.8 | 22.8 | 22.3 | 11.2 | 49.3 | 13.6 | 8.0 | 22.9 | 16.7 | 7.5 | 25.8 |
| 2012 | 13.5 | 9.5 | 17.9 | 22.1 | 12.0 | 29.8 | 17.0 | 13.3 | 20.6 | 18.7 | 12.1 | 24.8 | 15.7 | 10.2 | 29.4 | 14.0 | 8.9 | 17.8 |
| 2013 | 17.4 | 14.9 | 19.9 | 20.8 | 13.9 | 26.4 | 19.8 | 15.0 | 23.5 | 18.0 | 12.7 | 23.9 | 17.7 | 10.3 | 32.4 | 20.6 | 10.1 | 31.9 |
| 2014 | 14.4 | 12.2 | 16.8 | 18.2 | 12.5 | 23.6 | 20.8 | 14.0 | 25.5 | 24.3 | 15.3 | 33.7 | 20.9 | 13.3 | 31.6 | 70.4 | 9.8 | 130.9 |
| 2015 | 14.6 | 11.1 | 19.9 | 19.1 | 13.0 | 24.4 | 20.1 | 14.3 | 24.4 | 30.6 | 17.4 | 46.2 | 20.7 | 13.7 | 30.0 | 21.6 | 15.0 | 31.6 |
| 2016 | 11.6 | 9.4 | 14.0 | 15.6 | 9.9 | 21.2 | 16.1 | 12.3 | 19.3 | 30.8 | 11.4 | 33.1 | 14.6 | 9.6 | 23.5 | 14.0 | 6.8 | 19.7 |
| 2017 | 12.4 | 10.6 | 14.7 | 16.7 | 10.5 | 22.7 | 16.2 | 12.1 | 19.4 | 25.8 | 14.9 | 35.0 | 47.7 | 22.4 | 74.0 | 17.7 | 11.4 | 21.8 |
| 2018 | 11.0 | 8.9 | 13.4 | 18.2 | 12.1 | 23.5 | 18.5 | 14.0 | 21.2 | 49.1 | 27.7 | 64.2 | 47.9 | 25.1 | 82.3 | 11.4 | 9.4 | 12.8 |
| 2019 | 10.8 | 9.3 | 12.3 | 16.4 | 12.0 | 20.4 | 17.2 | 12.5 | 20.8 | 20.6 | 13.8 | 27.7 | 16.6 | 10.0 | 23.5 | 18.9 | 10.3 | 28.7 |
| 2020 | 11.3 | 9.3 | 14.2 | 18.4 | 11.3 | 23.7 | 15.7 | 12.2 | 18.9 | 15.2 | 10.8 | 19.3 | 31.1 | 17.1 | 48.9 | 14.9 | 10.5 | 22.3 |
| 2021 | 11.9 | 10.0 | 14.0 | 20.4 | 17.1 | 24.5 | 18.7 | 14.9 | 22.2 | 33.0 | 23.9 | 41.0 | 28.5 | 10.5 | 92.5 | 19.2 | 11.8 | 27.7 |
| 2022 | 11.2 | 8.7 | 13.9 | 16.1 | 10.1 | 20.2 | 16.4 | 12.6 | 21.1 | 22.4 | 15.2 | 28.5 | 22.7 | 16.4 | 29.5 | 25.2 | 19.4 | 29.7 |
| 2023 | 14.0 | 12.3 | 15.5 | 31.4 | 22.4 | 52.7 | 34.0 | 29.6 | 39.6 | 103.4 | 59.8 | 165.6 | 28.3 | 12.7 | 66.3 | 91.4 | 19.2 | 211.7 |
| 2020 standard | 27 | n/a | n/a | 27 | n/a | n/a | 27 | n/a | n/a | 27 | n/a | n/a | 27 | n/a | n/a | 27 | n/a | n/a |
| Annual trend | -0.40 | n/a | n/a | No trend | n/a | n/a | No trend | n/a | n/a | No trend | n/a | n/a | No trend | n/a | n/a | No trend | n/a | n/a |
Download data file (Excel/CSV; 4.2 kB)
How is this indicator calculated
Note: n/a = not applicable. The regional average peak PM2.5 concentration indicator is based on the annual 98th percentile of the daily 24-hour average concentrations recorded at 16 monitoring stations in the Atlantic Canada region, 35 in the southern Quebec region, 37 in the southern Ontario region, 35 in the Prairies and northern Ontario region, 35 in British Columbia and 3 in the northern territories region. The comparison to the Canadian Ambient Air Quality Standard is provided for illustrative purposes only. A statistically significant trend is reported when the Mann-Kendall test indicates the presence of a trend at the 95 percent confidence level. For more information, consult the Methods section.
Source: Environment and Climate Change Canada (2025) National Air Pollution Surveillance (NAPS) Program - Open Government Portal.
In 2023, annual average peak PM2.5 concentrations were larger than in 2022 for all regions: by 24 percent in British Columbia, 25 percent in Atlantic Canada, 95 percent in southern Quebec, 108 percent in southern Ontario, 263 percent in the northern territories and 361 percent in the Prairies and northern Ontario. The substantial increase in concentrations is largely driven by the record 2023 wildfire season.
Except for Atlantic Canada and British Columbia, the regional average peak PM2.5 concentrations in 2023 were the highest in the 15-year period.
Peak fine particulate matter concentrations at monitoring stations
The National Air Pollution Surveillance program measures air pollutant concentrations at monitoring stations across Canada. The Canadian Environmental Sustainability Indicators program provides access to this information through an interactive map. The map allows users to explore peak PM2.5 concentrations at specific monitoring stations.
Key results
In 2023, annual average peak PM2.5 concentrations were recorded at 204 monitoring stations across Canada. The highest peak PM2.5 concentrations were generally recorded at monitoring stations in central Canada.
- 120 stations recorded annual average peak concentrations above the 2020 standard 27.0 micrograms per cubic metre, ranging from 27 micrograms per cubic metre to 212 micrograms per cubic metre. The majority of these stations were located in Alberta (40), Ontario (37), Quebec (19) and British Columbia (15)
- no stations recorded annual average peak concentrations below 10.0 micrograms per cubic metre
- no monitoring station data were available for Manitoba or Nunavut
Peak fine particulate matter concentrations by monitoring station, Canada, 2023
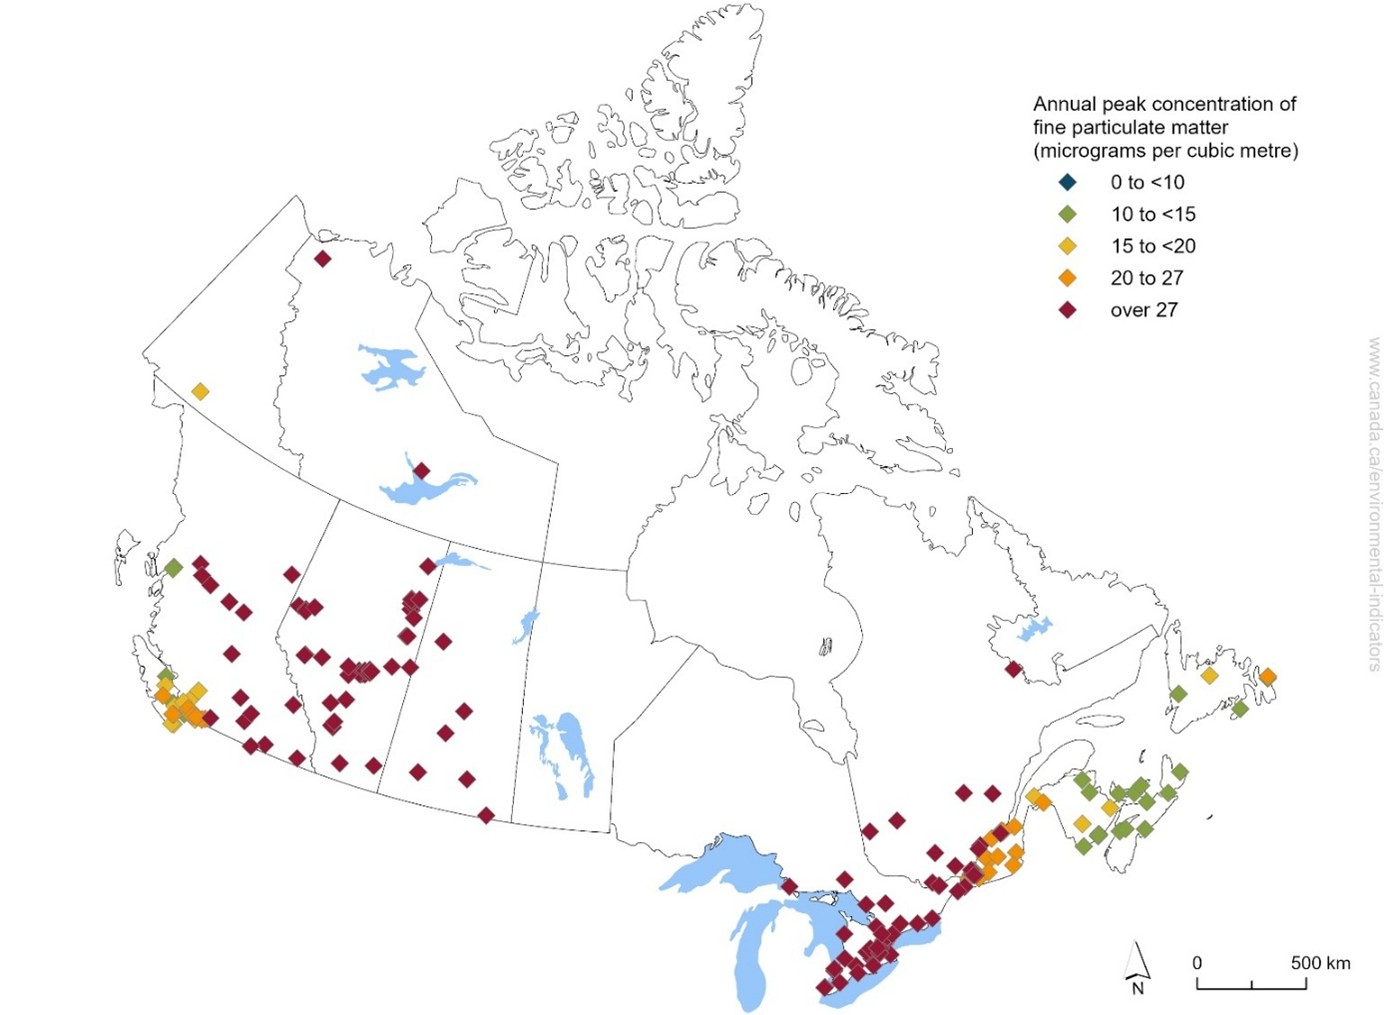
Long description
The map of Canada shows the peak concentrations of fine particulate matter in 2023 by monitoring station. Stations are categorized by the concentration of fine particulate matter measured in the air. The categories are as follows: 0 to less than 10 micrograms per cubic metre, 10 to less than 15 micrograms per cubic metre, 15 to less than 20 micrograms per cubic metre, 20 to 27 micrograms per cubic metre and over 27 micrograms per cubic metre.
Navigate data using the interactive map
How this indicator was calculated
Source: Environment and Climate Change Canada (2025) National Air Pollution Surveillance (NAPS) Program - Open Government Portal.
Ground-level ozone
Ground-level ozone
Ozone (O3) is a gas that, when present in the upper atmosphere (10 to 50 kilometres above the earth's surface), protects plant, animal and human health from the sun's harmful ultraviolet radiation. In the lower atmosphere and at ground level, O3 is a secondary pollutant formed through reactions between precursor gases such as nitrogen oxides and volatile organic compounds in the presence of sunlight. Exposure to O3 is harmful to human health and can cause throat irritation, coughing, shortness of breath and aggravation of existing conditions such as asthma. Over time, exposure to O3 may lead to development of asthma, reduced lung function and other lung conditions.Footnote 5 Ground-level O3 can impact vegetation, decrease the productivity of some crops, and may contribute to forest decline. It can also damage synthetic materials and textiles, cause cracks in rubber, accelerate fading of dyes and speed deterioration of some paints and coatings. Ground-level O3 is a major component of smog, along with fine particulate matter.
National annual average ground-level ozone concentrations
Key results
- From 2009 to 2023,
- no trend was detected in the national average O3 concentrations
- national average concentrations showed low variability ;
- In 2023, the national average O3 concentration showed the highest level since 2009
National average ozone concentrations, Canada, 2009 to 2023

Data table for the long description
| Year | Average concentration (parts per billion) |
10th percentile (parts per billion) |
90th percentile (parts per billion) |
|---|---|---|---|
| 2009 | 31.9 | 26 | 37 |
| 2010 | 33.2 | 27 | 39 |
| 2011 | 33.2 | 28 | 39 |
| 2012 | 33.7 | 28 | 39 |
| 2013 | 33.0 | 26 | 38 |
| 2014 | 33.0 | 28 | 38 |
| 2015 | 33.2 | 27 | 38 |
| 2016 | 32.5 | 27 | 39 |
| 2017 | 33.7 | 29 | 38 |
| 2018 | 34.0 | 29 | 38 |
| 2019 | 32.9 | 27 | 37 |
| 2020 | 32.7 | 28 | 37 |
| 2021 | 34.0 | 30 | 39 |
| 2022 | 33.4 | 28 | 39 |
| 2023 | 34.2 | 28 | 39 |
| Annual trend | No trend | n/a | n/a |
Download data file (Excel/CSV; 1.5 kB)
How this indicator was calculated
Note: n/a = not applicable. The national average O3 concentration indicator is based on the annual average of the daily maximum 8-hour average concentrations recorded at 169 monitoring stations across Canada. No comparison with CAAQS is shown as there is no comparable O3 standard. A statistically significant trend is reported when the Mann-Kendall test indicates the presence of a trend at the 95 precent confidence level. For more information, consult the Methods section.
Source: Environment and Climate Change Canada (2025) National Air Pollution Surveillance (NAPS) Program - Open Government Portal and the Canadian Air and Precipitation Monitoring Network (CAPMoN).
In 2023, the national average O3 concentration was 34.2 parts per billion, slightly higher than the average concentration observed in previous years (2009-2022), which ranged from 31.9 parts per billion to 34.0 parts per billion.
Regional annual average ground-level ozone concentrations
Key results
- From 2009 to 2023,
- increasing trends were detected in annual average O3 concentrations for the Atlantic Canada and southern Quebec regions
- no trends were detected for the other regions
- In 2023, the southern Ontario region showed the highest regional average O3 concentration
Regional average ozone concentrations, Canada, 2009 to 2023

Data table for the long description
| Year | Atlantic Canada | Southern Quebec | Southern Ontario | Prairies and northern Ontario | British Columbia | Northern territories | ||||||||||||
|---|---|---|---|---|---|---|---|---|---|---|---|---|---|---|---|---|---|---|
| Average concentration (parts per billion) |
10th percentile (parts per billion) |
90th percentile (parts per billion) |
Average concentration (parts per billion) |
10th percentile (parts per billion) |
90th percentile (parts per billion) |
Average concentration (parts per billion) |
10th percentile (parts per billion) |
90th percentile (parts per billion) |
Average concentration (parts per billion) |
10th percentile (parts per billion) |
90th percentile (parts per billion) |
Average concentration (parts per billion) |
10th percentile (parts per billion) |
90th percentile (parts per billion) |
Average concentration (parts per billion) |
10th percentile (parts per billion) |
90th percentile (parts per billion) |
|
| 2009 | 31.7 | 30 | 35 | 30.4 | 26 | 34 | 35.5 | 32 | 39 | 33.7 | 29 | 40 | 28.0 | 24 | 32 | 28.7 | 27 | 32 |
| 2010 | 33.1 | 31 | 35 | 33.2 | 29 | 37 | 37.8 | 33 | 41 | 33.0 | 29 | 37 | 27.5 | 25 | 32 | 31.8 | 29 | 34 |
| 2011 | 32.9 | 31 | 36 | 32.3 | 29 | 35 | 36.6 | 33 | 40 | 35.6 | 31 | 40 | 28.0 | 24 | 32 | 31.0 | 29 | 33 |
| 2012 | 32.9 | 30 | 35 | 33.6 | 30 | 37 | 38.1 | 35 | 41 | 33.5 | 28 | 39 | 29.2 | 26 | 34 | 31.0 | 28 | 33 |
| 2013 | 33.3 | 29 | 37 | 33.8 | 31 | 36 | 36.6 | 33 | 39 | 34.2 | 29 | 38 | 26.5 | 23 | 30 | 28.7 | 25 | 32 |
| 2014 | 33.5 | 29 | 36 | 33.0 | 30 | 36 | 36.6 | 32 | 40 | 33.2 | 29 | 37 | 28.3 | 25 | 32 | 30.0 | 28 | 33 |
| 2015 | 33.5 | 30 | 36 | 33.8 | 31 | 36 | 36.8 | 33 | 40 | 33.5 | 28 | 37 | 27.9 | 24 | 32 | 30.7 | 29 | 33 |
| 2016 | 32.3 | 30 | 34 | 33.1 | 31 | 35 | 37.4 | 34 | 40 | 31.8 | 28 | 35 | 26.9 | 24 | 31 | 31.0 | 28 | 34 |
| 2017 | 34.5 | 32 | 37 | 33.5 | 31 | 36 | 36.5 | 33 | 39 | 35.2 | 31 | 38 | 29.2 | 25 | 34 | 29.0 | 20 | 34 |
| 2018 | 34.3 | 31 | 37 | 34.8 | 32 | 37 | 36.7 | 34 | 39 | 35.3 | 31 | 38 | 28.5 | 25 | 32 | 31.7 | 30 | 33 |
| 2019 | 33.8 | 30 | 37 | 33.7 | 31 | 36 | 35.8 | 33 | 38 | 33.9 | 31 | 37 | 27.1 | 23 | 31 | 32.3 | 31 | 34 |
| 2020 | 33.6 | 31 | 37 | 33.3 | 32 | 35 | 35.6 | 33 | 38 | 33.4 | 30 | 37 | 27.6 | 22 | 30 | 29.7 | 27 | 32 |
| 2021 | 34.1 | 32 | 36 | 33.6 | 31 | 36 | 36.7 | 33 | 39 | 35.6 | 32 | 40 | 30.0 | 26 | 33 | 30.0 | 26 | 33 |
| 2022 | 33.7 | 31 | 37 | 33.7 | 32 | 36 | 36.7 | 33 | 40 | 35.2 | 32 | 39 | 27.9 | 24 | 31 | 29.0 | 26 | 31 |
| 2023 | 33.8 | 30 | 37 | 34.6 | 32 | 37 | 37.1 | 34 | 40 | 36.6 | 33 | 41 | 28.9 | 25 | 33 | 29.3 | 23 | 34 |
| Annual trend | 0.09 | n/a | n/a | 0.11 | n/a | n/a | No trend | n/a | n/a | No trend | n/a | n/a | No trend | n/a | n/a | No trend | n/a | n/a |
How this indicator was calculated
Note: n/a = not applicable. The regional annual average O3 concentration indicator is based on the annual average of the daily maximum 8-hour average concentrations recorded at 18 monitoring stations in the Atlantic Canada region, 39 in the southern Quebec region, 40 in the southern Ontario region, 34 in the Prairies and northern Ontario region, and 34 in British Columbia and 4 in the northern territories region. No comparison with CAAQS is shown as there is no comparable O3 standard. A statistically significant trend is reported when the Mann-Kendall test indicates the presence of a trend at the 95 percent confidence level. For more information, consult the Methods section.
Source: Environment and Climate Change Canada (2025) National Air Pollution Surveillance (NAPS) Program - Open Government Portal and the Canadian Air and Precipitation Monitoring Network (CAPMoN).
In 2023, the southern Ontario region had a regional average O3 concentration of 37.1 parts per billion, followed by the Prairies and northern Ontario region with 36.6 parts per billion, the southern Quebec with 34.6 parts per billionand the Atlantic Canada regions with 33.8 parts per billion. The average concentrations in the northern territories and British Columbia regions were lower, at 29.3 parts per billion and 28.9 parts per billion, respectively.
Average ground-level ozone concentrations at monitoring stations
The National Air Pollution Surveillance program measures air pollutant concentrations at monitoring stations across Canada. The Canadian Environmental Sustainability Indicators program provides access to this information through an interactive map. The map allows users to explore average O3 concentrations at specific monitoring stations.
Key results
In 2023, annual average O3 concentrations were recorded at 214 monitoring stations across Canada. Of these:
- 10 stations had an annual average concentration above 40 parts per billion, ranging from 41 parts per billion to 44 parts per billion. One (1) station was in Newfoundland and Labrador, and the 9 other stations were in Alberta
- 7 stations had an annual average concentrations below 25 parts per billion. Of these stations, 5 were in British Columbia and 1 station each in Manitoba and the Northwest Territories
Average ozone concentrations by monitoring station, Canada, 2023

Long description
The map of Canada shows the average concentrations of ozone in 2023 by monitoring station. Stations are categorized by the concentration of ozone measured in the air. The categories are as follows: 0 to less than 25 parts per billion, 25 to less than 30 parts per billion, 30 to less than 35 parts per billion, 35 to 40 parts per billion and over 40 parts per billion.
Navigate data using the interactive map
How this indicator was calculated
Source: Environment and Climate Change Canada (2025) National Air Pollution Surveillance (NAPS) Program - Open Government Portal and the Canadian Air and Precipitation Monitoring Network (CAPMoN).
National annual average peak ground-level ozone concentrations
Key results
From 2009 to 2023,
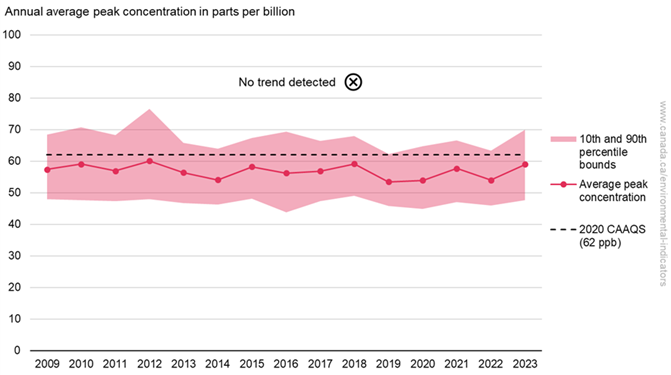
- no trend was detected in the national average peak O3 concentrations
- national average peak concentrations remained below the 2020 standard of 62 parts per billion
National average peak ozone concentrations, Canada, 2009 to 2023
Data table for the long description
| Year | Average peak (4th-highest) 8-hour concentration (parts per billion) |
10th percentile (parts per billion) |
90th percentile (parts per billion) |
|---|---|---|---|
| 2009 | 57.4 | 48.0 | 68.4 |
| 2010 | 59.0 | 47.6 | 70.8 |
| 2011 | 57.0 | 47.3 | 68.3 |
| 2012 | 60.0 | 47.9 | 76.5 |
| 2013 | 56.4 | 46.8 | 65.8 |
| 2014 | 54.1 | 46.3 | 63.9 |
| 2015 | 58.2 | 48.1 | 67.3 |
| 2016 | 56.2 | 43.8 | 69.3 |
| 2017 | 56.8 | 47.4 | 66.4 |
| 2018 | 59.1 | 49.1 | 68.0 |
| 2019 | 53.5 | 45.8 | 62.3 |
| 2020 | 53.9 | 44.9 | 64.8 |
| 2021 | 57.7 | 47.0 | 66.5 |
| 2022 | 54.0 | 45.9 | 63.4 |
| 2023 | 59.0 | 47.6 | 70.0 |
| 2020 standard | 62 | n/a | n/a |
| Annual trend | No trend | n/a | n/a |
How this indicator was calculated
Note: n/a = not applicable. The national average peak O3 concentration indicator is based on the annual 4th-highest of the daily maximum 8-hour average concentrations recorded at 169 monitoring stations across Canada. The comparison to the Canadian Ambient Air Quality Standard is provided for illustrative purposes only. A statistically significant trend is reported when the Mann-Kendall test indicates the presence of a trend at the 95 percent confidence level. For more information, consult the Methods section.
Source: Environment and Climate Change Canada (2025) National Air Pollution Surveillance (NAPS) Program - Open Government Portal and the Canadian Air and Precipitation Monitoring Network (CAPMoN).
In 2023, the national average peak O3 concentration was 59.0 parts per billion.
From 2009 to 2023, no trend was observed; concentrations showed low variability and were below the 2020 standard of 62 parts per billion.
Regional annual average peak ground-level ozone concentrations
Key results
- From 2009 to 2023, a decreasing trend was detected for regional average peak O3 concentrations only in the northern territories region
- In 2023, regional average peak concentrations in the southern Ontario and Prairies and northern Ontario regions exceeded the 2020 standard of 62 parts per billion
Regional average peak ozone concentrations, Canada, 2009 to 2023
Data table for the long description
| Year | Atlantic Canada | Southern Quebec | Southern Ontario | Prairies and northern Ontario | British Columbia | Northern territories | ||||||||||||
|---|---|---|---|---|---|---|---|---|---|---|---|---|---|---|---|---|---|---|
| Average peak
8-hour concentration (parts per billion) |
10th percentile (parts per billion) |
90th percentile (parts per billion) |
Average peak
8-hour concentration (parts per billion) |
10th percentile (parts per billion) |
90th percentile (parts per billion) |
Average peak
8-hour concentration (parts per billion) |
10th percentile (parts per billion) |
90th percentile (parts per billion) |
Average peak
8-hour concentration (parts per billion) |
10th percentile (parts per billion) |
90th percentile (parts per billion) |
Average peak
8-hour concentration (parts per billion) |
10th percentile (parts per billion) |
90th percentile (parts per billion) |
Average peak
8-hour concentration (parts per billion) |
10th percentile (parts per billion) |
90th percentile (parts per billion) |
|
| 2009 | 53.8 | 47.8 | 60.5 | 55.3 | 51.0 | 58.6 | 66.4 | 61.3 | 74.0 | 57.4 | 50.0 | 63.5 | 51.4 | 44.1 | 61.0 | 45.3 | 42.0 | 48.0 |
| 2010 | 51.4 | 45.5 | 59.3 | 60.3 | 54.3 | 64.9 | 70.5 | 63.6 | 78.0 | 57.6 | 52.5 | 64.6 | 49.7 | 43.4 | 56.9 | 46.9 | 44.3 | 48.1 |
| 2011 | 50.7 | 47.0 | 55.3 | 55.1 | 50.0 | 60.1 | 66.9 | 58.8 | 78.8 | 60.1 | 54.3 | 65.6 | 47.3 | 42.0 | 51.6 | 50.1 | 47.6 | 53.6 |
| 2012 | 51.4 | 46.5 | 57.9 | 61.0 | 55.1 | 66.6 | 75.6 | 66.9 | 82.5 | 55.3 | 48.1 | 60.6 | 50.1 | 42.1 | 57.6 | 49.6 | 47.5 | 52.3 |
| 2013 | 50.2 | 42.8 | 55.4 | 57.3 | 54.3 | 60.1 | 64.8 | 59.9 | 68.6 | 57.5 | 52.4 | 65.1 | 47.4 | 43.0 | 52.3 | 50.1 | 48.7 | 52.1 |
| 2014 | 48.9 | 44.5 | 51.4 | 53.4 | 49.9 | 57.0 | 62.5 | 56.0 | 68.8 | 53.5 | 49.6 | 58.5 | 48.6 | 42.6 | 54.1 | 45.7 | 44.3 | 47.8 |
| 2015 | 51.7 | 47.6 | 57.9 | 59.4 | 54.5 | 63.9 | 65.8 | 61.1 | 70.5 | 59.9 | 52.4 | 66.6 | 50.7 | 44.6 | 57.3 | 45.7 | 44.4 | 48.1 |
| 2016 | 48.1 | 42.9 | 53.3 | 57.4 | 52.9 | 61.5 | 67.6 | 60.5 | 72.5 | 58.4 | 51.9 | 61.5 | 45.0 | 39.1 | 49.7 | 45.3 | 43.8 | 46.9 |
| 2017 | 53.7 | 46.8 | 66.8 | 56.0 | 50.0 | 61.9 | 63.9 | 55.4 | 68.9 | 55.2 | 51.3 | 58.4 | 53.6 | 45.9 | 65.6 | 45.2 | 37.4 | 51.0 |
| 2018 | 51.8 | 46.8 | 59.3 | 58.0 | 54.0 | 62.0 | 66.4 | 58.9 | 76.1 | 61.0 | 55.1 | 67.0 | 54.7 | 45.7 | 68.1 | 48.4 | 47.3 | 50.0 |
| 2019 | 49.2 | 45.8 | 52.3 | 51.9 | 49.5 | 54.9 | 58.5 | 52.3 | 67.8 | 59.0 | 53.6 | 66.1 | 46.6 | 42.8 | 51.4 | 46.6 | 44.3 | 48.0 |
| 2020 | 48.3 | 44.0 | 52.8 | 55.6 | 50.0 | 60.6 | 63.3 | 56.0 | 67.8 | 51.6 | 47.0 | 56.4 | 47.5 | 41.5 | 54.9 | 43.2 | 41.8 | 44.4 |
| 2021 | 53.8 | 46.9 | 59.7 | 59.1 | 53.9 | 63.8 | 64.9 | 59.4 | 70.4 | 58.6 | 53.4 | 62.3 | 50.5 | 43.4 | 62.1 | 44.6 | 41.1 | 47.0 |
| 2020 Standard | 62 | n/a | n/a | 62 | n/a | n/a | 62 | n/a | n/a | 62 | n/a | n/a | 62 | n/a | n/a | 62 | n/a | n/a |
| Annual trend | No trend | n/a | n/a | No trend | n/a | n/a | No trend | n/a | n/a | No trend | n/a | n/a | No trend | n/a | n/a | No trend | n/a | n/a |
How this indicator was calculated
Note: n/a = not applicable. The regional annual average peak O3 indicator is based on the annual 4th-highest of the daily maximum 8-hour average concentrations recorded at 18 monitoring stations in the Atlantic Canada region, 39 in the southern Quebec region, 40 in the southern Ontario region, 34 in the Prairies and northern Ontario region, 34 in British Columbia and 4 in the northern territories region. The comparison to the Canadian Ambient Air Quality Standard is provided for illustrative purposes only. A statistically significant trend is reported when the Mann-Kendall test indicates the presence of a trend at the 95 percent confidence level. For more information, consult the Methods section.
Source: Environment and Climate Change Canada (2025) National Air Pollution Surveillance (NAPS) Program - Open Government Portal and the Canadian Air and Precipitation Monitoring Network (CAPMoN).
In 2023, the southern Ontario region recorded the highest regional average peak O3 concentration at 66.2 parts per billion while the northern territories region recorded the lowest at 45.3 parts per billion.
Peak ground-level ozone concentrations at monitoring stations
The National Air Pollution Surveillance program measures air pollutant concentrations at monitoring stations across Canada. The Canadian Environmental Sustainability Indicators program provides access to this information through an interactive map. The map allows users to explore peak O3 concentrations at specific monitoring stations.
Key results
In 2023, annual average peak O3 concentrations were recorded at 214 monitoring stations across Canada:
- 85 stations had an annual average peak concentration above the 2020 standard of 62 parts per billion, mostly located in Ontario (34), Alberta (32) and Quebec (12)
- 12 stations recorded an annual average peak concentration below 45 parts per billion. Of these stations, 8 were in British Columbia and 1 station each in Northwest Territories, Manitoba, New Brunswick and Newfoundland and Labrador
Average peak ozone concentrations by monitoring station, Canada, 2023

Long description
The map of Canada shows the peak concentrations of ozone in 2023 by monitoring station. Stations are categorized by the concentration of ozone measured in the air. The categories are as follows: 0 to less than 45 parts per billion, 45 to less than 50 parts per billion, 50 to less than 55 parts per billion, 55 to 62 parts per billion and over 62 parts per billion.
Navigate data using the interactive map
How this indicator was calculated
Source: Environment and Climate Change Canada (2025) National Air Pollution Surveillance (NAPS) Program - Open Government Portal and the Canadian Air and Precipitation Monitoring Network (CAPMoN).
Nitrogen dioxide
Nitrogen dioxide
Nitrogen dioxide (NO2) belongs to a group of substances called nitrogen oxides (NOX). Nitrogen oxides are emitted into the atmosphere from high-temperature combustion processes such as those found in vehicle engines, power plants and industrial processes. The main sources of nitrogen oxide emissions in Canada are industry, (particularly oil and gas) and transportation, mainly off-road vehicles and mobile equipment. The majority of emitted NOX is nitrogen monoxide (NO); however, once in the atmosphere, NO reacts quickly with volatile organic compounds and ozone to form NO2. Exposure to NO2 can result in adverse health effects, such as lung irritation, decreased lung function, and increased susceptibility to allergens for people with asthma. Long-term exposure to NO2 may lead to the development of allergies and asthma.Footnote 5 NO2 also has adverse environmental impacts. It contributes to the formation of O3 and PM2.5 as well as acid deposition (acid rain) and eutrophicationFootnote 6 of aquatic ecosystems.
National annual average nitrogen dioxide concentrations
Key results
From 2009 to 2023,
- a decreasing trend was detected in the national average NO2 concentrations
- the national average concentrations remained below the 2020 standard of 17.0 parts per billion
National average nitrogen dioxide concentrations, Canada, 2009 to 2023

Data table for the long description
| Year | Average concentration (parts per billion) |
10th percentile (parts per billion) |
90th percentile (parts per billion) |
|---|---|---|---|
| 2009 | 9.3 | 3.8 | 14.9 |
| 2010 | 8.5 | 3.7 | 13.7 |
| 2011 | 8.1 | 2.9 | 13.5 |
| 2012 | 7.7 | 2.7 | 13.4 |
| 2013 | 7.7 | 3.1 | 12.9 |
| 2014 | 7.6 | 2.9 | 13.2 |
| 2015 | 7.3 | 2.7 | 12.2 |
| 2016 | 6.9 | 2.6 | 11.9 |
| 2017 | 7.0 | 2.6 | 12.7 |
| 2018 | 7.0 | 2.6 | 11.6 |
| 2019 | 6.9 | 2.6 | 11.5 |
| 2020 | 6.0 | 2.4 | 9.9 |
| 2021 | 6.1 | 2.2 | 10.1 |
| 2022 | 6.2 | 2.4 | 10.6 |
| 2023 | 6.1 | 2.3 | 10.2 |
| 2020 standard | 17.0 | n/a | n/a |
| Annual trend | -0.19 | n/a | n/a |
How this indicator was calculated
Note: n/a = not applicable. The national average NO2 concentration indicator is based on the annual average of the hourly concentrations recorded at 128 monitoring stations across Canada. The comparison to the Canadian Ambient Air Quality Standard is provided for illustrative purposes only. A statistically significant trend is reported when the Mann-Kendall test indicates the presence of a trend at the 95 percent confidence level. For more information, consult the Methods section.
Source:Environment and Climate Change Canada (2025) National Air Pollution Surveillance (NAPS) Program - Open Government Portal.
In 2023, the national average NO2 concentration was 6.1 parts per billion, which was the second lowest concentration since 2009.
From 2009 to 2023, the national average NO2 concentration did not exceed the 2020 standard of 17.0 parts per billion, and a decreasing trend was detected. The national average concentration decreased by 34.5 pourcent (3.2 parts per billion) between 2009 and 2023. This trend is mainly attributable to 2 factors:
- lower emissions from vehicles and engines following the adoption of new technologies and clean fuel for vehicles and the introduction of progressively more stringent emission regulations by the federal government
- lower emissions from fossil-fuel-fired (for example, coal-fired) power-generating utilities due to improved emission control technologies and the closures of some coal-fired power plants
Regional annual average nitrogen dioxide concentrations
Key results
- From 2009 to 2023, decreasing trends were detected for all regions
- Since 2009, regional average NO2 concentrations remained below the 2020 standard of 17.0 parts per billion in all regions
Regional average nitrogen dioxide concentrations, Canada, 2009 to 2023

Data table for the long description
| Year | Atlantic Canada | Southern Quebec | Southern Ontario | Prairies and northern Ontario | British Columbia | ||||||||||
|---|---|---|---|---|---|---|---|---|---|---|---|---|---|---|---|
| Average concentration (parts per billion) |
10th percentile (parts per billion) |
90th percentile (parts per billion) |
Average concentration (parts per billion) |
10th percentile (parts per billion) |
90th percentile (parts per billion) |
Average concentration (parts per billion) |
10th percentile (parts per billion) |
90th percentile (parts per billion) |
Average concentration (parts per billion) |
10th percentile (parts per billion) |
90th percentile (parts per billion) |
Average concentration (parts per billion) |
10th percentile (parts per billion) |
90th percentile (parts per billion) |
|
| 2009 | 3.6 | 1.0 | 5.1 | 10.9 | 4.4 | 18.4 | 10.0 | 5.6 | 14.9 | 7.8 | 2.8 | 13.4 | 11.2 | 6.6 | 15.5 |
| 2010 | 3.5 | 0.9 | 6.9 | 10.0 | 6.6 | 12.7 | 9.4 | 5.0 | 15.6 | 7.7 | 2.8 | 12.2 | 9.5 | 6.0 | 13.4 |
| 2011 | 3.3 | 1.7 | 5.9 | 11.3 | 7.4 | 17.5 | 9.2 | 4.3 | 15.2 | 6.9 | 2.8 | 11.6 | 9.1 | 5.1 | 13.3 |
| 2012 | 2.9 | 1.5 | 6.0 | 9.4 | 6.1 | 15.9 | 8.2 | 3.9 | 13.4 | 6.5 | 2.7 | 10.5 | 9.4 | 5.1 | 14.0 |
| 2013 | 3.6 | 1.5 | 6.0 | 9.3 | 6.3 | 15.6 | 8.2 | 4.4 | 12.9 | 6.8 | 2.4 | 11.3 | 9.1 | 5.3 | 14.1 |
| 2014 | 3.2 | 1.5 | 5.2 | 8.4 | 2.7 | 15.2 | 8.4 | 3.9 | 14.0 | 6.8 | 2.5 | 11.0 | 9.1 | 4.9 | 14.0 |
| 2015 | 3.0 | 1.4 | 5.0 | 7.8 | 5.3 | 10.4 | 8.2 | 4.4 | 12.9 | 6.0 | 2.1 | 9.7 | 9.4 | 5.5 | 13.8 |
| 2016 | 2.4 | 1.2 | 3.7 | 7.9 | 3.1 | 11.6 | 7.6 | 4.1 | 12.0 | 6.0 | 2.6 | 9.3 | 8.5 | 5.4 | 12.2 |
| 2017 | 2.8 | 0.9 | 6.9 | 7.9 | 2.7 | 11.6 | 7.3 | 4.3 | 11.5 | 5.9 | 2.2 | 9.8 | 9.2 | 4.9 | 14.1 |
| 2018 | 2.5 | 1.2 | 3.9 | 8.1 | 3.1 | 11.4 | 7.1 | 3.7 | 11.0 | 6.7 | 2.6 | 10.9 | 8.7 | 4.3 | 12.5 |
| 2019 | 2.6 | 1.2 | 3.6 | 7.5 | 3.1 | 11.2 | 7.2 | 3.5 | 11.3 | 6.4 | 2.2 | 10.4 | 8.6 | 4.5 | 12.6 |
| 2020 | 2.4 | 1.1 | 3.3 | 6.7 | 3.1 | 9.8 | 6.0 | 3.5 | 9.5 | 5.7 | 2.2 | 9.3 | 7.4 | 3.9 | 10.6 |
| 2021 | 2.2 | 1.0 | 3.5 | 6.5 | 2.8 | 9.7 | 6.3 | 3.3 | 10.0 | 5.8 | 2.1 | 9.0 | 7.7 | 4.2 | 10.8 |
| 2022 | 2.4 | 1.0 | 4.1 | 6.9 | 4.4 | 10.6 | 6.5 | 3.5 | 10.2 | 5.8 | 2.4 | 10.1 | 7.8 | 4.1 | 11.7 |
| 2023 | 2.3 | 1.0 | 4.1 | 6.3 | 2.3 | 9.2 | 5.9 | 3.1 | 9.9 | 6.4 | 2.5 | 11.1 | 7.3 | 4.0 | 11.1 |
| 2020 standard | 17.0 | n/a | n/a | 17.0 | n/a | n/a | 17.0 | n/a | n/a | 17.0 | n/a | n/a | 17.0 | n/a | n/a |
| Annual trend | -0.10 | n/a | n/a | -0.31 | n/a | n/a | -0.27 | n/a | n/a | -0.11 | n/a | n/a | -0.18 | n/a | n/a |
How this indicator was calculated
Note: n/a = not applicable. The regional annual average NO2 concentration indicator is based on the annual average of the hourly concentrations recorded at 12 monitoring stations in the Atlantic Canada region, 16 in the southern Quebec region, 32 in the southern Ontario region, 34 in the Prairies and northern Ontario region and 32 in British Columbia. There were not enough stations to report results for the northern territories region. The comparison to the Canadian Ambient Air Quality Standard is provided for illustrative purposes only. A statistically significant trend is reported when the Mann-Kendall test indicates the presence of a trend at the 95 percent confidence level. For more information, consult the Methods section.
Source: Environment and Climate Change Canada (2025) National Air Pollution Surveillance (NAPS) Program - Open Government Portal.
In 2023, British Columbia had the highest regional average NO2 concentration, at 7.3 parts per billion. The Prairies and northern Ontario, southern Quebec and southern Ontario regions followed with concentrations of 6.4 parts per billion, 6.3 parts per billion and 5.9 parts per billion, respectively. The lowest regional average concentration was recorded in the Atlantic Canada region, at 2.3 parts per billion.
Average nitrogen dioxide concentrations at monitoring stations
The National Air Pollution Surveillance program measures air pollutant concentrations at monitoring stations across Canada. The Canadian Environmental Sustainability Indicators program provides access to this information through an interactive map. The map allows users to explore average NO2 concentrations at specific monitoring stations.
Key results
In 2023, average NO2 concentrations were recorded at 171 monitoring stations across Canada:
- no stations had annual average concentrations above 17.0 parts per billion
- 51 stations had annual average concentrations below 4.0 parts per billion; notably in Alberta (13) and Ontario (9)
- no monitoring station data were available for Nunavut and the Northwest Territories
Average nitrogen dioxide concentrations by monitoring station, Canada, 2023

Long description
The map of Canada shows the average concentrations of nitrogen dioxide in 2023 by monitoring station. Stations are categorized by the concentration of nitrogen dioxide measured in the air. The categories are as follows: 0 to less than 4 parts per billion, 4 to less than 8 parts per billion, 8 to less than 12 parts per billion, 12 to 17 parts per billion and over 17 parts per billion.
Navigate data using the interactive map
How this indicator was calculated
Source: Environment and Climate Change Canada (2025) National Air Pollution Surveillance (NAPS) Program - Open Government Portal.
National annual average peak nitrogen dioxide concentrations
Key results
From 2009 to 2023,
- a decreasing trend was detected in the national average peak NO2 concentrations
- national average peak concentrations remained below the 2020 standard of 60 parts per billion
National average peak nitrogen dioxide concentrations, Canada, 2009 to 2023

Data table for the long description
| Year | Average peak (98th percentile) 1-hour concentration (parts per billion) |
10th percentile (parts per billion) |
90th percentile (parts per billion) |
|---|---|---|---|
| 2009 | 42.3 | 27.0 | 55.0 |
| 2010 | 39.2 | 25.1 | 53.0 |
| 2011 | 38.5 | 22.0 | 52.9 |
| 2012 | 35.5 | 22.4 | 47.0 |
| 2013 | 36.8 | 22.8 | 49.0 |
| 2014 | 38.1 | 23.6 | 51.5 |
| 2015 | 36.6 | 21.6 | 47.6 |
| 2016 | 34.3 | 22.4 | 46.4 |
| 2017 | 35.2 | 20.5 | 46.9 |
| 2018 | 36.2 | 22.0 | 47.1 |
| 2019 | 36.5 | 21.9 | 47.9 |
| 2020 | 32.8 | 20.9 | 43.8 |
| 2021 | 32.6 | 19.3 | 44.5 |
| 2022 | 33.7 | 19.6 | 46.8 |
| 2023 | 31.9 | 19.5 | 45.6 |
| 2020 standard | 60 | n/a | n/a |
| Annual trend | -0.55 | n/a | n/a |
How this indicator was calculated
Note: n/a = not applicable. The national average peak NO2 concentration indicator is based on the annual 98th percentile of the daily maximum 1-hour average concentrations recorded at 128 monitoring stations across Canada. The comparison to the Canadian Ambient Air Quality Standard is provided for illustrative purposes only. A statistically significant trend is reported when the Mann-Kendall test indicates the presence of a trend at the 95 percent confidence level. For more information, consult the Methods section.
Source: Environment and Climate Change Canada (2025) National Air Pollution Surveillance (NAPS) Program - Open Government Portal.
In 2023, the national average peak NO2 concentration was 31.9 parts per billion, the lowest concentration recorded in the last 15 years.
From 2009 to 2023, the national average peak NO2 concentration was below the 2020 standard of 60 parts per billion with a downward trend detected. This trend is mainly attributable to 2 factors:
- lower emissions from vehicles and engines following the adoption of new regulations and clean fuel for vehicles and the introduction of progressively more stringent emission regulations by the federal government
- lower emissions from fossil-fuel-fired (for example, coal-fired) power-generating utilities from improved emission control technologies and the closures of some coal-fired power plants
Regional annual average peak nitrogen dioxide concentrations
Key results
- From 2009 to 2023, decreasing trends were detected for all regions
- Since 2009, regional average peak NO2 concentrations have remained below the 2020 standard of 60 parts per billion in all regions
Regional average peak nitrogen dioxide concentrations, Canada, 2009 to 2023

Data table for the long description
| Year | Atlantic Canada | Southern Quebec | Southern Ontario | Prairies and northern Ontario | British Columbia | ||||||||||
|---|---|---|---|---|---|---|---|---|---|---|---|---|---|---|---|
| Average peak (98th percentile) 1-hour concentration (parts per billion) | 10th percentile (parts per billion) | 90th percentile (parts per billion) | Average peak (98th percentile) 1-hour concentration (parts per billion) | 10th percentile (parts per billion) | 90th percentile (parts per billion) | Average peak (98th percentile) 1-hour concentration (parts per billion) | 10th percentile (parts per billion) | 90th percentile (parts per billion) | Average peak (98th percentile) 1-hour concentration (parts per billion) | 10th percentile (parts per billion) | 90th percentile (parts per billion) | Average peak (98th percentile) 1-hour concentration (parts per billion) | 10th percentile (parts per billion) | 90th percentile (parts per billion) | |
| 2009 | 32.2 | 18.0 | 39.0 | 49.7 | 38.0 | 60.0 | 46.1 | 35.0 | 55.0 | 41.3 | 26.0 | 58.0 | 39.7 | 30.0 | 49.0 |
| 2010 | 28.9 | 15.0 | 42.5 | 44.3 | 41.0 | 47.0 | 43.2 | 31.0 | 56.0 | 40.3 | 25.0 | 55.0 | 34.8 | 26.2 | 41.0 |
| 2011 | 28.7 | 20.1 | 38.9 | 49.2 | 42.0 | 55.0 | 42.9 | 34.0 | 55.0 | 38.7 | 22.0 | 52.9 | 33.4 | 23.4 | 42.3 |
| 2012 | 23.7 | 10.0 | 39.0 | 41.5 | 33.0 | 48.0 | 37.2 | 26.0 | 47.0 | 36.1 | 22.4 | 47.0 | 34.8 | 23.6 | 43.5 |
| 2013 | 26.9 | 14.3 | 35.8 | 42.3 | 37.2 | 49.0 | 39.4 | 29.0 | 48.4 | 39.7 | 25.5 | 55.4 | 33.2 | 24.4 | 42.6 |
| 2014 | 27.0 | 15.0 | 38.5 | 41.8 | 26.6 | 53.7 | 43.4 | 36.0 | 55.5 | 38.5 | 23.8 | 55.8 | 34.8 | 24.4 | 46.2 |
| 2015 | 28.6 | 12.0 | 38.1 | 42.6 | 37.6 | 50.5 | 42.6 | 34.5 | 49.6 | 34.4 | 21.3 | 47.3 | 33.8 | 23.0 | 42.4 |
| 2016 | 22.6 | 11.9 | 29.6 | 40.5 | 27.9 | 47.3 | 37.6 | 26.8 | 48.5 | 34.1 | 22.4 | 46.9 | 32.9 | 22.8 | 41.7 |
| 2017 | 24.2 | 10.2 | 35.7 | 41.1 | 21.2 | 48.8 | 35.6 | 26.1 | 44.6 | 34.5 | 16.8 | 46.9 | 36.8 | 26.1 | 49.9 |
| 2018 | 26.2 | 13.0 | 37.7 | 41.6 | 27.1 | 48.7 | 37.7 | 29.0 | 45.3 | 37.2 | 19.7 | 51.3 | 35.2 | 25.2 | 45.0 |
| 2019 | 24.6 | 20.3 | 32.0 | 41.2 | 26.7 | 47.9 | 39.5 | 30.4 | 49.9 | 36.6 | 19.0 | 53.1 | 36.2 | 23.8 | 43.8 |
| 2020 | 25.6 | 14.8 | 33.2 | 39.0 | 24.6 | 46.3 | 33.4 | 22.4 | 40.9 | 34.4 | 17.0 | 49.5 | 30.5 | 22.2 | 38.7 |
| 2021 | 20.8 | 11.1 | 28.1 | 38.2 | 19.8 | 46.7 | 35.5 | 24.8 | 46.3 | 32.5 | 18.7 | 43.6 | 31.4 | 22.3 | 39.6 |
| 2022 | 23.6 | 13.3 | 33.4 | 38.4 | 33.3 | 44.3 | 36.6 | 23.4 | 47.6 | 34.9 | 17.6 | 52.7 | 31.7 | 22.6 | 40.7 |
| 2023 | 22.4 | 12.7 | 32.5 | 35.2 | 20.5 | 45.2 | 32.5 | 22.9 | 41.2 | 35.4 | 21.0 | 49.1 | 29.9 | 19.6 | 41.0 |
| 2020 standard | 60 | n/a | n/a | 60 | n/a | n/a | 60 | n/a | n/a | 60 | n/a | n/a | 60 | n/a | n/a |
| Annual trend | -0.51 | n/a | n/a | -0.63 | n/a | n/a | -0.74 | n/a | n/a | -0.45 | n/a | n/a | -0.33 | n/a | n/a |
How this indicator was calculated
Note: n/a = not applicable. The regional average peak NO2 concentration indicator is based on the annual 98th percentile of the daily maximum 1-hour average concentrations recorded at 12 monitoring stations in the Atlantic Canada region, 16 in the southern Quebec region, 32 in the southern Ontario region, 34 in the Prairies and northern Ontario region and 32 in British Columbia. There were not enough stations to report results for the northern territories region. The comparison to the Canadian Ambient Air Quality Standard is provided for illustrative purposes only. A statistically significant trend is reported when the Mann-Kendall test indicates the presence of a trend at the 95 percent confidence level. For more information, consult the Methods section.
Source: Environment and Climate Change Canada (2025) National Air Pollution Surveillance (NAPS) Program - Open Government Portal.
In 2023, 3 of the 5 regions recorded the lowest regional average peak NO2 concentrations of the last 15 years: the southern Quebec region, the southern Ontario region and British Columbia. The Prairies and northern Ontario and the southern Quebec regions had the highest regional average peak NO2 concentrations, at 35.4 parts per billion and 35.2 parts per billion, respectively, followed by the southern Ontario region with a concentration of 32.5 parts per billion and British Columbia with 29.9 parts per billion. The Atlantic Canada region had the lowest regional average peak concentration, with 22.4 parts per billion.
Peak nitrogen dioxide concentrations at monitoring stations
The National Air Pollution Surveillance program measures air pollutant concentrations at monitoring stations across Canada. The Canadian Environmental Sustainability Indicators program provides access to this information through an interactive map. The map allows users to explore peak NO2 concentrations at specific monitoring stations.
Key results
In 2023, peak NO2 concentrations were recorded at 171 monitoring stations across Canada. Of these:
- 1 station located in Alberta recorded an annual peak concentration above the 2020 standard of 60.0 parts per billion (70.3 parts per billion)
- 76 stations had annual peak concentrations below 30.0 parts per billion; most of them were in British Columbia (23), Alberta (16) and Ontario (12)
- no monitoring station data were available for Nunavut and the Northwest Territories
Peak nitrogen dioxide concentrations by monitoring station, Canada, 2023

Long description
The map of Canada shows the peak concentrations of nitrogen dioxide in 2023 by monitoring station. Stations are categorized by the concentration of nitrogen dioxide measured in the air. The categories are as follows: 0 to less than 30 parts per billion, 30 to less than 40 parts per billion, 40 to less than 50 parts per billion, 50 to 60 parts per billion and over 60 parts per billion.
Navigate data using the interactive map
How this indicator was calculated
Source: Environment and Climate Change Canada (2025) National Air Pollution Surveillance (NAPS) Program - Open Government Portal.
Sulphur dioxide
Sulphur dioxide
Sulphur dioxide (SO2) is emitted when a fuel or raw material containing sulphur is burned or used in industrial processes such as metal ore smelting. The main sources of sulphur dioxide emissions in Canada are the oil and gas industry, combustion of fossil fuels for electricity generation, and processes in the non-ferrous smelting and refining industry. Sulphur dioxide emissions contribute to acid deposition and are a major precursor to fine particulate matter. Exposure to high concentrations of SO2 can adversely affect the respiratory systems of humans and animals. Sulfur dioxide (SO2) exposure can irritate the lungs, reduce lung function, and increase susceptibility to allergens in people with asthma. It can also damage vegetation and contributes to the deterioration of building materials such as paint or concrete.
National annual average sulphur dioxide concentrations
Key results
- From 2009 to 2023,
- a decreasing trend was detected in the national average SO2 concentrations
- national average concentrations remained below the 2020 standard of 5.0 parts per billion
- In 2023, the national average SO2 concentration was the lowest in the last 15 years
National average sulphur dioxide concentrations, Canada, 2009 to 2023

Data table for the long description
| Year | Average concentration (parts per billion) |
10th percentile (parts per billion) |
90th percentile (parts per billion) |
|---|---|---|---|
| 2009 | 1.4 | 0.3 | 3.3 |
| 2010 | 1.3 | 0.3 | 2.9 |
| 2011 | 1.2 | 0.3 | 3.2 |
| 2012 | 1.2 | 0.2 | 2.4 |
| 2013 | 1.1 | 0.2 | 2.4 |
| 2014 | 1.0 | 0.2 | 2.4 |
| 2015 | 0.9 | 0.2 | 2.0 |
| 2016 | 0.9 | 0.1 | 1.8 |
| 2017 | 0.8 | 0.1 | 1.4 |
| 2018 | 0.8 | 0.2 | 1.4 |
| 2019 | 0.8 | 0.2 | 1.8 |
| 2020 | 0.7 | 0.1 | 1.7 |
| 2021 | 0.7 | 0.1 | 1.8 |
| 2022 | 0.7 | 0.1 | 1.4 |
| 2023 | 0.7 | 0.1 | 1.4 |
| 2020 standard | 5.0 | n/a | n/a |
| Annual trend | -0.05 | n/a | n/a |
How this indicator was calculated
Note: n/a = not applicable. The national average SO2 concentration indicator is based on the annual average of the hourly concentrations recorded at 88 monitoring stations across Canada. The comparison to the Canadian Ambient Air Quality Standard is provided for illustrative purposes only. A statistically significant trend is reported when the Mann-Kendall test indicates the presence of a trend at the 95 percent confidence level. For more information, consult the Methods section.
Source: Environment and Climate Change Canada (2025) National Air Pollution Surveillance (NAPS) Program - Open Government Portal.
In 2023, the national average SO2 concentration was 0.7 parts per billion, which was the lowest in 15 years and 4.2 percent lower than the 2022 level.
From 2009 to 2023, no exceedance of the 2020 standard was recorded in the national concentrations. A decreasing trend was also detected over this period. National concentrations decreased by 51.2 percent (0.7 parts per billion) between 2009 and 2023. This trend is mainly attributable to reductions in sulphur oxide emissions in Canada resulting from technological upgrades and closures of non-ferrous metal smelters (including aluminium smelters) and pulp and paper facilities, the phase-out of coal-fired electricity generation and transition to natural gas-fired electricity generation, better emission control technologies within the oil and gas sector, and the implementation of federal regulations related to sulphur content in fuels.
Regional annual average sulphur dioxide concentrations
Key results
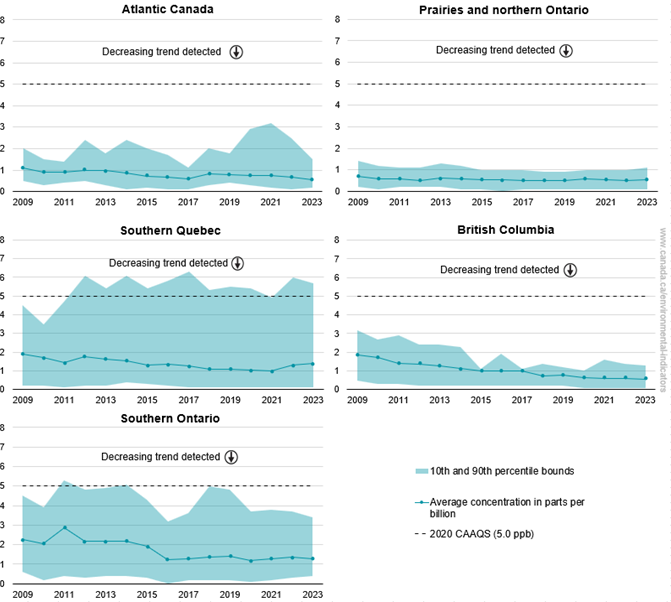
- From 2009 to 2023, decreasing trends were detected for all regions
- Since 2009, regional average SO2 concentrations remained below the 2020 standard of 5.0 parts per billion in all regions
Regional average sulphur dioxide concentrations, Canada, 2009 to 2023
Data table for the long description
| Year | Atlantic Canada | Southern Quebec | Southern Ontario | Prairies and northern Ontario | British Columbia | ||||||||||
|---|---|---|---|---|---|---|---|---|---|---|---|---|---|---|---|
| Average concentration (parts per billion) |
10th percentile (parts per billion) |
90th percentile (parts per billion) |
Average concentration (parts per billion) |
10th percentile (parts per billion) |
90th percentile (parts per billion) |
Average concentration (parts per billion) |
10th percentile (parts per billion) |
90th percentile (parts per billion) |
Average concentration (parts per billion) |
10th percentile (parts per billion) |
90th percentile (parts per billion) |
Average concentration (parts per billion) |
10th percentile (parts per billion) |
90th percentile (parts per billion) |
|
| 2009 | 1.1 | 0.5 | 2.0 | 1.9 | 0.2 | 4.5 | 2.3 | 0.6 | 4.5 | 0.7 | 0.2 | 1.4 | 1.9 | 0.5 | 3.2 |
| 2010 | 0.9 | 0.3 | 1.5 | 1.7 | 0.2 | 3.5 | 2.1 | 0.2 | 3.9 | 0.6 | 0.1 | 1.2 | 1.7 | 0.3 | 2.7 |
| 2011 | 0.9 | 0.4 | 1.4 | 1.4 | 0.1 | 4.7 | 2.9 | 0.4 | 5.3 | 0.6 | 0.2 | 1.1 | 1.4 | 0.3 | 2.9 |
| 2012 | 1.0 | 0.5 | 2.4 | 1.8 | 0.2 | 6.1 | 2.2 | 0.3 | 4.8 | 0.5 | 0.2 | 1.1 | 1.4 | 0.2 | 2.4 |
| 2013 | 1.0 | 0.3 | 1.8 | 1.6 | 0.2 | 5.4 | 2.2 | 0.4 | 4.9 | 0.6 | 0.2 | 1.3 | 1.3 | 0.2 | 2.4 |
| 2014 | 0.9 | 0.1 | 2.4 | 1.5 | 0.4 | 6.1 | 2.2 | 0.4 | 5.1 | 0.6 | 0.1 | 1.2 | 1.1 | 0.2 | 2.3 |
| 2015 | 0.7 | 0.2 | 2.0 | 1.3 | 0.3 | 5.4 | 1.9 | 0.3 | 4.3 | 0.5 | 0.1 | 1.0 | 1.0 | 0.2 | 1.1 |
| 2016 | 0.7 | 0.1 | 1.7 | 1.3 | 0.2 | 5.8 | 1.2 | 0.0 | 3.2 | 0.5 | 0.0 | 1.0 | 1.0 | 0.2 | 1.9 |
| 2017 | 0.6 | 0.1 | 1.1 | 1.3 | 0.1 | 6.3 | 1.3 | 0.2 | 3.6 | 0.5 | 0.1 | 1.0 | 1.0 | 0.2 | 1.1 |
| 2018 | 0.8 | 0.3 | 2.0 | 1.1 | 0.1 | 5.3 | 1.4 | 0.2 | 5.0 | 0.5 | 0.1 | 0.9 | 0.7 | 0.2 | 1.4 |
| 2019 | 0.8 | 0.4 | 1.8 | 1.1 | 0.1 | 5.5 | 1.4 | 0.2 | 4.8 | 0.5 | 0.1 | 0.9 | 0.8 | 0.2 | 1.2 |
| 2020 | 0.7 | 0.3 | 2.9 | 1.0 | 0.1 | 5.4 | 1.2 | 0.1 | 3.7 | 0.6 | 0.1 | 1.0 | 0.7 | 0.1 | 1.0 |
| 2021 | 0.7 | 0.2 | 3.2 | 1.0 | 0.1 | 4.9 | 1.3 | 0.2 | 3.8 | 0.5 | 0.1 | 1.0 | 0.6 | 0.1 | 1.6 |
| 2022 | 0.7 | 0.1 | 2.5 | 1.3 | 0.1 | 6.0 | 1.4 | 0.3 | 3.7 | 0.5 | 0.1 | 1.0 | 0.6 | 0.1 | 1.4 |
| 2023 | 0.5 | 0.2 | 1.5 | 1.4 | 0.1 | 5.7 | 1.3 | 0.4 | 3.4 | 0.5 | 0.1 | 1.1 | 0.6 | 0.1 | 1.3 |
| 2020 standard | 5.0 | n/a | n/a | 5.0 | n/a | n/a | 5.0 | n/a | n/a | 5.0 | n/a | n/a | 5.0 | n/a | n/a |
| Annual trend | -0.03 | n/a | n/a | -0.06 | n/a | n/a | -0.09 | n/a | n/a | -0.01 | n/a | n/a | -0.09 | n/a | n/a |
How this indicator was calculated
Note: n/a = not applicable. The regional annual average SO2 concentration indicator is based on the annual average of the hourly concentrations recorded at 10 monitoring stations in the Atlantic Canada region, 9 in the southern Quebec region, 10 in the southern Ontario region, 31 in the Prairies and northern Ontario region, 26 in British Columbia. There were not enough stations to report results for the northern territories region. The comparison to the Canadian Ambient Air Quality Standard is provided for illustrative purposes only. A statistically significant trend is reported when the Mann-Kendall test indicates the presence of a trend at the 95 percent confidence level. For more information, consult the Methods section.
Source: Environment and Climate Change Canada (2025) National Air Pollution Surveillance (NAPS) Program - Open Government Portal.
Regional average SO2 concentrations should not be compared between regions because concentrations are highly dependent on the locations of the monitoring stations within the region. Concentrations can also be affected by year-to-year changes in sampling, for example if certain stations are offline in a given year.Footnote 7
Average sulphur dioxide concentrations at monitoring stations
The National Air Pollution Surveillance program measures air pollutant concentrations at monitoring stations across Canada. The Canadian Environmental Sustainability Indicators program provides access to this information through an interactive map. The map allows users to explore annual average SO2 concentrations at specific monitoring stations.
Key results
In 2023, average SO2 concentrations were recorded at 121 monitoring stations across Canada. Of these:
- 1 station in Quebec recorded an annual average concentration above the 2020 standard of 5.0 parts per billion, at 5.7 parts per billion
- 67 stations had annual average concentrations below 0.5 parts per billion. Most of these stations were in British Columbia (23) and Alberta (20)
- no monitoring station data were available for Nunavut or Yukon
Average sulphur dioxide concentrations by monitoring station, Canada, 2023

Long description
The map of Canada shows the average concentrations of sulphur dioxide in 2023 by monitoring station. Stations are categorized by the concentration of sulphur dioxide measured in the air. The categories are as follows: 0 to less than 0.5 parts per billion, 0.5 to less than 1 parts per billion, 1 to less than 2 parts per billion, 2 to 5 parts per billion and over 5 parts per billion.
Navigate data using the interactive map
How this indicator was calculated
Source: Environment and Climate Change Canada (2025) National Air Pollution Surveillance (NAPS) Program - Open Government Portal.
National annual average peak sulphur dioxide concentrations
Key results
From 2009 to 2023,
- a decreasing trend was detected in the national average peak SO2 concentrations
- national average peak concentration remained below the 2020 standard of 70 parts per billion for all years
National average peak sulphur dioxide concentrations, Canada, 2009 to 2023

Data table for the long description
| Year | Average peak (99th percentile) 1-hour concentration (parts per billion) |
10th percentile (parts per billion) |
90th percentile (parts per billion) |
|---|---|---|---|
| 2009 | 36.5 | 5.0 | 86.0 |
| 2010 | 36.6 | 4.0 | 81.0 |
| 2011 | 28.7 | 5.0 | 69.6 |
| 2012 | 30.7 | 4.8 | 67.0 |
| 2013 | 30.0 | 4.0 | 71.0 |
| 2014 | 26.4 | 2.7 | 70.3 |
| 2015 | 24.7 | 2.9 | 65.7 |
| 2016 | 25.3 | 2.0 | 55.0 |
| 2017 | 24.7 | 2.3 | 64.0 |
| 2018 | 24.0 | 2.9 | 59.9 |
| 2019 | 21.6 | 3.0 | 62.3 |
| 2020 | 22.1 | 2.0 | 65.1 |
| 2021 | 22.2 | 1.5 | 69.5 |
| 2022 | 21.8 | 1.3 | 61.1 |
| 2023 | 22.5 | 1.2 | 51.4 |
| 2020 standard | 70 | n/a | n/a |
| Annual trend | -0.84 | n/a | n/a |
How this indicator was calculated
Note: n/a = not applicable. The national average peak SO2 concentration indicator is based on the annual 99th percentile of the daily maximum 1-hour average concentrations recorded at 88 monitoring stations across Canada. The comparison to the Canadian Ambient Air Quality Standard is provided for illustrative purposes only. A statistically significant trend is reported when the Mann-Kendall test indicates the presence of a trend at the 95 percent confidence level. For more information, consult the Methods section.
Source: Environment and Climate Change Canada (2025) National Air Pollution Surveillance (NAPS) Program - Open Government Portal.
In 2023, the national average peak SO2 concentration was 22.5 parts per billion, which is the fourth lowest peak concentration recorded over the past 15 years.
From 2009 to 2023, a decreasing trend was detected, with national concentrations falling by 38.1 percent (13.9 parts per billion). This trend is mainly attributable to reductions in sulphur oxide emissions in Canada and the United States due to technological upgrades and closures of non-ferrous metal smelters, the phase-out of coal-fired electricity, better emission control technologies within the oil and gas sector and the implementation of federal regulations related to sulphur content in fuels.
Regional annual average peak sulphur dioxide concentrations
Key results
From 2009 to 2023,
- decreasing trends were detected in average peak SO2 concentrations for all regions except the Prairies and northern Ontario
- regional average peak SO2 concentrations remained below the 2020 standard of 70 parts per billion in all regions
Regional average peak sulphur dioxide concentrations, Canada, 2009 to 2023

Data table for the long description
| Year | Atlantic Canada | Southern Quebec | Southern Ontario | Prairies and northern Ontario | British Columbia | ||||||||||
|---|---|---|---|---|---|---|---|---|---|---|---|---|---|---|---|
| Average peak (99th percentile) 1-hour concentration (parts per billion) |
10th percentile (parts per billion) |
90th percentile (parts per billion) |
Average peak (99th percentile) 1-hour concentration (parts per billion) |
10th percentile (parts per billion) |
90th percentile (parts per billion) |
Average peak (99th percentile) 1-hour concentration (parts per billion) |
10th percentile (parts per billion) |
90th percentile (parts per billion) |
Average peak (99th percentile) 1-hour concentration (parts per billion) |
10th percentile (parts per billion) |
90th percentile (parts per billion) |
Average peak (99th percentile) 1-hour concentration (parts per billion) |
10th percentile (parts per billion) |
90th percentile (parts per billion) |
|
| 2009 | 56.2 | 11.0 | 160.0 | 49.3 | 5.0 | 133.0 | 48.9 | 12.0 | 120.0 | 23.8 | 5.0 | 61.0 | 40.2 | 6.0 | 86.0 |
| 2010 | 39.0 | 3.4 | 119.1 | 70.5 | 4.0 | 218.0 | 49.7 | 4.0 | 103.0 | 23.5 | 4.0 | 53.0 | 36.0 | 3.8 | 78.9 |
| 2011 | 30.2 | 6.7 | 59.6 | 38.8 | 7.0 | 118.0 | 50.6 | 4.0 | 87.0 | 17.0 | 5.0 | 28.0 | 30.7 | 3.8 | 69.6 |
| 2012 | 30.2 | 4.4 | 61.0 | 46.6 | 6.0 | 121.0 | 50.2 | 5.0 | 105.0 | 19.2 | 2.2 | 56.0 | 32.0 | 5.0 | 71.1 |
| 2013 | 31.8 | 4.0 | 60.9 | 40.2 | 3.1 | 95.6 | 53.4 | 5.1 | 149.6 | 20.6 | 3.0 | 48.0 | 31.2 | 4.1 | 80.2 |
| 2014 | 34.5 | 2.2 | 70.3 | 36.5 | 4.4 | 111.8 | 54.5 | 6.2 | 168.1 | 17.2 | 2.0 | 36.0 | 22.0 | 4.4 | 77.3 |
| 2015 | 27.9 | 1.6 | 59.1 | 33.4 | 5.2 | 100.6 | 46.9 | 6.1 | 133.0 | 16.6 | 1.3 | 36.0 | 23.5 | 3.6 | 72.8 |
| 2016 | 28.1 | 1.6 | 66.6 | 35.5 | 5.2 | 102.0 | 40.5 | 5.4 | 165.6 | 21.5 | 1.2 | 55.0 | 21.4 | 3.1 | 43.3 |
| 2017 | 21.9 | 1.7 | 49.2 | 27.7 | 4.0 | 87.8 | 35.7 | 2.6 | 90.6 | 22.0 | 2.0 | 59.0 | 25.4 | 3.6 | 73.5 |
| 2018 | 33.2 | 5.8 | 67.0 | 30.3 | 2.4 | 93.0 | 36.8 | 2.3 | 106.3 | 19.0 | 3.0 | 38.0 | 21.3 | 3.0 | 59.9 |
| 2019 | 27.7 | 4.7 | 62.5 | 30.3 | 5.7 | 88.8 | 34.5 | 1.5 | 82.4 | 17.4 | 3.7 | 27.0 | 17.8 | 3.0 | 57.8 |
| 2020 | 26.9 | 2.3 | 63.0 | 29.9 | 4.9 | 100.1 | 29.5 | 2.2 | 72.6 | 20.3 | 3.1 | 64.0 | 18.5 | 1.9 | 32.6 |
| 2021 | 27.9 | 2.0 | 98.2 | 29.8 | 1.2 | 98.4 | 36.1 | 2.8 | 90.8 | 19.0 | 2.6 | 34.0 | 17.2 | 0.9 | 37.5 |
| 2022 | 29.3 | 1.0 | 72.7 | 34.7 | 4.0 | 94.9 | 33.0 | 1.5 | 79.1 | 19.7 | 2.0 | 54.0 | 15.0 | 1.0 | 39.5 |
| 2023 | 26.2 | 0.7 | 48.0 | 37.6 | 4.5 | 96.8 | 38.5 | 8.0 | 84.4 | 21.5 | 1.1 | 39.6 | 14.1 | 1.1 | 45.3 |
| 2020 standard | 70 | n/a | n/a | 70 | n/a | n/a | 70 | n/a | n/a | 70 | n/a | n/a | 70 | n/a | n/a |
| Annual trend | -0.64 | n/a | n/a | -1.18 | n/a | n/a | -1.54 | n/a | n/a | No trend | n/a | n/a | -1.69 | n/a | n/a |
How this indicator was calculated
Note: n/a = not applicable. The regional average peak SO2 concentration indicator is based on the annual 99th percentile of the daily maximum 1-hour average concentrations recorded at 10 monitoring stations in the Atlantic Canada region, 9 in the southern Quebec region, 10 in the southern Ontario region, 31 in the Prairies and northern Ontario region and 26 in British Columbia. There were not enough stations to report results for the northern territories region. The comparison to the Canadian Ambient Air Quality Standard is provided for illustrative purposes only. A statistically significant trend is reported when the Mann-Kendall test indicates the presence of a trend at the 95 percent confidence level. For more information, consult the Methods section.
Source: Environment and Climate Change Canada (2025) National Air Pollution Surveillance (NAPS) Program - Open Government Portal.
Regional peak SO2 concentrations should not be compared between regions because concentrations are highly dependent on the locations of the monitoring stations within the region. Concentrations can also be affected by year-to-year changes in sampling, for example if certain stations are offline in a given year.Footnote 7
Peak sulphur dioxide concentrations at monitoring stations
The National Air Pollution Surveillance program measures air pollutant concentrations at monitoring stations across Canada. The Canadian Environmental Sustainability Indicators program provides access to this information through an interactive map. The map allows users to explore peak SO2 concentrations at specific monitoring stations.
Key results
In 2023, peak SO2 concentrations were recorded at 122 monitoring stations across Canada:
- 7 stations recorded annual average peak concentrations above the 2020 standard of 70 parts per billion, ranging from 71.6 parts per billion to 198.7 parts per billion. Of these stations, 1 was in Alberta and 2 were located each in Quebec, Ontario and British Columbia
- 34 stations had annual average peak concentrations below 5 parts per billion. Of these, most were in British Columbia (15) and in the Prairies (11)
- no monitoring station data were available for Nunavut or Yukon
Peak sulphur dioxide concentrations by monitoring station, Canada, 2023

Long description
The map of Canada shows the peak concentrations of sulphur dioxide in 2023 by monitoring station. Stations are categorized by the concentration of sulphur dioxide measured in the air. The categories are as follows: 0 to less than 5 parts per billion, 5 to less than 15 parts per billion, 15 to less than 40 parts per billion, 40 to 70 parts per billion and over 70 parts per billion.
Navigate data using the interactive map
How this indicator was calculated
Source: Environment and Climate Change Canada (2025) National Air Pollution Surveillance (NAPS) Program - Open Government Portal.
Volatile organic compounds
Volatile organic compoundsFootnote 8
Volatile organic compounds (VOCs) are carbon-containing gases and vapours that are found in many common products such as gasoline and solvents. They are emitted from the oil and gas industry, solvent usage, and transportation (for example, exhaust emissions). Long-term exposure to some VOCs can cause cancer and other serious health problems. Short-term exposure to high levels of VOCs can result in fatigue, nausea, dizziness, headaches, breathing problems and irritation of the eyes, nose and throat. VOCs contribute to the formation of fine particulate matter and ground-level ozone, which are the main components of smog.
National annual average volatile organic compound concentrations
Key results
- From 2009 to 2023, a decreasing trend was detected in the national annual average VOC concentrations
- In 2023, the national average concentration was at its lowest level in the last 15 years
National average volatile organic compound concentrations, Canada, 2009 to 2023
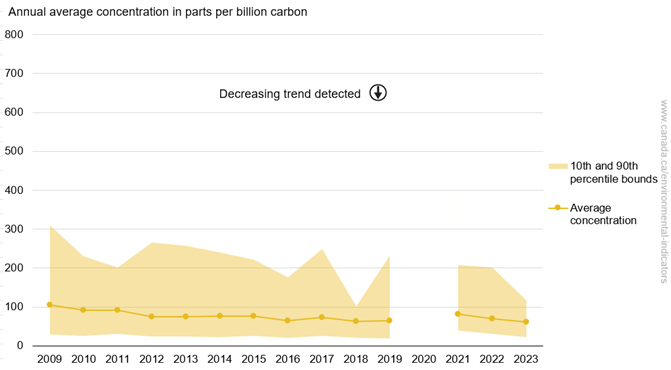
Data table for the long description
| Year | Average concentration (parts per billion carbon) |
10th percentile (parts per billion carbon) |
90th percentile (parts per billion carbon) |
|---|---|---|---|
| 2009 | 104.6 | 28.6 | 310.1 |
| 2010 | 92.2 | 25.1 | 231.0 |
| 2011 | 91.8 | 31.6 | 201.3 |
| 2012 | 74.8 | 23.5 | 266.3 |
| 2013 | 75.7 | 23.7 | 258.0 |
| 2014 | 77.0 | 23.1 | 241.0 |
| 2015 | 77.2 | 26.3 | 222.7 |
| 2016 | 64.3 | 20.9 | 176.1 |
| 2017 | 73.3 | 25.8 | 249.3 |
| 2018 | 63.5 | 21.3 | 102.1 |
| 2019 | 65.5 | 20.0 | 231.4 |
| 2020 | no data | no data | no data |
| 2021 | 81.5 | 40.0 | 207.8 |
| 2022 | 69.3 | 30.9 | 201.6 |
| 2023 | 62.0 | 22.3 | 116.4 |
| Annual trend | -1.99 | n/a | n/a |
How this indicator was calculated
Note: n/a = not applicable. The national annual average VOC concentration indicator is based on the annual average of the daily time-integrated concentrations (24-hour for urban stations and 4-hour for rural stations) recorded at 29 monitoring stations across Canada. VOC sampling in 2020 was limited and no station met the data completeness criteria for that year. During 2011, 2021 and 2022, VOC sampling was paused at several stations. For these years, the national average concentration is likely biased high compared to other years, as described in the Caveats and limitations section. No comparison with CAAQS is shown as there is no comparable VOC standard. A statistically significant trend is reported when the Mann-Kendall test indicates the presence of a trend at the 95 percent confidence level. For more information, consult the Methods section.
Source: Environment and Climate Change Canada (2025) National Air Pollution Surveillance (NAPS) Program - Open Government Portal.
In 2023, the national average VOC concentration was 62.0 parts per billion Carbon (parts per billion carbon), 10.6 percent (7.3 parts per billion carbon) lower than in 2022.
From 2009 to 2023, a decreasing trend was detected. This is consistent with the reduction in VOC emissions from cars and trucks, which is attributable to the introduction of new technologies, cleaner fuels and more stringent emissions standards and from the implementation of federal regulations related to the production and use of paints, solvents and cleaners.
Regional annual average volatile organic compound concentrations
Key results
- From 2009 to 2023, decreasing trends were detected in average VOC concentrations for the southern Quebec region and British Columbia
- In 2023, the regional average VOC concentration was 1 of the 3 lowest recorded over the last 15 years in all regions except British Columbia
Regional average volatile organic compound concentrations, Canada, 2009 to 2023
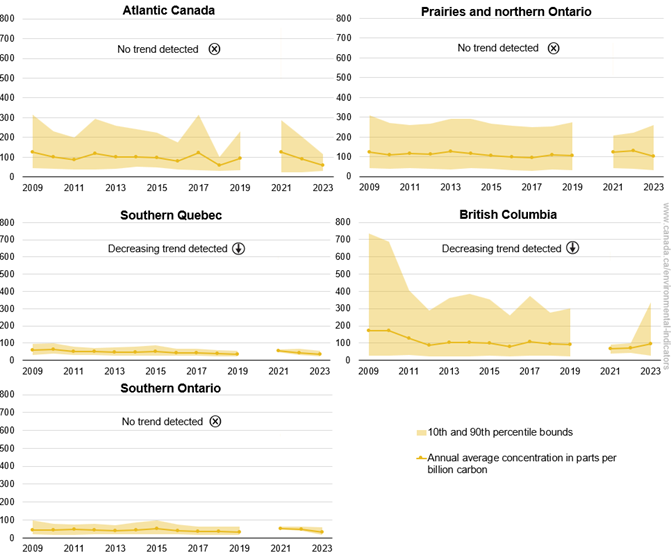
Data table for the long description
| Year | Atlantic Canada | Southern Quebec | Southern Ontario | Prairies and northern Ontario | British Columbia | ||||||||||
|---|---|---|---|---|---|---|---|---|---|---|---|---|---|---|---|
| Average concentration (parts per billion carbon) |
10th percentile (parts per billion carbon) |
90th percentile (parts per billion carbon) |
Average concentration (parts per billion carbon) |
10th percentile (parts per billion carbon) |
90th percentile (parts per billion carbon) |
Average concentration (parts per billion carbon) |
10th percentile (parts per billion carbon) |
90th percentile (parts per billion carbon) |
Average concentration (parts per billion carbon) |
10th percentile (parts per billion carbon) |
90th percentile (parts per billion carbon) |
Average concentration (parts per billion carbon) |
10th percentile (parts per billion carbon) |
90th percentile (parts per billion carbon) |
|
| 2009 | 127.6 | 46.8 | 314.9 | 59.1 | 32.8 | 94.4 | 45.2 | 18.9 | 97.0 | 125.4 | 42.0 | 310.1 | 171.56 | 28.6 | 736.1 |
| 2010 | 99.9 | 40.3 | 231.0 | 63.3 | 37.9 | 98.8 | 42.9 | 18.0 | 80.6 | 111.0 | 39.7 | 271.3 | 172.8 | 26.9 | 689.3 |
| 2011 | 85.8 | 38.0 | 201.3 | 52.5 | 31.6 | 77.5 | 46.2 | 17.4 | 75.0 | 115.0 | 42.5 | 260.4 | 128.4 | 29.7 | 405.3 |
| 2012 | 117.7 | 38.7 | 294.3 | 49.3 | 29.9 | 69.6 | 43.4 | 18.8 | 80.0 | 113.4 | 39.5 | 266.3 | 87.0 | 23.5 | 288.8 |
| 2013 | 100.1 | 41.1 | 258.0 | 47.1 | 27.6 | 73.6 | 41.4 | 19.4 | 71.4 | 127.0 | 37.3 | 290.5 | 104.3 | 23.7 | 361.3 |
| 2014 | 103.0 | 51.6 | 241.0 | 47.3 | 27.7 | 77.7 | 43.2 | 20.2 | 84.8 | 115.6 | 44.0 | 292.2 | 104.9 | 23.1 | 386.6 |
| 2015 | 97.8 | 47.4 | 222.7 | 49.8 | 28.2 | 89.4 | 51.4 | 20.2 | 96.8 | 107.9 | 38.1 | 268.9 | 100.8 | 26.3 | 353.6 |
| 2016 | 79.4 | 37.1 | 176.1 | 42.3 | 26.9 | 67.8 | 41.3 | 19.8 | 76.7 | 100.2 | 31.9 | 256.6 | 80.5 | 20.9 | 262.1 |
| 2017 | 121.8 | 34.4 | 315.0 | 42.6 | 25.8 | 68.9 | 34.6 | 16.8 | 62.8 | 96.6 | 30.0 | 249.3 | 108.8 | 26.2 | 371.4 |
| 2018 | 57.7 | 31.5 | 102.0 | 40.1 | 21.3 | 60.7 | 34.2 | 15.6 | 62.1 | 109.2 | 36.7 | 254.2 | 94.6 | 26.8 | 277.8 |
| 2019 | 94.1 | 36.4 | 231.4 | 36.0 | 23.4 | 53.7 | 31.6 | 15.5 | 63.9 | 105.0 | 32.1 | 275.6 | 91.2 | 23.6 | 301.8 |
| 2020 | no data | no data | no data | no data | no data | no data | no data | no data | no data | no data | no data | no data | no data | no data | no data |
| 2021 | 126.0 | 22.7 | 286.6 | 56.3 | 47.4 | 65.1 | 53.4 | 46.2 | 62.7 | 125.4 | 42.9 | 207.8 | 66.2 | 40.0 | 92.4 |
| 2022 | 90.1 | 23.2 | 201.6 | 43.7 | 30.9 | 66.4 | 47.6 | 38.7 | 61.4 | 129.9 | 39.0 | 220.8 | 70.6 | 42.3 | 98.9 |
| 2023 | 57.7 | 31.8 | 116.4 | 34.7 | 22.3 | 54.7 | 32.1 | 16.5 | 59.8 | 102.8 | 33.8 | 259.6 | 94.8 | 26.0 | 338.8 |
| Annual trend | No trend | n/a | n/a | -1.63 | n/a | n/a | No trend | n/a | n/a | No trend | n/a | n/a | -4.76 | n/a | n/a |
How this indicator was calculated
Note: n/a = not applicable. The regional annual average VOC concentration indicator is based on the annual average of the daily time-integrated concentrations (24-hour for urban stations and 4-hour for rural stations) recorded at 4 monitoring stations in the Atlantic Canada region, 5 in the southern Quebec region, 9 in the southern Ontario region, 4 in the Prairies and northern Ontario region and 7 in British Columbia. There were not enough stations to report results for the northern territories region. VOC sampling in 2020 was limited and no station met the data completeness criteria for that year. During 2011, 2021 and 2022, VOC sampling was paused at several stations. For these years, the regional average concentration is likely biased high compared to other years, as described in the Caveats and limitations section. No comparison with CAAQS is shown as there is no comparable VOC standard. A statistically significant trend is reported when the Mann-Kendall test indicates the presence of a trend at the 95 percent confidence level. For more information, consult the Methods section.
Source: Environment and Climate Change Canada (2025) National Air Pollution Surveillance (NAPS) Program - Open Government Portal.
Regional average VOC concentrations should not be compared between regions because concentrations are highly dependent on the locations of the monitoring stations within the region. Concentrations can also be affected by year-to-year changes in sampling, for example if certain stations are offline in a given year.Footnote 7
Average volatile organic compounds concentrations at monitoring stations
The National Air Pollution Surveillance program measures air pollutant concentrations at monitoring stations across Canada. The Canadian Environmental Sustainability Indicators program provides access to this information through an interactive map. The map allows users to explore average VOC concentrations at specific monitoring stations.
Key results
In 2023, annual average VOC concentrations were recorded at 36 monitoring stations across Canada:
- 4 stations recorded an annual average concentration above 100 parts per billion carbon, ranging from 116.4 parts per billion carbon to 338.8 parts per billion carbon. One (1) station was in each of New Brunswick and Alberta, and 2 stations were in British Columbia
- 3 stations had an annual average concentration below 20.0 parts per billion carbon. Two (2) were in Ontario and 1 was in British Columbia
- no monitoring data were available for Prince Edward Island, Yukon, Northwest Territories and Nunavut
Average volatile organic compounds concentrations by monitoring station, Canada, 2023

Long description
The map of Canada shows the average concentrations of volatile organic compounds in 2023 by monitoring station. Stations are categorized by the concentration of volatile organic compounds measured in the air. The categories are as follows: 0 to less than 20 parts per billion carbon, 20 to less than 40 parts per billion carbon, 40 to less than 60 parts per billion carbon, 60 to 100 parts per billion carbon and over 100 parts per billion carbon.
Navigate data using the interactive map
How this indicator was calculated
Source: Environment and Climate Change Canada (2025) National Air Pollution Surveillance (NAPS) Program - Open Government Portal.
About the indicators
About the indicators
What the indicators measure
The Air quality indicators track ambient concentrations of fine particulate matter (PM2.5), ground-level ozone (O3), sulphur dioxide (SO2), nitrogen dioxide (NO2) and volatile organic compounds (VOCs) at the national and regional levels and at local monitoring stations. The national and regional indicators are presented in comparison with their corresponding 2020 Canadian Ambient Air Quality Standards (CAAQS, the standards), where available. The comparisons to the standards are for illustrative purposes only.
Why these indicators are important
Canadians are exposed to air pollutants daily and this exposure can result in adverse health effects in the short and long term. Exposure to some pollutants, even at low levels, has been linked to increased health problems, leading to more hospitalizations, emergency room visits and premature deaths. The Government of Canada estimates that, in 2018, 47 premature deaths per 100,000 Canadians can be linked to air pollution for a total of 17,400 premature deaths annually. The total economic valuation of the health impacts attributable to air pollution in Canada in 2018 was $146 billion (based on 2020 currency).Footnote 9
Ground-level ozone (O3) and PM2.5 are widespread air pollutants that are key components of smog. Over time, exposure to O3 may lead to the development of asthma, reduced lung function and other lung conditions. Exposure to PM2.5 can lead to the onset or development of respiratory and cardiovascular adverse effects, such as asthma attacks, chronic bronchitis, heart attacks and may lead to the development of lung cancer.
Exposure to SO2 and NO2 can irritate the lungs, reduce lung function and aggravate respiratory conditions, especially in people with asthma. Long-term exposure to NO2 may contribute to allergies and asthma development.
Adverse health effects from exposure to VOCs varies greatly from little effects on health, to moderate effects such as eye, nose and throat irritations, headaches, nausea, dizziness and the worsening of asthma symptoms, to more severe effects such as damage to the liver, kidneys and central nervous system. Some VOCs meet the definition of toxic under the Canadian Environmental Protection Act, 1999. Over a lifetime, exposure to these pollutants can increase the risk of developing cancerFootnote 10 and other serious health effects.
Beside their direct effects on health, VOCs and NO2 contribute to the formation of O3 and PM2.5. NO2 has major impacts on acid deposition (sometimes called "acid rain") and eutrophication. Similarly, SO2 is a major contributor to acid deposition. PM2.5 can damage vegetation and structures and contributes to haze and reduced visibility. O3 can also impact vegetation by damaging leaves, decrease the productivity of some crops and may contribute to forest decline. O3 can damage synthetic materials and textiles, cause cracks in rubber, accelerate fading of dyes and speed deterioration of some paints and coatings.
Improved air quality can reduce the incidence of heart attacks, hospital visits, allergy and child asthma attacks and prevents lost school, workdays, and leisure time. Cleaner air can also reduce damage to crops, forests, surface waters and infrastructure such as buildings and bridges.Footnote 11
Related initiatives
These indicators support the measurement of progress towards the 2022 to 2026 Federal Sustainable Development Strategy Goal 11: Improve access to affordable housing, clean air, transportation, parks, and green spaces, as well as cultural heritage in Canada.
In addition, the indicators contribute to the Sustainable Development Goals of the 2030 Agenda for Sustainable Development. The indicators are linked to the 2030 Agenda's Goal 11: Sustainable Cities and Communities and Target 11.6: "By 2030, reduce the adverse per capita environmental impact of cities, including by paying special attention to air quality and municipal and other waste management."
Related indicators
The Population exposure to outdoor air pollutants indicator tracks the proportion of the population living in areas where outdoor concentrations of air pollutants are less than or equal to the 2020 Canadian Air Ambient Quality Standards.
The International comparison of urban air quality indicators present and compare the air quality in selected Canadian urban areas with a population greater than one million to the air quality in selected international urban areas having comparable data.
The Air pollutant emissions indicators track emissions from human activities of 6 key air pollutants: sulphur oxides (SOX), nitrogen oxides (NOX), volatile organic compounds (VOCs), ammonia (NH3), carbon monoxide (CO) and fine particulate matter (PM2.5). Black carbon, which is a component of PM2.5, is also reported. For each air pollutant, data are provided at the national, provincial/territorial and facility level and by major source.
The Air health trends indicator provides an overview of the public health impacts attributable to outdoor air pollution in Canada.
Data sources and methods
Data sources and methods
Data sources
The air quality indicators are calculated from the air pollutant concentrations in the Canada-wide Air Quality Database. The database is maintained by Environment and Climate Change Canada's National Air Pollution Surveillance Program. It contains data collected through the following monitoring networks:
- the National Air Pollution Surveillance Network (NAPS), a collaboration established in 1969 between Environment and Climate Change Canada (ECCC) and provincial, territorial and regional (Metro Vancouver, Ville de Montréal) governments
- the Canadian Air and Precipitation Monitoring Network (CAPMoN) operated by ECCC to supplement, for ground-level ozone data from NAPS. The Canadian Air and Precipitation Monitoring Network stations were established to research and monitor air pollution outside urban areas
More information
Air quality monitoring stations are located across the country but are more concentrated in urban areas and in Canada’s south. The indicators for PM2.5, O3, SO2, NO2 and VOCs are provided nationally and by region. The regions used for these indicators are listed and shown in the following table and map.
| Region | Region code |
|---|---|
| Atlantic Canada | ATL |
| Southern Quebec | SQC |
| Southern Ontario | SON |
| Prairies and northern Ontario | PNO |
| British Columbia | BCO |
| Northern territories | TER |
Long description
The map of Canada shows the 6 regions that are used for the regional Air quality indicators. The regions are, from east to west, Atlantic Canada, southern Quebec, southern Ontario, Prairies and northern Ontario, British Columbia, and Northern territories.
Ambient levels of PM2.5, O3, SO2, NO2 and VOCs measured by monitoring station are also shown in the Canadian Environmental Sustainability Indicators interactive indicator maps.
Data quality assurance and quality control for the National Air Pollutant Surveillance program
Monitoring agencies contributing to the National Air Pollution Surveillance program all strive to adhere to established quality assurance and quality control standards, which are developed by Environment and Climate Change Canada in consultation with the provincial, territorial, and regional governments participating in the program.
Ensuring data quality involves identifying the appropriate data quality objectives and methodologies that can be used to meet these objectives. The key data quality objectives for the National Air Pollution Surveillance program are:
- Representativeness: the degree to which data measurements represent a pollutant concentration of interest
- Comparability: the measure of confidence with which one data set or method can be compared to another at other participating National Air Pollutant Surveillance program sites across Canada
- Accuracy: the assessment of the overall agreement of a measurement with a known value (Table 2). Such assessment can include analysis of agreement among repeated measurements (precision) and measures of positive or negative systematic errors (bias)
- Completeness: the assessment as to whether enough information is being collected to ensure confidence in conclusions or decisions made based on data
| Parameter | Accuracy |
|---|---|
| Fine particulate matter | ± 15% |
| Ground-level ozone | ± 15% |
| Nitrogen dioxide | ± 15% |
| Sulphur dioxide | ± 15% |
| Volatile organic compounds | Species-dependent |
Routine assessments of network operations provide assurance that the monitoring systems and data processing procedures produce an acceptable level of data quality to meet National Air Pollution Surveillance guidelines and to identify areas where improvements may be required. Three (3) main streams of audits and assessment are used in the National Air Pollution Surveillance network:
- Performance and systems audits: conducted externally either by an ECCC auditor or by another agency separate from the monitoring agency. These audits are performed using independently verified reference standards and provide an unbiased quantitative assessment to defend the quality of the data
- Interagency measurement program involves analysis by the monitoring agency of an unknown sample concentration provided by ECCC. These tests help verify instrument accuracy and help determine data comparability across sites
- Data quality assessments: involve the statistical analysis of environmental data to determine if collected and reported data meet network and data quality objectives
Additional audits and assessments are performed by ECCC's air quality laboratories in Ottawa for the analysis of integrated VOC samples. Consult the National Air Pollution Surveillance Program: Ambient Air Monitoring and Quality Assurance/Quality Control Guidelines (PDF; 2.8 MB) for more information.
Methods
The Air quality indicators are calculated using air pollutant concentrations measured at monitoring sites and stored in the Canada-wide Air Quality Database. Specific calculations are performed for each pollutant to establish indicators for the assessment of air quality at the national and regional levels. Subsequent statistical analyses are conducted to determine the presence of a significant trend over a 15-year period for each national and regional air quality indicator.
More information
Note: Units: µg/m3 = micrograms per cubic metre, ppb = parts per billion, ppbC = parts per billion carbon.
Average indicators are used to capture prolonged or repeated exposures over longer periods or chronic exposure while peak indicators are used to capture immediate or acute short-term exposures.
Canadian Ambient Air Quality Standards
In October 2012, federal, provincial and territorial ministers of the environment, with the exception of Quebec,Footnote 12 agreed to begin implementing the Air Quality Management System. This system provides a collaborative, cross-Canada framework for action for reducing air pollution to further protect human health and the environment, including through continuous improvement of air quality. Under the system, the Canadian Ambient Air Quality Standards (CAAQS, the standards) are drivers for air quality improvements across the country. The CAAQS are health- and environment-based air quality objectives for pollutant concentrations in outdoor air. Underpinning by management levels requiring increasingly more stringent action the closer the concentration is to the level of the standard,Footnote 13 the CAAQS act as drivers for air quality improvements. The standards are not "pollute-up-to levels", and the Air Quality Management System encourages governments to take action to continuously improve air quality, considering that some pollutants can affect human health even at concentrations below the standards.
Under the Canadian Environmental Protection Act, 1999, the 2020 CAAQS were established in the first instance for:
- PM2.5 and O3 in May 2013
- SO2 in October 2017
- NO2 in December 2017
The standards have been updated, with 2020 standards in place for all 4 pollutants, and 2025 standards in place for SO2, NO2, and O3. PM2.5 standards are in place for 2030. The 2020 Canadian Ambient Air Quality StandardsFootnote 14 are presented in the table below. Calculation of the Air quality indicators mostly follows the same data-handling conventions as those used in calculating the concentrations to use for comparison to the standards. Formal comparison to the standards to determine if concentrations exceed a standard can only be done using ambient concentrations as measured at individual monitoring stations and not using national or regional average concentrations. As such, comparisons of the indicator values (such as the national and regional average concentrations) to the standards are provided for illustrative purposes only and not for assessing whether the standards are achieved. Indicator values that are below a standard do not imply that concentrations at individual monitoring stations are also below the standard. Furthermore, the indicators are not adjusted for exceptional events (such as wildfires) or for pollution from transboundary flows.
| Pollutant | Averaging time | 2020 Standard (numerical value) |
Statistical form |
|---|---|---|---|
| PM2.5 | Annual | 8.8 µg/m3 | The 3-year average of the annual average of the daily 24-hour average concentrations |
| PM2.5 | 24-hour | 27 µg/m3 | The 3-year average of the annual 98th percentile of the daily 24-hour average concentrations |
| O3 | 8-hour | 62 ppb | The 3-year average of the annual 4th-highest of the daily maximum 8-hour average concentrations |
| NO2 | Annual | 17.0 ppb | The arithmetic average over a single calendar year of all 1-hour average concentrations |
| NO2 | 1-hour | 60 ppb | The 3-year average of the annual 98th percentile of the daily maximum 1-hour average concentrations |
| SO2 | Annual | 5.0 ppb | The arithmetic average over a single calendar year of all 1-hour average concentrations |
| SO2 | 1-hour | 70 ppb | The 3-year average of the annual 99th percentile of the daily maximum 1-hour average concentrations |
Data collection and validation
Data obtained from National Air Pollution Surveillance monitoring stations are converted to a format compatible with the Canada-wide Air Quality Database. All data in the Canada-wide Air Quality Database have a comparable level of quality because jurisdictions adhere to established quality assurance and quality control procedures as outlined in the National Air Pollution Surveillance Monitoring and Quality Assurance/Quality Control Guidelines (PDF; 2.8 MB). These procedures include site and sampling system design, use of monitoring methods that meet defined minimum performance specifications, operation, maintenance and calibrations and data validation techniques. National Air Pollution Surveillance monitoring organizations are responsible for submitting quality-assured data, as per the specifications in the Guidelines, to the Canada-wide Air Quality Database. Data submitted to the National Air Pollution Surveillance database are in the hour-ending format (that is, minute data collected between 01:01 and 02:00 are averaged and reported as the 02:00 hour).
Data completeness criteria
The following criteria are used to determine which stations have sufficient hourly and daily measurements in each year to be considered valid for inclusion in the indicators.
Fine particulate matter (PM2.5)
For the annual average PM2.5 indicator:
- a daily 24-hour average concentration was considered valid if at least 75 percent (18 hours) of the 1 hour concentrations were available on a given day
- an annual average concentration was considered valid if at least 75 percent of the daily average concentrations were available for the year and at least 60 percent of the daily average concentrations were available in each quarterFootnote 15of a calendar year
For the peak (98th percentile) 24-hour PM2.5 indicator:
- a daily 24-hour average concentration was considered valid if at least 75 percent (18 hours) of the 1 hour concentrations were available on a given day
- a 98th percentile of the daily average concentration was considered valid if at least 75 percent of the daily average concentrations were available for the year and at least 60 percent of the daily average concentrations were available in each quarter of a calendar year
- a station was also included in the 98th percentile if the daily average concentration exceeded the 24 hour standard of 27 micrograms per cubic metre (µg/m3), and had at least 75 percent of the daily average concentrations available for the year
Ground-level ozone (O3)
For the annual average O3 indicator:
- rolling (or moving) 8-hour average concentrations were calculated for each hour of the day from the 1-hour average concentrations, resulting in up to 24 8-hour average concentrations per day. The 8-hour average concentrations are reported to the end hour.
- to be valid a rolling 8-hour average concentration must have at least 6 1-hour average concentrations
- a daily maximum 8-hour average concentration was considered valid if at least 75 percent (18) of the 8 hour rolling average concentrations were available in the day
- the annual maximum 8-hour average concentration was considered valid if at least 75 percent of all daily maximum 8-hour average concentrations were available for the period from April 1 to September 30
For the peak (4th-highest) 8-hour O3 indicator:
- rolling (or moving) 8-hour average concentrations were calculated for each hour of the day from the 1-hour average concentrations, resulting in up to 24 8-hour average concentrations per day. The 8-hour average concentrations are reported to the end hour
- to be valid a rolling 8-hour average concentration must have at least 6 1-hour average concentrations
- a daily maximum 8-hour average concentration was considered valid if at least 75 percent (18) of the 8-hour rolling average concentrations were available in the day or if the daily maximum 8-hour average concentration exceeded the 8-hour standard of 62 ppb
- the annual 4th-highest daily maximum 8-hour average concentration was considered valid if there were at least 75 percent of all daily maximum 8-hour average concentrations in the period from April 1 to September 30
- a station was also included if the annual 4th-highest daily maximum 8-hour average concentration exceeded the 8-hour standard of 62 parts per billion (ppb), even if the above data completeness criteria were not satisfied
Nitrogen dioxide (NO2)
For the annual average NO2 indicator:
- an annual average concentration was considered valid if at least 75 percentof all the 1-hour average concentrations were available for the year and at least 60 percent were available in each quarter
- a station was also included if the annual average concentration exceeded the annual standard of 17.0 ppb, and at least 50 percent of the NO2 1-hour values are available in each calendar quarter
For the peak (98th percentile) 1-hour NO2 indicator:
- the daily maximum 1-hour average concentration was considered valid if at least 75 percent (18) of the hourly concentrations were available on a given day or if the daily maximum 1-hour average concentration exceeded the 1-hour standard of 60 ppb
- the 98th percentile of the daily maximum 1-hour average concentrations was considered valid if at least 75 percent of the daily maximum 1-hour average concentrations for the year were available and at least 60 percent in each quarter were available
- a station was also included if it exceeded the 1-hour standard of 60 ppb, even if the above data completeness criteria were not satisfied
Sulphur dioxide (SO2)
For the annual average SO2 indicator:
- an annual average concentration was considered valid if at least 75 percent of all the 1-hour average concentrations were available for the year and at least 60 percent were available in each quarter
- a station was also included if the annual average concentration exceeded the annual standard of 5.0 ppb, and at least 50 percent of the SO2 1-hour values are available in each calendar quarter
For the peak (99th percentile) 1-hour SO2 indicator:
- the daily maximum 1-hour average concentration was considered valid if at least 75 percent (18 hours) of the hourly concentrations were available on a given day or if the daily maximum 1-hour average concentration exceeded the 1-hour standard of 70 ppb
- the annual 99th percentile of the daily maximum 1-hour average concentrations was considered valid if at least 75 percent of all the daily maximum 1-hour average concentrations for the year were available and at least 60 percent in each quarter were available
- a station was also included if it exceeded the 1-hour standard of 70 ppb, even if the above data completeness criteria were not satisfied
Volatile organic compounds (VOCs)
There are fewer data available for VOCs and therefore the data completeness criteria for this indicator are different. At urban monitoring stations, VOC samples are usually collected over a 24-hour period once every 6 days; conversely at rural stations, samples are collected over a 4-hour sampling period (12:00 to 16:00) once every 3 days.Footnote 16
For the annual average VOC indicator:
- a daily total VOC concentration was considered valid if the sample was collected over a consecutive period of 24 hours (± 1 hour) at an urban station or a consecutive 4 hours (± 0.5 hours) at a rural station and if valid concentration measurements were available for ethane, ethylene, acetylene, and at least one of benzene, ethylbenzene, toluene, m and p-xylene, and o‑xylene.
- a quarter (3 months) was considered valid if had at least 5 valid daily total VOC concentrations
- a station was only included if there were 3 valid quarters in the year
After the data completeness criteria have been met, the pollutant concentrations are calculated for the selected stations.
Pollutant-specific calculations
Fine particulate matter
Fine particulate matter concentrations are expressed in micrograms per cubic metre (µg/m3). The PM2.5 average and peak (98th percentile) 24-hour indicators are based on the 24-hour daily average concentrations (daily average) for the whole year. The daily average value for PM2.5 is measured from midnight to midnight.
For a given station, the average indicator is calculated by summing all valid daily averages and dividing by the number of valid days. The peak (98th percentile) 24-hour indicator is obtained by determining the 98th percentile value of all 24-hour daily values for a given year. The 98th percentile value corresponds to the concentration for which 98 percent of all the daily 24-hour values are less than or equal to it and 2 percent are greater than or equal to it. For example, the 98th percentile value of 25 micrograms per cubic metre at a given station means that 98 percent of all daily 24-hour average concentrations are less than or equal to 25 micrograms per cubic metre and only 2 percent are greater than or equal to 25 micrograms per cubic metre. In a year with a complete dataset, the 98th percentile corresponds to the 8th highest value. The following table provides the rank of the 98th percentile value based on the number of available daily measurements.Footnote 17
| Number of available daily measurements in a year | 98th percentile rank |
|---|---|
| 274 to 300 | 6th highest |
| 301 to 350 | 7th highest |
| 351 to 366 | 8th highest |
The regional and national indicators (average and peak [98th percentile] 24-hour) for PM2.5 are calculated by averaging the station-level annual average and station-level annual peak values for all stations that met the completeness criteria within either the region or Canada as a whole.
Ground-level ozone
Ozone concentrations are expressed in parts per billion (ppb). There are 24 consecutive 8 hour average concentrations (8 hour rolls) that can possibly be calculated for each day. The highest value of the 24 8‑hour average concentrations per day is the daily maximum. An illustration of the calculation running 8‑hour average concentrations and the selection of the daily maximum is provided in the figure below.
Calculation of the ground-level ozone daily maximum 8-hour average concentration
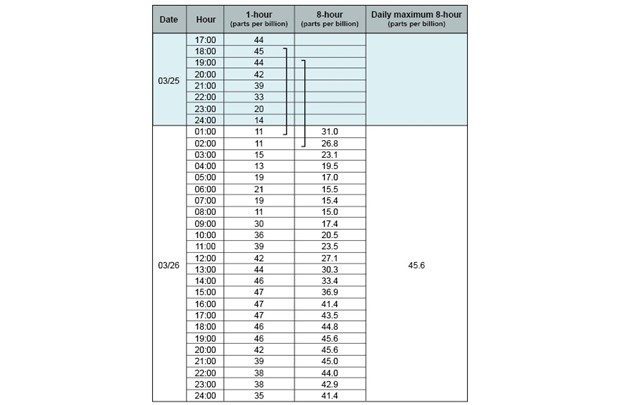
Long description
For each station, the average O3 indicator is calculated by taking the average of the daily maximum 8 hour (ending) averages for the period from January 1 to December 31. The regional and national averages for O3 are obtained by averaging the station-level annual averages for selected stations within the region or Canada as a whole.
For each station, the peak (4th-highest) 8-hour O3 indicator is based on the 4th-highest of the daily maximum 8-hour average concentrations measured over a given year. All of the daily maximum 8-hour average concentrations are ordered in an array from highest to lowest, with equal values repeated as often as they occur. Each value is assigned a rank. For a given year, the 4th-highest ranking value in the array is identified as the annual peak (4th-highest) 8-hour O3 concentration for that station.
The regional and national average peak O3 indicators are obtained by averaging all 4th-highest values from all stations that met the completeness criteria within either the region or Canada as a whole.
Nitrogen dioxide
Nitrogen dioxide concentrations are expressed in parts per billion (ppb). The NO2 average indicator is based on the annual average of all 1-hour concentrations while the peak (98th percentile) 1-hour indicator is based on the annual 98th percentile of the daily maximum 1-hour average concentrations. The daily maximum 1-hour average value for NO2 is measured from midnight to midnight.
For a given station, the average indicator is calculated by summing all valid 1-hour averages and dividing by the number of total hours. The peak (98th percentile) 1-hour indicator is obtained by determining the 98th percentile value of all daily maximum 1-hour average for a given year. The 98th percentile value corresponds to the concentration for which 98 percent of all the daily maximum values are less than or equal to it and 2 percent is greater than or equal to it. For example, the 98th percentile value of 25 ppb at a given station means that 98 percent of all daily maximum 1-hour average concentrations are less than or equal to 25 ppb and only 2 percent are greater than or equal to 25 ppb.
The national and regional indicators (average and peak [98th percentile] 1-hour) for NO2 are calculated by averaging the station-level annual average and station-level annual peak values for all stations that met the completeness criteria within either the region or Canada as a whole.
Sulphur dioxide
Sulphur dioxide concentrations are expressed in parts per billion (ppb). The SO2 average indicator is based on the annual average of the 1-hour concentrations, while the peak (99th percentile) 1-hour indicator is based on the annual 99th percentile of the daily maximum 1-hour average concentrations. The daily maximum 1-hour average value for SO2 is measured from midnight to midnight.
For a given station, the average indicator is calculated by summing all valid 1-hour averages and dividing by the number of total hours. The peak (99th percentile) 1-hour indicator is obtained by determining the 99th percentile value of all daily maximum 1-hour concentrations for a given year. The 99th percentile value corresponds to the concentration for which 99 percent of all the daily maximum 1-hour concentrations are less than or equal to and 1 percent are greater than or equal to it. For example, the 99th percentile value of 65 ppb at a given station means that 99 percent of all daily maximum 1-hour average concentrations are less than or equal to 65 ppb and only 1 percent are greater than or equal to 65 ppb. In a year with a complete dataset, the 99th percentile corresponds to the 4th highest value. The following table provides the rank of the 99th percentile value based on the number of available daily measurements.
| Number of available daily measurements in a year | 99th percentile rank |
|---|---|
| 274 to 300 | 3rd highest |
| 301 to 366 | 4th highest |
The national and regional indicators (average and peak [99th percentile] 1-hour) for SO2 are calculated by averaging the station-level annual average and station-level annual peak values for all stations that met the completeness criteria within the region or throughout Canada.
Volatile organic compounds
Volatile organic compounds are reported as a daily sum of individual compounds. The number of compounds included in the reported sum may slightly vary subject to the analytical validity of the individual compound concentrations. Urban VOC station indicators are calculated from the average of daily total VOC concentrations (24-hour time-integrated concentrations) while rural VOC station indicators are calculated from the average of daily 4-hour total VOC concentrations (time-integrated samples collected from 12:00 to 16:00). The daily 24-hour average concentrations are based on measurements taken from midnight to midnight. As presented in the Data completeness criteria, a daily average concentration was only considered valid if measurements for certain compounds were available. For a station, the average indicator is calculated by taking the average of the daily total concentrations for a given year.
The national and regional indicators for VOCs are obtained by averaging the station-level annual averages from all stations that met the completeness criteria within the region and throughout Canada.
While the concentration unit for individual VOCs is usually expressed as micrograms per cubic metre (µg/m3), parts per billion carbon (ppbC) are used in this indicator to assess the quantity of mixed VOC species.
Station selection criteria for inclusion in national and regional indicators (time‑series)
Station-level indicators were calculated for the years 2009 to 2023 for all air pollutants. Each station was then assessed for its suitability (sufficient data, no large gaps at the beginning or end) for inclusion in the national and regional time series. The specific criteria are as follows:
- for the national and regional time series, a station is included if it satisfies the data completeness criteria for at least 11 of the 15 years. Due to a significant gap in VOC data between 2020 and 2022, a station is required to satisfy the data completeness for at least 10 years to be considered in the VOC concentration indicator
- stations are included if data are available for at least 1 of 3 years at the beginning and at the end of the time series, this measure avoids the use of data from stations that were commissioned or decommissioned at the beginning or end of the time series.
In addition to the time series selection criteria, a minimum of 3 monitoring stations is required to calculate the indicator for a region.
Station selection results
The following table indicates the number of monitoring stations that satisfied the selection criteria (data completeness and time series)over the period from 2009 to 2023 and were thus included in the time series for the national and regional Air quality indicators. Further details are available in a list of selected stations.
| Air pollutant indicator | Canada | Atlantic Canada | Southern Quebec | Southern Ontario | Prairies and northern Ontario | British Columbia | Northern territories |
|---|---|---|---|---|---|---|---|
| Average PM2.5 | 161 | 16 | 35 | 37 | 35 | 35 | 3 |
| Average peak (98th percentile) 24-hour PM2.5 | 161 | 16 | 35 | 37 | 35 | 35 | 3 |
| Average O3 | 169 | 18 | 39 | 40 | 34 | 34 | 4 |
| Average peak (4th-highest) 8-hour O3 | 169 | 18 | 39 | 40 | 34 | 34 | 4 |
| Average NO2 | 128 | 12 | 16 | 32 | 34 | 32 | 0 |
| Average peak (98th percentile) 1-hour NO2 | 128 | 12 | 16 | 32 | 34 | 32 | 0 |
| Average SO2 | 88 | 10 | 9 | 10 | 31 | 26 | 0 |
| Average peak (98th percentile) 1-hour SO2 | 88 | 10 | 9 | 10 | 31 | 26 | 0 |
| Average VOCs | 29 | 4 | 5 | 9 | 4 | 7 | 0 |
Note: The sum of the regional stations may not match the national station numbers because a minimum of 3 monitoring stations is required to calculate the indicator for a region. Where there were not enough stations in the northern territories region, results from stations located in this region were only included in the national totals.
Local (station-level) indicators for O3, PM2.5, NO2, and SO2 are also presented in the Canadian Environmental Sustainability Indicators interactive maps. Stations that meet the data completeness criteria for the year 2023 may not meet the data completeness criteria for the 15-year national and regional indicators. Likewise, stations that meet the 15-year national and regional indicator data completeness criteria, may not meet the data completeness criteria for 2023 alone. As such, stations displayed on the map satisfy annual data completeness criteria for the year 2023, but this does not imply that data from these stations were used to calculate 15-year national or regional indicators.
Imputation
Stations that do not have enough measurements to meet the 15-year time series criteria are excluded from the national and regional indicators. However, when one monitoring station closes and a comparable monitoring station opens nearby, the data from the 2 stations may be combined to meet the 15-year criteria. When this is done, the 2 stations are counted as one.
Monitoring equipment
Fine particulate matter monitoring equipment
Six (6) types of monitoring equipment were used to monitor ambient PM2.5 concentrations under the categories ofFootnote 18 :
PM2.5 Pre-Federal Equivalency Method (FEM) and Non-Federal Equivalency Method Instruments:
- Non-FEM: Rupprecht & Patashnick tapered element oscillating microbalance (TEOM) monitor or TEOM® Series 1400/1400a with sample equilibrium system (SES) monitor
OR
PM2.5 Designated Federal Equivalency Method (FEM) Instruments:
- FEM: Thermo Scientific TEOM 1400a with the Series 8500C Filter Dynamics Measurement System (FDMS) monitor (prior to mid-2009 this method was designated as a pre-FEM)
- FEM: Met One BAM-1020 Beta Attenuation Mass monitor
- FEM: Thermo Scientific 5030 or 5030i SHARP (Synchronized Hybrid Ambient Realtime Particulate) monitor (introduced as an FEM in 2010)
- FEM: GRIMM Environmental Dust Monitor model EDM 180 (introduced as an FEM in 2011)
- FEM: Teledyne Advanced Pollution Instrumentation Model T640 PM mass monitor with or without network data alignment enabledFootnote 19 (introduced as an FEM in 2016)
The Thermo Scientific TEOM 1400a with 8500C FDMS, Met One BAM-1020, Thermo Scientific SHARP, GRIMM 180and Teledyne T640monitors have been approved by the United States Environmental Protection Agency as Class III Federal Equivalent Methods and have been deployed across the National Air Pollution Surveillance network replacing non-FEM tapered element oscillating microbalance instruments, which in some circumstances may under report the PM2.5 mass concentrations relative to the National Air Pollution Surveillance PM2.5 Reference Method. Since 2005, the tapered element oscillating microbalance monitors have gradually been replaced by the federal equivalent methods monitors. The FEM monitors measure a portion (semi-volatile) of the PM2.5 mass not captured by the older instruments. Because of these measurement differences between the new and the old monitoring equipment, concentrations measured with the new monitors may not be directly comparable with the measurements from years in which older instruments were used.
Ground-level ozone monitoring equipment
Ozone measurements are made using ultraviolet photometry. Sample air passes through a beam of light from an ultraviolet lamp, which is absorbed by O3. The amount of ultraviolet light absorbed is proportional to the amount of O3 in the sample.
Nitrogen dioxide monitoring equipment
Nitrogen dioxide is calculated by subtraction following the measurement of total of nitrogen oxides (NOX) and nitrogen monoxide (NO). Nitrogen monoxide (NO) concentrations are determined photometrically by measuring the light intensity from the chemiluminescent reaction of NO mixed with excess O3. The chemiluminescence method detects only NO, therefore, NO2 must first be converted to NO for measurement purposes. Sample flow is either directed through a converter to reduce NO2 to NO, or it bypasses the converter to allow detection of only NO. The sample stream with reduced NO2 is a measurement of NO plus NO2, which is expressed as NOX (that is, NOX = NO2 + NO). The difference between NOX and NO detection is taken as the NO2 concentration (that is, NO2 = NOX - NO).
Sulphur dioxide monitoring equipment
Sulphur dioxide measurements are made using pulse-fluorescence ultraviolet adsorption instruments. This technology is based on the principle that SO2 molecules absorb ultraviolet light at one wavelength and emit ultraviolet light at a different wavelength. The intensity of the emitted light is proportional to the number of SO2 molecules in the sample gas.
Volatile organic compound monitoring equipment
A combined gas chromatography-flame ionization detector system is used for quantification of VOCs containing 2 carbons, while a combined gas chromatography-mass selective detector system operating in selected ion monitoring mode is used for quantification of VOCs containing 3 to 12 carbons. Approximately 120 VOCs (including a number of biogenic species such as isoprene and pinenes) are targeted for quantification in the samples, but not all VOCs are detectable in each sample. The total concentration of VOCs in parts per billion carbon is calculated from the total mass of 77 of these species when detectable in the sample. Air samples are collected in either 6-litre or 3.2-litre stainless steel canisters. The canisters are then shipped to the Environment and Climate Change Canada analysis laboratory in Ottawa.
Statistical analysis
Non-parametric statistical tests were carried out on temporal concentration data to detect the presence of a linear trend and, if present, to determine the orientation (positive or negative) and magnitude of the rate of change (slope). The standard Mann-Kendall trend test was used to detect trend presence and orientation, while the Sen's pairwise slope method was used to estimate the slope. Both tests were applied to the national and regional data for PM2.5, O3, NO2, SO2 and VOCs.
The Mann-Kendall trend test considers the full time series of concentration data when assessing the presence of a trend, which is why sometimes it concludes that no significant trend is present despite a large concentration increasing during the final year of the timeseries.
Percentile bounds
A percentile is a statistical measure used to indicate the value below which a percentage of the data falls. For example, the 10th percentile is the value below which 10 percent of the data may be found. Likewise, the 90th percentile is the value below which 90 percent of the data may be found.
A percentile range is the difference between 2 determined percentiles. The 10th to 90th percentile range is the most common and is referred to as the 10th to 90th percentile bounds in the Air quality indicators. If sufficient data values are available, the bounds capture 80 percent of the data. When few data values are available, the calculated percentile range may vary greatly from one year to the next or may not be visible for a given year. This can be observed in the results for the northern territories region or for some regions in the regional VOC indicator.
Recent changes
The stations used to calculate the indicators vary slightly between different iterations of the indicators. For more information, consult the caveats and limitations section below. Some air quality data of previous years were reassessed and corrected since the previous publication. This version of the Air quality indicator no longer includes urban area indicators related to the most important population centers. These indicators will be reported as an independent indicator.
Caveats and limitations
In 2020, no monitoring station met the data completeness criteria for volatile organic compound (VOC) concentrations. Therefore, the analysis for this pollutant and its trend doesn't include 2020 data.
Data values presented in the Air quality indicators may differ from values calculated using the data presented in the data table due to rounding.
Some data collected at stations cannot be used in calculating the indicators because the data do not meet the data completeness criteria, or because the stations do not meet the station selection criteria. These criteria are based on standard practices supported by expert opinion and are used by a number of organizations, such as the World Health Organization, the Canadian Council of Ministers of the Environment and the United States Environmental Protection Agency. The criteria allow for some gaps in data.
More information
Revisions to station selections
Monitoring stations are selected based on the 15-year time series criteria for the calculation of the Air quality indicators. As this is a rolling 15-year time period, the number of stations selected may vary from 1 iteration of the indicators to the next and may change the historical trends. Caution should be exercised when comparing different iterations of the Air quality indicators.
Year-to-year bias due to data gaps
The group of monitoring stations that are used in the calculation of the national and regional indicators may vary from year-to-year if some stations do not meet the minimum data requirements for a given year. This introduces bias in the annual values. For example, if a station in an especially polluted area has no station-level value for 2023, then the national indicator value and the relevant regional values for 2023 will be biased low relative to the other years in the 15-year period. This is because the values for all other years are pulled upward by the high concentrations recorded at the station in the polluted area, while the value for 2023 is not influenced by the station in the polluted area. The bias caused by missing a station-level value from a single station is usually negligible, due to the large number of stations that factor into the calculation of the national and regional indicators. However, if a value is missing from a station that typically records extremely high concentrations, if values are missing from many stations, or if the number of stations factoring into the calculation of the national or regional indicators is small, then the bias may be large. In cases with larger biases, year-to-year fluctuations in the indicators do not necessarily represent real changes in air quality.
Regional indicators for the northern territories are especially susceptible to year-to-year bias, due to the small number of stations that contribute to the calculation of these indicators. The indicators for SO2 and VOCs are also highly susceptible to year-to-year bias, due to the moderate number of stations that contribute to these indicators and the high local variability of SO2 and VOC concentrations. For the SO2 and VOC indicators, the bias due to data gaps was estimated for each year by comparing the actual annual concentration to the expected annual concentration if data gaps were not present. The expected annual concentration was calculated by filling in gaps in the station-level concentrations with estimated values, based on a Sen’s slope fit to each station’s concentrations from other years. Cases where the bias was estimated to be large (≥ +15 percent or ≤ –15 percent) are noted in the text below.
For the regional average SO2 indicator, the following annual concentrations are likely biased relative to other annual concentrations:
- the 2017 average SO2 concentration for Atlantic Canada is estimated to be biased low by 20 percent due to missing data from a station that typically records high average SO2 concentrations
- the 2022 and 2023 average SO2 concentrations for southern Quebec are estimated to be biased high by 27 percent and 46 percent, respectively, due to missing data from multiple stations that typically record low average SO2 concentrations
- the 2023 average SO2 concentration for southern Ontario is estimated to be biased high by 23 percent due to missing data from multiple stations that typically record low average SO2 concentrations
For the regional peak SO2 indicator, the following annual concentrations are likely biased relative to other annual peak concentrations:
- the 2009 peak SO2 concentration for Atlantic Canada is estimated to be biased high by 21 percent due to missing data from multiple stations that typically record low peak SO2 concentrations
- the 2022 and 2023 peak SO2 concentrations for southern Quebec are estimated to be biased high by 23 percent and 39 percent, respectively, due to missing data from multiple stations that typically record low peak SO2 concentrations
- the 2023 peak SO2 concentration for southern Ontario is estimated to be biased high by 22 percent due to missing data from multiple stations that typically record low peak SO2 concentrations
For the national average VOC indicator, the following concentration biases are estimated: +19 percent in 2011, +25 percent in 2021 and +17 percent in 2022.
For the regional average VOC indicator, the following annual concentrations are likely biased relative to other annual concentrations:
- the 2022 regional average VOC concentrations are estimated to be biased high by 22 percent for Atlantic Canada, by 45 percent for southern Quebec, by 34 percent for southern Ontario, and by 45 percent for the Prairies and northern Ontario region
- the 2023 regional average VOC concentrations are estimated to be biased high by 18 percent for Atlantic Canada, by 25 percent for southern Quebec, by 31 percent for southern Ontario, and by 47 percent for the Prairies and northern Ontario region
- the 2022 average VOC concentration for British Columbia is estimated to be biased low by 20 percent, since a station that typically records very high average VOC concentrations was also paused, outweighing the effect of VOC monitoring stations in less polluted areas being paused
- the 2018 average VOC concentration for Atlantic Canada is estimated to be biased low by 42 percent due to missing data from a station that typically records very high average VOC concentrations
Regional biases in SO2 indicators due to sampling locations
Regional average and peak SO2 concentrations are highly dependent on the locations of SO2 monitoring stations within the region. Stations that are close to a major stationary emission source, such as a smelter, tend to measure much higher SO2 concentrations than other stations. The proportion of SO2 monitoring stations located near major stationary emission sources differs greatly by region. For example, 50 percent of the stations contributing to the southern Ontario average and peak SO2 indicators are located near a major emissions source, while only 10 percent of the stations contributing to the Prairies and northern Ontario average and peak SO2 indicators are located near a major emissions source. For this reason, regional differences in the average and peak SO2 concentrations are mainly due to differences in station placement, rather than differences in SO2 concentrations experienced by the general population of the regions. Therefore, the average and peak SO2 concentrations presented in these indicators should not be compared between regions.
Regional biases in VOC indicators due to sampling locations
Regional average VOC concentrations are highly dependent on the locations of the VOC monitoring stations within the region. Stations that are close to a major stationary emission source, such as an oil and gas extraction facility, tend to measure much higher concentrations than other stations. The proportion of VOC monitoring stations located near major stationary emission sources differs greatly by region. For example, 57 percent of the stations contributing to the British Columbia average VOC indicator are located near a major emissions source, while only 20 percent of the stations contributing to the southern Quebec average VOC indicator are located near a major emissions source. For this reason, regional differences in the average VOC concentration are mainly due to differences in station placement, rather than differences in VOC concentrations experienced by the general population of the regions. Therefore, the average VOC concentrations presented in this indicator should not be compared between regions.
Effect of new fine particulate matter measurement technologies
Since 2005, the Rupprecht & Potashnick tapered element oscillating microbalance (TEOM) monitors used in the National Air Pollution Surveillance program have gradually been replaced by newer monitoring technologies (federal equivalency method-approved instruments). Many studies conducted in Canada, the United States and other countries have found that the TEOM monitors under-report concentrations compared with the newer monitors, especially when the air contains a large proportion of semi-volatile particulate matter. This may be the case during cooler seasons when the air contains a greater proportion of ammonium nitrate and semi-volatile organic compounds.
Some of the year-to-year variations in the PM2.5 air quality indicator may be due, in part, to the introduction of the newer monitoring technologies across the National Air Pollution Surveillance Network rather than to changes in actual ambient concentrations only. As such, trends in PM2.5 concentrations may not be a true reflection of the changes that have occurred over the time period concerned.
To address a consistent positive bias observed in the Teledyne T640 instruments, a mass concentration alignment factor was applied to T640 instruments across Canada. This alignment factor is intended to improve the consistency of PM2.5 measurement with those obtained from the NAPS Federal Reference Method (FRM). ECCC, along with provincial, territorial and jurisdictional partners of NAPS have agreed to implement this alignment factor for the T640 instruments.Footnote 19
Resources
Resources
References
Canadian Council of Ministers of the Environment (2021) Air Quality Management System. Retrieved on October 6, 2025.
Canadian Council of Ministers of the Environment (2019) Ambient air monitoring and quality assurance/quality control guidelines: National Air Pollution Surveillance Program (PDF; 2.8 MB). Retrieved on October 6, 2025.
Dann T (2012) CESI PM2.5 Air Indicator Using Transformed Data. Prepared for Environment Canada.
Dann T (2013) Comparison of CESI PM2.5 Air Indicators with Transformed Data (FEM Basis). Prepared for Environment Canada.
Environment and Climate Change Canada (2025) National Air Pollution Surveillance Program. Retrieved on October 6, 2025.
Related information
Alternative format
Download the alternative format of the Air quality indicator (PDF; 4.4 MB).