
Canada's conserved areas
Conserved areas safeguard biodiversity, ecosystems and ecosystem services for present and future generations by reducing stresses from human activities. They also provide opportunities for people to connect with nature. Canada has set a target to conserve 25% of its lands and 25% of its oceans by 2025, and 30% of each by 2030.
Conserved areas include protected areas and other effective area-based conservation measures (OECMs). Protected areas include national, provincial and territorial parks, Indigenous protected areas, national wildlife areas, migratory bird sanctuaries and marine protected areas. OECMs are areas that conserve biodiversity over the long term and achieve the same outcomes of a protected area, but do not meet the formal definition of a protected area. Examples of OECMs can include: watersheds protected to conserve drinking water supply, fishery area closures, and areas with restricted access, such as those used by the military. These indicators track the amount and proportion of area recognized as conserved in Canada.
National
National conserved areas
Key results
- At the end of 2024, Canada had conserved
- 13.8% of its terrestrial area (land and freshwater), including 12.8% in protected areas
- 15.5% of its marine territory, including 11.4% in protected areas
- Terrestrial area conserved has increased by 15% in the last 5 years, and by 1.5% in the last year
- Marine area conserved has increased by 25% in the last 5 years, and by 17% in the last year
Proportion of area conserved, Canada, 1990 to 2024

Data table for the long description
| Year | Terrestrial area protected (square kilometres) |
Percentage of terrestrial area protected | Terrestrial area conserved (square kilometres) |
Percentage of terrestrial area conserved | Marine area protected (square kilometres) |
Percentage of marine area protected | Marine area conserved (square kilometres) |
Percentage of marine area conserved |
|---|---|---|---|---|---|---|---|---|
| 1990 | 440,829 | 4.4 | 440,829 | 4.4 | 17,252 | 0.3 | 17,252 | 0.3 |
| 1991 | 441,356 | 4.4 | 441,356 | 4.4 | 17,271 | 0.3 | 17,271 | 0.3 |
| 1992 | 456,697 | 4.6 | 456,697 | 4.6 | 17,696 | 0.3 | 17,696 | 0.3 |
| 1993 | 471,611 | 4.7 | 471,611 | 4.7 | 17,942 | 0.3 | 17,942 | 0.3 |
| 1994 | 475,139 | 4.8 | 475,139 | 4.8 | 17,946 | 0.3 | 17,946 | 0.3 |
| 1995 | 506,349 | 5.1 | 506,349 | 5.1 | 19,714 | 0.3 | 19,714 | 0.3 |
| 1996 | 524,557 | 5.3 | 524,557 | 5.3 | 20,575 | 0.4 | 20,575 | 0.4 |
| 1997 | 533,187 | 5.3 | 533,187 | 5.3 | 20,597 | 0.4 | 20,597 | 0.4 |
| 1998 | 560,220 | 5.6 | 560,220 | 5.6 | 22,579 | 0.4 | 22,579 | 0.4 |
| 1999 | 583,391 | 5.8 | 583,391 | 5.8 | 22,812 | 0.4 | 22,812 | 0.4 |
| 2000 | 592,880 | 5.9 | 592,880 | 5.9 | 22,910 | 0.4 | 22,910 | 0.4 |
| 2001 | 620,991 | 6.2 | 620,991 | 6.2 | 22,943 | 0.4 | 22,943 | 0.4 |
| 2002 | 628,347 | 6.3 | 628,347 | 6.3 | 23,147 | 0.4 | 23,147 | 0.4 |
| 2003 | 679,667 | 6.8 | 679,667 | 6.8 | 26,250 | 0.5 | 26,250 | 0.5 |
| 2004 | 691,012 | 6.9 | 691,012 | 6.9 | 28,649 | 0.5 | 28,649 | 0.5 |
| 2005 | 714,525 | 7.2 | 714,525 | 7.2 | 30,070 | 0.5 | 30,070 | 0.5 |
| 2006 | 721,376 | 7.2 | 721,376 | 7.2 | 30,421 | 0.5 | 30,421 | 0.5 |
| 2007 | 735,355 | 7.4 | 735,355 | 7.4 | 30,615 | 0.5 | 30,615 | 0.5 |
| 2008 | 785,693 | 7.9 | 785,693 | 7.9 | 39,494 | 0.7 | 39,494 | 0.7 |
| 2009 | 817,138 | 8.2 | 817,138 | 8.2 | 40,049 | 0.7 | 40,049 | 0.7 |
| 2010 | 828,666 | 8.3 | 828,666 | 8.3 | 49,237 | 0.9 | 49,237 | 0.9 |
| 2011 | 854,637 | 8.6 | 854,637 | 8.6 | 49,322 | 0.9 | 49,322 | 0.9 |
| 2012 | 896,370 | 9.0 | 896,370 | 9.0 | 49,324 | 0.9 | 49,324 | 0.9 |
| 2013 | 931,114 | 9.3 | 931,114 | 9.3 | 49,971 | 0.9 | 49,971 | 0.9 |
| 2014 | 933,837 | 9.4 | 933,837 | 9.4 | 49,972 | 0.9 | 49,972 | 0.9 |
| 2015 | 997,212 | 10.0 | 997,212 | 10.0 | 52,521 | 0.9 | 52,521 | 0.9 |
| 2016 | 1,002,710 | 10.0 | 1,002,710 | 10.0 | 54,879 | 1.0 | 54,879 | 1.0 |
| 2017 | 1,005,917 | 10.1 | 1,005,917 | 10.1 | 61,653 | 1.1 | 261,908 | 4.6 |
| 2018 | 1,072,568 | 10.7 | 1,109,932 | 11.1 | 73,111 | 1.3 | 273,367 | 4.8 |
| 2019 | 1,112,430 | 11.1 | 1,191,638 | 11.9 | 511,762 | 8.9 | 712,021 | 12.4 |
| 2020 | 1,194,678 | 12.0 | 1,273,696 | 12.8 | 524,310 | 9.1 | 716,421 | 12.5 |
| 2021 | 1,239,764 | 12.4 | 1,331,616 | 13.3 | 524,311 | 9.1 | 716,421 | 12.5 |
| 2022 | 1,247,780 | 12.5 | 1,339,702 | 13.4 | 524,311 | 9.1 | 760,397 | 13.2 |
| 2023 | 1,260,577 | 12.6 | 1,353,011 | 13.6 | 524,311 | 9.1 | 760,419 | 13.2 |
| 2024 | 1,280,965 | 12.8 | 1,373,718 | 13.8 | 657,329 | 11.4 | 893,437 | 15.5 |
Download data file (Excel/CSV; 3.8 kB)
How this indicator was calculated
Note: Terrestrial area includes both land and freshwater. Area conserved includes area protected as well as other effective area-based conservation measures (OECMs). In Canada, marine and terrestrial OECMs were formally recognized as a policy approach in 2017 and 2018, respectively, and added to the Canadian Protected and Conserved Areas Database, even though the measure(s) may have been established in previous years. Trends are estimated based on the date a site was reported and recognized as a protected area or OECM in the Canadian Protected and Conserved Areas Database. This is a change from previous versions of the indicator where the date a site was established was used, as such the totals for previous years may have changed. For more information on the recent changes and the definition of protected areas and OECMs, please refer to the Data sources and methods. Canada's terrestrial territory is 9,984,670 square kilometres (km2) and its marine territory is approximately 5,750,000 km2. Overlaps among protected areas and among OECMs were accounted for. Data are current as of December 31, 2024.
Source: Environment and Climate Change Canada (2025) Canadian Protected and Conserved Areas Database.
In 2019, Canada added 319,000 km2 of marine protected area (MPA) with the addition of the Tuvaijuittuq Marine Protected Area. Then in 2022, the Eastern Canyons Marine Refuge was added, contributing approximately an additional 44,000 km2 of marine area conserved. In 2023, the first marine refuge within the Northern Shelf Bioregion MPA Network, Gwa̲xdlala/Nala̲xdlala (Lull/Hoeya) marine refuge in Knight Inlet on the coast of British Columbia, also known as Lull Bay and Hoeya Sound, was announced. In 2024, the Tang.ɢ̱wan – ḥačxwiqak – Tsig̱is MPA was added, contributing 133,017 km2.
The distribution and size of conserved areas in Canada varies. Larger terrestrial conserved areas tend to be located in northern Canada, where there is less intensive use of land for agriculture, settlements, and road networks. Larger marine conserved areas tend to be located in offshore areas or in northern Canada, where human uses are often less intensive. In landscapes and seascapes with competing uses, conserved areas tend to be smaller but more numerous. Detailed distribution of conserved areas across Canada are available through an interactive map.
Conserved areas, Canada, 2024

Long description
The map of Canada shows the distribution and size of terrestrial (land and freshwater) and marine protected areas and other effective area-based conservation measures in 2024.
Navigate data using the interactive map
How this indicator was calculated
Note: Terrestrial area includes land and freshwater. Data are current as of December 31, 2024.
Source: Environment and Climate Change Canada (2024) Canadian Protected and Conserved Areas Database.
In Canada, over 65% of all terrestrial areas conserved are reported by provincial and territorial governments. Federal departments report 34% of all terrestrial areas, primarily by Parks Canada (25%) and Environment and Climate Change Canada (9%) (see Table 1). New data providers are being added annually, highlighting that protected and conserved areas are a pan-Canadian collaboration.Footnote 1
Over 97% of Canada's marine conserved areas are reported almost entirely by 3 federal departments: Fisheries and Oceans Canada (80%), Parks Canada (13%) and Environment and Climate Change Canada (3%). About 3% of the areas are reported by provinces and territories (see Table 2).
Ecological areas
Conserved areas, by ecological area
Canada's territory can be divided into 31 terrestrial and marine ecozones. Terrestrial ecozones are further divided into 216 terrestrial ecoregions. A representative conserved areas network should conserve biodiversity across all of Canada's ecological areas.
Conserved areas, by ecozone
An ecozone is a broad area of the Earth's surface that has a distinct climate and biodiversity.
Key results
- All of Canada's ecozones have some level of protection, ranging from less than 1% to almost 59% of the ecozone being conserved
- Six (6) terrestrial ecozones, the Tundra Cordillera, the Taiga Cordillera, the Pacific Maritime, the Montane Cordillera, the Arctic Cordillera and the Southern Arctic, have more than 20% of their area conserved
- Three (3) marine ecozones, the Arctic Basin, the Offshore Pacific and the Eastern Arctic, have more than 20% of their area conserved
- 13.4% of the Canadian area of the Great Lakes is conserved
Proportion of area conserved, by ecozone, Canada, 2024

Data table for the long description
| Ecozone name | Ecozone code | Ecozone area (square kilometres) |
Area protected (square kilometres) |
Percentage of region protected | Other effective area-based conservation measures (square kilometres) |
Area conserved (square kilometres) |
Percentage of region conserved |
|---|---|---|---|---|---|---|---|
| Arctic Cordillera | CL01 | 229,513 | 51,891 | 22.6 | 0 | 51,891 | 22.6 |
| Northern Arctic | CL02 | 1,479,561 | 105,970 | 7.2 | 0 | 105,970 | 7.2 |
| Southern Arctic | CL03 | 958,299 | 188,542 | 19.7 | 6,779 | 195,320 | 20.4 |
| Taiga Plains | CL04 | 553,374 | 61,138 | 11.0 | 19,401 | 80,539 | 14.6 |
| Taiga Shield | CL05 | 1,322,962 | 170,380 | 12.9 | 1,030 | 171,409 | 13.0 |
| Boreal Shield | CL06 | 1,902,001 | 221,468 | 11.6 | 124 | 221,593 | 11.7 |
| Atlantic Maritime | CL07 | 110,590 | 12,539 | 11.3 | 214 | 12,753 | 11.5 |
| Mixedwood Plains | CL08 | 115,395 | 3,319 | 2.9 | 199 | 3,518 | 3.0 |
| Boreal Plains | CL09 | 780,010 | 66,720 | 8.6 | 5,036 | 71,756 | 9.2 |
| Prairies | CL10 | 464,422 | 19,145 | 4.1 | 9,832 | 28,977 | 6.2 |
| Montane Cordillera | CL11 | 436,791 | 84,915 | 19.4 | 16,946 | 101,861 | 23.3 |
| Pacific Maritime | CL12 | 217,022 | 53,466 | 24.6 | 7,646 | 61,112 | 28.2 |
| Boreal Cordillera | CL13 | 557,860 | 96,625 | 17.3 | 9,675 | 106,301 | 19.1 |
| Taiga Cordillera | CL14 | 231,266 | 56,711 | 24.5 | 10,545 | 67,256 | 29.1 |
| Hudson Plains | CL15 | 348,406 | 50,641 | 14.5 | 0 | 50,641 | 14.5 |
| Tundra Cordillera | CL16 | 28,887 | 13,796 | 47.8 | 3,197 | 16,993 | 58.8 |
| Atlantic Highlands | CL17 | 93,012 | 6,251 | 6.7 | 41 | 6,292 | 6.8 |
| Semi-Arid Plateaus | CL18 | 56,464 | 5,490 | 9.7 | 2,085 | 7,575 | 13.4 |
| Strait of Georgia | CW19 | 8,969 | 426 | 4.8 | 32 | 458 | 5.1 |
| Southern Shelf | CW20 | 28,158 | 785 | 2.8 | 0 | 785 | 2.8 |
| Offshore Pacific | CW21 | 315,724 | 143,463 | 45.4 | 0 | 143,463 | 45.4 |
| Northern Shelf | CW22 | 101,663 | 16,651 | 16.4 | 21 | 16,673 | 16.4 |
| Arctic Basin | CW23 | 752,053 | 284,091 | 37.8 | 0 | 284,091 | 37.8 |
| Western Arctic | CW24 | 539,807 | 12,060 | 2.2 | 0 | 12,060 | 2.2 |
| Arctic Archipelago | CW25 | 268,792 | 38,923 | 14.5 | 0 | 38,923 | 14.5 |
| Eastern Arctic | CW26 | 782,636 | 115,296 | 14.7 | 58,725 | 174,021 | 22.2 |
| Hudson Bay Complex | CW27 | 1,244,670 | 8,782 | 0.7 | 0 | 8,782 | 0.7 |
| Newfoundland-Labrador Shelves | CW28 | 1,041,588 | 12,577 | 1.2 | 110,960 | 123,537 | 11.9 |
| Scotian Shelf | CW29 | 416,296 | 6,000 | 1.4 | 58,651 | 64,651 | 15.5 |
| Gulf of Saint Lawrence | CW30 | 246,648 | 18,271 | 7.4 | 7,718 | 25,989 | 10.5 |
| Great Lakes | CW31 | 89,236 | 11,956 | 13.4 | 2 | 11,959 | 13.4 |
Download data file (Excel/CSV; 2.5 kB)
How this indicator was calculated
Note: Area conserved includes area protected as well as area conserved with other measures. Data are current as of December 31, 2024.
Source: Environment and Climate Change Canada (2025) Canadian Protected and Conserved Areas Database.
Terrestrial ecozones with high levels of urbanization and development or widespread agriculture tend to have small proportions of conserved area. For example, the Mixedwood Plains (in southern Ontario and along the St. Lawrence River) has only 3% of its area conserved and the Prairies has 6%. On the other hand, terrestrial ecozones that are in remote areas or have a high recreation value tend to have a high proportion of conserved area. For example, ecozones in the western mountain ranges have 19% or more of their area conserved.
Recent efforts have rapidly increased the amount of area conserved in some marine ecozones. For example, the Tuvaijuittuq Marine Protected Area in the Arctic Basin is the largest marine protected area in Canada. It was first designated as a protected area under the Oceans Act in 2019 and protections were extended in 2024. Upon establishment, it has increased the proportion of the ecozone protected from less than 1% to 37.8%. Marine refugesFootnote 2 (OECM) in the Offshore Pacific, Newfoundland-Labrador Shelves and Gulf of St. Lawrence have helped to conserve more than 5% of each of these ecozones. However, the Hudson Bay Complex, Western Arctic and Southern Shelf ecozones have less than 5% of their area conserved.
Each ecozone is unique, and conservation involves the inclusion of areas that are representative of different parts of the ecozone and sites of special value. Challenges to establishing conserved areas include competition from other uses, such as agriculture, industry or urban development, and limitations on the extent of ecologically intact areas available within the ecozone.
Conserved areas, by ecoregion
Ecoregions are subdivisions of ecozones characterized by distinctive regional attributes. These include climate, landforms, vegetation, soil, flora and fauna.
Key results
- 94% of Canada's ecoregions have some level of protection, ranging from less than 1% to 100% of the ecoregion being conserved
- Of the 216 ecoregions in Canada,
- 71% (153 ecoregions) have less than 17% of their area conserved
- 13% (28 ecoregions) have between 17% and 30% of their area conserved
- 16% (35 ecoregions) have more than 30% of their area conserved
Proportion of area conserved, by ecoregion, Canada, 2024

Data table for the long description
| Ecoregion name | Ecoregion code | Ecoregion area (square kilometres) |
Area protected (square kilometres) |
Percentage of region protected | Other effective area-based conservation measures (square kilometres) |
Area conserved (square kilometres) |
Percentage of region conserved |
|---|---|---|---|---|---|---|---|
| Ellesmere and Devon Island Ice Caps | CL01R01 | 113,244 | 14,119 | 12.5 | 0 | 14,119 | 12.5 |
| Baffin Mountains | CL01R02 | 87,928 | 27,592 | 31.4 | 0 | 27,592 | 31.4 |
| Baffin Islands Coastal Lowlands | CL01R03 | 9,159 | 476 | 5.2 | 0 | 476 | 5.2 |
| Torngat Mountains | CL01R04 | 19,182 | 9,764 | 50.9 | 0 | 9,764 | 50.9 |
| Ellesmere Mountains | CL02R01 | 53,112 | 6,198 | 11.7 | 0 | 6,198 | 11.7 |
| Eureka Hills | CL02R02 | 75,769 | 15,492 | 20.4 | 0 | 15,492 | 20.4 |
| Polar Islands | CL02R03 | 21,353 | 0 | 0.0 | 0 | 0 | 0.0 |
| Sverdrup Islands Lowland | CL02R04 | 28,971 | 0 | 0.0 | 0 | 0 | 0.0 |
| Lancaster Plateau | CL02R05 | 102,430 | 78 | 0.1 | 0 | 78 | 0.1 |
| High Arctic | CL02R06 | 25,939 | 3,684 | 14.2 | 0 | 3,684 | 14.2 |
| Central Melville Upland | CL02R07 | 15,210 | 0 | 0.0 | 0 | 0 | 0.0 |
| Parry Islands Plateau | CL02R08 | 43,593 | 12,266 | 28.1 | 0 | 12,266 | 28.1 |
| Mid Arctic West | CL02R09 | 42,701 | 26,588 | 62.3 | 0 | 26,588 | 62.3 |
| Mid Arctic East | CL02R10 | 91,488 | 362 | 0.4 | 0 | 362 | 0.4 |
| Low Arctic North | CL02R11 | 9,859 | 859 | 8.7 | 0 | 859 | 8.7 |
| Shaler Mountains | CL02R12 | 26,327 | 0 | 0.0 | 0 | 0 | 0.0 |
| Amundsen Gulf Lowlands | CL02R13 | 49,141 | 22 | 0.0 | 0 | 22 | 0.0 |
| Victoria Islands Lowland | CL02R14 | 123,129 | 0 | 0.0 | 0 | 0 | 0.0 |
| Prince of Wales Island Lowland | CL02R15 | 17,150 | 0 | 0.0 | 0 | 0 | 0.0 |
| Boothia Peninsula Plateau | CL02R16 | 35,701 | 0 | 0.0 | 0 | 0 | 0.0 |
| Gulf of Boothia Plain | CL02R17 | 24,426 | 13 | 0.1 | 0 | 13 | 0.1 |
| Borden Peninsula Plateau | CL02R18 | 31,473 | 11,822 | 37.6 | 0 | 11,822 | 37.6 |
| Melville Peninsula Plateau | CL02R19 | 111,290 | 11 | 0.0 | 0 | 11 | 0.0 |
| Baffin Island Uplands | CL02R20 | 79,703 | 1,597 | 2.0 | 0 | 1,597 | 2.0 |
| Wager Bay Plateau | CL02R21 | 250,876 | 18,440 | 7.4 | 0 | 18,440 | 7.4 |
| Foxe Basin Plain | CL02R22 | 56,549 | 6,914 | 12.2 | 0 | 6,914 | 12.2 |
| Meta Incognita Peninsula | CL02R23 | 77,447 | 1,223 | 1.6 | 0 | 1,223 | 1.6 |
| Pangnirtung Upland | CL02R24 | 34,271 | 40 | 0.1 | 0 | 40 | 0.1 |
| Hall Peninsula Upland | CL02R25 | 35,389 | 0 | 0.0 | 0 | 0 | 0.0 |
| Baffin Upland | CL02R26 | 16,265 | 302 | 1.9 | 0 | 302 | 1.9 |
| Yukon Coastal Plain | CL03R01 | 4,652 | 4,611 | 99.1 | 0 | 4,611 | 99.1 |
| West Lowlands | CL03R02 | 24,729 | 1,436 | 5.8 | 0 | 1,436 | 5.8 |
| Central Lowlands | CL03R03 | 14,847 | 337 | 2.3 | 0 | 337 | 2.3 |
| East Lowlands | CL03R04 | 5,112 | 101 | 2.0 | 0 | 101 | 2.0 |
| East Highlands | CL03R05 | 22,546 | 16,696 | 74.1 | 0 | 16,696 | 74.1 |
| Coronation Hills | CL03R06 | 77,972 | 2,085 | 2.7 | 3,652 | 5,737 | 7.4 |
| Bathurst Hills | CL03R07 | 8,986 | 1 | 0.0 | 0 | 1 | 0.0 |
| Takijua Lake Upland | CL03R08 | 126,102 | 1,543 | 1.2 | 915 | 2,457 | 1.9 |
| Queen Maud Gulf Lowland | CL03R09 | 66,172 | 43,449 | 65.7 | 0 | 43,449 | 65.7 |
| Chantrey Inlet Lowland | CL03R10 | 21,959 | 2,163 | 9.9 | 0 | 2,163 | 9.9 |
| Garry Lake Lowland | CL03R11 | 98,928 | 29,029 | 29.3 | 2,206 | 31,235 | 31.6 |
| Back River Plain | CL03R12 | 33,117 | 14,989 | 45.3 | 0 | 14,989 | 45.3 |
| Dubawnt Lake Plain and Upland | CL03R13 | 54,322 | 14,869 | 27.4 | 0 | 14,869 | 27.4 |
| Maguse River Upland | CL03R14 | 78,598 | 257 | 0.3 | 0 | 257 | 0.3 |
| Southampton Island Plain | CL03R15 | 37,903 | 1,463 | 3.9 | 0 | 1,463 | 3.9 |
| Ottawa Islands | CL03R16 | 410 | 0 | 0.0 | 0 | 0 | 0.0 |
| Belcher Islands | CL03R17 | 3,214 | 13 | 0.4 | 0 | 13 | 0.4 |
| Ungava Peninsula | CL03R18 | 240,236 | 39,313 | 16.4 | 0 | 39,313 | 16.4 |
| Northern Labrador Highlands | CL03R19 | 38,496 | 16,202 | 42.1 | 0 | 16,202 | 42.1 |
| Mackenzie Delta | CL04R01 | 9,373 | 0 | 0.0 | 130 | 130 | 1.4 |
| Low Subarctic Northern Plains | CL04R02 | 55,550 | 8,751 | 15.8 | 2,216 | 10,967 | 19.7 |
| Northern Uplands | CL04R03 | 54,532 | 808 | 1.5 | 6,920 | 7,728 | 14.2 |
| High Subarctic Northern Plains | CL04R04 | 82,597 | 666 | 0.8 | 2,020 | 2,685 | 3.3 |
| Central Highlands | CL04R05 | 38,262 | 3,307 | 8.6 | 2,699 | 6,006 | 15.7 |
| Central Uplands | CL04R06 | 17,973 | 109 | 0.6 | 16 | 125 | 0.7 |
| Central Plains | CL04R07 | 20,851 | 1,128 | 5.4 | 3,149 | 4,277 | 20.5 |
| Lac Grandin Plain | CL04R08 | 26,097 | 1,317 | 5.0 | 523 | 1,840 | 7.1 |
| West-central Uplands | CL04R09 | 10,647 | 683 | 6.4 | 0 | 683 | 6.4 |
| Mackenzie Plain | CL04R10 | 18,388 | 1,439 | 7.8 | 0 | 1,439 | 7.8 |
| Bulmer Plain | CL04R11 | 17,255 | 1,370 | 7.9 | 0 | 1,370 | 7.9 |
| Horn Plateau | CL04R12 | 9,404 | 6,946 | 73.9 | 0 | 6,946 | 73.9 |
| Great Slave Plain | CL04R13 | 15,877 | 116 | 0.7 | 0 | 116 | 0.7 |
| Northern Alberta Upland | CL04R14 | 31,212 | 481 | 1.5 | 527 | 1,008 | 3.2 |
| Southern Uplands | CL04R15 | 15,675 | 0 | 0.0 | 0 | 0 | 0.0 |
| Northern Mixedwood | CL04R16 | 92,264 | 24,663 | 26.7 | 0 | 24,663 | 26.7 |
| Lower Boreal Highlands North | CL04R17 | 11,745 | 1,926 | 16.4 | 0 | 1,926 | 16.4 |
| Boreal Subarctic | CL04R18 | 14,006 | 5,844 | 41.7 | 0 | 5,844 | 41.7 |
| Slave Lowlands | CL04R19 | 11,667 | 1,583 | 13.6 | 0 | 1,583 | 13.6 |
| High Subarctic West | CL05R01 | 60,726 | 3,155 | 5.2 | 950 | 4,105 | 6.8 |
| Low Subarctic North | CL05R02 | 58,734 | 4,831 | 8.2 | 82 | 4,913 | 8.4 |
| High Boreal | CL05R03 | 111,755 | 15,043 | 13.5 | 0 | 15,043 | 13.5 |
| Slave Plain | CL05R04 | 7,579 | 11 | 0.1 | 0 | 11 | 0.1 |
| Selwyn Lake Upland | CL05R05 | 196,275 | 22,463 | 11.4 | 0 | 22,463 | 11.4 |
| Kazan River Upland | CL05R06 | 183,946 | 24,006 | 13.1 | 0 | 24,006 | 13.1 |
| La Grande Hills | CL05R07 | 171,951 | 48,667 | 28.3 | 0 | 48,667 | 28.3 |
| Nord-du-Québec Central Plateau | CL05R08 | 177,618 | 28,818 | 16.2 | 0 | 28,818 | 16.2 |
| McPhayden Plateau | CL05R09 | 9,461 | 7 | 0.1 | 0 | 7 | 0.1 |
| Ungava Bay Basin | CL05R10 | 109,785 | 13,361 | 12.2 | 0 | 13,361 | 12.2 |
| Kingurutik-Fraser | CL05R11 | 52,915 | 11 | 0.0 | 0 | 11 | 0.0 |
| Coastal Barrens | CL05R12 | 13,520 | 856 | 6.3 | 0 | 856 | 6.3 |
| Michikamau-Smallwood | CL05R13 | 86,549 | 1,531 | 1.8 | 0 | 1,531 | 1.8 |
| Nipishish-Goose | CL05R14 | 23,259 | 0 | 0.0 | 0 | 0 | 0.0 |
| Mecatina River | CL05R15 | 41,289 | 2 | 0.0 | 0 | 2 | 0.0 |
| Eagle Plateau – Mealy Mountains | CL05R16 | 17,599 | 7,496 | 42.6 | 0 | 7,496 | 42.6 |
| Athabasca Plain | CL06R01 | 87,467 | 6,466 | 7.4 | 0 | 6,466 | 7.4 |
| Churchill River Upland | CL06R02 | 196,603 | 11,598 | 5.9 | 36 | 11,634 | 5.9 |
| Hayes River Upland | CL06R03 | 131,805 | 4,697 | 3.6 | 0 | 4,697 | 3.6 |
| Big Trout Lake | CL06R04 | 146,897 | 5,611 | 3.8 | 0 | 5,611 | 3.8 |
| Lake St. Joseph | CL06R05 | 91,057 | 25,600 | 28.1 | 0 | 25,600 | 28.1 |
| Lake Wabigoon | CL06R06 | 75,331 | 15,681 | 20.8 | 0 | 15,681 | 20.8 |
| Lake of the Woods | CL06R07 | 16,390 | 762 | 4.6 | 0 | 762 | 4.6 |
| Lake Nipigon | CL06R08 | 89,192 | 14,775 | 16.6 | 0 | 14,775 | 16.6 |
| Pigeon River | CL06R09 | 20,468 | 5,175 | 25.3 | 0 | 5,175 | 25.3 |
| Abitibi Lowlands | CL06R10 | 211,625 | 22,553 | 10.7 | 0 | 22,553 | 10.7 |
| Lake Temagami | CL06R11 | 41,758 | 6,264 | 15.0 | 0 | 6,264 | 15.0 |
| Georgian Bay | CL06R12 | 74,501 | 8,049 | 10.8 | 49 | 8,099 | 10.9 |
| Mistassini Highlands | CL06R13 | 97,165 | 22,529 | 23.2 | 0 | 22,529 | 23.2 |
| Southern Laurentides Highlands | CL06R14 | 158,761 | 14,538 | 9.2 | 2 | 14,540 | 9.2 |
| Central Laurentides Highlands | CL06R15 | 205,129 | 27,314 | 13.3 | 0 | 27,314 | 13.3 |
| Lake Melville | CL06R16 | 17,668 | 461 | 2.6 | 0 | 461 | 2.6 |
| Paradise River | CL06R17 | 17,160 | 1,901 | 11.1 | 0 | 1,901 | 11.1 |
| Middle and Lower Côte-Nord Plateau | CL06R18 | 104,282 | 17,070 | 16.4 | 0 | 17,070 | 16.4 |
| Anticosti Island | CL06R19 | 7,937 | 2,253 | 28.4 | 0 | 2,253 | 28.4 |
| Strait of Belle Isle Barrens | CL06R20 | 1,783 | 42 | 2.3 | 0 | 42 | 2.3 |
| Northern Peninsula Forest | CL06R21 | 8,508 | 503 | 5.9 | 0 | 503 | 5.9 |
| Long Range Barrens | CL06R22 | 16,589 | 1,599 | 9.6 | 0 | 1,599 | 9.6 |
| Western Newfoundland Forest | CL06R23 | 9,874 | 567 | 5.7 | 0 | 567 | 5.7 |
| Central Newfoundland Forest | CL06R24 | 28,731 | 548 | 1.9 | 0 | 548 | 1.9 |
| North Shore Forest | CL06R25 | 5,483 | 133 | 2.4 | 0 | 133 | 2.4 |
| Maritime Barrens | CL06R26 | 37,734 | 4,049 | 10.7 | 0 | 4,049 | 10.7 |
| Avalon Forest | CL06R27 | 555 | 18 | 3.3 | 0 | 18 | 3.3 |
| Eastern Hyper-Oceanic Barrens | CL06R28 | 1,545 | 47 | 3.0 | 0 | 47 | 3.0 |
| Valley Lowlands | CL07R01 | 20,310 | 1,710 | 8.4 | 34 | 1,743 | 8.6 |
| Eastern Lowlands | CL07R02 | 39,021 | 3,076 | 7.9 | 45 | 3,121 | 8.0 |
| Grand Lake Lowlands | CL07R03 | 3,780 | 271 | 7.2 | 68 | 338 | 8.9 |
| Central Uplands East | CL07R04 | 1,408 | 272 | 19.3 | 0 | 272 | 19.3 |
| Fundy Coast | CL07R05 | 3,633 | 400 | 11.0 | 4 | 404 | 11.1 |
| Prince Edward Island | CL07R06 | 5,932 | 246 | 4.1 | 44 | 290 | 4.9 |
| Îles-de-la-Madeleine | CL07R07 | 232 | 27 | 11.7 | 0 | 27 | 11.7 |
| Avalon Uplands | CL07R08 | 4,793 | 467 | 9.7 | 13 | 480 | 10.0 |
| Triassic Lowlands | CL07R09 | 1,367 | 2 | 0.1 | 0 | 2 | 0.1 |
| Western Meguma Interior | CL07R10 | 17,129 | 2,994 | 17.5 | 0 | 2,994 | 17.5 |
| Eastern Meguma Interior | CL07R11 | 6,136 | 833 | 13.6 | 0 | 833 | 13.6 |
| Cape Breton Highlands | CL07R12 | 2,460 | 1,289 | 52.4 | 0 | 1,289 | 52.4 |
| Cape Breton Taiga | CL07R13 | 302 | 227 | 75.2 | 0 | 227 | 75.2 |
| Atlantic Coast | CL07R14 | 4,088 | 591 | 14.5 | 59 | 650 | 15.9 |
| St. Lawrence Lowlands | CL08R01 | 44,124 | 1,600 | 3.6 | 67 | 1,667 | 3.8 |
| Lake Simcoe | CL08R02 | 49,405 | 1,179 | 2.4 | 131 | 1,310 | 2.7 |
| Lake Erie – Lake Ontario | CL08R03 | 21,865 | 262 | 1.2 | 1 | 263 | 1.2 |
| Muskwa Plateau | CL09R01 | 26,169 | 857 | 3.3 | 1 | 858 | 3.3 |
| Mid Boreal Uplands | CL09R02 | 307,570 | 40,174 | 13.1 | 2,142 | 42,316 | 13.8 |
| Lower Boreal Highlands South | CL09R03 | 69,089 | 3,748 | 5.4 | 559 | 4,306 | 6.2 |
| Upper Boreal Highlands | CL09R04 | 11,894 | 2,929 | 24.6 | 0 | 2,929 | 24.6 |
| Dry Mixedwood | CL09R05 | 58,592 | 922 | 1.6 | 180 | 1,101 | 1.9 |
| Peace River Parkland | CL09R06 | 3,122 | 20 | 0.6 | 0 | 20 | 0.6 |
| Lower Foothills | CL09R07 | 51,105 | 423 | 0.8 | 191 | 614 | 1.2 |
| Upper Foothills | CL09R08 | 22,460 | 588 | 2.6 | 30 | 618 | 2.8 |
| Peace-Athabasca Delta | CL09R09 | 5,539 | 5,227 | 94.4 | 0 | 5,227 | 94.4 |
| Boreal Transition | CL09R10 | 91,799 | 3,431 | 3.7 | 1,631 | 5,062 | 5.5 |
| Mid Boreal Lowland | CL09R11 | 92,890 | 6,408 | 6.9 | 284 | 6,692 | 7.2 |
| Interlake Plain | CL09R12 | 39,782 | 1,848 | 4.6 | 5 | 1,853 | 4.7 |
| Aspen Parkland | CL10R01 | 170,223 | 4,491 | 2.6 | 2,083 | 6,574 | 3.9 |
| Foothills Parkland | CL10R02 | 3,928 | 347 | 8.8 | 0 | 347 | 8.8 |
| Foothills Fescue | CL10R03 | 13,642 | 80 | 0.6 | 0 | 80 | 0.6 |
| Moist Mixed Grassland | CL10R04 | 82,833 | 3,823 | 4.6 | 1,102 | 4,925 | 5.9 |
| Mixedgrass | CL10R05 | 17,599 | 180 | 1.0 | 0 | 180 | 1.0 |
| Dry Mixedgrass | CL10R06 | 133,416 | 8,673 | 6.5 | 5,647 | 14,320 | 10.7 |
| Cypress Mixedgrass | CL10R07 | 7,517 | 253 | 3.4 | 837 | 1,089 | 14.5 |
| Cypress Hills Montane | CL10R08 | 309 | 200 | 64.8 | 0 | 200 | 64.8 |
| Southwest Manitoba Uplands | CL10R09 | 2,188 | 178 | 8.1 | 0 | 178 | 8.1 |
| Lake Manitoba Plain | CL10R10 | 32,768 | 414 | 1.3 | 0 | 414 | 1.3 |
| Skeena Mountains | CL11R01 | 24,427 | 882 | 3.6 | 524 | 1,406 | 5.8 |
| Omineca Mountains | CL11R02 | 34,083 | 2,957 | 8.7 | 1,111 | 4,068 | 11.9 |
| Fraser Basin | CL11R03 | 43,017 | 1,536 | 3.6 | 403 | 1,939 | 4.5 |
| Central Canadian Rocky Mountains | CL11R04 | 37,273 | 4,035 | 10.8 | 2,487 | 6,521 | 17.5 |
| Eastern Hazelton Mountains | CL11R05 | 13,535 | 5,993 | 44.3 | 1,098 | 7,091 | 52.4 |
| Chilcotin Ranges | CL11R06 | 15,784 | 6,476 | 41.0 | 363 | 6,839 | 43.3 |
| Fraser Plateau | CL11R07 | 82,038 | 5,182 | 6.3 | 6,010 | 11,192 | 13.6 |
| Columbia Highlands | CL11R08 | 29,572 | 3,218 | 10.9 | 2,371 | 5,589 | 18.9 |
| Selkirk-Bitterroot Foothills | CL11R09 | 7,646 | 882 | 11.5 | 55 | 937 | 12.3 |
| Northern Columbia Mountains | CL11R10 | 53,493 | 12,632 | 23.6 | 1,142 | 13,774 | 25.7 |
| Southern Rocky Mountain Trench | CL11R11 | 8,498 | 618 | 7.3 | 151 | 769 | 9.0 |
| Purcell Transitional Ranges | CL11R12 | 8,108 | 1,197 | 14.8 | 4 | 1,201 | 14.8 |
| Western Continental Ranges | CL11R13 | 23,382 | 6,501 | 27.8 | 113 | 6,614 | 28.3 |
| Northern Continental Divide | CL11R14 | 5,916 | 437 | 7.4 | 880 | 1,317 | 22.3 |
| Eastern Continental Ranges | CL11R15 | 50,020 | 30,631 | 61.2 | 356 | 30,987 | 61.9 |
| Mount Logan | CL12R01 | 12,925 | 12,923 | 100.0 | 0 | 12,923 | 100.0 |
| Chugach Mountains and Icefields | CL12R02 | 2,338 | 2,338 | 100.0 | 0 | 2,338 | 100.0 |
| Boundary Ranges | CL12R03 | 21,426 | 1,318 | 6.2 | 10 | 1,328 | 6.2 |
| Nass Ranges | CL12R04 | 27,323 | 1,293 | 4.7 | 1,446 | 2,738 | 10.0 |
| Gwaii Haanas | CL12R05 | 10,049 | 4,822 | 48.0 | 8 | 4,830 | 48.1 |
| Coastal Gap | CL12R06 | 45,187 | 16,915 | 37.4 | 630 | 17,546 | 38.8 |
| Western Vancouver Island | CL12R07 | 20,165 | 2,815 | 14.0 | 794 | 3,609 | 17.9 |
| Eastern Vancouver Island | CL12R08 | 12,333 | 1,617 | 13.1 | 416 | 2,033 | 16.5 |
| Georgia-Puget Basin | CL12R09 | 1,668 | 224 | 13.4 | 3 | 228 | 13.6 |
| Lower Mainland | CL12R10 | 4,290 | 223 | 5.2 | 49 | 272 | 6.3 |
| Pacific Ranges | CL12R11 | 59,317 | 8,119 | 13.7 | 4,287 | 12,405 | 20.9 |
| St. Elias Mountains | CL13R01 | 18,708 | 15,693 | 83.9 | 0 | 15,693 | 83.9 |
| Wellesley Lake | CL13R02 | 3,983 | 0 | 0.0 | 0 | 0 | 0.0 |
| Ruby-Nisling Ranges | CL13R03 | 18,885 | 10 | 0.1 | 0 | 10 | 0.1 |
| Klondike Plateau | CL13R04 | 36,520 | 0 | 0.0 | 0 | 0 | 0.0 |
| Yukon Plateau-Central | CL13R05 | 24,030 | 110 | 0.5 | 0 | 110 | 0.5 |
| McQuesten Highlands | CL13R06 | 23,592 | 771 | 3.3 | 0 | 771 | 3.3 |
| Yukon Plateau-North | CL13R07 | 49,503 | 1,770 | 3.6 | 0 | 1,770 | 3.6 |
| Selwyn Mountains | CL13R08 | 35,697 | 1 | 0.0 | 0 | 1 | 0.0 |
| Mid-Boreal Highlands | CL13R09 | 24,120 | 12,638 | 52.4 | 2 | 12,640 | 52.4 |
| High Boreal Highlands | CL13R10 | 23,759 | 18,135 | 76.3 | 0 | 18,135 | 76.3 |
| High Boreal Lowlands | CL13R11 | 9,561 | 1,042 | 10.9 | 0 | 1,042 | 10.9 |
| Yukon-Stikine Highlands | CL13R12 | 23,468 | 6,654 | 28.4 | 0 | 6,654 | 28.4 |
| Yukon Southern Lakes | CL13R13 | 50,133 | 5,846 | 11.7 | 0 | 5,846 | 11.7 |
| Pelly Mountains | CL13R14 | 46,960 | 140 | 0.3 | 0 | 140 | 0.3 |
| Boreal Mountains and Plateaus | CL13R15 | 79,123 | 20,759 | 26.2 | 4,322 | 25,081 | 31.7 |
| Liard Basin | CL13R16 | 28,926 | 620 | 2.1 | 0 | 620 | 2.1 |
| Hyland Highland | CL13R17 | 19,609 | 378 | 1.9 | 0 | 378 | 1.9 |
| Northern Canadian Rocky Mountains | CL13R18 | 41,282 | 12,062 | 29.2 | 5,352 | 17,414 | 42.2 |
| Davidson Mountains | CL14R01 | 5,191 | 3,458 | 66.6 | 0 | 3,458 | 66.6 |
| Old Crow Basin | CL14R02 | 14,923 | 5,971 | 40.0 | 0 | 5,971 | 40.0 |
| North Ogilvie Mountains | CL14R03 | 40,613 | 7,112 | 17.5 | 0 | 7,112 | 17.5 |
| Eagle Plains | CL14R04 | 21,985 | 1,619 | 7.4 | 0 | 1,619 | 7.4 |
| Mackenzie Mountains | CL14R05 | 31,568 | 19,318 | 61.2 | 0 | 19,318 | 61.2 |
| Low Subarctic Lowlands | CL14R06 | 43,421 | 15,933 | 36.7 | 1,833 | 17,766 | 40.9 |
| High Subarctic Highlands | CL14R07 | 24,526 | 154 | 0.6 | 1,652 | 1,806 | 7.4 |
| Low Subarctic Highlands | CL14R08 | 49,040 | 3,145 | 6.4 | 7,020 | 10,165 | 20.7 |
| Coastal Hudson Bay Lowland | CL15R01 | 57,236 | 26,573 | 46.4 | 0 | 26,573 | 46.4 |
| Hudson Bay Lowland | CL15R02 | 138,825 | 14,052 | 10.1 | 0 | 14,052 | 10.1 |
| James Bay Lowlands | CL15R03 | 152,345 | 10,199 | 6.7 | 0 | 10,199 | 6.7 |
| British-Richardson Mountains | CL16R01 | 28,887 | 13,796 | 47.8 | 3,197 | 16,992 | 58.8 |
| Appalachian Mountains | CL17R01 | 69,073 | 3,842 | 5.6 | 0 | 3,842 | 5.6 |
| Central Uplands West | CL17R02 | 12,393 | 586 | 4.7 | 37 | 622 | 5.0 |
| Northern New Brunswick Uplands | CL17R03 | 8,724 | 1,195 | 13.7 | 5 | 1,199 | 13.7 |
| New Brunswick Highlands | CL17R04 | 2,822 | 589 | 20.9 | 0 | 589 | 20.9 |
| Interior Transition Ranges | CL18R01 | 14,026 | 2,240 | 16.0 | 1,217 | 3,457 | 24.6 |
| Northern Cascade Ranges | CL18R02 | 9,479 | 1,659 | 17.5 | 194 | 1,853 | 19.5 |
| Thompson-Okanagan Plateau | CL18R03 | 31,596 | 1,321 | 4.2 | 658 | 1,979 | 6.3 |
| Okanagan Highland | CL18R04 | 1,363 | 202 | 14.8 | 15 | 217 | 15.9 |
| Great Lakes | CW31 | 89,236 | 11,954 | 13.4 | 0 | 11,954 | 13.4 |
Download data file (Excel/CSV; 12.5 kB)
How this indicator was calculated
Note: Area conserved includes area protected as well as area conserved with other measures. Data are current as of December 31, 2024.
Source: Environment and Climate Change Canada (2025) Canadian Protected and Conserved Areas Database.
The area conserved varies greatly among ecoregions. Ecoregions that have the highest proportion of area conserved are associated with large, protected areas. For example, the Peace-Athabasca Delta ecoregion has 94.4% of its area conserved (Wood Buffalo National Park) and the Mount Logan ecoregion has 100% of its area conserved (Kluane National Park and Reserve). On the other hand, ecoregions in urban or agricultural landscapes have the lowest proportion of area conserved. The Lake Simcoe and Lake Erie – Lake Ontario ecoregions each have less than 3% of their area conserved.
Regional
Terrestrial conserved areas, within each province and territory
Key results
- The proportion of terrestrial area (land and freshwater) conserved varies by province and territory. It ranges from 5.4% in Prince Edward Island to 21.1% in Yukon
- Additions in 2024 include:
- Over 1,900 km2 added to the Luchanılį́né (Whitefish River) conservation zone in Northwest Territories
- Over 300 new or expanded protected and conserved areas in British Columbia with over 2,000 km2 reported
- Over 2,900 km2 of privately protected area added by Nature Conservacy Canada across Alberta, British Columbia, Manitoba, New Brunswick, Newfoundland and Labrador, Nova Scotia, Ontario, Prince Edward Island, and Saskatchewan
Proportion of terrestrial area conserved, by province and territory, Canada, 2024

Data table for the long description
| Province or territory | Provincial or territorial area (square kilometres) |
Area protected (square kilometres) |
Percentage of province or territory protected | Other effective area-based conservation measures (square kilometres) |
Area conserved (square kilometres) |
Percentage of province or territory conserved |
|---|---|---|---|---|---|---|
| Yukon | 482,443 | 101,710 | 21.1 | 0 | 101,710 | 21.1 |
| British Columbia | 944,735 | 149,876 | 15.9 | 38,484 | 188,360 | 19.9 |
| Quebec | 1,512,418 | 256,533 | 17.0 | 7 | 256,540 | 17.0 |
| Northwest Territories | 1,346,106 | 173,825 | 12.9 | 40,427 | 214,252 | 15.9 |
| Alberta | 661,848 | 102,910 | 15.5 | 255 | 103,166 | 15.6 |
| Nova Scotia | 55,284 | 7,470 | 13.5 | 84 | 7,554 | 13.7 |
| Manitoba | 647,797 | 71,845 | 11.1 | 231 | 72,076 | 11.1 |
| Ontario | 1,076,395 | 117,552 | 10.9 | 251 | 117,803 | 10.9 |
| New Brunswick | 72,908 | 7,408 | 10.2 | 118 | 7,527 | 10.3 |
| Nunavut | 2,093,190 | 213,037 | 10.2 | 0 | 213,037 | 10.2 |
| Saskatchewan | 651,036 | 51,087 | 7.8 | 12,811 | 63,898 | 9.8 |
| Newfoundland and Labrador | 405,212 | 28,185 | 7.0 | 31 | 28,217 | 7.0 |
| Prince Edward Island | 5,660 | 254 | 4.5 | 53 | 307 | 5.4 |
| Correction for overlaps among Provinces and Territories | n/a | -729 | n/a | -1 | -729 | n/a |
| Grand total | n/a | 1,280,965 | 12.8 | 92,753 | 1,373,718 | 13.8 |
Note: n/a = not applicable. Area conserved includes area protected as well as other effective area-based conservation measures.
Download data file (Excel/CSV; 1.7 kB)
How this indicator was calculated
Note: Terrestrial area includes land and freshwater. Data are current as of December 31, 2024.
Source: Environment and Climate Change Canada (2025) Canadian Protected and Conserved Areas Database.
Each province and territory has set aside areas for conservation. Compared to the previous year, the following provinces and territories increased terrestrial areas conserved:
- Prince Edward Island, from 5.1% to 5.4%
- British Columbia, from 19.7% to 19.9%
- Quebec, from 16.9% to 17.0%
- Alberta, from 15.5% to 15.6%
- Nova Scotia, from 13.6% to 13.7%
- Northwest Territories, from 15.8% to 15.9%
An increasing number of Indigenous protected areas are being established. Examples include:
- Central Purcell Mountains Indigenous Protected and Conserved Area in British Columbia
- Tłı̨chǫ Lands Indigenous Conserved Area, Edéhzhíe Indigenous Protected Area and Ts’udé Nilįné Tuyeta Territorial Protected Area in the Northwest Territories
- Thaidene Nëné Wildlife Conservation Area, Thaidene Nene National Park Reserve and Thaidene Nëné Territorial Protected Area in the Northwest Territories
- Kitaskino Nuwenëné Wildland Provincial Park and Muskoseya ispikaa’pawew in Alberta
- Gwa̲xdlala/Nala̲xdlala (Lull/Hoeya) marine refuge in Northern Shelf Bioregion of British Columbia
These areas are managed cooperatively between jurisdictions and Indigenous people, or by Indigenous people.
About the indicators
About the indicators
What the indicators measure
These indicators report the amount and proportion of Canada’s terrestrial (land and freshwater) and marine area that is recognized as conserved. Conserved areas are lands and waters which are managed in ways that achieve positive long-term outcomes for the conservation of biodiversity. They include protected areas as well as other effective area-based conservation measures (OECMs). Canada recognizes the international definitions of protected areas and OECMs (One with Nature 2018 [PDF; 2.12 MB] and Guidance for recognizing marine Other Effective Area-Based Conservation Measures 2022) and implements the federal Marine Protected Areas Protection Standard and Other Effective Area-Based Conservation Measures (OECM) Protection Standard.
Land and/or water access and use within protected areas are controlled primarily for the purpose of conserving nature (for example, a park, a conservation area or a wildlife reserve). OECMs are likewise managed over the long term in ways that result in the effective conservation of biodiversity, but they are not protected areas.
Why these indicators are important
Well-managed conserved areas are one way to ensure the long-term persistence of populations of wild species and their habitats. Habitat conservation is a response to the loss of biodiversity and natural habitat. As the area conserved in Canada increases, more lands and waters are withdrawn from direct land development, thereby contributing to biodiversity conservation and improving the health of ecosystems. In turn, healthy ecosystems provide benefits such as clean water, mitigation of climate change, pollination and improved human health.
Related initiatives
These indicators are used for reporting on the following 2022 to 2026 Federal Sustainable Development Strategy targets:
- Conserve 25% of marine and coastal areas by 2025, and 30% by 2030, in support of the commitment to work to halt and reverse nature loss by 2030 in Canada, and achieve a full recovery for nature by 2050. The most recent data available shows that, as of the end of 2024, 15.5% of Canada’s coastal and marine areas was recognized as conserved through marine protected areas and other effective area-based conservation measures, including 11.4% in protected areas.
- Conserve 25% of Canada’s land and inland waters by 2025, working toward 30% by 2030, from 12.5% recognized as conserved as of the end of 2020, in support of the commitment to work to halt and reverse nature loss by 2030 in Canada, and achieve a full recovery for nature by 2050. The most recent data available shows that, as of the end of 2024, 13,8% of Canada’s terrestrial areas and inland water was recognized as conserved through a network of protected areas and other effective area-based conservation measures, including 12.8% in protected areas.
The indicators are also used for reporting on Target 3 of Canada’s 2030 Nature Strategy: "Protected and conserved areas (30x30)." This target is related to the Kunming-Montreal Global Biodiversity Framework Target 3: "Ensure and enable that by 2030 at least 30 per cent of terrestrial, inland water, and of coastal and marine areas, especially areas of particular importance for biodiversity and ecosystem functions and services, are effectively conserved and managed through ecologically representative, well-connected and equitably governed systems of protected areas and other effective area-based conservation measures, recognizing Indigenous and traditional territories, where applicable, and integrated into wider landscapes, seascapes and the ocean, while ensuring that any sustainable use, where appropriate in such areas, is fully consistent with conservation outcomes, recognizing and respecting the rights of Indigenous peoples and local communities including over their traditional territories."
In addition, the indicators contribute to the Sustainable Development Goals of the 2030 Agenda for Sustainable Development. They are linked to Goal 14, Life Below Water and Target 14.5, "By 2020, conserve at least 10% of coastal and marine areas, consistent with national and international law and based on the best available scientific information." They are also linked to Goal 15, Life on Land and Target 15.1, "By 2020, ensure the conservation, restoration and sustainable use of terrestrial and inland freshwater ecosystems and their services, in particular forests, wetlands, mountains and drylands, in line with obligations under international agreements."
Related indicators
The Ability of the agricultural landscape to support wildlife indicator provides a measure of the suitability of agricultural land as habitat for terrestrial vertebrates.
The Ecological integrity of national parks indicator reports on the condition of ecosystems within national parks, an important element of Canada's conserved area network.
The Extent of Canada's wetlands indicator reports the current known extent or area of land in Canada covered by wetlands at the national level, as well as by ecozones and ecoregions.
The Global trends in conserved areas indicator compares Canada's conserved area to a peer group of countries.
Data sources and methods
Data sources and methods
Data sources
Data are taken from the Canadian Protected and Conserved Areas Database (CPCAD). Data from federal, provincial and territorial governments, the authoritative data sources, are compiled by Environment and Climate Change Canada.
More information
Protected areas and other effective area-based conservation measures
Conserved areas are comprised of protected areas and other area-based conservation measures (OECMs).
Protected areas are areas recognized as meeting the international definition for a protected area as defined by the International Union for Conservation of Nature: "a clearly defined geographical space, recognised, dedicated and managed, through legal or other effective means, to achieve the long-term conservation of nature with associated ecosystem services and cultural values."
Other effective area-based conservation measures (OECMs) are areas recognized as meeting the Convention on Biodiversity definition: "a geographically defined area other than a Protected Area, which is governed and managed in ways that achieve positive and sustained long-term outcomes for the in-situ conservation of biodiversity."Footnote 3 Canada implements the Convention on Biodiversity’s OECM definition in a manner that reflects national circumstances. Guidance for assessing sites as Protected Areas or OECMs in Canada is provided through the Pathway to Canada Target 1 Decision Support Tool.Footnote 4 Guidance for assessing federal marine OECMs is provided through the Marine OECM guidance.
In Canada, Fisheries and Oceans Canada, Parks Canada and Environment and Climate Change Canada each have specific but complementary mandates for establishing marine protected areas:
- Oceans Act Marine Protected Areas (Fisheries and Oceans Canada) are parts of the ocean that are legally protected and managed to achieve the long-term conservation of nature. This can include protecting species that are fished, endangered or threatened marine species, as well as unique habitats and areas of high biological productivity or biodiversity
- National marine conservation areas (Parks Canada) are established to conserve representative examples of Canada’s natural and cultural marine heritage and to provide opportunities for public education and enjoyment
- National wildlife areas (Environment and Climate Change Canada) are established and managed to conserve habitat for the recovery of species at risk and the conservation of migratory birds. Similarly, migratory bird sanctuaries are managed to support the conservation of migratory birds through the regulation of hunting and activities that might affect habitat
The areas established by these departments, along with provincially and terrestrially established areas, contribute to the conservation network. The primary goal of this network is to provide long-term conservation of marine biodiversity, ecosystem function and special natural features.
The different jurisdictions conserve areas for different purposes,Footnote 5 and control the amount of human activity (such as transportation, fishing or recreation) that is allowed. Marine conservation efforts include a wide range of management and stewardship activities. Examples include support for the recovery of species at risk, prevention and mitigation of the impact of aquatic invasive species, and strengthening of Canada’s response to ship-source marine pollution.
Data description
CPCAD contains data consolidated from all jurisdictions with responsibilities for conserved areas in Canada. Data are current as of December 31, 2024.
At least once each year, federal, provincial and territorial departments and agencies submit geospatial and ancillary data for conserved areas under their administrative control. Data on areas managed by Indigenous or non-governmental organizations, such as the Nature Conservancy of Canada and Ducks Unlimited Canada, are included where a jurisdiction has recognized and reported those areas.
The data include the name of the area, its geospatial location, boundaries, official area, biome (terrestrial/marine), International Union for Conservation of Nature management category, managing jurisdiction, and protection date,Footnote 6 among other information.
In cases where the same attribute information does not apply to the entire conserved area, the area is divided into zones for reporting. For example, a single protected area that crosses a provincial border is divided into zones corresponding to the different provinces. Similarly, a protected area that is later expanded is treated as several zones, each with its own protection date. Terrestrial and marine sections are treated as separate zones; freshwater is included in the terrestrial zone. Supporting data are maintained independently for each zone. Conserved areas that are undivided are treated as a single zone.
Work is ongoing to capture and incorporate data on additional privately held protected areas and on areas being conserved through means other than formal protection.
Jurisdictional area
- For Canada and for all provinces and territories except Quebec: Natural Resources Canada (2005) Canada Centre for Remote Sensing and Statistics Canada (2012) Land and freshwater area, by province and territory
- For Quebec: Ministère du Développement durable, de l'Environnement et de la Lutte contre les changements climatiques
- Canada's marine territory: Fisheries and Oceans Canada (2013) departmental analysis based on National Resources Canada (2009) Atlas of Canada 1:1,000,000 National Frameworks Data, Administrative Boundaries
National boundaries
- Natural Resources Canada (2019) CanVec Series 1:1,000,000 Geopolitical Region, Administrative Boundaries
Ecozones and ecoregions
- Environment and Climate Change Canada (2019) Canadian Terrestrial Ecological Framework
- Marine ecozones are based on Fisheries and Oceans Canada (2016) Federal Marine Bioregions (Canadian Science Advisory Secretariat, Science Advisory Report 2009/056).
Methods
The area conserved is estimated by means of a geographical analysis based on reported boundaries, accounting for overlaps. Separate estimates are made for protected areas and other effective area-based conservation measures (OECMs).
More information
Calculating Canada's conserved area
The Canadian Protected and Conserved Areas Database (CPCAD) contains information on the protection (or conservation) date for each zone. For zones that have been delisted, the records are transferred to the Delisted database.
To estimate the terrestrial protected area trend over time:
- All polygons representing terrestrial protected areas that were protected in 1990 or earlier were selected from the database
- The selected polygons were dissolved into a single polygon (removing overlaps), and the resulting area calculated using Albers Equal Area Conic projection
- The process was repeated for each subsequent year (delisted areas were removed from the analysis starting in the year they were delisted)
- Estimates were divided by the total terrestrial area of Canada to determine the proportion protected
The same steps as above were followed to estimate the marine protected area and were repeated for both terrestrial and marine OECMs. Total area conserved was calculated by summing area protected and OECM area.
Terrestrial conserved areas within each province and territory
CPCAD contains information on the province or territory in which a conserved area is located. The polygons for each terrestrial protected area within a province or territory were combined into a single polygon to calculate the area. The analysis was repeated for terrestrial OECMs.
Overlaps between provinces and territories can occur due to input from multiple stakeholders during data collection; these overlaps were accounted for in the table. In places where protected areas and OECMs overlapped, only the protected area was included in the total.
Terrestrial and marine conserved areas by reporting jurisdiction
CPCAD also contains information on the jurisdiction responsible for each terrestrial (Table 1) and marine (Table 2) conserved area. The total area for each jurisdiction is calculated by combining protected areas polygons into a single polygon. Additional analysis was then conducted to estimate the area for OECMs. In places where protected areas and OECMs overlapped, only the protected area was included in the total. Overlaps between jurisdictions can occur and were accounted for in the table.
Table 1. Terrestrial area conserved, by reporting jurisdiction, Canada, 2024
| Jurisdiction | Area protected (square kilometres) |
Other effective area-based conservation measures (square kilometres) |
Area conserved (square kilometres) |
|---|---|---|---|
| Provincial and territorial subtotal | 818,530 | 92,232 | 910,761 |
| Quebec | 255,156 | 0 | 255,156 |
| British Columbia | 143,466 | 38,273 | 181,739 |
| Ontario | 104,053 | 47 | 104,101 |
| Northwest Territories | 43,795 | 40,427 | 84,222 |
| Yukon | 65,605 | 0 | 65,605 |
| Manitoba | 57,765 | 231 | 57,996 |
| Saskatchewan | 44,727 | 13,125 | 57,852 |
| Alberta | 46,659 | 0 | 46,659 |
| Nunavut | 39,029 | 0 | 39,029 |
| New Brunswick | 6,812 | 17 | 6,829 |
| Nova Scotia | 5,906 | 24 | 5,930 |
| Newfoundland and Labrador | 5,341 | 31 | 5,372 |
| Prince Edward Island | 214 | 57 | 271 |
| Federal subtotal | 473,089 | 318 | 473,407 |
| Parks Canada | 353,086 | 305 | 353,392 |
| Environment and Climate Change Canada | 120,003 | 2 | 120,005 |
| Natural Resources Canada | 0 | 6 | 6 |
| Transport Canada | 0 | 3 | 3 |
| National Research Council | 0 | 1 | 1 |
| Canadian Border Services Agency | 0 | <1 | <1 |
| Nature Conservancy of Canada | 3,665 | 0 | 3,665 |
| Ducks Unlimited Canada | 1,656 | 0 | 1,656 |
| National Capital Commission | 439 | 5 | 443 |
| Miistakis Institute | 138 | 216 | 354 |
| Capital Regional District of British Columbia | 133 | 206 | 339 |
| J.D. Irving, Limited | 0 | 111 | 111 |
| BC Nature | 85 | 2 | 87 |
| Regional District of Central Okanagan | 19 | 2 | 21 |
| Ann & Sandy Cross Conservation Area | 19 | 0 | 19 |
| Manitoba Habitat Conservancy | 10 | 0 | 10 |
| Otipemisiwak Métis Government | 1 | 0 | 1 |
| Mount Arrowsmith Biosphere Region Research Institute | <1 | 0 | <1 |
| Northern Biomes LTD | 0 | <1 | <1 |
| Correction for overlaps among jurisdictions | -16,820 | -338 | -17,158 |
| Grand total | 1,280,965 | 92,753 | 1,373,718 |
Note: Terrestrial area includes land and freshwater. Area conserved includes area protected as well as other effective area-based conservation measures. The totals may not add up due to rounding. Data are current as of December 31, 2024.
Source: Environment and Climate Change Canada (2025) Canadian Protected and Conserved Areas Database.
Download data file (Excel/CSV; 2.1 kB)
Table 2. Marine area conserved, by reporting jurisdiction, Canada, 2024
| Jurisdiction | Area protected (square kilometres) |
Other effective area-based conservation measures (square kilometres) |
Area conserved (square kilometres) |
|---|---|---|---|
| Provincial subtotal | 23,879 | 0 | 23,879 |
| Quebec | 18,991 | 0 | 18,991 |
| British Columbia | 4,635 | 0 | 4,635 |
| Atlantic provinces | 173 | 0 | 173 |
| Manitoba | 80 | 0 | 80 |
| Federal subtotal | 637,599 | 244,316 | 881,914 |
| Fisheries and Oceans Canada | 484,437 | 244,316 | 728,753 |
| Parks Canada | 122,089 | 0 | 122,089 |
| Environment and Climate Change Canada | 31,073 | 0 | 31,073 |
| Correction for overlaps among jurisdictions | -4,149 | -8,208 | -12,357 |
| Grand total | 657,329 | 236,108 | 893,437 |
Note: Area conserved includes area protected as well as other effective area-based conservation measures. The totals may not add up due to rounding. Data are current as of December 31, 2024.
Source: Environment and Climate Change Canada (2025) Canadian Protected and Conserved Areas Database.
Download data file (Excel/CSV; 1.1 kB)
Conserved areas, by ecological area
CPCAD does not contain information on ecological areas. To generate an estimate of conserved area within each ecozone and ecoregion, a geospatial analysis was conducted. However, national ecozone and ecoregion boundaries are more generalized than local conserved areas boundaries, and this has the potential to affect estimates in coastal areas. To avoid this problem, marine conserved area that mapped outside a marine ecozone were assigned to the nearest marine ecozone. Similarly, terrestrial conserved areas that mapped outside a terrestrial ecozone were assigned to the nearest terrestrial ecozone.
To be consistent with the projection used in CPCAD, the ecozone layer was re-projected to Albers Equal Area Conic. The total area of each ecozone was then calculated from its geospatial boundaries. The Newfoundland-Labrador Shelves ecozone area was corrected for the territorial area of St Pierre and Miquelon.
The same methodology was used to calculate the conserved area within ecoregions.
Recent changes
Since 2021, CPCAD accounts protected areas and OECMs in the year they were recognized, rather than the year they were established, as was previously the case.
Caveats and limitations
In 2018, the Conservation Areas Reporting and Tracking System was converted to the Canadian Protected and Conserved Areas Database (CPCAD) and brought formally within Environment and Climate Change Canada.
Data are regularly reviewed and updated. The completeness of CPCAD is continuously being improved as existing conserved areas are reviewed and added to CPCAD if appropriate. Information on the protection date for sites with previously unreported dates may influence trend calculations.
Trends are estimated based on the date a site qualified as a protected area or OECM. The totals for a previous year may change as data are updated.
Comparisons with previous reports should be made with caution, as data quality and completeness continue to improve. Privately protected land and OECMs contribute to achievement of Canada's targets, but many are not yet captured within CPCAD.
More information
The area protected or conserved calculated using polygon boundaries may differ from the "official area" reported in the CPCAD.
Responsibility for source data accuracy and completeness lies with the jurisdictions. Jurisdictional work in terrestrial and marine areas is guided by the federal, provincial and territorial report One with Nature (PDF; 2.12 MB). In these areas, guidance material and decision support tools were adapted from, and in collaboration with, the Canadian Council on Ecological Areas. Nonetheless, some differences in the approach jurisdictions take in recognizing protected areas and OECMs can be expected.
Areas that are no longer recognized as protected or conserved ("decommissioned" or "delisted") are not captured comprehensively and may be missing from CPCAD. Decommissioned or delisted areas are counted from their establishment date until their delisting date.
Complex boundaries, such as coastlines and ecological areas, must be generalized for mapping purposes. In nature, ecozones or ecoregions do not have sharp boundaries. Due to the uncertainty of such boundaries, results should be seen as estimates rather than precise measurements. The mismatch in scale between conserved areas, mapped with fine detail, and national-scale geographic frameworks, mapped at a broad scale, may lead to minor differences across the various summaries because of the measurement uncertainty inherent in this type of analysis. Differences in the delineation of coastlines may result in a small amount of overlap between terrestrial and marine conserved area polygon boundaries; these overlaps have not been addressed.
Ecozones and ecoregions are ecologically based frameworks and should not be considered an expression of sovereignty. The 2019 updates to the ecozone and ecoregion frameworks have been completed for the purpose of reporting on ecological representation for the Pathway to Canada Target 1 initiative, and do not represent an official update of the 1995 National Ecological Framework. While the 2019 framework contains the most up-to-date information from jurisdictions, it should be noted that a different methodology was used by each data provider to determine the boundaries of the ecozones and ecoregions and that this national layer may differ from the provincial and territorial layers.
Protection is a designation, and the indicators do not provide information on the effectiveness of protection, the degree to which the ecological functioning of the area is intact, or the degree to which pressures outside a conserved area might affect the biodiversity within it.
Resources
Resources
References
Canadian Council on Ecological Areas Secretariat (2008) Canadian Guidebook for the Application of International Union for Conservation of Nature Protected Area Categories 2008. CCEA Occasional Paper No. 18. Canadian Council on Ecological Areas, Ottawa, ON. 66 pp.
Fisheries and Oceans Canada (2009) Development of a Framework and Principles for the Biogeographic Classification of Canadian Marine Areas. Canadian Science Advisory Secretariat, Science Advisory Report 2009/056.
Fisheries and Oceans Canada (2022) Operational Guidance for Identifying "Other Effective Area-Based Conservation Measures" in Canada's Marine Environment. Retrieved on April 29, 2024.
Fisheries and Oceans Canada (2022) Guidance for recognizing marine Other Effective Area-Based Conservation Measures 2022.
Pathway to Canada Target 1 Initiative (2018) One with Nature. A Renewed Approach to Land and Freshwater Conservation in Canada (PDF; 2.12 MB).
Stolton S, Shadie P and Dudley N (2013) Guidelines for applying protected area management categories including IUCN WCPA best practice guidance on recognising protected areas and assigning management categories and governance types (combined volume). Best Practice Protected Area Guidelines Series No. 21, Gland, Switzerland, section 2.
Related information
2020 Biodiversity Goals and Targets for Canada
Canadian Council on Ecological Areas
Convention on Biological Diversity
Interactive map of Quebec's protected areas (French only)
Kunming-Montreal Global Biodiversity Framework
Alternative format
Download the alternative format of the Canada's conserved areas indicator (PDF; 2.2 MB).
Infographic
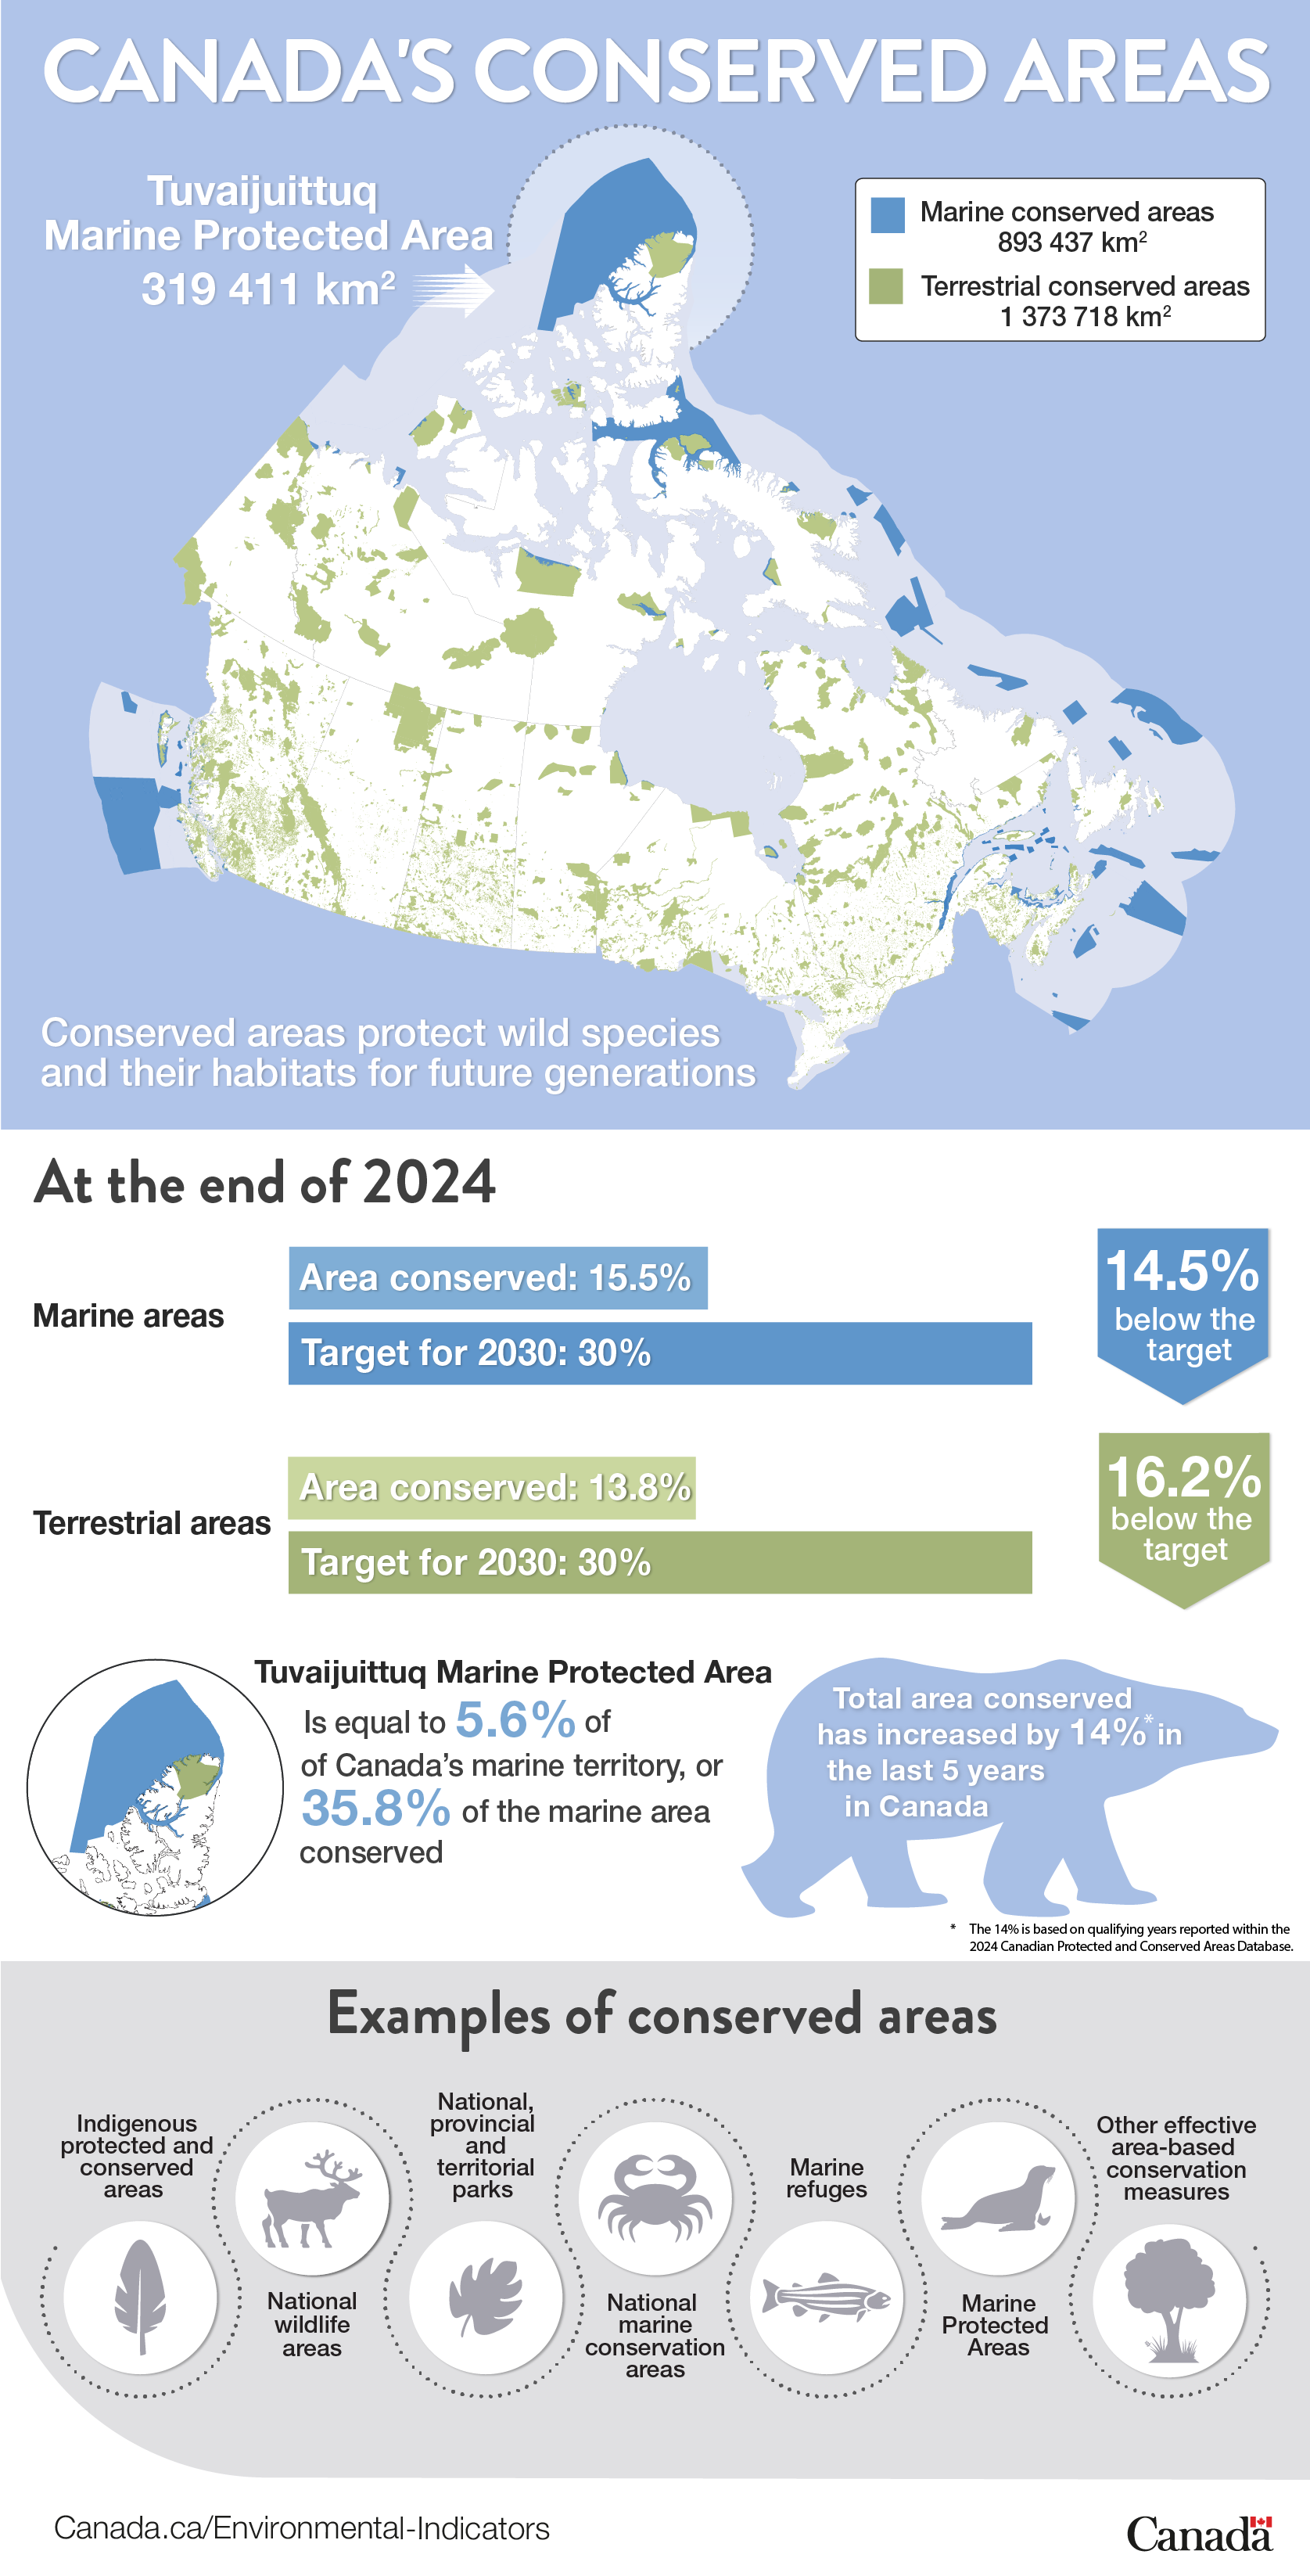
Long description
The infographic presents information on Canada's conserved areas indicators. Conserved areas protect wild species and their habitats for future generations. A map of Canada shows the location of marine and terrestrial conserved areas. It also shows the location of the Tuvaijuittuq Marine Protected Area in Canada's arctic. At 319,411 km2, the Tuvaijuittuq Marine Protected Area is the largest protected area in Canada and it is equal to 5.6% of the total marine territory, or 35.8% of the marine area conserved.
At the end of 2024, Canada had conserved 15.5% (893,437 km2) of its marine territory and 13.8% (1,373,718 km2) of its terrestrial area (land and freshwater).
Canada has set a target to conserve 25% of its lands and 25% of its oceans by 2025, and 30% of each by 2030. Canada is currently 14.5% below the 2030 target for marine areas conserved and 16.2% below the 2030 target for terrestrial areas conserved as of 2024.
Examples of conserved areas include:
- Indigenous protected and conserved areas
- National wildlife areas
- National, provincial and territorial parks
- National marine conservation areas
- Marine refuges (marine example of an other effective area-based conservation measure)
- Marine Protected Areas
- Other effective area-based conservation measures