
Ecological integrity of national parks
Ecosystems have ecological integrity when their components, such as native species, biological communities, natural landscapes, and ecological functions, are intact and are likely to persist.Footnote 1 Annually, Parks Canada summarizes the condition (good, fair, poor) and the trend (improving, stable, declining) of ecosystems' ecological integrity in national parks (including 35 national parks, 7 national park reserves, and 1 national urban park) using a series of monitoring measures to track changes in biodiversity and natural processes.
Results by condition
Key results
- In 2024, 119 ecosystems in 43 national parks were assessed. Of those,
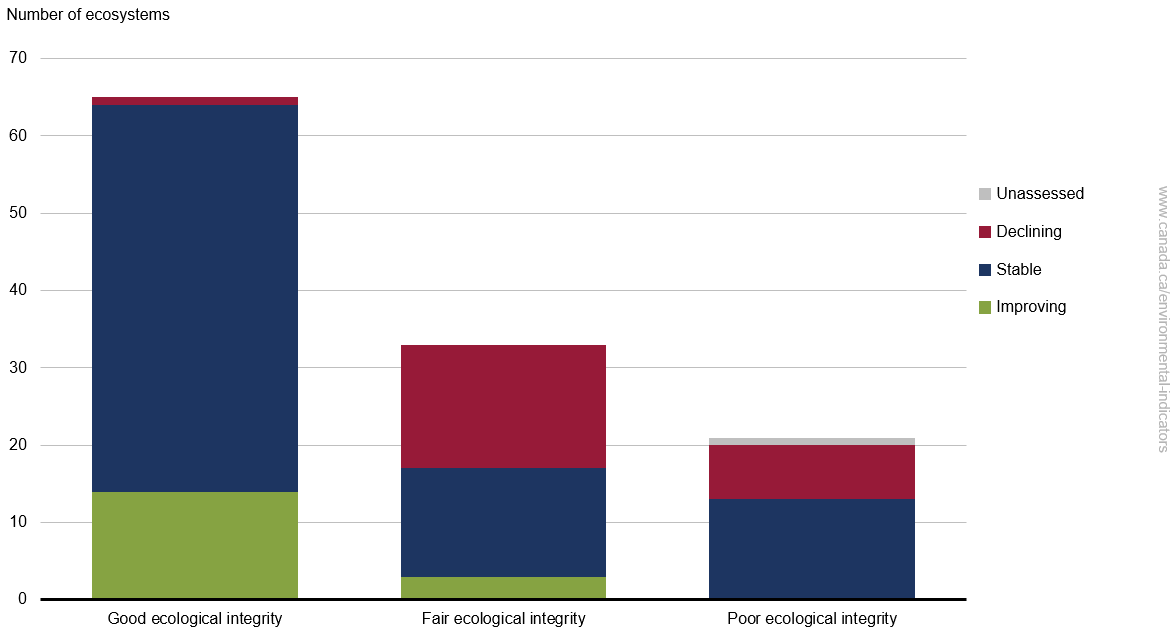
- 65 (55%) were in good condition, 33 (28%) were in fair condition and 21 (18%) were in poor condition
- 77 (65%) were stable, 17 (15%) were improving and 24 (20%) were declining
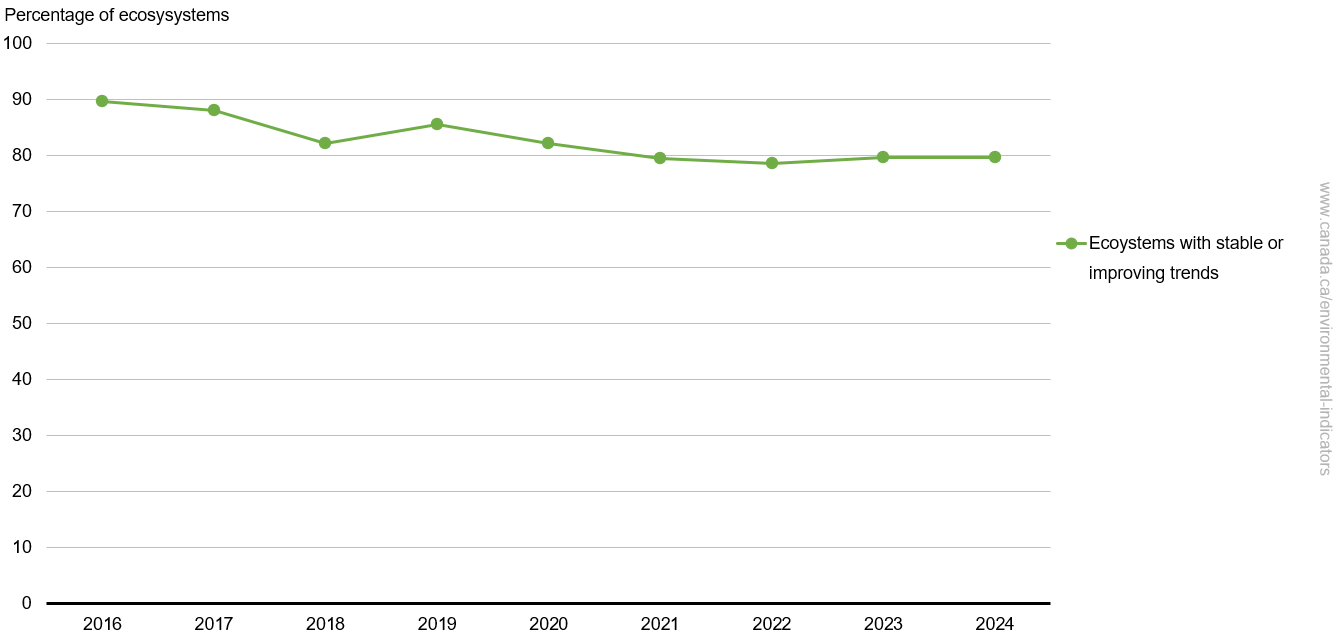
- Overall, the ecological integrity of 80% of site ecosystems was stable or improving in 2024, marking a 10% decrease from 90% recorded in 2016. However, this percentage has remained stable over the past 2 years
Ecological integrity conditions and trends of ecosystems in 43 national parks, Canada, 2024
Data table for the long description
| Ecological integrity condition | Improving (number of ecosystems) |
Stable (number of ecosystems) |
Declining (number of ecosystems) |
Unassessed (number of ecosystems) |
Total (number of ecosystems) |
|---|---|---|---|---|---|
| Good | 14 | 50 | 1 | 0 | 65 |
| Fair | 3 | 14 | 16 | 0 | 33 |
| Poor | 0 | 13 | 7 | 1 | 21 |
| Total | 17 | 77 | 24 | 1 | 119 |
| Ecological integrity condition | Improving (percentage of ecosystems) |
Stable (percentage of ecosystems) |
Declining (percentage of ecosystems) |
Unassessed (percentage of ecosystems) |
Total (percentage of ecosystems) |
|---|---|---|---|---|---|
| Good | 11.8 | 42.0 | 0.8 | 0.0 | 54.6 |
| Fair | 2.5 | 11.8 | 13.4 | 0.0 | 27.7 |
| Poor | 0.0 | 10.9 | 5.9 | 0.8 | 17.6 |
| Total | 14.3 | 64.7 | 20.2 | 0.8 | 100.0 |
Download data file (Excel; 1.4 kB)
How this indicator was calculated
Note: Monitored ecosystems include coastal/marine, forests, freshwater, glaciers, grasslands, shrublands, tundra, and wetlands, depending on what is present in each park. Akami-Uapishkᵁ-KakKasuak-Mealy Mountains National Park Reserve, Nááts'įhch'oh National Park Reserve, Thaidene Nëné National Park Reserve, Ukkusiksalik National Park, and Qausuittuq National Park did not report on ecological integrity in 2024. Rouge National Urban Park freshwater ecosystem scored Poor in 2024 but did not report trend data in 2024.
Source: Parks Canada (2025) Protected Areas Establishment and Conservation Directorate.
Between 2023 and 2024, the trends of 20 ecosystems changed. Nine (9) showed positive changes with 5 moving from stable or declining to improving trends, and 4 moving from declining to stable trends. In contrast, 11 ecosystems experienced negative changes with 8 moving from being stable or improving to declining trends, and 3 moving from improving to stable trends.
Since 2016, the percentage of ecosystems with stable or improving ecological integrity has declined from 89.6% to 79.7%, with the lowest being 78.6% in 2022. However, this percentage has remained relatively stable since 2020 with no change between 2023 and 2024.
Percentage of ecosystems with stable or improving trends in ecological integrity in 43 national parks, Canada, 2016 to 2024
Data table for the long description
| Year | Improving (number of ecosystems) |
Stable (number of ecosystems) |
Declining (number of ecosystems) |
Unassessed (number of ecosystems) |
Stable/improving (percentage of ecosystems) |
|---|---|---|---|---|---|
| 2016 | 14 | 89 | 12 | 0 | 89.6 |
| 2017 | 23 | 81 | 14 | 0 | 88.1 |
| 2018 | 26 | 70 | 21 | 0 | 82.1 |
| 2019 | 27 | 73 | 17 | 0 | 85.5 |
| 2020 | 17 | 79 | 21 | 0 | 82.1 |
| 2021 | 23 | 70 | 24 | 0 | 79.5 |
| 2022 | 13 | 79 | 25 | 0 | 78.6 |
| 2023 | 16 | 78 | 24 | 1 | 79.7 |
| 2024 | 17 | 77 | 24 | 1 | 79.7 |
Download data file (Excel; 1.2 kB)
How this indicator was calculated
Note: Monitored ecosystems include forests, freshwater, wetlands, grasslands, shrublands, tundra, coastal/marine and glaciers, depending on what is present in each park. Akami-Uapishkᵁ-KakKasuak-Mealy Mountains National Park Reserve, Nááts'įhch'oh National Park Reserve, Thaidene Nëné National Park Reserve, Ukkusiksalik National Park, and Qausuittuq National Park did not report on ecological integrity in 2024. Rouge National Urban Park freshwater ecosystem was not assessed for trends in 2024.
Source: Parks Canada (2025) Protected Areas Establishment and Conservation Directorate.
The conditions and trends of ecosystems within national parks are evaluated regularly using a series of monitoring measures that are designed to track changes in biodiversity and natural processes (for example, plant and animal populations and soil properties) or stressors (for example, presence of invasive alien species) within those ecosystems. The condition of an ecosystem is determined by comparing these measures to threshold values and assigning a score to each measure. The scores are then averaged together to rate the condition of the ecosystem (good, fair, or poor). The trend of an ecosystem (improving, stable, declining) reflects a change in condition measures over a 5-year period (from 2019 to 2024). As measures may change over the 5-year period without crossing threshold values it is possible to have an improving or declining trend without a change in ecosystem condition.
Condition and trend must always be interpreted with caution. Because the condition represents an average of several monitoring measures, the condition may show no change over time, even if individual measures are improving or declining.
An ecosystem that is rated as good and stable is secure and likely to persist, and no major management actions like ecosystem restoration are required. Ecosystems whose condition is fair or has a declining trend indicates that the ecosystem is vulnerable, and management actions may be required. Poor ecological integrity indicates that the ecosystem is impaired, and significant management actions may be required. Improving ecological integrity results may indicate that restoration actions are working.
Results by ecosystem type
Key results
In 2024,
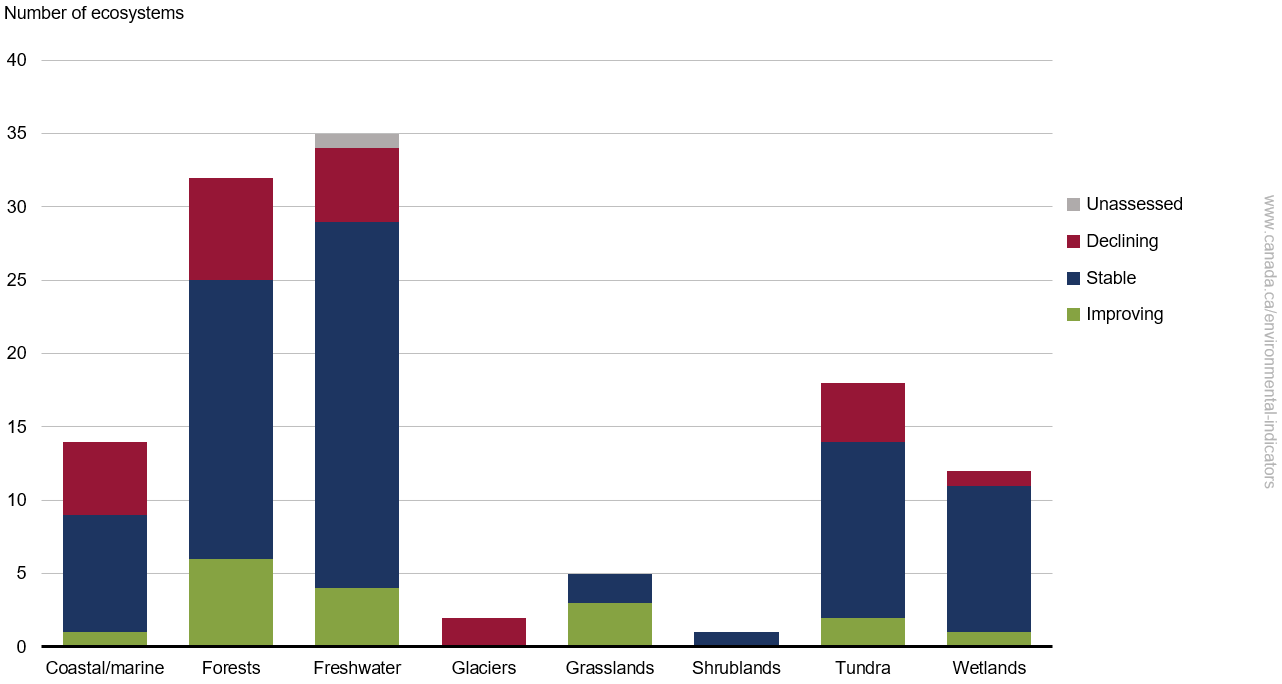
- All ecosystem types, except for glaciers, had stable or improving ecological integrity, ranging from 64% to 100%
- The ecosystem types with the most declining conditions included glaciers (100%), coastal/marine (36%), forests (22%) and tundra (22%)
- The ecological integrity of grasslands and shrublands were stable or improving in all parks
Ecological integrity trends of ecosystems in 43 national parks, Canada, 2024
Data table for the long description
| Ecosystem | Improving (number of ecosystems) |
Stable (number of ecosystems) |
Declining (number of ecosystems) |
Total (number of ecosystems) |
|---|---|---|---|---|
| Coastal/marine | 1 | 8 | 5 | 14 |
| Forests | 6 | 19 | 7 | 32 |
| Freshwater | 4 | 25 | 5 | 34 |
| Glaciers | 0 | 0 | 2 | 2 |
| Grasslands | 3 | 2 | 0 | 5 |
| Shrublands | 0 | 1 | 0 | 1 |
| Tundra | 2 | 12 | 4 | 18 |
| Wetlands | 0 | 10 | 1 | 12 |
| Ecosystem | Improving (percentage of ecosystems) |
Stable (percentage of ecosystems) |
Declining (percentage of ecosystems) |
|---|---|---|---|
| Coastal/marine | 7.1 | 57.1 | 35.7 |
| Forests | 18.8 | 59.4 | 21.9 |
| Freshwater | 11.8 | 73.5 | 14.7 |
| Glaciers | 0.0 | 0.0 | 100.0 |
| Grasslands | 60.0 | 40.0 | 0.0 |
| Shrublands | 0.0 | 100.0 | 0.0 |
| Tundra | 11.1 | 66.7 | 22.2 |
| Wetlands | 8.3 | 83.3 | 8.4 |
Download data file (Excel; 1.4 kB)
How this indicator was calculated
Note: Monitored ecosystems include coastal/marine, forests, freshwater, glaciers, grasslands, shrublands, tundra, and wetlands, depending on what is present in each park. Akami-Uapishkᵁ-KakKasuak-Mealy Mountains National Park Reserve, Nááts'įhch'oh National Park Reserve, Thaidene Nëné National Park Reserve, Ukkusiksalik National Park, and Qausuittuq National Park did not report on ecological integrity in 2024. Rouge National Urban Park freshwater ecosystem was not assessed for trends in 2024.
Source: Parks Canada (2025) Protected Areas Establishment and Conservation Directorate.
Declining ecological integrity in ecosystems may be due to stressors within the site or within the surrounding ecosystems. Some of the stressors affecting ecosystems in Canada’s national parks include
- habitat loss and degradation
- reduction of landscape connectivity (for example, building of roads and trails)
- climate change impacts (for example, increasing temperatures) and climate-mediated ecological changes and cumulative effects (for example, diseases and natural disturbances including increased wildfire size and severity)
- changes in abundance of keystone species (for example, wolves or bison)
- pollution and contaminants
- invasive species
- the reduction or exclusion of fire as a natural process in fire adapted ecosystems both from historic fire suppression and lack of Indigenous cultural fire, leading to increased risk of wildfires
Parks Canada implements management actions to conserve and restore species at risk and to improve ecological integrity when issues are identified. Each ecosystem responds differently to stressors and to management actions. It may take many years to make measurable improvements to ecological integrity and to demonstrate the ecological benefits of management actions.
In 2024, 27 conservation and restoration projects took place in 17 national parks. These projects aimed to improve the ecological integrity by restoring the natural ecosystems. In Elk Island National Park, the reintroduction of fire and targeted removal of invasive alien species contributed to restoring the ecological integrity of grassland ecosystems. Controlled fires and managing invasive plants improved food quality for grazing animals and brought back natural patterns of fire and grazing. As a result, 670 hectares of grassland are under active restoration, making native prairie ecosystems stronger and more resilient.
Data for individual parks
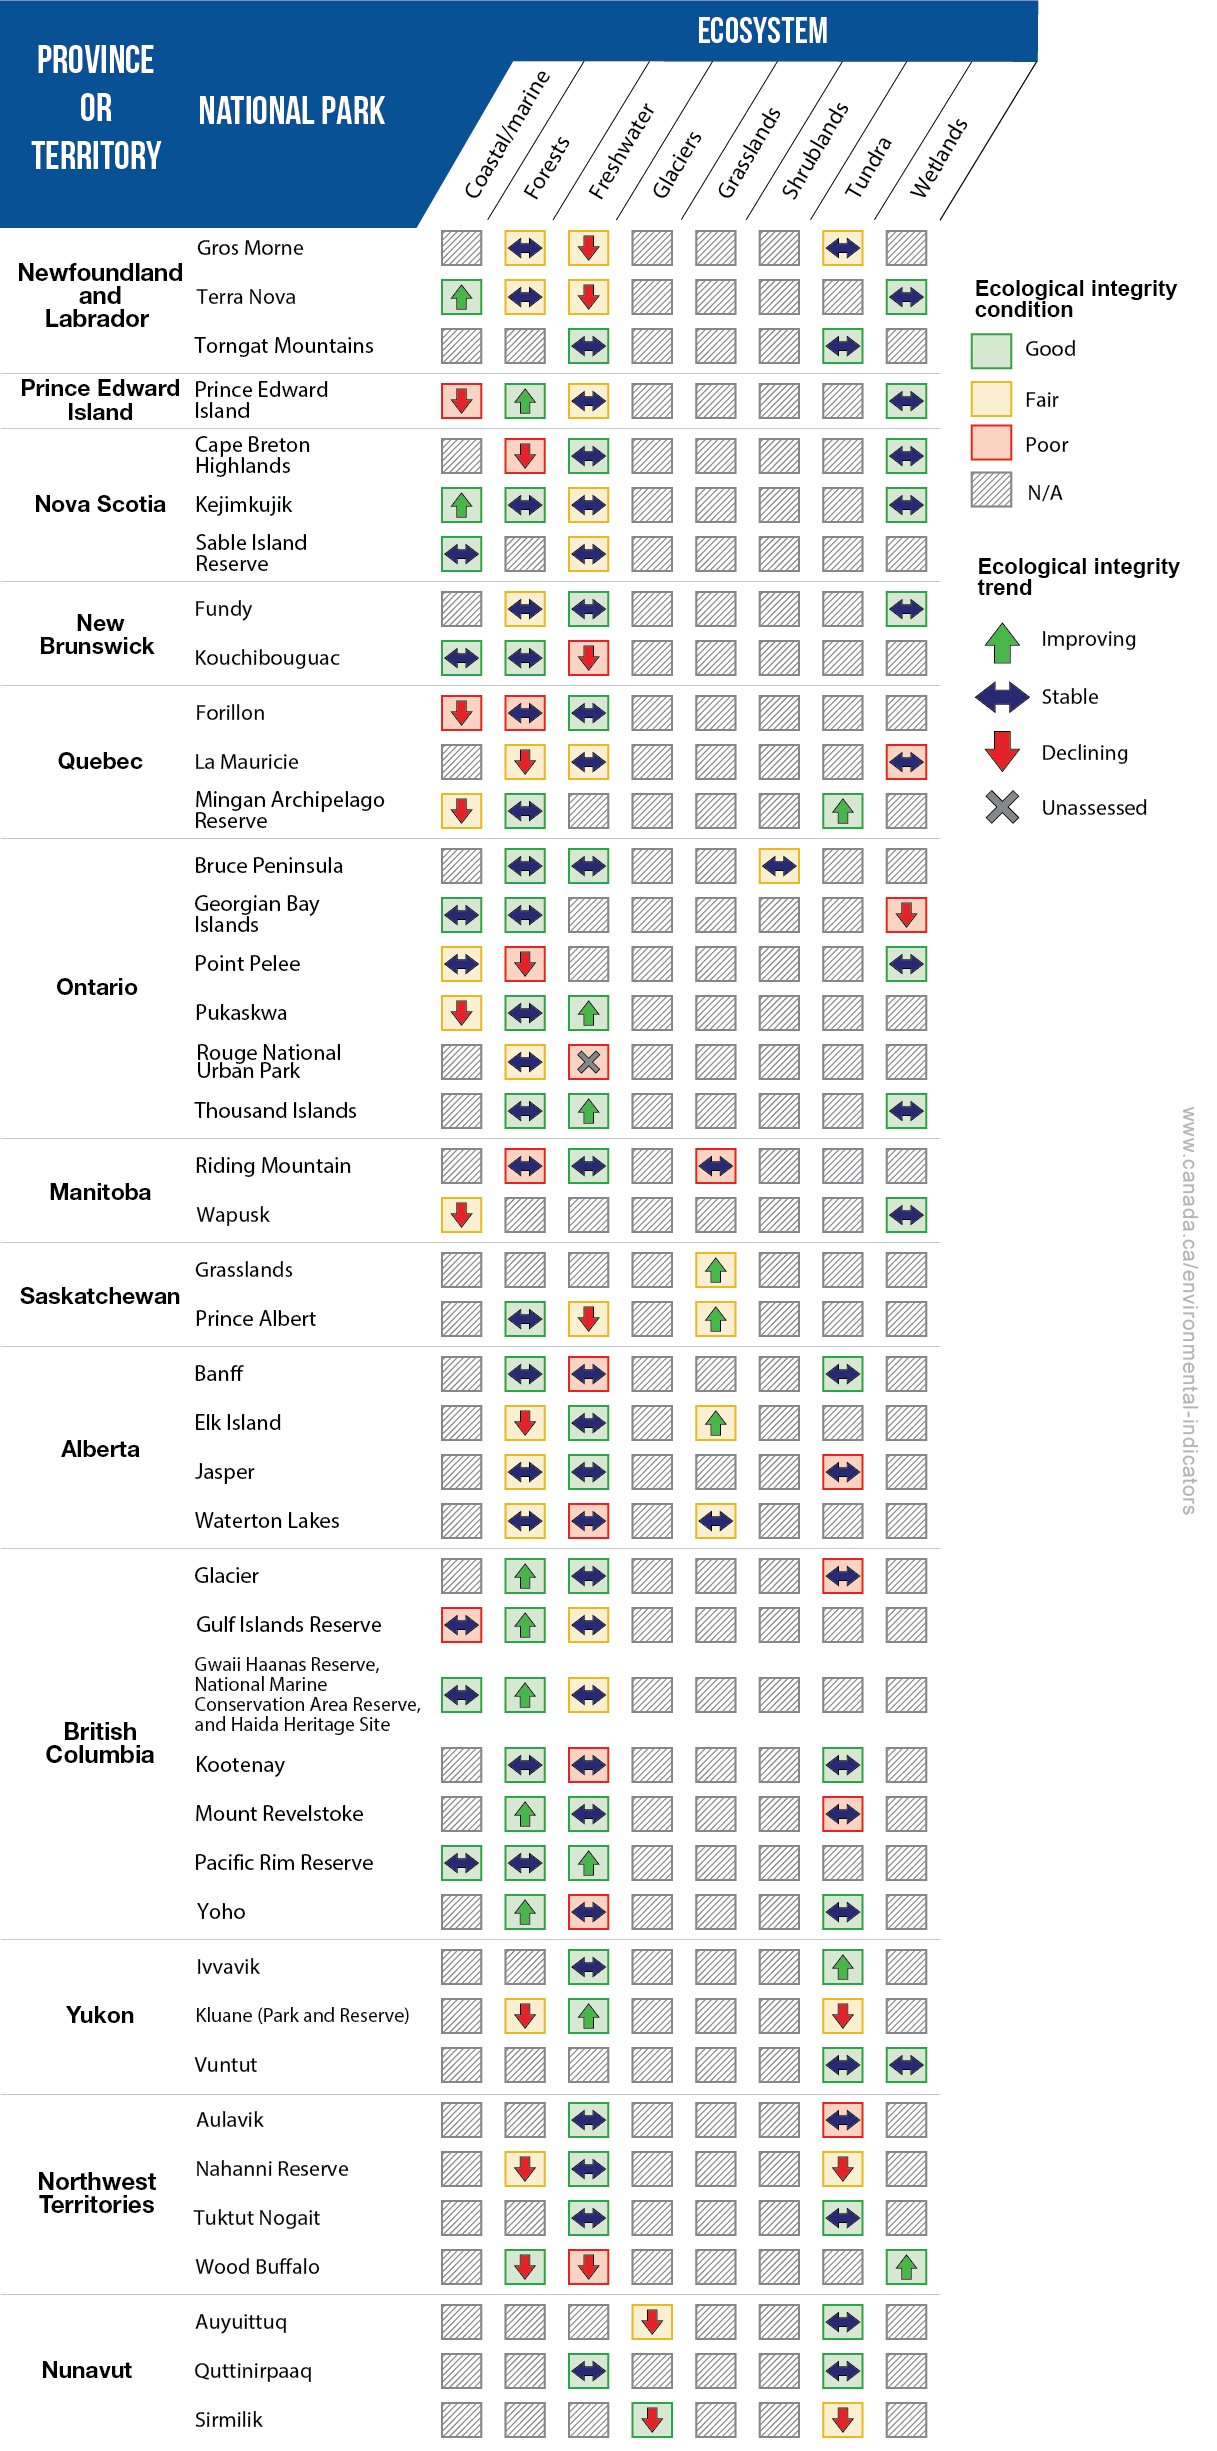
Ecological integrity conditions and trends of ecosystems in 43 national parks by province and territory, Canada, 2024
Data table for the long description
| Province or territory | National park | Ecosystem type | Ecological integrity condition | Ecological integrity trend |
|---|---|---|---|---|
| Newfoundland and Labrador | Gros Morne | Forests | Fair | Stable |
| Newfoundland and Labrador | Gros Morne | Freshwater | Fair | Declining |
| Newfoundland and Labrador | Gros Morne | Tundra | Fair | Declining |
| Newfoundland and Labrador | Terra Nova | Coastal/marine | Good | Stable |
| Newfoundland and Labrador | Terra Nova | Forests | Fair | Stable |
| Newfoundland and Labrador | Terra Nova | Freshwater | Fair | Declining |
| Newfoundland and Labrador | Terra Nova | Wetlands | Good | Stable |
| Newfoundland and Labrador | Torngat Mountains | Freshwater | Good | Stable |
| Newfoundland and Labrador | Torngat Mountains | Tundra | Good | Stable |
| Prince Edward Island | Prince Edward Island | Coastal/marine | Poor | Declining |
| Prince Edward Island | Prince Edward Island | Forests | Good | Improving |
| Prince Edward Island | Prince Edward Island | Freshwater | Fair | Stable |
| Prince Edward Island | Prince Edward Island | Wetlands | Good | Stable |
| Nova Scotia | Cape Breton Highlands | Forests | Poor | Declining |
| Nova Scotia | Cape Breton Highlands | Freshwater | Good | Stable |
| Nova Scotia | Cape Breton Highlands | Wetlands | Good | Stable |
| Nova Scotia | Kejimkujik | Coastal/marine | Good | Improving |
| Nova Scotia | Kejimkujik | Forests | Good | Stable |
| Nova Scotia | Kejimkujik | Freshwater | Fair | Stable |
| Nova Scotia | Kejimkujik | Wetlands | Good | Stable |
| Nova Scotia | Sable Island Reserve | Coastal/marine | Good | Stable |
| Nova Scotia | Sable Island Reserve | Freshwater | Fair | Stable |
| New Brunswick | Fundy | Forests | Fair | Stable |
| New Brunswick | Fundy | Freshwater | Good | Stable |
| New Brunswick | Fundy | Wetlands | Good | Stable |
| New Brunswick | Kouchibouguac | Coastal/marine | Good | Stable |
| New Brunswick | Kouchibouguac | Forests | Good | Stable |
| New Brunswick | Kouchibouguac | Freshwater | Poor | Declining |
| Quebec | Forillon | Coastal/marine | Poor | Declining |
| Quebec | Forillon | Forests | Poor | Stable |
| Quebec | Forillon | Freshwater | Good | Stable |
| Quebec | La Mauricie | Forests | Fair | Declining |
| Quebec | La Mauricie | Freshwater | Fair | Stable |
| Quebec | La Mauricie | Wetlands | Poor | Stable |
| Quebec | Mingan Archipelago Reserve | Coastal/marine | Fair | Declining |
| Quebec | Mingan Archipelago Reserve | Forests | Good | Stable |
| Quebec | Mingan Archipelago Reserve | Tundra | Good | Improving |
| Ontario | Bruce Peninsula | Forests | Good | Stable |
| Ontario | Bruce Peninsula | Freshwater | Good | Stable |
| Ontario | Bruce Peninsula | Shrublands | Fair | Stable |
| Ontario | Georgian Bay Islands | Coastal/marine | Good | Stable |
| Ontario | Georgian Bay Islands | Forests | Good | Stable |
| Ontario | Georgian Bay Islands | Wetlands | Poor | Declining |
| Ontario | Point Pelee | Coastal/marine | Fair | Stable |
| Ontario | Point Pelee | Forests | Poor | Declining |
| Ontario | Point Pelee | Wetlands | Good | Stable |
| Ontario | Pukaskwa | Coastal/marine | Fair | Declining |
| Ontario | Pukaskwa | Forests | Good | Stable |
| Ontario | Pukaskwa | Freshwater | Good | Improving |
| Ontario | Rouge National Urban Park | Forests | Fair | Stable |
| Ontario | Rouge National Urban Park | Freshwater | Poor | n/a |
| Ontario | Thousand Islands | Forests | Good | Stable |
| Ontario | Thousand Islands | Freshwater | Good | Improving |
| Ontario | Thousand Islands | Wetlands | Good | Stable |
| Manitoba | Riding Mountain | Forests | Poor | Stable |
| Manitoba | Riding Mountain | Freshwater | Good | Stable |
| Manitoba | Riding Mountain | Grasslands | Poor | Stable |
| Manitoba | Wapusk | Coastal/marine | Fair | Declining |
| Manitoba | Wapusk | Wetlands | Good | Stable |
| Saskatchewan | Grasslands | Grasslands | Fair | Improving |
| Saskatchewan | Prince Albert | Forests | Good | Stable |
| Saskatchewan | Prince Albert | Freshwater | Fair | Declining |
| Saskatchewan | Prince Albert | Grasslands | Fair | Improving |
| Alberta | Banff | Forests | Good | Stable |
| Alberta | Banff | Freshwater | Poor | Stable |
| Alberta | Banff | Tundra | Good | Stable |
| Alberta | Elk Island | Forests | Fair | Declining |
| Alberta | Elk Island | Freshwater | Good | Stable |
| Alberta | Elk Island | Grasslands | Fair | Improving |
| Alberta | Jasper | Forests | Fair | Stable |
| Alberta | Jasper | Freshwater | Good | Stable |
| Alberta | Jasper | Tundra | Poor | Stable |
| Alberta | Waterton Lakes | Forests | Fair | Stable |
| Alberta | Waterton Lakes | Freshwater | Poor | Stable |
| Alberta | Waterton Lakes | Grasslands | Fair | Stable |
| British Columbia | Glacier | Forests | Good | Improving |
| British Columbia | Glacier | Freshwater | Good | Stable |
| British Columbia | Glacier | Tundra | Poor | Stable |
| British Columbia | Gulf Islands Reserve | Coastal/marine | Poor | Stable |
| British Columbia | Gulf Islands Reserve | Forests | Good | Improving |
| British Columbia | Gulf Islands Reserve | Freshwater | Fair | Stable |
| British Columbia | Gwaii Haanas Reserve, National Marine Conservation Area Reserve, and Haida Heritage Site | Coastal/marine | Good | Stable |
| British Columbia | Gwaii Haanas Reserve, National Marine Conservation Area Reserve, and Haida Heritage Site | Forests | Fair | Declining |
| British Columbia | Gwaii Haanas Reserve, National Marine Conservation Area Reserve, and Haida Heritage Site | Freshwater | Good | Stable |
| British Columbia | Kootenay | Forests | Good | Stable |
| British Columbia | Kootenay | Freshwater | Poor | Stable |
| British Columbia | Kootenay | Tundra | Good | Stable |
| British Columbia | Mount Revelstoke | Forests | Good | Improving |
| British Columbia | Mount Revelstoke | Freshwater | Good | Stable |
| British Columbia | Mount Revelstoke | Tundra | Poor | Stable |
| British Columbia | Pacific Rim Reserve | Coastal/marine | Good | Stable |
| British Columbia | Pacific Rim Reserve | Forests | Good | Stable |
| British Columbia | Pacific Rim Reserve | Freshwater | Good | Improving |
| British Columbia | Yoho | Forests | Good | Improving |
| British Columbia | Yoho | Freshwater | Poor | Stable |
| British Columbia | Yoho | Tundra | Good | Stable |
| Yukon | Ivvavik | Freshwater | Good | Stable |
| Yukon | Ivvavik | Tundra | Good | Improving |
| Yukon | Kluane Reserve | Forests | Fair | Declining |
| Yukon | Kluane Reserve | Freshwater | Good | Improving |
| Yukon | Kluane Reserve | Tundra | Fair | Declining |
| Yukon | Vuntut | Tundra | Good | Stable |
| Yukon | Vuntut | Wetlands | Good | Stable |
| Northwest Territories | Aulavik | Freshwater | Good | Stable |
| Northwest Territories | Aulavik | Tundra | Poor | Stable |
| Northwest Territories | Nahanni Reserve | Forests | Fair | Declining |
| Northwest Territories | Nahanni Reserve | Freshwater | Good | Stable |
| Northwest Territories | Nahanni Reserve | Tundra | Fair | Declining |
| Northwest Territories | Tuktut Nogait | Freshwater | Good | Stable |
| Northwest Territories | Tuktut Nogait | Tundra | Good | Stable |
| Northwest Territories | Wood Buffalo | Forests | Good | Improving |
| Northwest Territories | Wood Buffalo | Freshwater | Poor | Declining |
| Northwest Territories | Wood Buffalo | Wetlands | Good | Improving |
| Nunavut | Auyuittuq | Glaciers | Fair | Declining |
| Nunavut | Auyuittuq | Tundra | Good | Stable |
| Nunavut | Quttinirpaaq | Freshwater | Good | Stable |
| Nunavut | Quttinirpaaq | Tundra | Good | Stable |
| Nunavut | Sirmilik | Glaciers | Good | Declining |
| Nunavut | Sirmilik | Tundra | Fair | Declining |
Download data file (Excel/CSV; 6.6 kB)
How this indicator was calculated
Note: N/A = not applicable. Rouge National Urban Park freshwater ecosystem was not assessed for trends in 2024.
Source: Parks Canada (2025) Protected Areas Establishment and Conservation Directorate.
About the indicator
About the indicator
What the indicator measures
The Ecological integrity of national parks indicator summarizes the condition (good, fair, poor) and trend (improving, stable, declining) of ecosystems within 35 national parks, 7 national park reserves and 1 national urban park.
Why this indicator is important
This indicator provides a measure of the condition of Canada's national parks, national park reserves and a national urban park. These parks help to protect biodiversity, preserve ecosystem services, connect landscapes, and provide a natural solution for climate change by capturing and storing carbon. They also help to build knowledge and understanding of ecosystems and connect Canadians with nature.
Parks Canada regularly monitors and assesses the condition of the main ecosystems in national parks (for example, forests, tundra, wetlands, or freshwater). Ecosystems are managed to improve or maintain ecological integrity. Management plans systematically address opportunities for improving the ecological integrity of these ecosystems.
Related initiatives
This indicator supports the measurement of progress towards Goal 15 of the 2022 to 2026 Federal Sustainable Development Strategy: Life on land – Protect and recover species, conserve Canadian biodiversity.
In addition, the indicator contributes to the Sustainable Development Goals of the 2030 Agenda for Sustainable Development. It is linked to Goal 15: Life on land.
It also is used for reporting on Target 3 of Canada’s 2030 Nature Strategy: "Protected and conserved areas (30x30)." This target is related to the Kunming-Montreal Global Biodiversity Framework Target 3: " Ensure and enable that by 2030 at least 30 per cent of terrestrial and inland water areas, and of marine and coastal areas, especially areas of particular importance for biodiversity and ecosystem functions and services, are effectively conserved and managed through ecologically representative, well-connected and equitably governed systems of protected areas and other effective area-based conservation measures, recognizing Indigenous and traditional territories, where applicable, and integrated into wider landscapes, seascapes and the ocean, while ensuring that any sustainable use, where appropriate in such areas, is fully consistent with conservation outcomes, recognizing and respecting the rights of Indigenous peoples and local communities, including over their traditional territories."
Related indicators
Canada's conserved areas indicators report the amount and proportion of Canada's terrestrial and marine area that is conserved.
The Global trends in conserved areas indicator compares Canada's protected area to a peer group of countries.
The Extent of Canada's wetlands indicator measures the extent of Canadian wetlands, and provides a baseline from which change can be measured.
Data sources and methods
Data sources and methods
Data sources
The indicator summarizes the condition and trend of ecosystems in the majority of national parks. Parks Canada regularly monitors the condition of ecosystems using a set of representative measures. Selected measures in each major park ecosystem are combined, and the ecosystem is scored as good, fair, or poor. Parks Canada began formally monitoring ecological integrity in 2008 and is ongoing.
More information
Ecological integrity is reported for major ecosystems in 43 of Canada's national parks, national park reserves and a national urban park. Data are not available for Akami-Uapishkᵁ-KakKasuak-Mealy Mountains National Park Reserve, Nááts'įhch'oh National Park Reserve, Thaidene Nëné National Park Reserve, Qausuittuq National Park and Ukkusiksalik National Park. Data may be unavailable if a site was recently established and has a very new monitoring program, or if the data have not yet been validated with partners.
Between 1 and 4 ecosystems are assessed in each park. Examples of ecosystems include forests, wetlands and glaciers. The selected ecosystems represent most of the area of a park and are important to its biological functioning. For each ecosystem, a scientifically sound set of environmental measures is developed, based on appropriateness, representativeness, monitoring needs and cost-effectiveness. Some examples of ecological integrity measures include wildlife population size, estimates of plant productivity, water quality and extent of invasive species. Data for these measures are gathered from a variety of sources, including on-the-ground field sampling, satellite imagery, automated monitoring systems, academic and government partners, and Indigenous knowledge. Measured values are compared to thresholds, such as whether a wildlife population is near a desirable size or whether water quality meets a standard threshold. When such thresholds are not available, interim thresholds based on available historical variability are used. The frequency of monitoring varies from annually to once a decade, depending on the specific measures.
For this report, data were collected in 2024, then collated and stored in Parks Canada's Information Centre for Ecosystems database to support management and reporting by the end of May 2025.
Datasets for individual measures are published in the Government of Canada Open Data Portal.
Methods
Ecological integrity monitoring is adapted to the ecology of each park. Information is gathered for each selected ecosystem, and a determination is made as to whether the ecosystem is in good, fair, or poor condition and whether that condition is improving, declining, or stable. Complete methods information is available in Parks Canada's 2011 Consolidated Guidelines for Ecological Integrity Monitoring in Canada's National Parks, available from Park Canada’s Protected Areas Establishment and Conservation Directorate.
More information
Ecosystem condition is determined from the monitoring results as follows: each measure is assigned a score based on its condition compared to its threshold (good = 2, fair = 1, poor = 0). If one-third or more of the measures are scored poor, the ecosystem-level indicator is also scored poor. If less than one-third of the measures are scored poor, the average score of the measures (weighted equally) determines the ecosystem score.
The assessment of the overall trend for each ecosystem is based on a change in its overall condition over 5 years, or in the trend of monitoring measures. If the condition of the ecosystem has not changed, it is considered stable unless a strong majority of the monitoring measures shows the same trend.
The national indicator (the percentage of ecosystems maintained or improved) is an overall assessment of the trend of ecological integrity across national parks. It is generated by dividing the number of ecosystems that are stable or improving by the total number of ecosystems monitored that have an assessed trend.
High quality ecological monitoring provides information that helps prioritize funding for ecological restoration projects to the ecosystems where it is needed most. In 2024, there were 27 conservation and restoration investments in 17 national parks and national park reserves, which improve the ecological integrity of these places.
Recent changes
The monitoring program was enhanced in 2024 by adding and improving ecological integrity measures. In total, 525 measures were assessed in 2024 as opposed to 523 in 2023. In 2024, Rouge Urban Park assessed 2 new measures in its forest ecosystem: bird communities and key tree species health.
In some cases, improved monitoring provided information that changed our understanding of the condition and trend of an ecosystem. For example, in Point Pelee National Park, the wetland ecosystem changed from fair in 2023 to good in 2024 because higher resolution imagery was used to monitor open water and edge habitat in the marsh. This imagery increased the number of small patches of open water observed in the ecosystem.
Caveats and limitations
The monitoring measures used to determine the condition and trend of ecosystems are chosen to represent the most important elements of the ecosystem and thus provide an indication, rather than a complete assessment, of ecological integrity. Monitoring takes place against a background of natural variability, and because many locations are remote and some measurements are time-consuming or expensive to conduct, the frequency of monitoring may be low. This leads to unavoidable uncertainty in assigning conditions and trends to ecosystems.
Ecosystems are not of equal area or of equal importance in national parks; comparisons between systems or between parks must be made with caution.
Some parks have not yet reported results, while others are basing their reporting on incomplete suites of measures that reflect current data availability. Monitoring methods are selected using objective techniques to provide credible overall assessments. Where information is incomplete, expert opinion, literature review, preliminary data and statistical principles are used to support the definition of thresholds.
The equal weighting of measures may not always reflect their relative ecological importance.
The data do not include provincial parks, other parks or other types of protected areas.
Resources
Resources
References
Government of Canada (2025) Canada National Parks Act.
Parks Canada (2021) State of Canada's Natural and Cultural Heritage Places 2021.
Willis S (2022) Projecting forest outcomes for Prince Edward Island National Park under climate change using a process-based forest landscape model. MSc. Thesis. University of New Brunswick.
Related information
Alternative format
Download the alternative format of the Ecological integrity of national parks indicator (PDF; 702 kB).
Interactive figures
Updated October 2025
This interactive figure supports the Ecological integrity of national parks indicator. Use it to explore the latest conditions and trends of each park and ecosystem in a dynamic and customizable format.
Select data by using the drop-down menu above each figure and clear your selections by clicking the "Reset figures" button on the right-hand side of the dashboard. All values in the figures will automatically update based on your selections.
You can also choose to use your keyboard to navigate the figures.
Download data file (Excel/CSV; 75.4 kB)
Note: n/a = not available. The charts are defaulted to show the ecological integrity of all parks monitored in Canada in 2024. When filtering for multiple parks, provinces and territories, the condition and trends will be reflected on the chart. Analysis between years should be interpreted with caution.
Source: Parks Canada (2025) Protected Areas Establishment and Conservation Directorate.
| Command | Shortcuts |
|---|---|
| Move focus to visual menu | Alt + Shift + F10 |
| Show as a table | Alt + Shift + F11 |
| Enter a visual | Ctrl + Right arrow |
| Enter a layer | Enter |
| Exit a layer or visual | Esc |
| Select or unselect data point | Space |
| Multi-select data points | Ctrl + Space |
| Show data point details | Ctrl + H |
| Clear data selection | Ctrl + Shift + C |
| Slicer control | Enter |