
Many Voices One Mind: a pathway to reconciliation – 2019-20 Departmental Progress Scorecard summary report
On this page
- List of acronyms and abbreviations
- Message from the Deputy Minister Champion for Indigenous Federal Employees
- Background
- Representation, hiring and retention
- Training, development and career advancement
- Executive talent management and advancement
- Moving forward
- Observations, challenges and recommendations
- Annex 1 MVOM departmental scorecard list of organizations
- Annex 2 List of career advancement programs for 2019-20
List of acronyms and abbreviations
- MVOM
- Many Voices One Mind
- MVOM DPS
- Many Voices One Mind Departmental Scorecard
- EX
- Executives
- WFA
- Workforce Availability
- KCII
- Knowledge Circle for Indigenous Inclusion
- IE
- Indigenous employees
- AE
- All employees
- IS
- Indigenous Students
- AS
- All Students
- NCR
- National Capital Region
- ADM
- Assistant Deputy Minister
- OCHRO
- Office of the Chief Human Resources Officer
- FSWEP
- Federal Student Work Experience Program
Message from the Deputy Minister Champion for Indigenous Federal Employees
Dear Colleagues,
On January 28, 2021, I reached out to 45 Deputy Heads to complete the Many Voices One Mind: Departmental Progress Scorecard (MVOM DPS) for 2019-20. I am pleased to report that all 45 responded and I am now able to present this Summary Report. This report highlights departmental progress made during 2019-20 fiscal year with a focus on quantitative results. Many thanks to the 45 organizations who shared their data on recruitment, retention, and career advancement of Indigenous employees. We know that this was not a simple task and while some were not able to provide all the data requested, this sample is sufficiently representative to validate our findings.
The data collected tells us that despite the rich resources, skills, and diversity they bring to the table, Indigenous Peoples continue to face multiple barriers to Federal Public Service employment. While we have made progress in some areas, we are falling short in many others. The data provided also showed that while a few departments have an understandably higher concentration of Indigenous employees, many departments still fall below the 4% Workforce Availability (WFA). Keeping in mind that WFA is a minimum target, not a ceiling, we must mobilize our collaborative efforts to ensure that representation is met across all departments if we truly want to reap the benefits of diversity. One indicator of success to support each other and reduce duplication of effort is sharing pre-qualified pools or inventories of Indigenous candidates so that once a department has filled its vacant positions, the pool or inventory can be made available to other departments to leverage resources. We must also target specific areas where there are identified recruitment gaps and find innovative ways to remedy these, preferably through interdepartmental or cluster based collaborative collective processes.
Despite not meeting Indigenous student recruitment rates in alignment with the WFA in our enterprise-wide recruitment programs, we have concrete examples of how targeted Indigenous student recruitment is yielding positive results in organizations that use this approach.
We also know that while we have solid developmental programs for aspiring EXs, offered in house by some organizations and the Canada School of Public Service, Indigenous employee enrollment rates are extremely low. We need to be deliberate about identifying Indigenous talent who can benefit from such programs. We must also continue to put in place various initiatives to help develop and retain our Indigenous talent such as increasing access to language training, mentorship programs and coaching and counselling services.
This departmental progress scorecard exercise also showed that departments are inconsistent with their data collection on Indigenous employees, making it a challenge to draw conclusions and related recommendations.
I am pleased that Deputy Ministers committed, and remain committed, to the implementation of the Many Voices One Mind (MVOM) Action Plan. In the past two years, I have had the privilege of working closely with the Knowledge Circle for Indigenous Inclusion (KCII) to support departments with the tracking, monitoring and reporting of work related to the recommendations and outcomes set out in the Action Plan. Together we are paving a more inclusive and progressive pathway for current and future Indigenous employees and leaders, while supporting the Call to Action for Anti-Racism, Equity and Diversity.
I encourage you to read the Summary Report and to share it throughout your organization. I also encourage you to continue building on the work that we have started as we continue to strive for a Federal Public Service that welcomes, respects and supports Indigenous peoples with their public service career.
In closing, I would like to express my gratitude to my people and the Algonquin Nation, on whose traditional territory we are able to do good work, and I wish to thank the Knowledge Circle for Indigenous Inclusion Research and Data Analysis Task Team members for their work leading to this Summary Report: Alexis Ford-Ellis, Vishnu Cheruvu, Youtian Hao, Patrice Martineau and Sean Coghlan.
Thank you, Merci, and Migwetch!
Gina Wilson
Deputy Minister, Women and Gender Equality
Deputy Minister, Diversity and Inclusion and Youth
Senior Associate Deputy Minister, Canadian Heritage
Background
The MVOM Action Plan is a whole-of-government strategy intended to address the barriers encountered by Indigenous Peoples seeking a position or already working in the public service. The strategy, released in December 2017, also seeks to influence public service culture and encourage behaviours that foster an environment where Indigenous employees are welcomed, respected and supported with their career in the public service. The following five objectives were established as fundamental to the strategy and overall MVOM Action Plan:
- Encourage and support Indigenous Peoples to join the Public Service;
- Address bias, racism, discrimination and harassment, and improve cultural competence in the Public Service;
- Address learning, developmental and career advancement concerns expressed by Indigenous employees;
- Recognize Indigenous Peoples’ talents and promote advancement to and within the executive group; and,
- Support, engage and communicate with Indigenous employees and partners.
September 2020 marked the release of the first Departmental Progress Scorecard Summary Report for 2018-19 on the implementation of the MVOM Action Plan that highlighted promising practices and areas that require additional focus and effort moving forward.
Following a request for more frequent reporting, on January 28, 2021, the Deputy Minister Champion for Federal Indigenous Employees invited Deputy Heads to share progress made in fiscal year 2019-20 in implementing the MVOM Action Plan via a streamlined version of the Departmental Progress Scorecard template. Of the 45 organizationsFootnote 1 who received the call-out,
- 22 belonged to schedule I of the Financial Administration Act;
- 17 belonged to schedule IV; and,
- Six belonged to schedule V.
In terms of size,
- 21 departments employed more than 5,000 employees;
- 17 between 500 to 5,000 employees;
- Six less than 500 employees; and
- One did not give information.
The MVOM Summary Report for 2019-20 (the Report) provides a consolidated reporting of the quantitative progress achieved in fiscal year 2019-20 following, and statistical analysis of federal Indigenous employees in three categories:
- Representation, hiring and retention;
- Training, development and career advancement; and,
- Executive talent management and advancement.
Departmental practices that focus on Indigenous inclusion are highlighted throughout the Report.
Representation, hiring and retention
Representation
In this area we asked responding organizations to:
- Identify the representationFootnote 2 of current Indigenous employees (IE) compared to all employees (AE) in their organization as of March 31, 2019 and March 31, 2020; and
- Then identify the departuresFootnote 3 of Indigenous employees compared to all other employees.
| Category | Indigenous Employees (IE) | All Employees (AE) | Proportion of IE | Response rate |
|---|---|---|---|---|
| Representation | ||||
| March 31, 2019 | 13,403Footnote 4 | 274,897 | 4.65% | 98% Footnote 5 |
| March 31, 2020 | 13,427 | 288,965 | 4.44% | 98%Footnote 6 |
| Departures | ||||
| March 31, 2020 | 2,077 | 54,505 | 3.81% | 95.55%Footnote 7 |
- On March 31, 2019, there were 13,403 Indigenous federal employees representing 4.65% of all employees in 44 of the 45 organizations surveyed.
- Of these 13,403 Indigenous employees, 4,360 (32.53%) were based in the NCR; the majority, 9,043 (67.47%) were based in the regions.
- By March 31, 2020, the number of Indigenous federal employees in the organizations we surveyed increased slightly to 13,427, representing 4.44% of all employees, which is a decline in the rate of representation of Indigenous employees from 4.65% in 2019.
- The number of Indigenous employees working in the NCR decreased from 4,360 in 2019 to 4,237 in 2020. At the same time, the number of Indigenous employees in the regions increased from 9,043 in 2019 to 9,190 in 2020.
- The rate of representation decreased in both the NCR (from 3.52% to 3.23%) and the regions (from 5.50% to 5.37%).
- A snap shot of departures on March 31, 2020 indicates 2,077 (3.81%) Indigenous employees departing by responding departments.
- Interestingly, six organizations (CSC, ISC, CRA, ESDC, DND (Civilians) and DFO) as of March 31, 2020, employed 7,875 (58.65%) of the total 13,427 Indigenous federal employees, according to 44 of the 45 organizations surveyed.
To provide valuable insights, the representation of Indigenous employees has been analyzed by clusters in line with those established by the Office of the Chief Human Resources Officer’s annual ADM Talent Management cycle. Deputy Minister discussions are held in clusters based on departmental mandate and theme (Economic, Government Operations Science, Security, and Social, Cultural, Justice) to review ADM talent management profiles and succession planning needs. This cluster approach ensures cross-pollination across organizations, forms potential new synergies, and enriches discussions on key positions and succession planning.
As reflected in the table below, the Economic, Government Operations and Science based Clusters fall below the WFA barrier, while the Security Social, Cultural and Justice Cluster are above.
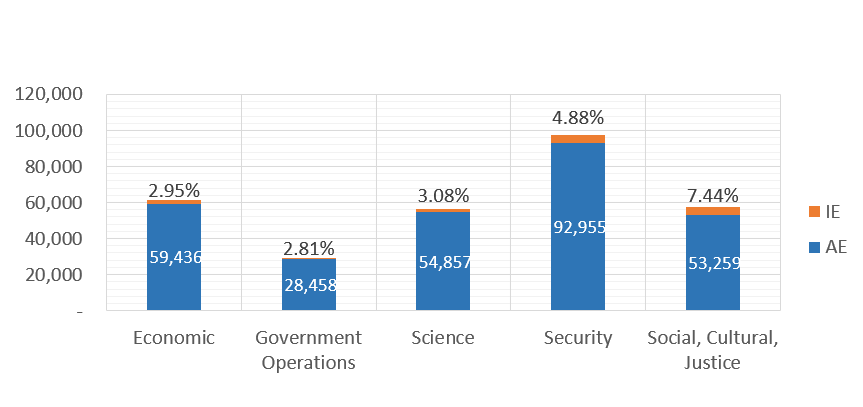
Text Alternative for Overall vs Indigenous Population in the 45 departments surveyed by cluster as of March 31, 2020
| Cluster | AE | IE | Proportion | Count |
|---|---|---|---|---|
| Economic | 59,436 | 1,809 | 2.95% | 9 |
| Government Operations | 28,458 | 824 | 2.81% | 7 |
| Science | 54,857 | 1,744 | 3.08% | 9 |
| Security | 92,955 | 4,767 | 4.88% | 11 |
| Social, Cultural, Justice | 53,259 | 4,283 | 7.44% | 9 |
Workforce availability and Indigenous representation
Workforce Availability (WFA) is the share of members of designated employment equity groups eligible for hiring. The WFA for Indigenous Peoples in 2019-20 was 4.0%. As per the 2019-20 Employment Equity (EE) Report from the Treasury Board Secretariat, the representation of employees who self-identified as Indigenous in the Core Public Administration was 5.1%.
Furthermore, according to data from Statistics Canada and the Office of the Chief Human Resources officer, the representation of Indigenous peoples for fiscal year 2019-20 is as follows:
| First Nations | Metis | Inuit | Other | Total |
|---|---|---|---|---|
| 2.1% | 2.1% | 0.1% | 0.8% | 5.1% |
While the total percentage of 5.1 may lead us to believe the representation goals are met and our public service is diverse, the representation data gathered and found in the chart below from 44 of the 45 surveyed organizations found that only a few organizations actually met or exceeded meeting representation of the WFA.
| Department | Total number of employees | Indigenous employees | Representation of Indigenous employee (REP) |
|---|---|---|---|
| AAFC | 5,661 | 191 | 3.37% (less than 3.5%) |
| ACOA | 644 | 16 | 2.48% (less than 3.5%) |
| CANNOR | 123 | 34 | 27.64% (more than 4%) |
| CBSA | 16,911 | 535 | 3.16% (less than 3.5%) |
| CFIA | 6,579 | 190 | 2.89% (less than 3.5%) |
| CIRNAC | 2,116 | 334 | 15.78% (more than 4%) |
| CRA | 46,577 | 1,464 | 3.14% (less than 3.5%) |
| CSA | 746 | 10 | 1.34% (less than 3.5%) |
| CSC | 20,306 | 1,992 | 9.81% (more than 4%) |
| CSE | 3,075 | 57 | 1.85% (less than 3.5%) |
| CSPS | 776 | 25 | 3.22% (less than 3.5%) |
| CED | 401 | 4 | 1.00% (less than 3.5%) |
| DFO | 13,795 | 613 | 4.44% (more than 4%) |
| ECCC | 8,182 | 230 | 2.81% (less than 3.5%) |
| ESDC | 30,292 | 1,195 | 3.94% (between 3.5% and 4%) |
| FEDA | 312 | 5 | 1.60% (less than 3.5%) |
| FIN | 942 | 15 | 1.59% (less than 3.5%) |
| DND (Civilians) | 25,023 | 847 | 3.38% (less than 3.5%) |
| GAC | 5,547 | 350 | 6.31% (more than 4%) |
| HC | 9,704 | 282 | 2.91% (less than 3.5%) |
| IAAC | 389 | 23 | 5.91% (more than 4%) |
| INFC | 724 | 14 | 1.93% (less than 3.5%) |
| IRBC | 1,731 | 46 | 2.66% (less than 3.5%) |
| IRCC | 9,124 | 233 | 2.55% (less than 3.5%) |
| ISC | 6,976 | 1,764 | 25.29% (more than 4%) |
| ISED | 5,916 | 132 | 2.23% (less than 3.5%) |
| JUS | 5,258 | 207 | 3.94% (between 3.5% and 4%) |
| NRCC | 4,979 | 108 | 2.17% (less than 3.5%) |
| NRCan | 4,410 | 46 | 1.04% (less than 3.5%) |
| PARKS | 7,156 | 526 | 7.35% (more than 4%) |
| PCH | 1,741 | 76 | 4.37% (more than 4%) |
| PCO | 1,101 | 25 | 2.27% (less than 3.5%) |
| PHAC | 2,545 | 74 | 2.91% (less than 3.5%) |
| PSC | 863 | 34 | 3.94% (between 3.5% and 4%) |
| PSPC | 15,810 | 446 | 2.82% (less than 3.5%) |
| PS | 1,289 | 49 | 3.80% (between 3.5% and 4%) |
| RCMP (PS) | 8,036 | 441 | 5.49% (more than 4%) |
| SSC | 7,718 | 228 | 2.95% (less than 3.5%) |
| StatCan | 5,897 | 128 | 2.17% (less than 3.5%) |
| TBS | 2,072 | 51 | 2.46% (less than 3.5%) |
| TC | 6,680 | 217 | 3.25% (less than 3.5%) |
| VAC | 3,654 | 138 | 3.78% (between 3.5% and 4%) |
| WAGE | 226 | 9 | 3.98% (between 3.5% and 4%) |
| WD | 385 | 23 | 5.97% (more than 4%) |
- Eleven (11) indicated that the number of Indigenous employees within their organizations exceeds (more than 4%) the WFA.
- Six (6) indicated that the number of Indigenous employees within their organizations approaches (3.5% to 4%) the WFA; and,
- Twenty-seven (27) indicated that the number of Indigenous employees within their organizations is below (less than 3.5%) the WFA.
Hiring
In this area, we asked responding organizations:
- What is the total number of new Indigenous employees (IE) recruited in 2019-20, compared to the total number of (all) hires (AE)?
| Hiring Category | IE | AE | Proportion of IE hires | Response rate |
|---|---|---|---|---|
| Overall hires | 1,722 | 57,723 | 2.98% | 89%Footnote 8 |
| Non-Executive | 1,699 | 56,869 | 2.98% | 89% |
| Executive | 23 | 854 | 2.69% | 89% |
| Casual, Student and Terms less than 6 months | 1,081 | 35,015 | 3.09% | 68.89%Footnote 9 |
- There was recruitment of 1,043 Indigenous hires in the regions compared to 679 Indigenous hires in the NCR. In all categories highlighted in the Hiring Category chart, the proportion of hires is below the WFA.
- Of the 23 new Indigenous executive hires, seventeen appointments were made in the NCR and six appointments were made in the regions.
- Based on data provided by 31 departments, 1,081 (62.27%) were casual workers, students, or term position appointments of less than six months.
The results show that Indigenous Peoples are interested in joining the Federal Public Service, but far too many are hired through short duration contracts, contributing to an ongoing under-representation. More longer-term employment opportunities are required to ensure Indigenous employee representation meets or exceeds the WFA across all departments and sectors and at all levels.
Student recruitment
In this area we asked responding organizations to:
- Identify the total number of Indigenous students (IS) hired in 2019-20 compared to the total number of students (AS) hired in 2019-20.
Enterprise-wide programs identified for student recruitment and bridging are Federal Student Work Experience Program (FSWEP), Research Affiliate Program (RAP), Post Secondary Recruitment Program (PSR). Targeted departmental initiatives were also included.
| Program | IS | AS | Proportion of IE | Response Rate |
|---|---|---|---|---|
| FSWEP | 305 | 13,547 | 2.25% | 75.56%Footnote 10 |
| Targeted Departmental Initiatives | 172 | 4,702 | 3.66% | 26.67%Footnote 11 |
| RAP | 5 | 345 | 1.45% | 20.00%Footnote 12 |
| PSR | 4 | 166 | 2.41% | 24.44%Footnote 13 |
- The targeted departmental initiatives had much better recruitment results than the enterprise-wide programs, nearly aligning with the WFA, while the others fell significantly short.
- Of the 305 Indigenous FSWEP students, 170 students were hired in the regions and 135 students were hired in the NCR.
- Targeted departmental recruitment initiatives accounted for 177 Indigenous student (47 in NCR and 130 in the regions) hires.
- Through RAP, five Indigenous students were hired, with 100% of these hires in the regions.
- Through PSR, four Indigenous students (one in NCR and three in the regions) were hired.
Targeted departmental Indigenous student recruitment initiatives are currently delivering better results and we would encourage organizations to also focus effort on targeted recruitment to increase participation rates of Indigenous candidates.
There are many talented Indigenous students in the regions and in Northern communities that could be potential hires if we are better able to leverage working remotely. Organizations, even those without regional offices, should take advantage of the virtual environment we now work in to hire students in the regions and allow them to work from their communities.
Key Indigenous student recruitment initiatives include
- Agriculture and Agri-Food Canada’s engaging Indigenous Student Recruitment Initiative has been active for the past five years and demonstrates that targeted active recruitment increases representation.
- The Canada Border Services Agency (CBSA) provides opportunities to students through (FWSEP) and the Indigenous Student Employment Opportunity (ISEO). Created in 2018, the Indigenous Affairs Secretariat (IAS) stewards the implementation of the Agency’s Indigenous Framework and Strategy; and one of the components of the Strategy focuses on Indigenous recruitment, retention, and career advancement. While employed by the CBSA, Indigenous students have access to a variety of training programs, are supported by both national and regional Indigenous Advisory Circles (including an Indigenous Employee Network) and are invited to contribute their unique voices and experiences to Agency priorities and programs, including mentorship opportunities.
- The Public Service Commission’s Indigenous Student Employment Opportunity (ISEO) is a nationwide initiative that enables the recruitment and inclusion of students who identify as Indigenous. As part of the Federal Student Work Experience Program (FSWEP), ISEO focuses on the employment experience of Indigenous students by providing a culturally tailored onboarding process, training, activities, mentorship, and support services designed for hiring managers and Indigenous students to increase retention.
Retention
In this area we asked responding organizations to:
- Identify retention of Indigenous employees (IE) hired in 2019-20 compared to retention of all new employees (AE) hired.
| Category | IE | AE | Proportion of IE | Response rate |
|---|---|---|---|---|
| Students | 38 | 1,876 | 4.03% | 71.11%Footnote 14 |
| Casuals and term employees | 279 | 10,802 | 3.57% | 73.33%Footnote 15 |
As the public service ages, youth become essential to renewing the Public Service age demographic. Between 2006 and 2016, Indigenous youth grew by 42.5%, the fastest growing demographic in Canada. This is good news and we must leverage this dynamic demographic and ensure that Indigenous youth are well represented in the federal public service.
Ensuring the student experience is positive is of critical importance not only for students to be able to excel and contribute early on, but also to bolster the Public Service’s future recruitment efforts.
Departures - exit interviews
In this area we asked responding organizations:
- Do you have an Exit Interview Program?
| Status of exit interviews | Number of departments |
|---|---|
| Implemented | 17 |
| Not implemented | 7 |
| Data not available | 21 |
Seventeen organizations indicated that they implement exit interviews for students, term and casual employees, employees on micro assignments, indeterminate employees, and retirees. Seven organizations indicated that they do not implement exit interviews, and 21 indicated the data is not available or not applicable, as they are not tracking this data.
Employees leave an organization for varied reasons. Departmental exit interviews can provide concrete information on why an employee is leaving. The 2019-20 MVOM DPS asked departments if they had an exit interview program in seven response areas:
- for all students;
- end of term employees;
- casual employees;
- employees on assignment or secondment;
- employees on micro assignment;
- resignation of indeterminate employee; and
- retirement.
Moving forward, organizations may wish to consider a formal exit interview program for Indigenous employees to gain a better understanding of their departures and potential areas of focus to ensure that work environments are welcoming for Indigenous employees. This could be a unique opportunity to get some real insight to help shape future Human Resource policies and practices related to Indigenous employees.
Networks
In this area we asked responding organizations to:
- Identify Departmental Networks specifically for Indigenous employees.
The work leading to the MVOM Action Plan identified the presence of departmental Indigenous employee networks as a positive practice that could influence employee satisfaction and well-being. The number of organizations with Networks is very promising, and one to encourage for further growth moving forward.
- There were 24 organizations (53.33%) that instituted Indigenous employee networks within their organizations a complement to other departmental diversity networks that extend to other employment equity groups.
- Networks are at various maturity levels. Some are more established and formal than others; they also undertake a wide range of activities, from relationship building and knowledge sharing to supporting employee wellness and providing advisory services on career planning and advancement.
Examples of departmental networks include
- CanNor’s Inuit Employee Network works to promote training opportunities, offers peer support, discusses mentorship opportunities and identifies innovative activities to promote cultural awareness across the Agency.
- The Canada Border Services Agency’s Indigenous Employee Network provides a safe space for Indigenous employees from the NCR and the regions, to come together to engage in open dialogue and to support one another.
- Correctional Services Canada’s Connecting Spirits, Creating Opportunities, is a wellness and networking initiative for Indigenous employees which supports career planning, networking and support through cultural and employment-related activities. CSC’s national Elder holds monthly talking circles for participants, offers one-on-one support sessions, and provides guidance for the direction of the initiative.
- Employment and Social Development Canada’s Indigenous Employee Circle is a network for First Nations, Métis and Inuit employees of the department. Established 10 years ago, the network also welcomes allies who support a positive and inclusive workplace for Indigenous employees.
- Health Canada’s Indigenous Employee Network (IEN) was re-established in 2018-19 following the transfer of the First Nations and Inuit Health Branch to Indigenous Services Canada.
- Public Health Agency of Canada’s Indigenous Employee Network vision is to be a proactive voice on workforce and workplace issues that affect Indigenous peoples. Consultation with new Indigenous employees has been initiated.
- Public Services and Procurement Canada has four regional Indigenous Circle of Employees that provide a safe space for Indigenous employees to meet and discuss opportunities, to provide support and guidance to Indigenous employees, as well as identify opportunities to advance reconciliation at the department.
Champions and chairs
In this area we asked responding organizations to:
- Identify if you have a departmental Champion and /or Chair for Indigenous Employees or Indigenous Employee Networks.
Departmental Champions are senior officials usually at the Assistant Deputy Minister or Director General level, who represent a group of employees or an initiative within their departments. Departmental Champions demonstrate a commitment by the organization, and they bring forward issues and best practices to the senior management tables for discussion, decision and implementation. The numbers are impressive and we hope to see this trend continue.
| Presence of Champions | NCR | Regional |
|---|---|---|
| Have at least one Champion | 31 | 21 |
| Do not have a Champion | 11 | 14 |
| No response | 3 | 10 |
- Out of the 45 organizations, 31 identified having at least one NCR Champion, 11 said they did not have an NCR Champion, and three did not clarify whether they have an NCR Champion.
- Similarly, 21 organizations identified at least one Regional Champion, 14 said they did not have a Regional Champion, and 10 did not clarify whether they have a Regional Champion.
Departmental Chairs are usually employees who may self-identify as Indigenous or be a strong ally. The Chair /co-Chair advocate alongside their fellow Indigenous colleagues to address recruitment, retention and career advancement within their particular organization. Chairs and co-Chairs work directly with their internal corporate services on the administration and secretariat of their respective Indigenous network /committee.
| Presence of Chairs | NCR | Regional |
|---|---|---|
| Have at least one Chair | 22 | 20 |
| Do not have a Chair | 16 | 17 |
| No response | 7 | 8 |
- Out of the 45 organizations, 22 identified at least one NCR Chair, while 16 said they did not have an NCR Chair, and seven did not clarify whether they have an NCR Chair.
- Similarly, 20 organizations identified at least one Regional Chair, 17 said they did not have a Regional Chair, and eight did not clarify whether they have a Regional Chair.
Training, development and career advancement
In this area we asked responding organizations to:
- Identify career advancement programs and the number of Indigenous employees (IE) in the executive feeder groups participating in such programs compared to the total number of employees (AE) in the executive feeder groups participating on these programs.
| IE | AE | Proportion of IE | Response rate |
|---|---|---|---|
| 73 | 1,653 | 4.42% | 37.78%Footnote 16 |
Training and development programs enhance employee performance, equip employees to prepare for the future, and complement effective recruitment to ensure that public servants continue to have the skills and expertise required to fulfill their departmental mandates over the longer term.
Training and development also play a foundational role in developing and advancing mid-career public servants and the executive feeder groups (EX minus 1, EX minus 2 and equivalents, also referred to as ‘executive feeder groups’) into executive positions and future leaders. The Federal Public Service has moved to a more strategic talent management enabling approach, inviting Deputy Heads to identify high potential candidates to participate in leadership development programs offered by the CSPS or other targeted University led leadership programs.
Analysis of data on training, development and career advancement programs for mid-career public servants yielded the following observations:
- Twenty-three organizations identified supporting one or two career advancement programs; six identified using three or more career advancement programs; and sixteen do not track engagement of their employees in training, development and career advancement initiatives.
- Those that do track this information do not have a mechanism in place to follow their employees who have self-identified as an Indigenous person upon appointment.
- Four organizations identified as having their own leadership development programs; and four provided career advanced programs for all employees, in addition to career development opportunities provided by the Canada School of Public Service.
Promising departmental initiative that focuses on career learning for Indigenous employees:
- Indigenous Services Canada’s Aboriginal Employee Development Initiative (AEDI) encourages career advancement for Indigenous employees by offering programs such as
- the Aboriginal Management Development Program;
- Aboriginal Career Management for Employees;
- the Aboriginal Employees Supports Program; and
- the CSPS Aspiring Directors Program.
Parks Canada – Indigenous Employee Training Fund (IETF) offers $2,500 per person per year to support Indigenous employees within their professional development. In 2019-20, $80,000 was allocated for the IETF, with 16 applicants being fully funded and 12 applicants being partially funded.
Mentorship
In this area we asked responding organizations to:
- Identify number of Indigenous employees (IE) enrolled in a mentorship program as a mentee, compared to total number of enrolled employees (AE).
| Overall employees | Executive feeder groups | Response rate | ||||
|---|---|---|---|---|---|---|
| IE | AE | Proportion of IE | IE | AE | Proportion of IE | |
| 13 | 922 | 1.40% | 7 | 447 | 1.56% | 13.34%Footnote 17 |
Most organizations do not have a formal mentorship program as reflected by the low response rate. Some have assembled mentoring guides to facilitate informal mentoring in their organization. These guides explain the roles and responsibilities of mentors and mentees and provides tools and tips for establishing and maintaining successful mentoring relationships.
- Eight departments – AAFC, CSC, CSIS, ESDC, DND, INFC, JUS, STATCAN – reported 2,141 employees, at all levels, and 569 employees in their organizations’ executive feeder groups, enrolled in a mentorship program for 2019-20.
- Justice Canada has an active mentorship program and 606 employees at all levels were enrolled for 2019-20; however, less than 1%, (only 5 participants) identify as Indigenous.
Acting appointments and assignments
In this area we asked responding organizations to:
- Identify the number of Indigenous employees (IE) compared to total number of (all) employees (AE) in an acting appointment (duration more than four months) or assignment
| Type of employment | IE | AE | Proportion of IE | Response rate |
|---|---|---|---|---|
| Acting Appointments | 991 | 33,773 | 2.93% | 80%Footnote 18 |
| Assignments | 58 | 2,270 | 2.55% | 66.67%Footnote 19 |
Since acting appointments and assignments provide opportunities for on-the-job learning and preparation for promotional opportunities, the proportional rates of opportunities should be at the very least equal to the 5.1% representation reported by OCHRO and StatCan. This is an area that will require more deliberate action moving forward.
Language training
In this area we asked responding organizations to:
- Identify number of Indigenous employees (IE) (overall and at EX minus 1 and 2 levels) enrolled in second language learning (French or English), within the reporting period, compared to total number of employees (AE) enrolled in second language learning.
| Number of employees | IE | AE | Proportion of IE | Response Rate |
|---|---|---|---|---|
| Overall Employees | 230 | 9,165 | 2.51% | 55.55% |
| Employees in EX feeder groups | 28 | 1,233 | 2.27% | 44.44% |
Parks Canada shared a unique training initiative: Indigenous Employee Training Fund (IETF)
In 2019, $20,000 of funding was allocated to support Indigenous language learning opportunities of which six applicants were funded to support Indigenous language learning opportunities.
- CanNor, Parks and StatCan identified 31 Indigenous employees enrolled in Indigenous language learning.
Official language proficiency is so critical to the career advancement of all public servants, we are hoping to see more concrete initiatives by organizations to ensure that their Indigenous employees are being encouraged to enroll and that their managers strongly support this type of developmental opportunities as part of individual learning plans.
Executive talent management and advancement
In this area we asked responding organizations to:
- Identify number of Indigenous executives (IE) (EX or equivalent) compared to the total number of executives (AE) (EX or equivalent) as of March 31, 2020.
| Level | IE | AE | Proportion of IE | Response rateFootnote 20 |
|---|---|---|---|---|
| EX-01 | 125 | 2,922 | 4.28% | 77.77% |
| EX-02 | 43 | 1,367 | 3.15% | 80% |
| EX-03 | 28 | 957 | 2.93% | 80% |
| EX-04 | 4 | 241 | 1.66% | 77.77% |
| EX-05 | 4 | 128 | 3.13% | 73.33% |
- As of March 31, 2020, 36 of the 45 organizations reported 246 Indigenous executives, with 76 Indigenous executives in the regions and 170 Indigenous executives in the NCR. With the exception of EX-01, Indigenous employees are under-represented in the EX-02 to EX-05 levels.
Health Canada initiated commitments in 2020-21 fiscal year addressing Indigenous recruitment at the executive levels by mandating targets for hiring Indigenous executives; launching an Indigenous inventory; and updating essential educational qualifications to be more inclusive of Indigenous employees.
Executive pools
In this area we asked responding organizations to:
1. Identify the numbers of Indigenous employees who qualified in existing Executive pool(s).
- Within the 45 organizations surveyed 21 established executive pools comprising of 1,185 qualified employees, and 33 (2.78%) are Indigenous employees.
- In addition, ESDC qualified 43 Indigenous employees into one EX-01 partially qualified pool.
- There were 16 organizations reporting 433 employees appointed into executive positions, and seven (1.61%) were Indigenous employees.
Canada Northern Development Agency located in Iqaluit, Nunavut, currently has up to 40% representation of Indigenous employees and is working at increasing representation in the Executive cadre.
Moving forward
The 2019-20 MVOM Departmental Progress Scorecard Summary Report provides a snapshot of the status of Indigenous federal employees and the implementation of the MVOM Action Plan and can inform reporting on Clerk’s Call to Action on Anti-racism, Equity and Inclusion in the Federal Public Service released in January 2021.
KCII is working on encouraging collaboration and bringing more system-wide coherence to support the work of departments in building a strong foundation of tools available to federal employees, and to include Indigenous perspectives while building those tools.
KCII recently launched tools that support Indigenous employees:
- A Career Roadmap and Learning Chart for Indigenous employees that is integrated as part of the TBS-OCHRO Indigenous Career Pathways Portal, and courses offered by the CSPS.
- An Indigenous Executive Inventory to support developmental or promotional opportunities.
- An Indigenous Ambassadors and Speakers Circle (PDF format), in collaboration with the TBS-OCHRO Federal Speakers’ Forum for Diversity and Inclusion.
- Delivery of Wellness Talking and Sharing Circles and guidance to support access to safe spaces grounded in culturally relevant and respectful guiding principles.
KCII is working alongside Indigenous departmental collaborators on the following initiatives:
- An Indigenous Wellness Strategy
- An Executive Coaching and Counselling Circle
- An Indigenous Career Navigators Circle
- A National Advisory Circle of Elders and Knowledge Keepers in partnership with key departments
In response to the call for more frequent reporting on the implementation of the MVOM Action Plan, the KCII Research and Data Analysis Circle will continue to track, monitor, and report on progress. The next version of the Departmental Progress Scorecard will include qualitative questions to gain greater insight into the impacts of organizational measures undertaken to support Indigenous inclusion.
Observations, challenges and recommendations
The following outlines some observations, challenges as well as recommendations that departments and organizations may wish to consider.
| Observation/Challenge | Recommendation |
|---|---|
| Despite incredible growth in the Indigenous youth demographic, Indigenous student representation is quite low. | Departments should do more targeted Indigenous student recruitment as this have proven to yield very promising results. We also suggest that managers in the NCR consider employing Indigenous students outside the NCR. As we work in a more virtual environment, these work arrangements are becoming more acceptable and feasible. |
| New Indigenous recruits are often appointed for short duration contracts (casual and terms less than 6 months). | Departments need to ensure that they have the resources in place to support those who would like to join the Federal Public Service on an indeterminate basis. |
| Career development programs have low Indigenous employee enrollment. | Departments must ensure that there is an appropriate proportion of Indigenous employees within their organizations participating career advancement programs. |
| Despite having various official languages training opportunities, Indigenous employee participation rates are quite low. | Managers across the public service should be strongly encouraging Indigenous employees to participate in official language training and fully supporting Indigenous employees wishing to improve their language profile. |
| Pre-qualified pools and inventories restricted to Indigenous candidates exist but are not being fully leveraged. | There should be a central repository for Indigenous pre-qualified pools and inventories, and these should be actively shared. |
| Indigenous WFA targets are not being met across all departments. | Departments who are not meeting the current 4% WFA target should implement a policy to encourage hiring managers to use targeted recruitment strategies. |
| Many departments /agencies are not tracking data related to Indigenous recruitment, retention or career development /advancement. Therefore, many departments provided information with footnotes or comments explaining what occurs within their organization. | It is important that departments set up appropriate systems for tracking Indigenous employees who self-identify as well as the appropriate reporting systems to be able to track the associated recruitment, retention as well as training and development data of Indigenous employees. Not only will this support the evaluation of progress on the MVOM, but also implementation of the Call to Action given overlapping objectives. |
Annex 1 MVOM departmental scorecard list of organizationsFootnote 21
| Department | Name/Nom | NCR Only | Region HQ |
|---|---|---|---|
| AAFC/AAC | Agriculture and Agri-Food Canada/Agriculture et Agroalimentaire Canada | - | - |
| ACOA/APECA | Atlantic Canada Opportunities Agency/Agence de promotion économique du Canada atlantique | - | X |
| CANNOR | Canadian Northern Economic Development Agency/Agence canadienne de développement économique du Nord | - | - |
| CBSA/ASFC | Canada Border Services Agency/Agence des services frontaliers du Canada | - | - |
| CFIA/ACIA | Canadian Food Inspection Agency of Canada/Agence canadienne d’inspection des aliments | - | - |
| CIRNAC/RCAANC | Crown-Indigenous Relations and Northern Affairs Canada/Relations Couronne-Autochtones et Affaires du Nord Canada | - | - |
| CRA/ARC | Canada Revenue Agency/Agence du revenu du Canada | - | - |
| CSA/ASC | Canadian Space Agency/Agence spatiale canadienne | X | - |
| CSC /SCC | Correctional Service of Canada/Service correctionnel du Canada | - | - |
| CSE/CST | Communications Security Establishment/Centre de la Sécurité des télécommunications | X | - |
| CSIS/SCRS | Canadian Services Intelligence Service/Service Canadien du renseignement de Sécurité | - | - |
| CSPS/EFPC | Canada School of Public Service/École de la fonction publique du Canada | - | - |
| CED/DEC | Canada Economic Development for Quebec Regions/Développement économique pour les régions du Québec | - | X |
| DFO/MPO | Fisheries and Oceans Canada/Pêches et Océans Canada | - | - |
| ECCC | Environment and Climate Change Canada/Environnement et Changement climatique Canada | - | - |
| ESDC/EDSC | Employment and Social Development Canada/Emploi et Développement social Canada | - | - |
| FEDA/AFDE | Federal Economic Development Agency for Southern Ontario/Agence fédérale de développement économique pour le Sud de l'Ontario | - | X |
| FIN | Department of Finance Canada/Ministère des Finances Canada | X | - |
| DND/MDN | Department of National Defence/Ministère de la Défense Nationale | - | - |
| GAC/AMC | Global Affairs Canada/Affaires Mondiales Canada | - | - |
| HC/SC | Health Canada/Santé Canada | - | - |
| IAAC/AEIC | Impact Assessment Agency of Canada/Agence d’évaluation d’impact du Canada | - | - |
| INFC | Infrastructure Canada/Infrastructure Canada | - | - |
| IRBC/CISRC | Immigration Refugee Board of Canada/Commission de l’immigration et du statut de réfugié du Canada | - | - |
| IRCC | Immigration, Refugees and Citizenship Canada/Immigration, Réfugiés et Citoyenneté Canada | - | - |
| ISC/SAC | Indigenous Services Canada/Services aux Autochtones Canada | - | - |
| ISED/ISDE | Innovation, Science and Economic Development Canada/Innovation, Sciences et Développement économique Canada | - | - |
| JUS | Department of Justice Canada/Ministère de la Justice du Canada | - | - |
| NRCC/CNR | National Research Council Canada/Conseil national de recherches Canada | - | - |
| NRCan/RNCan | Natural Resources Canada/Ressources naturelles Canada | - | - |
| PC | Parks Canada Agency/Parcs Canada | - | - |
| PCH | Canadian Heritage/Patrimoine Canada | - | - |
| PCO/BCP | Privy Council Office/Bureau du Conseil privé | X | - |
| PHAC/ASPC | Public Health Agency of Canada/Agence de la santé publique du Canada | - | - |
| PS/SP | Public Safety Canada/Sécurité publique Canada | - | - |
| PSC/CFP | Public Service Commission/Commission de la fonction publique | - | - |
| PSPC/SPAC | Public Services Procurement Canada/Services publics et Approvisionnement Canada | - | - |
| RCMP/GRC | Royal Canadian Mounted Police/Gendarmerie royale du Canada | - | - |
| SSC/SPC | Shared Services Canada/Services Partagés Canada | - | - |
| StatCan | Statistics Canada /Statistique Canada | - | - |
| TBS/SCT | Treasury Board of Canada Secretariat/Secrétariat du Conseil du Trésor du Canada | X | - |
| TC | Transport Canada/Transports Canada | - | - |
| VAC/ACC | Veterans Affairs Canada/Anciens Combattants Canada | - | X |
| WAGE/FEEG | Women and Gender Equality Canada/Femmes et Égalité des genres Canada | X | - |
| WD/DEO | Western Economic Diversification/Diversification de l’économie de l’Ouest Canada | - | X |
Annex 2 List of career advancement programs for 2019-20
| Department | Name of the Program |
|---|---|
| AAFC | Management and Leadership Development Program |
| CanNOR | CanNor Inuit Talent Management Program |
| CFIA | Indigenous Career Management for Employees |
| CIRNAC | Aboriginal Leadership Development Initiative CSPS Aspiring Directors Program |
| CRA | Agency Leadership Development Program |
| CSC | Aspiring Directors Program |
| CSIS | CSIS Supervisory Onboarding Program |
| CED | Initiative pour le développement du leadership autochtone |
| DFO | Aspiring Directors Program |
| ESDC | Aspiring Directors Program |
| FEDA | Talent Management Departmental Review |
| DND | CSPS Aspiring Directors Program |
| HC | Aboriginal Management Development Program |
| INFC | CSPS Management Development Program |
| IRCC | Aboriginal Leadership Development Initiative |
| ISC | ALDI and CSPS Aspiring Directors Program |
| ISED | ISED EX Feeder Program |
| JUS | Aspiring Directors Program |
| NRCan | Aspiring Directors Program |
| NRCC | CSPS Manager Development Program |
| PARKS | Parks Leaders Development Program |
| PCH | Programmes a l'Intention des future directeurs |
| PHAC | Aboriginal Management Development Program |
| PSC | Aspiring Directors Program |
| PS | Manager Development Program |
| StatCan | Targeted Leadership Development Programs |
| TBS | Talent Mobility Tool |
| TC | Leadership Development Initiative |
| WD | CSPS Leadership Development Programs |
Career advancement programs for all employees identified in four organizations
- Aboriginal Leadership Development Initiative (ALDI) at ISC:
- The Aboriginal Management Development Program (AMDP)
- The Aboriginal Career Management for Employees (ACME)
- The Aboriginal Employee Supports (AES) program
- CSPS Leadership Development Programs
- New Directors Program
- New Directors General Program
- Executive Leadership Development Program EX-1 to EX-3
- Executive Leadership Development Program EX-4 to EX-5
- CSPS Coaching for Leadership
- CSPS Leading with Employees in Mind
- CSPS Leading Strategically
- CSPS Managing Change
- CSPS Supervisor Development Program
- CSPS Leadership and Indigenous Relations
- EC Development Program
- PE Development Program
- PS Development Program
- Programs for future managers
- Jeanne Sauvé Development
- Public Policy Leadership Program
- Digital Academy - Excellence Stream
- Public Policy Forum Fall Conference
- Queen's Institute on Trade Policy
- Exposition Talent Management
- APEX Executive Knowledge Series
- Inuit Tapiriit Kanatami Executive Training Program
- Inuit Learning & Development Program (ILDP)
- Sivuliqtiunirmut Ilinniarniq: Leadership Training for Nunavut Inuit
- Targeted Leadership Development Programs (various external organizations)
- Public Policy Leadership Program (University of Ottawa)