
Employment Equity in the Public Service of Canada for Fiscal Year 2019 to 2020
On this page
- Message from the President of the Treasury Board
- Employment equity in the public service
- Women
- Indigenous peoples
- Persons with disabilities
- Members of visible minorities
- 2019 Public Service Employee Survey
- The way forward: adopting an inclusive mindset
- About this report
- About the data
- Appendix: statistical tables of employment equity data specific to compliance requirements of section 21 of the Employment Equity Act
- Footnotes

Message from the President of the Treasury Board
I am pleased to present the 28th annual report to Parliament on employment equity in the public service of Canada for fiscal year 2019–20.
Since the end of the fiscal year covered in this report, conversations about anti-racism have brought to light the importance of the Government’s ongoing efforts to create a diverse and inclusive public service. While the COVID-19 pandemic has amplified many of these challenges, it also offers tremendous opportunities to rebuild a fairer, more resilient society.
The public service has long made diversity and inclusion a core value. But despite steady progress over the past decade, work remains to be done. In 2019–20, for example, of the four employment equity groups – women, Indigenous peoples, persons with disabilities, and members of visible minorities – persons with disabilities continued to be the only group for which the public service is not meeting workforce availability, especially under the new and expanded definition of disabilities. The previous six-year decline in representation of this group has now halted, and we are optimistic that our commitment to hire 5,000 (net) employees with disabilities by 2025, and provide new tools to support their hiring and retention, will lead to increases both in the representation of, and opportunities for, persons with disabilities in the public service.
Building and sustaining a diverse and inclusive public service improves service and outcomes for Canadians. This requires a government-wide effort to create and foster a culture that values inclusiveness – one that sees our differences as our strength and provides all our employees with a deep sense of belonging. To achieve this goal, we will continue to generate and share data that give a more accurate picture of representation gaps, and to invest in the career pathways of our senior leaders. Our “Mentorship Plus” program will also improve the representativeness of our senior ranks. Using this data and learning from these initiatives, the public service can serve as a model for other organizations seeking the same goals.
In addition, we will support the review of the Employment Equity Act to ensure appropriate benchmarks for diversity and to address systemic barriers in the underlying framework. We will also foster a climate of open dialogue by engaging and educating public servants, and key community stakeholders will be invited to define and contribute to the change.
These are just a few of the ways Canada’s government is working to create a more diverse, inclusive, accessible, and representative workforce, and many new initiatives have been launched since the period covered in this report. For more information on this important work, please visit the Government of Canada’s Diversity and inclusion areas of focus for the public service.
You are all invited to read this report to see how we are building a better public service to serve all Canadians.
Original signed by
Jean-Yves Duclos, P.C., M.P.
President of the Treasury Board of Canada
Employment equity in the public service
In this section
A workplace characterized by respect, dignity and fairness is at the core of one of the fundamental values of the public service of Canada: respect for people. Inherent in this value are the notions of diversity and inclusion to ensure that:
- the public service reflects the makeup of the population it serves
- the work environment is one where employees have a sense of belonging and where difference is embraced as a source of strength
The Employment Equity Act is one of the key pieces of the legislative foundation that ensures equity and fairness in the public service.
The act requires that the employer measure numerical progress toward representation and continuously improve the workplace experience regarding employment equity. This report provides:
- details on the public service’s performance in creating a representative workforce
- examples of ongoing activities and strategies intended to help identify, prevent and, remove barriers to the full participation of members of designated employment equity groups in all aspects of the workplace and employee life cycle
The Employment Equity Act designates four employment equity groups: women, Indigenous peoples, persons with disabilities and members of visible minorities. In the core public administration (CPA), targeted efforts to ensure that the public service meets or exceeds workforce availability of the designated groups, that is, their representation in “those segments of the Canadian workforce that are identifiable by qualification, eligibility or geography and from which the employer may reasonably be expected to draw employees.”Footnote 1
Employment equity representation in 2019–20
The 2019–20 fiscal year saw increases in both the size of the CPA (by 10,852 employees) and the number of employees who are members of all four employment equity groups. Employee self-identification data as measured against the available workforce shows that the CPA is generally representative of the population it serves, except for persons with disabilities. Representation of Indigenous peoples has remained stable, and representation of women and members of visible minorities, which already met workforce availability, continued to increase. Hiring and promotion rates for women and members of visible minorities also showed positive signs, suggesting that the number of members of these two groups will continue to meet or exceed workforce availability (see the infographic and narrative below).
There are areas for improvement. Persons with disabilities, whose representation is already below workforce availability, are not being hired or promoted at a rate that counters the separation rate (the rate at which they leave the public service). Similarly, Indigenous peoples, although currently represented at a rate that meets workforce availability, have hiring and promotion rates that suggest that this situation requires continued effort. Targeted measures for persons with disabilities and Indigenous peoples are needed to address these trends.
The leadership of the public sector is not as representative or diverse as the public service population at large. Although executives, women and members of visible minorities currently meet or exceed workforce availability benchmarks, Indigenous peoples and persons with disabilities do not. At the two most senior levels, which comprise assistant deputy ministers or equivalents, gaps remain in all four groups. Additionally, the hiring and promotion for members of all four groups are below what is needed to sustain representation rates or address under-representation at the executive level. Although the separation for all groups decreased since the previous year, the continued higher separation of female executives and members of visible minorities executives indicate that their current positive representation rates will not be sustained unless hiring and promotion increase significantly.
Infographic 1 - Text version
Note: Figures in square brackets represent the change since 2018–19.
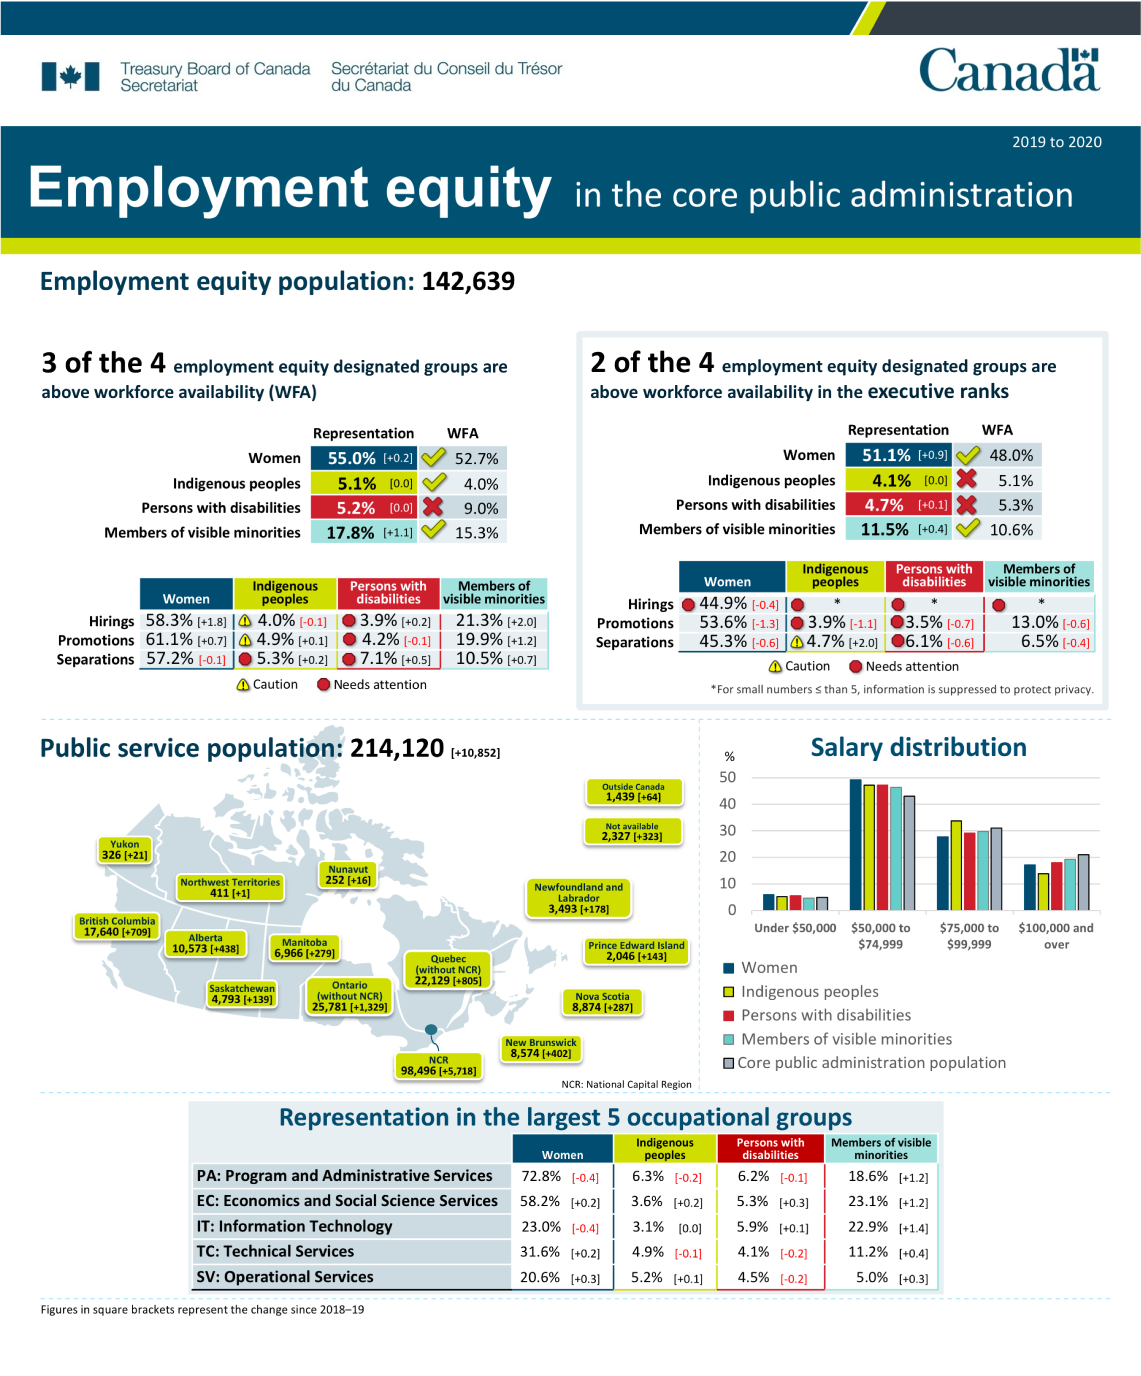
Employment equity population: 142,639
3 of the 4 employment equity designated groups are above workforce availability: women, Indigenous peoples and members of visible minorities.
Core public administration representation
- 55.0% are women, which is higher than their workforce availability of 52.7%, and has an increase of 0.2 percentage points from last year’s report
- 5.1% have identified themselves as Indigenous, which is higher than their workforce availability of 4.0% and is at the same representation rate from last year’s report
- 5.2% have identified themselves as a person with a disability, which is lower than their workforce availability of 9.0% and is at the same representation rate from last year’s report
- 17.8% have identified themselves as a member of visible minorities, which is higher than their workforce availability of 15.3% and has an increase of 1.1 percentage points from last year’s report
Degree of representation for hirings, promotions and separations
| Human resources action | Women | Indigenous peoples | Persons with disabilities | Members of visible minorities |
|---|---|---|---|---|
| Hirings | 58.3% [+1.8] | 4.0% [-0.1] | 3.9% [+0.2] | 21.3% [+2.0] |
| Promotions | 61.1% [+0.7] | 4.9% [+0.1] | 4.2% [-0.1] | 19.9% [+1.2] |
| Separations | 57.2% [-0.1] | 5.3% [+0.2] | 7.1% [+0.5] | 10.5% [+0.7] |
In these figures for degree of representation, a note of “caution” is indicated for hirings and promotions for Indigenous peoples. A note of “needs attention” is indicated for the following:
- separations for Indigenous peoples
- hirings, separations and promotions for persons with disabilities
2 of the 4 employment equity designated groups are above workforce availability in the executive ranks.
Core public administration representation in the executive ranks
- 51.1% are women, which is higher than their workforce availability of 48.0%, and has an increase of 0.9 percentage points from last year’s report
- 4.1% have identified themselves as Indigenous, which is lower than their workforce availability of 5.1%, and is at the same representation rate from last year’s report
- 4.7% have identified themselves as a person with a disability, which is lower than their workforce availability of 5.3% and has an increase of 0.1 percentage points from last year’s report
- 11.5% have identified themselves as a member of visible minorities, which is higher than their workforce availability of 10.6% and has an increase of 0.4 percentage points from last year’s report
Degree of representation for hirings, promotions and separations in the executive ranks
| Human resources action | Women | Indigenous peoples | Persons with disabilities | Members of visible minorities |
|---|---|---|---|---|
| Hirings | 44.9% [-0.4] | Footnote * | Footnote * | Footnote * |
| Promotions | 53.6% [-1.3] | 3.9% [-1.1] | 3.5% [-0.7] | 13.0% [-0.6] |
| Separations | 45.3% [-0.6] | 4.7% [+2.0] | 6.1% [-0.6] | 6.5% [-0.4] |
In these figures for degree of representation, a note of “caution” is indicated for separations for Indigenous peoples. A note of “needs attention” is indicated for the following:
- hirings for women
- hirings and promotions for Indigenous peoples
- hirings, promotions and separation for persons with disabilities
- hirings for members of visible minorities
The population of the public service overall is 214,120, an increase of 10,852 from last year.
Following are subtotals by province, territory and other categories:
- Newfoundland and Labrador: 3,493 [+178]
- Prince Edward Island: 2,046 [+143]
- Nova Scotia: 8,874 [+287]
- New Brunswick: 8,574 [+402]
- Quebec (without the National Capital Region): 22,129 [+805]
- National Capital Region: 98,496 [+5,718]
- Ontario (without the National Capital Region): 25,781 [+1,329]
- Manitoba: 6,966 [+279]
- Saskatchewan: 4,793 [+139]
- Alberta: 10,573 [+ 438]
- British Columbia: 17,640 [+709]
- Yukon: 326 [+21]
- Northwest Territories: 411 [+1]
- Nunavut: 252 [+16]
- outside Canada: 1,439 [+64]
- not available: 2,327 [+323]
Salary distribution
| Salary range | Women | Indigenous peoples | Persons with disabilities | Members of visible minorities | Core public administration population |
|---|---|---|---|---|---|
| Under $50,000 | 6.0% [-0.7] | 5.3% [-0.6] | 5.6% [-0.6] | 4.7% [-0.9] | 4.8% |
| $50,000 to $74,999 | 49.2% [-1.0] | 47.2% [-1.0] | 47.2% [-0.1] | 46.3% [+0.1] | 43.3% |
| $75,000 to $99,999 | 27.7% [-0.5] | 33.8% [-0.3] | 29.2% [-0.6] | 29.7% [-1.2] | 31.4% |
| $100,000 and over | 17.1% [+2.2] | 13.8% [+1.8] | 18.0% [+1.3] | 19.3% [+2.0] | 20.5% |
Representation in the largest 5 occupational groups
| Occupational group | Women | Indigenous peoples | Persons with disabilities | Members of visible minorities |
|---|---|---|---|---|
| PA: Program and Administrative Services | 72.8% [-0.4] | 6.3% [-0.2] | 6.2% [-0.1] | 18.6% [+1.2] |
| EC: Economics and Social Science Services | 58.2% [+0.2] | 3.6% [+0.2] | 5.3% [+0.3] | 23.1% [+1.2] |
| IT: Information Technology | 23.0% [-0.4] | 3.1% [0.0] | 5.9% [+0.1] | 22.9% [+1.4] |
| TC: Technical Services | 31.6% [+0.2] | 4.9% [-0.1] | 4.1% [-0.2] | 11.2% [+0.4] |
| SV: Operational Services | 20.6% [+0.3] | 5.2% [+0.1] | 4.5% [-0.2] | 5.0% [+0.3] |
The source of representation data is the Treasury Board of Canada Secretariat Employment Equity Data Bank, which is populated with self-identification information provided by employees.
To learn more
Toward a more diverse and inclusive public service
A more diverse and inclusive public service requires sustained action by many actors, including central agencies and arm’s-length organizations that set policy parameters and targeted initiatives, deputy heads, human resources professionals, individual managers, and all public servants. The 2019–20 fiscal year saw several key initiatives that set the foundation for the future of people management in the public service:
- The people management policy framework was reviewed and updated, incorporating many changes from the application of a diversity and inclusion lens. The new Policy on People Management and its related directives came into force on April 1, 2020.
- The Directive on Employment Equity, Diversity and Inclusion now frames the Government of Canada’s intention to move beyond current requirements for employment equity, emphasizing an increased focus on diversity and inclusion in its workforce and workplaces, and includes the requirement for deputy heads of federal organizations to designate a senior official or officials to be responsible for the directive’s requirements.
- The Directive on the Duty to Accommodate now encourages a shift in organizational culture from accommodation being only for persons with disabilities to one that includes accommodation for all employees. The directive has a new requirement for managers to address the work-related needs of employees without resorting to a formal request for accommodation that requires burdensome proof from the employee.
- The Joint Employment Equity Committee is an ongoing advisory committee through which employment equity, diversity and inclusion policy, programs and initiatives are discussed among employees’ representatives of bargaining agents, departments, the Public Service Commission of Canada, and the Treasury Board of Canada Secretariat’s Office of the Chief Human Resources Officer. The committee’s activities in 2019–20 included the following:
- discussions about harassment and violence prevention
- discussions about recruitment and staffing
- presentations from partners such as the Office of Public Service Accessibility; the Public Service Commission of Canada; the Centre for Wellness, Inclusion and Diversity; and the Privy Council Office (“Beyond2020” exercise)
To learn more
Women
The representation rate for women steadily increased, including for executives, and continues to exceed estimated workforce availability (see the infographic and narrative below).
Overall, 2019–20 saw increases in women’s hiring and promotion and only a slight decrease in the separation. Although the separations remain proportionally higher for women than for the general population, higher-than-average hiring and promotion balances this out in terms of sustaining their representation. However, among executives, although women currently exceed workforce availability, hiring and promotion decreased. If this trend continues, representation rates for women executives may fall below workforce availability in the future. The public service is working to improve its promotion, recruitment, and leadership development in order to increase the representation of employment equity designated groups in senior leadership.
The concentration and representation of women across occupational groups continue to be inconsistent:
- The concentration of women continues to be very high in some occupational groups, such as:
- Health Services
- Human Resources Management
- Translation
- Program and Administrative Services
- Police Operations Support
- The representation of women in Information Technology has fallen. The representation of women has risen slightly in other low-representation occupational groups, but the sustainability of these gains is precarious in some occupational groups, such as:
- Ships’ Officers
- Operational Services
- Architecture, Engineering and Land Survey
- Correctional Services
Women in the public service whose average age is one year younger (43) than the average age of the public service overall (44) continue to experience an imbalance in salary distribution. Women were over-represented in the lower salary distribution. Overall, nearly twice as many women as men earned under $50,000, and women were also over-represented compared to men in the salary bracket of less than $74,999. This over-representation is a concern consistent with:
- the concentration of women in lower-paid jobs across occupations
- hiring and promotion rates to sustain representation at the executive level
Once the Pay Equity Act comes into force, the Treasury Board and other federal employers will be required to review the compensation of female-predominant job classes and ensure that they receive equal pay for work of equal value.
Infographic 2 - Text version
Note: Figures in square brackets represent the change since 2018–19.
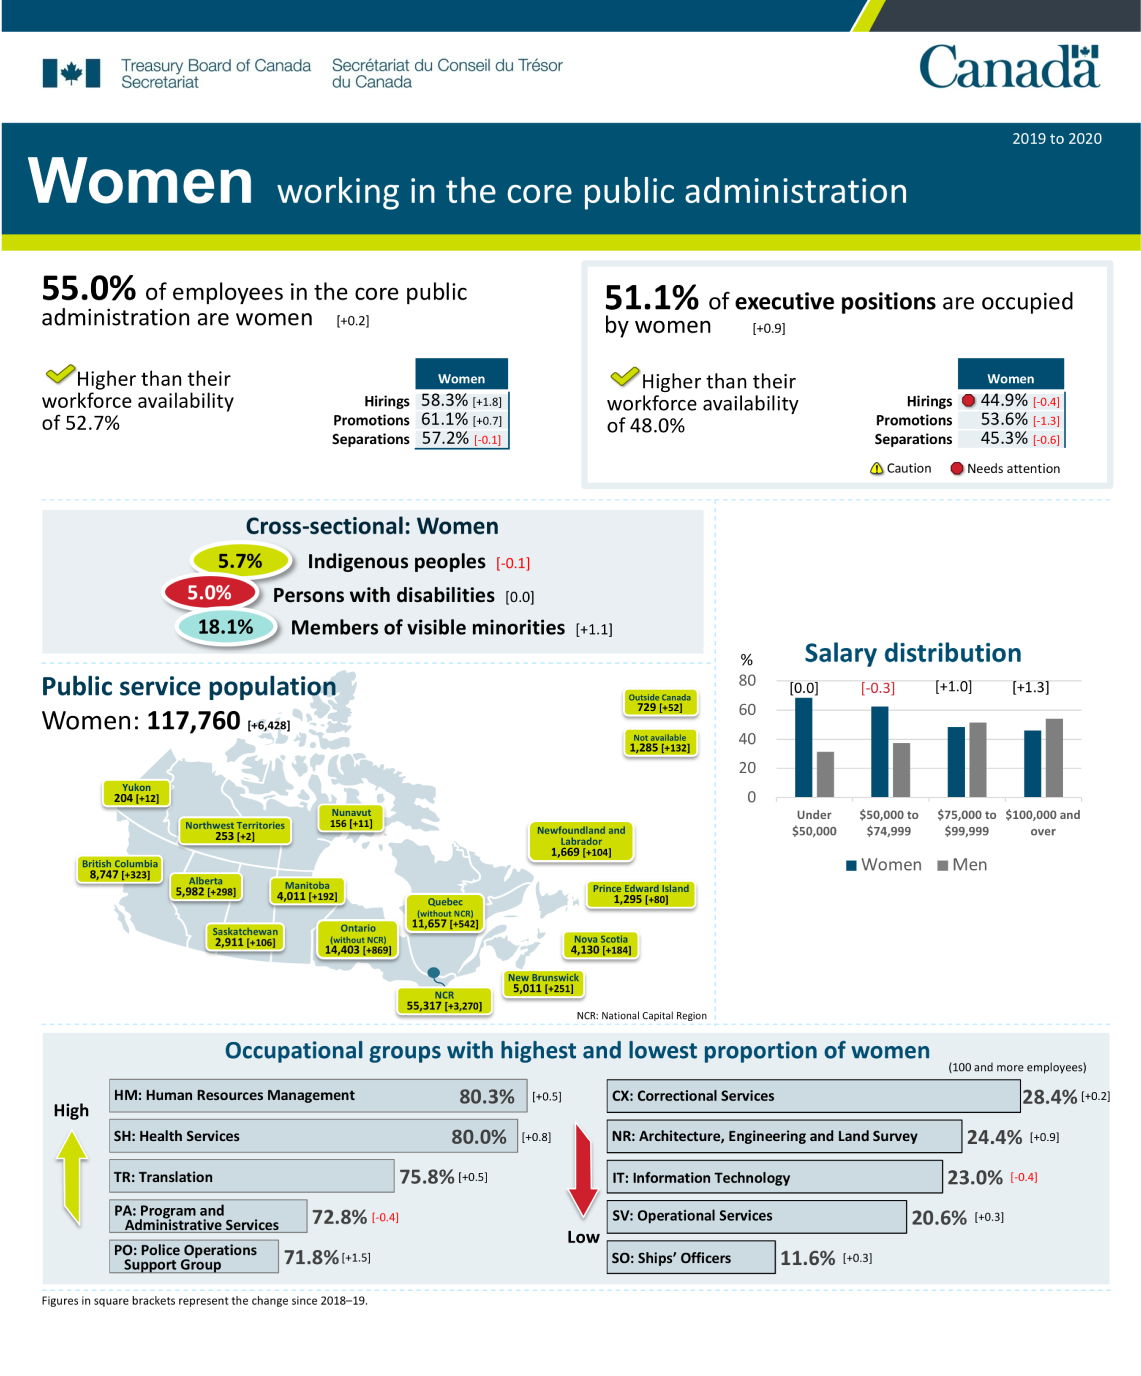
55.0% of employees in the core public administration are women, an increase of 0.2 percentage points from last year’s report and higher than their workforce availability of 52.7%.
Degree of representation for hirings, promotions and separations
| Human resources action | Women |
|---|---|
| Hirings | 58.3% [+1.8] |
| Promotions | 61.1% [+0.7] |
| Separations | 57.2% [-0.1] |
51.1% of executive positions are occupied by women, an increase of 0.9 percentage points from last year’s report and higher than their workforce availability of 48.0%.
Degree of representation for hirings, promotions and separations in the executive ranks
| Human resources action | Women |
|---|---|
| Hirings | 44.9% [-0.4] |
| Promotions | 53.6% [-1.3] |
| Separations | 45.3% [-0.6] |
In these figures for degree of representation, a note of “needs attention” is indicated for hirings.
Cross-sectional analysis for women
- 5.7% have identified themselves as Indigenous, a decrease of 0.1 percentage points from last year
- 5.0% have identified themselves as a person with a disability, which is the same as last year
- 18.1% have identified themselves as a member of visible minorities, an increase of 1.1 percentage points from last year
The population of women in the public service population is 117,760, an increase of 6,428 from last year.
Following are subtotals by province, territory and other categories:
- Newfoundland and Labrador: 1,669 [+104]
- Prince Edward Island: 1,295 [+80]
- Nova Scotia: 4,130 [+184]
- New Brunswick: 5,011 [+251]
- Quebec (without the National Capital Region): 11,657 [+542]
- National Capital Region: 55,317 [+3,270]
- Ontario (without the National Capital Region): 14,403 [+869]
- Manitoba: 4,011 [+192]
- Saskatchewan: 2,911 [+106]
- Alberta: 5,982 [+298]
- British Columbia: 8,747 [+323]
- Yukon: 204 [+12]
- Northwest Territories: 253 [+2]
- Nunavut: 156 [+11]
- outside Canada: 729 [+52]
- not available: 1,285 [+132]
Salary distribution
| Salary range | Women | Men |
|---|---|---|
| Under $50,000 | 68.5% [0.0] | 31.5% |
| $50,000 to $74,999 | 62.6% [-0.3] | 37.4% |
| $75,000 to $99,999 | 48.4% [+1.0] | 51.6% |
| $100,000 and over | 45.9% [+1.3] | 54.1% |
Occupational groups with highest proportion of women (100 and more employees)
- HM: Human Resources Management: 80.3% [+0.5]
- SH: Health Services: 80.0% [+0.8]
- TR: Translation: 75.8% [+0.5]
- PA: Program and Administrative Services: 72.8% [-0.4]
- PO: Police Operations Support: 71.8% [+1.5]
Occupational groups with lowest proportion of women (100 and more employees)
- CX: Correctional Services: 28.4% [+0.2]
- NR: Architecture, Engineering and Land Survey: 24.4% [+0.9]
- IT: Information Technology: 23.0% [-0.4]
- SV: Operational Services: 20.6% [+0.3]
- SO: Ships’ Officers: 11.6% [+0.3]
The source of the representation data is the Treasury Board of Canada Secretariat Employment Equity Data Bank, which is populated with self-identification information provided by employees.
To learn more
Diversity and inclusion statistics
Initiatives to support women
The new Pay Equity Act, which received royal assent in 2018, will require public service employers to:
- proactively review compensation systems to ensure that they provide equal pay for work of equal value
- develop a pay equity plan within three years of the act coming into force
In 2019–20, the enabling regulations required to bring the act into force were developed and published in the Canada Gazette, Part I. In addition, the Treasury Board of Canada Secretariat continued with implementation readiness activities for pay equity in the public service.
To learn more
Indigenous peoples
The representation rate of Indigenous peoples in the CPA is above estimated workforce availability. However, this rate may not be sustainable because hiring has decreased slightly, and separation remains high (see the infographic and narrative below).
Indigenous peoples have not yet achieved representation levels at parity with workforce availability in the Executive group, which has lower hiring and promotion for Indigenous peoples than for non-Indigenous peoples. Indigenous peoples are leaving the public service at a rate that is higher than their peers. Indigenous peoples are on average one year older (45) than the average age of the public service overall (44).
In 2019–20, the representation of Indigenous peoples did not improve significantly in the occupational groups that have the lowest numbers compared to the previous year.
- The concentration of Indigenous peoples continues to be highest in the following occupation groups:
- Education and Library Science
- Correctional Services
- Health Services
- Program and Administrative Services
- Operational Services
- The under-representation of Indigenous peoples in the following occupational groups indicates that further efforts may be needed to meet or exceed estimated workforce availability:
- Border Services
- Economics and Social Science Services
- Information Technology
- Financial Management
- Applied Science and Patent Examination
Although the number of Indigenous peoples earning more than $100,000 increased by 1.8 percentage points in 2019–20, it is still lower than the average, and there continues to be a higher concentration of Indigenous employees in the three lowest salary distributions.
Infographic 3 - Text version
Note: Figures in square brackets represent a change since 2018–19.
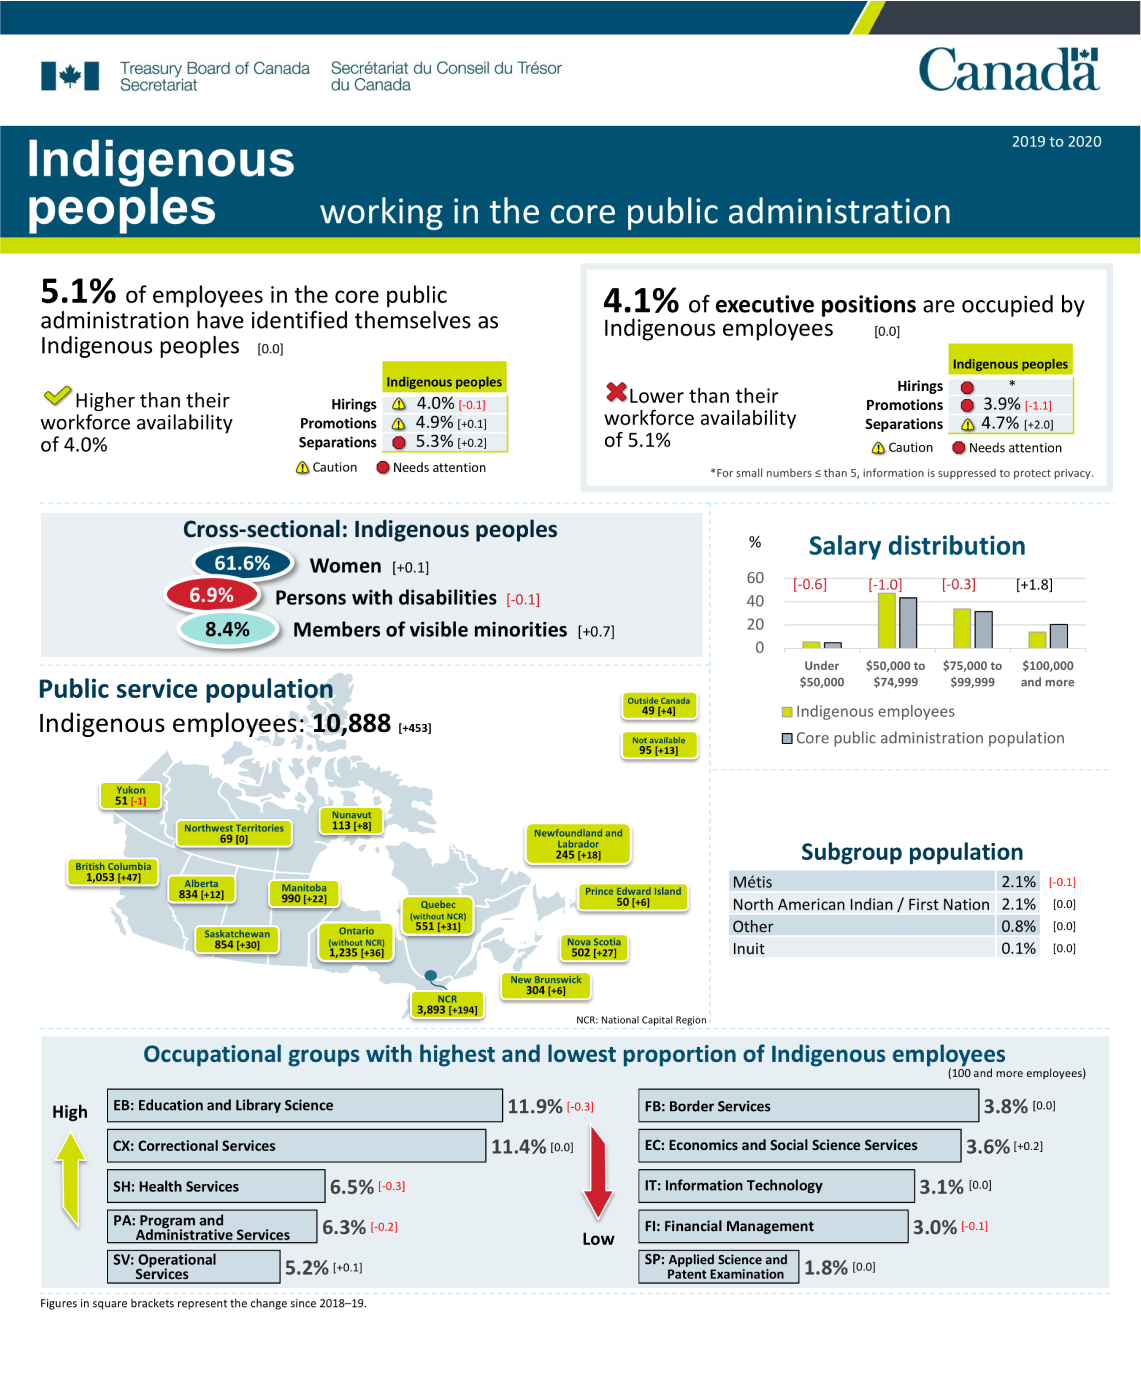
5.1% of employees in the core public administration have identified themselves as Indigenous, which is the same as last year and higher than their workforce availability of 4.0%
Degree of representation for hirings, promotions and separations
| Human resources action | Indigenous peoples |
|---|---|
| Hirings | 4.0% [-0.1] |
| Promotions | 4.9% [+0.1] |
| Separations | 5.3% [+0.2] |
In these figures for degree of representation, a note of “caution” is indicated for hirings and promotions and a note of “needs attention” is indicated for separations.
4.1% of executive positions are occupied by Indigenous employees, which is the same as last year’s report and lower than their workforce availability of 5.1%.
Degree of representation for hirings, promotions and separations in the executive ranks:
| Human resources action | Indigenous peoples |
|---|---|
| Hirings | Footnote * |
| Promotions | 3.9% [-1.1] |
| Separations | 4.7% [+2.0] |
In these figures for degree of representation, a note of “caution” is indicated for separations, and a note of “needs attention” is indicated for hirings and promotions.
Cross-sectional analysis for Indigenous peoples
- 61.6% are women, an increase of 0.1 percentage points from last year
- 6.9% have identified themselves as a person with a disability, a decrease of 0.1 percentage points from last year
- 8.4% have identified themselves as a member of visible minorities, an increase of 0.7 percentage points from last year
The population of Indigenous peoples in the public service population is 10,888, an increase of 453 from last year.
Following are subtotals by province, territory and other categories:
- Newfoundland and Labrador: 245 [+18]
- Prince Edward Island: 50 [+6]
- Nova Scotia: 502 [+27]
- New Brunswick: 304 [+6]
- Quebec (without the National Capital Region): 551 [+31]
- National Capital Region: 3,893 [+194]
- Ontario (without the National Capital Region): 1,235 [+36]
- Manitoba: 990 [+22]
- Saskatchewan: 854 [+30]
- Alberta: 834 [+12]
- British Columbia: 1,053 [+47]
- Yukon: 51 [-1]
- Northwest Territories: 69 [0]
- Nunavut: 113 [+8]
- outside Canada: 49 [+4]
- not available: 95 [+13]
Salary distribution
| Salary | Indigenous employees | Core public administration population |
|---|---|---|
| Under $50,000 | 5.3% [-0.6] | 4.8% |
| $50,000 to $74,999 | 47.2% [-1.0] | 43.3% |
| $75,000 to $99,999 | 33.8% [-0.3] | 31.4% |
| $100,000 and over | 13.8% [+1.8] | 20.5% |
Subgroup distribution for Indigenous peoples
- Métis: 2.1% [-0.1]
- North American / First Nation: 2.1% [0.0]
- other: 0.8% [0.0]
- Inuit: 0.1% [0.0]
Occupational groups with highest proportion of Indigenous employees (100 and more employees)
- EB: Education and Library Science: 11.9% [-0.3]
- CX: Correctional Services: 11.4% [0.0]
- SH: Health Services: 6.5% [-0.3]
- PA: Programs and Administrative Services: 6.3% [-0.2]
- SV: Operational Services: 5.2% [+0.1]
Occupational groups with lowest proportion of Indigenous employees (100 and more employees)
- FB: Border Services: 3.8% [0.0]
- EC: Economics and Social Sciences Services: 3.6% [+0.2]
- IT: Information Technology: 3.1% [0.0]
- FI: Financial Management: 3.0% [-0.1]
- SP: Applied Science and Patent Examination: 1.8% [0.0]
The source of the representation data is the Treasury Board of Canada Secretariat Employment Equity Data Bank, which is populated with self-identification information provided by employees.
To learn more
Diversity and inclusion statistics
Initiatives to support Indigenous peoples
- The GCpedia site Building Bridges Through Learning was launched by the Canada School of Public Service as a one-stop inventory of Indigenous-related learning, training and activities, providing employees with awareness and knowledge of Indigenous cultures, history and contemporary realities.
- Two pathway portals were launched:
- The Public Service Commission of Canada worked with Indigenous employee networks to co-develop the Indigenous Career Pathway, which provides expertise and support for Indigenous recruitment. It includes:
- the Inventory of Indigenous Applicants (accessible only on the Government of Canada network), which comprises students who have experience in the federal public service and are available for rehiring or appointment opportunities
- the Indigenous Recruitment Toolbox (accessible only on the Government of Canada network), which provides resources and advice on Indigenous staffing
- The Office of the Chief Human Resources Officer and Indigenous employee networks co-developed the Career Pathways for Indigenous Employees website to provide tools and resources to support Indigenous employees as they navigate their career in the federal public service.
- The Public Service Commission of Canada worked with Indigenous employee networks to co-develop the Indigenous Career Pathway, which provides expertise and support for Indigenous recruitment. It includes:
- The Indigenous Student Employment Opportunity initiative, which provides onboarding, training, mentorship, networking activities and support services to Indigenous students and their hiring managers, is now open to applications year-round. To further support their inclusion and progress in the public service, students are also offered one-on-one mentorship sessions with Indigenous executives.
- Pilimmaksaivik, the whole-of government Inuit employment plan (which covers 2017–19 to 2022–23), oversaw the addition of 45 new Inuit employees in the federal government in Nunavut, for a total of 172, an increase from 123 in January 2017. In 2019, Pilimmaksaivik focused on implementing a pre-employment training plan to remove barriers for the 10,120 Nunavut Inuit who are interested in working for the Government of Canada but who may face challenges in doing so. This plan included the following:
- the Inuit Learning and Development Plan, which had nine participants in its third cohort (including four in its new science stream)
- Sivuliqtiurnimut Ilinniarniq, a multi-phased leadership training initiative, which had 12 Nunavut Inuit employees participating in the second cohort
To learn more
- Indigenous recruitment: information for hiring managers
- Career pathways for Indigenous employees (accessible only on the Government of Canada network)
- Pilimmaksaivik (accessible only on the Government of Canada network)
Persons with disabilities
In 2019–20, both the number and proportion of persons with disabilities in the workforce stabilized after a six-year decline (see the infographic and narrative below).
Persons with disabilities are under-represented both overall and in executive positions compared to workforce availability. Their hiring and promotion is lower than employees in general, with promotions decreasing compared to previous years. The difficulties in bridging the gaps are exacerbated by the fact that separations exceed new hires across the public service, and there are a limited number of executive-ready candidates. On average, people with disabilities are four years older (48) than the average age of the public service overall (44).
In 2019–20, the representation of persons with disabilities did not improve significantly with regard to the occupational groups’ dispersion. Persons with disabilities continue to not meet workforce availability in any occupational group.
Although the number of persons with disabilities earning more than $100,000 increased by 1.3 percentage points in 2019–20, it is still lower than the average, and there continues to be a higher concentration of people with disabilities in the three lowest salary distributions.
Infographic 4 - Text version
Note: Figures in square brackets represent a change since 2018–19.
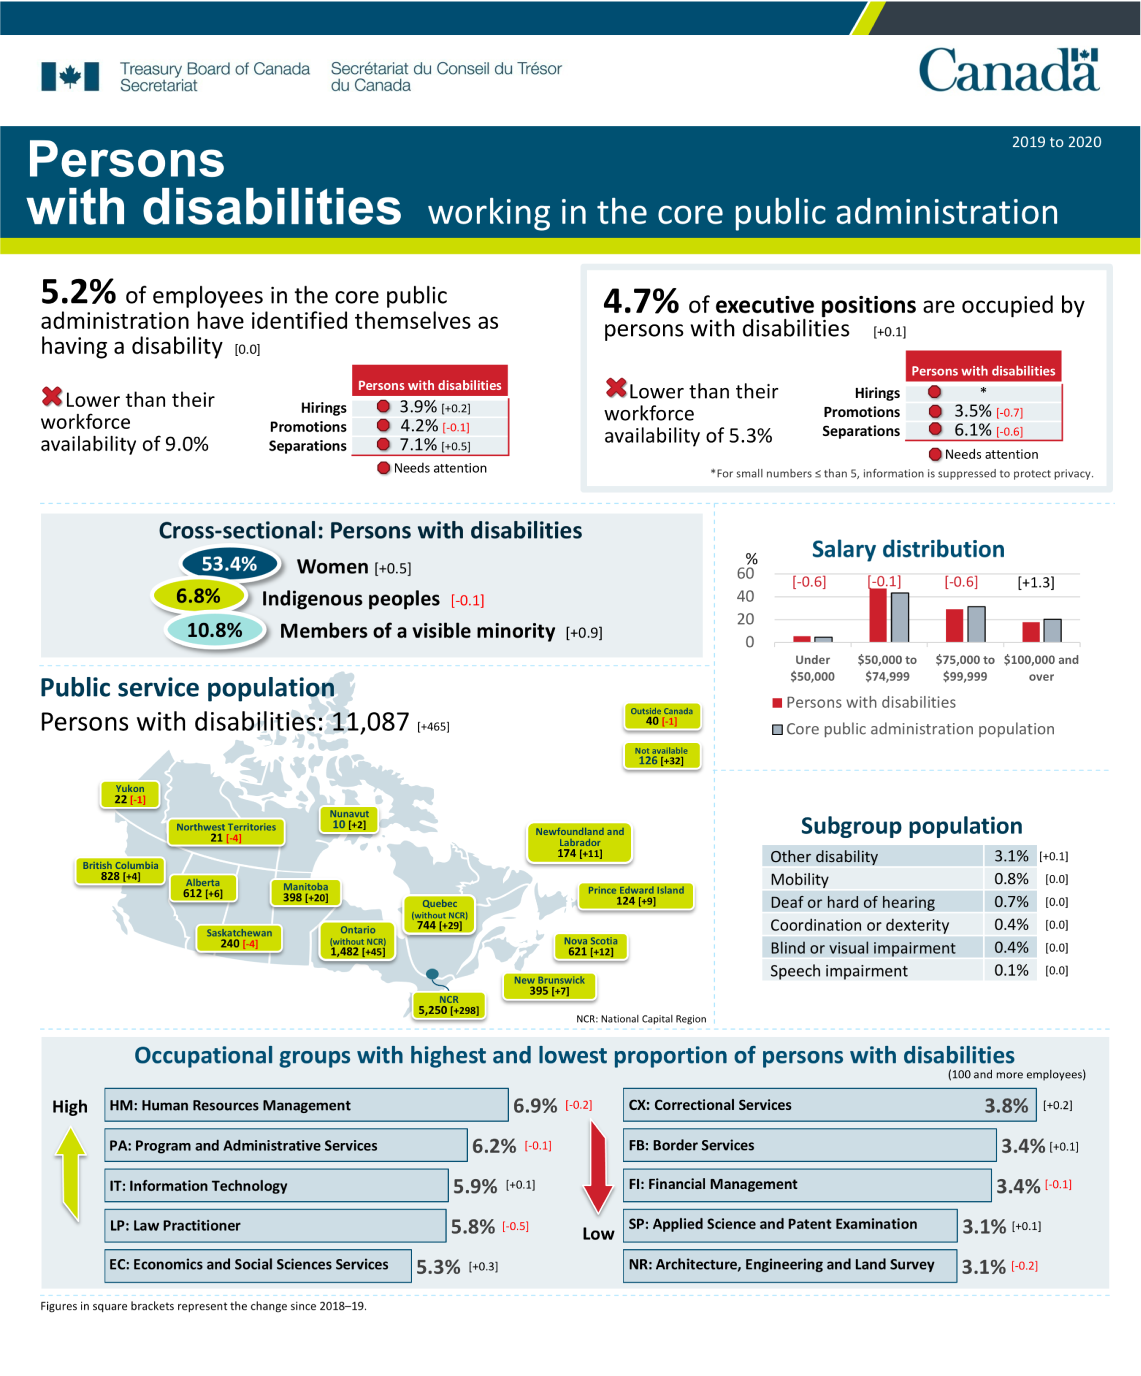
5.2% of employees in the core public administration have identified themselves as a person with a disability, which is lower than their workforce availability of 9.0%.
Degree of representation for hirings, promotions and separations:
| Human resources action | Persons with disabilities |
|---|---|
| Hirings | 3.9% [+0.2] |
| Promotions | 4.2% [-0.1] |
| Separations | 7.1% [+0.5] |
In these figures for degree of representation, a note of “needs attention” is indicated for hirings, separations and promotions.
4.7% of executive positions are occupied by persons with disabilities, an increase of 0.1 percentage points from last year’s report, which is lower than their workforce availability of 5.3%.
Degree of representation for hirings, promotions and separations in the executive ranks
| Human resources action | Persons with disabilities |
|---|---|
| Hirings | Footnote * |
| Promotions | 3.5% [-0.7] |
| Separations | 6.1% [-0.6] |
In these figures for degree of representation, a note of “needs attention” is indicated for hirings, separations and promotions.
Cross-sectional analysis for persons with disabilities
- 53.4% are women, an increase of 0.5 percentage points from last year
- 6.8% have identified themselves as Indigenous, a decrease of 0.1 percentage points from last year
- 10.8% have identified themselves as a member of visible minorities group, an increase of 0.9 percentage points from last year
The population of persons with disabilities in the public service population is 11,087, an increase of 465 from last year.
The following are subtotals by province, territory and other categories:
- Newfoundland and Labrador: 174 [+11]
- Prince Edward Island: 124 [+9]
- Nova Scotia: 621 [+12]
- New Brunswick: 395 [+7]
- Quebec (without the National Capital Region): 744 [+29]
- National Capital Region: 5,250 [+298]
- Ontario (without the National Capital Region): 1,482 [+45]
- Manitoba: 398 [+20]
- Saskatchewan: 240 [-4]
- Alberta: 612 [+6]
- British Columbia: 828 [+4]
- Yukon: 22 [-1]
- Northwest Territories: 21 [-4]
- Nunavut: 10 [+2]
- outside Canada: 40 [-1]
- not available: 126 [+32]
Salary distribution
| Salary | Persons with disabilities | Core public administration population |
|---|---|---|
| Under $50,000 | 5.6% [-0.6] | 4.8% |
| $50,000 to $74,999 | 47.2% [-0.1] | 43.3% |
| $75,000 to $99,999 | 29.2% [-0.6] | 31.4% |
| $100,000 and over | 18.0% [+1.3] | 20.5% |
Subgroup distribution for persons with disabilities
- Other disability: 3.1% [+0.1]
- Mobility: 0.8% [0.0]
- Deaf or hard of hearing: 0.7% [0.0]
- Coordination or dexterity: 0.4% [0.0]
- Blind or visual impairment: 0.4% [0.0]
- Speech impairment: 0.1% [0.0]
Occupational groups with highest proportion of persons with disabilities (100 and more employees)
- HM: Human Resources Management: 6.9% [-0.2]
- PA: Program and Administrative Services: 6.2% [-0.1]
- IT: Information Technology: 5.9% [+0.1]
- LP: Law Practitioner: 5.8% [-0.5]
- EC: Economics and Social Science Services: 5.3% [+0.3]
Occupational groups with lowest proportion of persons with disabilities (100 and more employees)
- CX: Correctional Services: 3.8% [+0.2]
- FB: Border Services: 3.4% [+0.1]
- FI: Financial Management: 3.4% [-0.1]
- SP: Applied Science and Patent Examination: 3.1% [+0.1]
- NR: Architecture, Engineering and Land Survey: 3.1% [-0.2]
The source of the representation data is the Treasury Board of Canada Secretariat Employment Equity Data Bank, which is populated with self-identification information provided by employees.
To learn more
Diversity and inclusion statistics
Initiatives to support people with disabilities
- The Accessibility Strategy for the Public Service of Canada, released in May 2019, has five goals, two of them directly related to increasing the number of persons with disabilities working in the public service and improving their experiences of employment throughout their careers:
- removing barriers to accessibility
- inclusion in the public service
- A Centralized Enabling Workplace Fund launched a five-year $10-million fund (2019–24) to support departments and agencies in developing new tools and guidance, improve existing processes, and experiment with innovative solutions that equip employees to contribute to reaching their full potential.
- A comprehensive benchmarking study, comprising two government-wide online surveys, was launched to document feedback from federal employees with disabilities and managers on challenges and opportunities to improve the federal workplace accommodation process.
- A new Government of Canada Workplace Accessibility Passport is being piloted by several early-adopter departments as a tool that will follow employees as they change jobs within the CPA. The passport will help streamline conversations with their managers about the tools and supports they need to succeed in their jobs.
- An Accessibility Hub was created by the Office of Public Service Accessibility as a source of guidance, tools, tips and best practices on accessibility for departments and agencies.
- The Federal Internship Program for Canadians with Disabilities was launched by the Public Service Commission of Canada. The first cohort of 20 interns was hired in eight departments and agencies.
- The Employment Opportunity for Students with Disabilities, operated by the Public Service Commission of Canada, is now open to applications year-round. This initiative offers tools such as an onboarding process, training, mentorship, networking activities, and support services to students with disabilities and their hiring managers, including a self-directed mentoring program for students that provides them with access to skilled public servant mentors.
- The High School Students with Intellectual Disabilities Integration Project, a pilot partnership with school boards for high school students with intellectual disabilities, had 14 successful placements in 2019–20. The Treasury Board of Canada Secretariat and the Public Service Commission of Canada continue to gather data with a view to formalizing the pilot as an ongoing student employment program.
To learn more
Members of visible minorities
Members of visible minorities have seen improvements in representation from 2018–19 to 2019–20, including among all subgroups, with Black employees seeing the largest increase (see the infographic and narrative below).
There is a slight increase in the number of executives who are members of a visible minority, which means that representation in both the general population and the Executive group exceed workforce availability. The hiring and promotion of members of visible minorities also increased. The average age of members of visible minorities is two years younger (42) than the average age of the public service overall (44).
In 2019–20, members of visible minorities continue to be concentrated in certain occupational groups.
- The number of members of visible minorities exceeds workforce availability in the following occupational groups:
- Financial Management
- Architecture, Engineering and Land Survey
- Economics and Social Science Services
- Information Technology
- Applied Science and Patent Examination
- Continued effort is required to:
- sustain an increase in occupational groups that have the lowest representation of members of visible minorities, including executives, and Operational Services, Technical Services and Correctional Services
- reverse the loss from the Electronics occupational group
Infographic 5 - Text version
Note: Figures in square brackets represent a change since 2018–19.
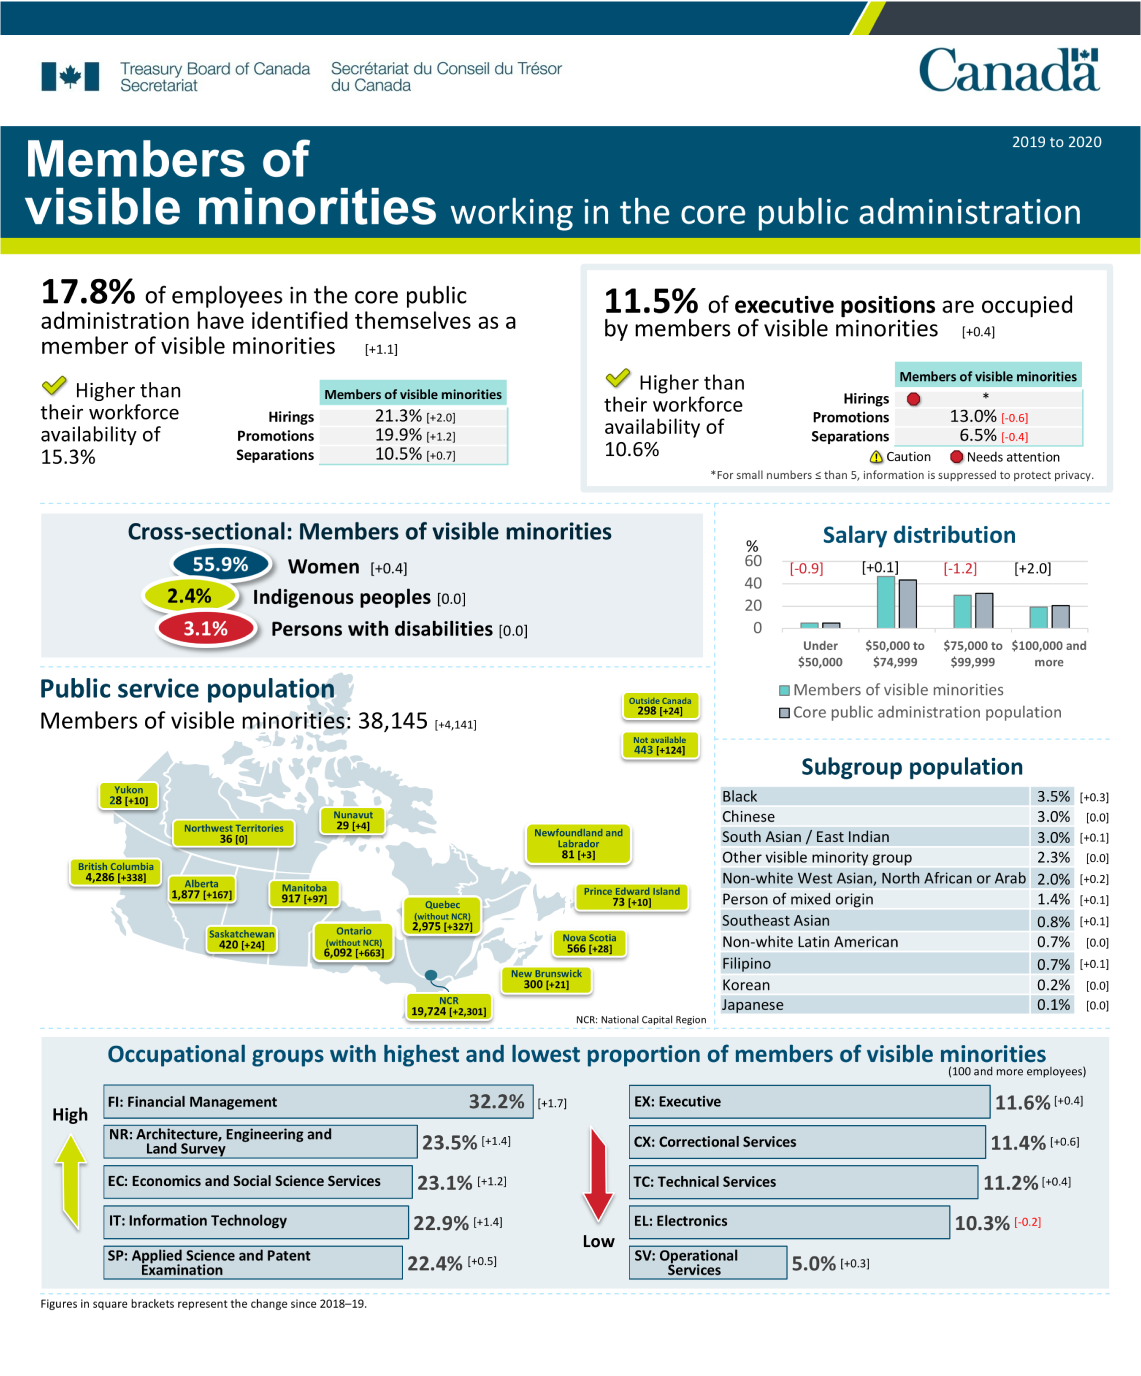
17.8% of employees in the core public administration have identified themselves as a member of visible minorities, an increase of 1.1 percentage points from last year’s report and higher than their workforce availability of 15.3%.
Degree of representation for hirings, promotions and separations
| Human resources action | Members of visible minorities |
|---|---|
| Hirings | 21.3% [+2.0] |
| Promotions | 19.9% [+1.2] |
| Separations | 10.5% [+0.7] |
11.5% of executive positions are occupied by members of visible minorities, an increase of 0.4 percentage points and higher than their workforce availability of 10.6%.
Degree of representation for hirings, promotions and separations in the executive ranks
| Human resources action | Members of visible minorities |
|---|---|
| Hirings | Footnote * |
| Promotions | 13.0% [-0.6] |
| Separations | 6.5% [-0.4] |
In these figures for degree of representation, a note of “needs attention” is indicated for hirings.
Cross-sectional analysis for members of visible minorities
- 55.9% are women, an increase of 0.4 percentage points from last year
- 2.4% have identified themselves as Indigenous, the same as last year
- 3.1% have identified themselves as a person with a disability, the same as last year
The population of members of visible minorities in the public service population is 38,145, an increase of 4,141 from last year.
The following are subtotals by province, territory and other categories:
- Newfoundland and Labrador: 81 [+3]
- Prince Edward Island: 73 [+10]
- Nova Scotia: 566 [+28]
- New Brunswick: 300 [+21]
- Quebec (without the National Capital Region): 2,975 [+327]
- National Capital Region: 19,724 [+2301]
- Ontario (without the National Capital Region): 6,092 [+663]
- Manitoba: 917 [+97]
- Saskatchewan: 420 [+24]
- Alberta: 1,877 [+167]
- British Columbia: 4,286: [+338]
- Yukon: 28 [+10]
- Northwest Territories: 36 [+0]
- Nunavut: 29 [+4]
- outside Canada: 298 [+24]
- not available: 443 [+124]
Salary distribution
| Salary | Members of visible minorities | Core public administration population |
|---|---|---|
| Under $50,000 | 4.7% [-0.9] | 4.8% |
| $50,000 to $74,999 | 46.3% [+0.1] | 43.3% |
| $75,000 to $99,999 | 29.7% [-1.2] | 31.4% |
| $100,000 and over | 19.3% [+2.0] | 20.5% |
Subgroup distribution for members of visible minorities
- Black: 3.5% [+0.3]
- Chinese: 3.0% [0.0]
- South Asian/East Indian: 3.0% [+0.1]
- Other visible minority: 2.3% [0.0]
- Non-white West Asian, North African or Arab: 2.0% [+0.2]
- Person of mixed origin: 1.4% [+0.1]
- Southeast Asian: 0.8% [+0.1]
- Non-white Latin American: 0.7% [0.0]
- Filipino: 0.7% [+0.1]
- Korean: 0.2% [0.0]
- Japanese: 0.1% [0.0]
Occupational groups with highest proportion of members of visible minorities (100 and more employees)
- FI: Financial Group: 32.2% [+1.7]
- NR: Architecture, Engineering and Land Survey: 23.5% [+1.4]
- EC: Economics and Social Sciences Services: 23.1% [+1.2]
- IT: Information Technology: 22.9% [+1.4]
- SP: Applied Science and Patent Examination: 22.4% [+0.5]
Occupational groups with lowest proportion of members of visible minorities (100 and more employees)
- EX: Executive: 11.6% [+0.4]
- CX: Correctional Services: 11.4% [+0.6]
- TC: Technical Services: 11.2% [+0.4]
- EL: Electronics: 10.3% [-0.2]
- SV: Operational Services: 5.0% [+0.3]
The source of the representation data is the Treasury Board of Canada Secretariat Employment Equity Data Bank, which is populated with self-identification information provided by employees.
To learn more
Diversity and inclusion statistics
Initiatives to support members of visible minorities
- In July 2020, the Canadian Human Rights Commission announced that it had launched an audit to specifically examine the representation of racialized people in senior-level positions across the federal public service. This audit is intended to:
- identify where employment equity gaps and barriers exist for racialized employees
- raise awareness and provide an opportunity to share best practices in hiring, retention and promotion
- In October 2019, Canadian Heritage in collaboration with the Visible Minorities Champions and Chairs Committee held a design jam to introduce new ways of exploring issues of racism, discrimination, harassment and systemic barriers. The session explored areas such as:
- the term “visible minorities” and whether this term remains the most effective language to support and promote employment equity
- prototypes for concrete solutions to issues such as self-identification, career progression barriers, and ways to better assist members of visible minorities to qualify for and obtain positions at all levels of the public service
- analysis and use of disaggregated data to better inform policies and programs pertaining to members of visible minorities within the public service
2019 Public Service Employee Survey
In this section
The Public Service Employee Survey (PSES) has historically included four demographic questions allowing respondents to self-identify as members of the four designated employment equity groups. The 2019 PSES included 112 questions on themes such as mental health, compensation, leadership, use of official languages, harassment and discrimination. The 2019 PSES section of the Open government portal has more in-depth information.
Women
Women generally had more positive results than men, except in some areas, such as ethical workplace, harassment, and some aspects of work-related stress.
Indigenous peoples
Results for Indigenous employees were much less positive than for non-Indigenous employees. Of note, Indigenous employees were less positive about organizational support for inclusion.
Persons with disabilities
Results for persons with disabilities were less positive overall. Notably, the rates of indicating harassment and discrimination among persons with disabilities were both 17% higher than for the rest of the public service.
Members of visible minorities
Members of visible minorities had similar results for most aspects of the survey when compared with members of non-visible minorities. More positive results were observed concerning senior management and mental health, but results were less positive for inclusion and empowerment.
Feedback used to measure employee perceptions
We value the feedback that public servants provide us through the PSES and other community-specific surveys, and we use it to measure the impact on employees’ perceptions of the policies and programs that organizations implement to support a safe, healthy and inclusive workplace.
The way forward: adopting an inclusive mindset
The public service is intensifying its commitments to build a work culture that values inclusiveness and diversity, recognizing the influence that this culture will have on public servants and diverse people in Canada for whom it provides services. Achieving levels of representation that reflect workforce availability, where we have done so, is an important step, but it is not enough. The day-to-day experience of individuals feeling a sense of belonging and being valued is paramount. Achieving true inclusion will involve promoting cultural competenceFootnote 2 and fostering an attitudinal shift that welcomes diverse perspectives and recognizes the talent and contribution of diverse employees.
To sustain any progress, we will need to match our efforts in achieving diversity with efforts to foster inclusion in the workplace. A workplace that is not inclusive will ultimately fail to sustain diversity, maintain employment equity, and retain its workforce. Such a workplace cannot be an environment where individuals can thrive, regardless of their background. Only recently has the profound impact of understanding and appreciating the lived experience of individuals gained widespread recognition. Expanding opportunities for sharing lived experiences in safe, positive, and supportive settings will be vital to the development of an inclusive workplace culture.
To be truly inclusive, a workplace must have targeted programs and initiatives, meaningful participation, active listening, and engagement on charting paths forward. Specific, community-based approaches will be necessary to ensure that meaningful change can be achieved and that such change resonates with our equity-seeking employees.
The 2020–21 employment equity annual report will provide an update on significant new initiatives to improve diversity and inclusion in the workplace that have been launched since spring 2020. These include efforts to:
- generate and report data that give a more accurate picture of representation gaps, which can be used to align strategies for improvement
- increase the diversity of senior leaders
- ensure appropriate benchmarks to assess progress
- support the review of the Employment Equity Act
- examine the Public Service Employment Act to address bias and barriers in staffing
- pursue further education and awareness initiatives in support of inclusion
About this report
The Employment Equity Act came into force in 1986 with the goal of achieving equality in the workplace. It seeks to correct the conditions of disadvantage experienced by four designated groups by giving effect to the principles that employment equity requires special measures and the accommodation of differences. The four employment equity groups are:
- women
- Indigenous peoples
- persons with disabilities
- members of visible minorities
In 1996, Canada’s federal public service became subject to the act and the Employment Equity Regulations.
Each fiscal year, the President of the Treasury Board must table a report in Parliament on the state of employment equity of the four designated groups within the core public administration,Footnote 3 as well as similar reports produced by separate agencies with 100 or more employees.Footnote 4
About the data
The data in this report focuses on employees to whom the regulations apply, which make up 92.6% of the active population of the core public administration:
- indeterminate employees
- employees on a term of three months or more
- seasonal employees
The data in this report is based on a mandatory self-identification form (paper or electronic) provided to all new employees. Employees may voluntarily self-identify as belonging to one or more of the designated groups.
Appendix: statistical tables of employment equity data specific to compliance requirements of section 21 of the Employment Equity Act
Table 1: distribution of public service of Canada employees by designated group according to department or agency
The following table includes information (as of March 31, 2020) regarding indeterminates, terms of three months or more, and seasonal employees of organizations captured under the Financial Administration Act, Schedules I and IV (core public administration).
| Department or agency | All employees | Women | Indigenous peoples | Persons with disabilities | Members of visible minorities | ||||
|---|---|---|---|---|---|---|---|---|---|
| Overall WFA | 52.7% | 4.0% | 9.0% | 15.3% | |||||
| Number | Number | % | Number | % | Number | % | Number | % | |
| Employment and Social Development Canada | 25,553 | 17,283 | 67.6 | 1,125 | 4.4 | 1,561 | 6.1 | 6,210 | 24.3 |
| National DefenceFootnote 1 | 24,943 | 10,197 | 40.9 | 865 | 3.5 | 1,388 | 5.6 | 2,530 | 10.1 |
| Correctional Service Canada | 17,253 | 8,530 | 49.4 | 1,800 | 10.4 | 1,067 | 6.2 | 1,986 | 11.5 |
| Public Services and Procurement Canada | 15,940 | 9,512 | 59.7 | 523 | 3.3 | 798 | 5.0 | 2,712 | 17.0 |
| Canada Border Services Agency | 13,666 | 6,411 | 46.9 | 485 | 3.5 | 508 | 3.7 | 2,455 | 18.0 |
| Fisheries and Oceans CanadaFootnote 2 | 11,909 | 4,852 | 40.7 | 569 | 4.8 | 489 | 4.1 | 867 | 7.3 |
| Health CanadaFootnote 3 | 10,553 | 7,115 | 67.4 | 902 | 8.5 | 519 | 4.9 | 2,581 | 24.5 |
| Royal Canadian Mounted Police (Civilian Staff) | 7,740 | 5,769 | 74.5 | 457 | 5.9 | 311 | 4.0 | 1,147 | 14.8 |
| Immigration, Refugees and Citizenship Canada | 7,452 | 4,790 | 64.3 | 226 | 3.0 | 338 | 4.5 | 2,413 | 32.4 |
| Environment and Climate Change Canada | 6,849 | 3,471 | 50.7 | 196 | 2.9 | 341 | 5.0 | 1,251 | 18.3 |
| Shared Services Canada | 6,686 | 2,198 | 32.9 | 234 | 3.5 | 400 | 6.0 | 1,304 | 19.5 |
| Global Affairs Canada | 6,180 | 3,453 | 55.9 | 396 | 6.4 | 240 | 3.9 | 1,543 | 25.0 |
| Transport Canada | 5,443 | 2,413 | 44.3 | 211 | 3.9 | 241 | 4.4 | 979 | 18.0 |
| Innovation, Science and Economic Development Canada | 5,160 | 2,580 | 50.0 | 144 | 2.8 | 228 | 4.4 | 1,159 | 22.5 |
| Statistics Canada | 5,071 | 2,527 | 49.8 | 127 | 2.5 | 291 | 5.7 | 1,235 | 24.4 |
| Crown-Indigenous Relations and Northern Affairs CanadaFootnote 3 | 4,879 | 3,151 | 64.6 | 1,214 | 24.9 | 245 | 5.0 | 816 | 16.7 |
| Agriculture and Agri-Food Canada | 4,810 | 2,503 | 52.0 | 162 | 3.4 | 223 | 4.6 | 847 | 17.6 |
| Department of Justice Canada | 4,670 | 3,198 | 68.5 | 181 | 3.9 | 279 | 6.0 | 954 | 20.4 |
| Natural Resources Canada | 4,188 | 1,970 | 47.0 | 113 | 2.7 | 192 | 4.6 | 688 | 16.4 |
| Veterans Affairs Canada | 3,136 | 2,278 | 72.6 | 132 | 4.2 | 223 | 7.1 | 280 | 8.9 |
| Public Health Agency of Canada | 2,142 | 1,474 | 68.8 | 71 | 3.3 | 119 | 5.6 | 496 | 23.2 |
| Treasury Board of Canada Secretariat | 2,085 | 1,256 | 60.2 | 51 | 2.4 | 129 | 6.2 | 418 | 20.0 |
| Canadian Heritage | 1,709 | 1,163 | 68.1 | 79 | 4.6 | 88 | 5.1 | 270 | 15.8 |
| Immigration and Refugee Board of Canada | 1,402 | 888 | 63.3 | 43 | 3.1 | 64 | 4.6 | 488 | 34.8 |
| Public Safety Canada | 1,157 | 688 | 59.5 | 53 | 4.6 | 74 | 6.4 | 198 | 17.1 |
| Public Prosecution Service of Canada | 987 | 652 | 66.1 | 55 | 5.6 | 54 | 5.5 | 149 | 15.1 |
| Library and Archives Canada | 963 | 597 | 62.0 | 44 | 4.6 | 46 | 4.8 | 82 | 8.5 |
| Privy Council Office | 910 | 496 | 54.5 | 37 | 4.1 | 37 | 4.1 | 172 | 18.9 |
| Public Service Commission of Canada | 863 | 556 | 64.4 | 34 | 3.9 | 73 | 8.5 | 195 | 22.6 |
| Department of Finance Canada | 792 | 369 | 46.6 | 19 | 2.4 | 36 | 4.5 | 147 | 18.6 |
| Courts Administration Service | 719 | 472 | 65.6 | 20 | 2.8 | 40 | 5.6 | 169 | 23.5 |
| Elections Canada | 713 | 365 | 51.2 | 17 | 2.4 | 46 | 6.5 | 143 | 20.1 |
| Canada School of Public Service | 607 | 398 | 65.6 | 29 | 4.8 | 36 | 5.9 | 112 | 18.5 |
| Canadian Space Agency | 606 | 274 | 45.2 | 9 | 1.5 | 36 | 5.9 | 106 | 17.5 |
| Atlantic Canada Opportunities Agency | 566 | 362 | 64.0 | 16 | 2.8 | 27 | 4.8 | 28 | 4.9 |
| Infrastructure Canada | 539 | 337 | 62.5 | 15 | 2.8 | 23 | 4.3 | 108 | 20.0 |
| Canadian Radio-television and Telecommunications Commission | 493 | 265 | 53.8 | 24 | 4.9 | 23 | 4.7 | 86 | 17.4 |
| Administrative Tribunals Support Service of Canada | 438 | 282 | 64.4 | 11 | 2.5 | 24 | 5.5 | 65 | 14.8 |
| Parole Board of Canada | 425 | 339 | 79.8 | 21 | 4.9 | 22 | 5.2 | 61 | 14.4 |
| Canadian Grain Commission | 418 | 200 | 47.8 | 23 | 5.5 | 16 | 3.8 | 106 | 25.4 |
| lmpact Assessment Agency of CanadaFootnote 4 | 389 | 261 | 67.1 | 23 | 5.9 | 14 | 3.6 | 53 | 13.6 |
| Western Economic Diversification Canada | 319 | 177 | 55.5 | 28 | 8.8 | 10 | 3.1 | 75 | 23.5 |
| Canada Economic Development for Quebec Regions | 303 | 168 | 55.4 | Footnote * | Footnote * | 10 | 3.3 | 53 | 17.5 |
| Offices of the information and Privacy Commissioners of Canada | 263 | 161 | 61.2 | 14 | 5.3 | 11 | 4.2 | 32 | 12.2 |
| Canadian Transportation Agency | 260 | 143 | 55.0 | Footnote * | Footnote * | 14 | 5.4 | 50 | 19.2 |
| Federal Economic Development Agency for Southern Ontario | 237 | 152 | 64.1 | 9 | 3.8 | 21 | 8.9 | 70 | 29.5 |
| Women and Gender Equality Canada | 226 | 192 | 85.0 | 9 | 4.0 | 13 | 5.8 | 52 | 23.0 |
| Transportation Safety Board of Canada | 211 | 75 | 35.5 | Footnote * | Footnote * | 10 | 4.7 | 26 | 12.3 |
| Registrar of the Supreme Court of Canada | 205 | 124 | 60.5 | 10 | 4.9 | 14 | 6.8 | 23 | 11.2 |
| Canadian Human Rights Commission | 204 | 144 | 70.6 | 8 | 3.9 | 32 | 15.7 | 42 | 20.6 |
| Office of the Commissioner of Official Languages | 147 | 94 | 63.9 | 6 | 4.1 | Footnote * | Footnote * | 14 | 9.5 |
| Office of the Governor General's Secretary | 139 | 85 | 61.2 | Footnote * | Footnote * | 9 | 6.5 | 22 | 15.8 |
| Canadian Northern Economic Development Agency | 94 | 62 | 66.0 | 21 | 22.3 | Footnote * | Footnote * | 16 | 17.0 |
| Patented Medicine Prices Review Board Canada | 75 | 37 | 49.3 | Footnote * | Footnote * | Footnote * | Footnote * | 11 | 14.7 |
| Civilian Review and Complaints Commission for the RCMP | 68 | 39 | 57.4 | Footnote * | Footnote * | Footnote * | Footnote * | 14 | 20.6 |
| Canadian Dairy Commission | 64 | 36 | 56.3 | Footnote * | Footnote * | Footnote * | Footnote * | 11 | 17.2 |
| Veterans Review and Appeal Board | 62 | 43 | 69.4 | Footnote * | Footnote * | 6 | 9.7 | 0 | 0.0 |
| Office of the Commissioner for Federal Judicial Affairs Canada | 55 | 36 | 65.5 | Footnote * | Footnote * | Footnote * | Footnote * | Footnote * | Footnote * |
| Military Grievances External Review Committee | 36 | 21 | 58.3 | Footnote * | Footnote * | Footnote * | Footnote * | 6 | 16.7 |
| International Joint Commission | 28 | 14 | 50.0 | 0 | 0.0 | Footnote * | Footnote * | Footnote * | Footnote * |
| Office of the Public Sector Integrity Commissioner of Canada | 26 | 14 | 53.8 | Footnote * | Footnote * | Footnote * | Footnote * | Footnote * | Footnote * |
| Office of the Commissioner of Lobbying of Canada | 23 | 9 | 39.1 | 0 | 0.0 | Footnote * | Footnote * | 0 | 0.0 |
| Military Police Complaints Commission of Canada | 20 | 13 | 65.0 | 0 | 0.0 | Footnote * | Footnote * | Footnote * | Footnote * |
| Canadian Intergovernmental Conference Secretariat | 19 | 10 | 52.6 | Footnote * | Footnote * | Footnote * | Footnote * | Footnote * | Footnote * |
| Copyright Board Canada | 14 | 7 | 50.0 | 0 | 0.0 | 0 | 0.0 | Footnote * | Footnote * |
| Secretariat of the National Security and Intelligence Committee of Parliamentarians | 9 | Footnote * | Footnote * | 0 | 0.0 | 0 | 0.0 | 0 | 0.0 |
| RCMP External Review Committee | 9 | Footnote * | Footnote * | 0 | 0.0 | 0 | 0.0 | 0 | 0.0 |
| Total | 214,120 |
117,760 |
55.0 |
10,888 |
5.1 |
11,087 |
5.2 |
38,145 |
17.8 |
Table 2: distribution of public service of Canada employees by designated group and region of work
The following table includes information (as of March 31, 2020) regarding indeterminates, terms of three months or more, and seasonal employees of organizations captured under the Financial Administration Act, Schedules I and IV (core public administration).
| Region of work | All employees | Women | Indigenous peoples | Persons with disabilities | Members of visible minorities | ||||
|---|---|---|---|---|---|---|---|---|---|
| Number | Number | % | Number | % | Number | % | Number | % | |
| Newfoundland and Labrador | 3,493 | 1,669 | 47.8 | 245 | 7.0 | 174 | 5.0 | 81 | 2.3 |
| Prince Edward Island | 2,046 | 1,295 | 63.3 | 50 | 2.4 | 124 | 6.1 | 73 | 3.6 |
| Nova Scotia | 8,874 | 4,130 | 46.5 | 502 | 5.7 | 621 | 7.0 | 566 | 6.4 |
| New Brunswick | 8,574 | 5,011 | 58.4 | 304 | 3.5 | 395 | 4.6 | 300 | 3.5 |
| Quebec (without the NCR)Footnote 1 | 22,129 | 11,657 | 52.7 | 551 | 2.5 | 744 | 3.4 | 2,975 | 13.4 |
| NCR (Quebec)Footnote 1 | 29,205 | 16,752 | 57.4 | 1,473 | 5.0 | 1,537 | 5.3 | 5,429 | 18.6 |
| NCR (Ontario)Footnote 1 | 69,291 | 38,565 | 55.7 | 2,420 | 3.5 | 3,713 | 5.4 | 14,295 | 20.6 |
| NCRFootnote 1 | 98,496 | 55,317 | 56.2 | 3,893 | 4.0 | 5,250 | 5.3 | 19,724 | 20.0 |
| Ontario (without the NCR)Footnote 1 | 25,781 | 14,403 | 55.9 | 1,235 | 4.8 | 1,482 | 5.7 | 6,092 | 23.6 |
| Manitoba | 6,966 | 4,011 | 57.6 | 990 | 14.2 | 398 | 5.7 | 917 | 13.2 |
| Saskatchewan | 4,793 | 2,911 | 60.7 | 854 | 17.8 | 240 | 5.0 | 420 | 8.8 |
| Alberta | 10,573 | 5,982 | 56.6 | 834 | 7.9 | 612 | 5.8 | 1,877 | 17.8 |
| British Columbia | 17,640 | 8,747 | 49.6 | 1,053 | 6.0 | 828 | 4.7 | 4,286 | 24.3 |
| Yukon | 326 | 204 | 62.6 | 51 | 15.6 | 22 | 6.7 | 28 | 8.6 |
| Northwest Territories | 411 | 253 | 61.6 | 69 | 16.8 | 21 | 5.1 | 36 | 8.8 |
| Nunavut | 252 | 156 | 61.9 | 113 | 44.8 | 10 | 4.0 | 29 | 11.5 |
| Outside Canada | 1,439 | 729 | 50.7 | 49 | 3.4 | 40 | 2.8 | 298 | 20.7 |
| Not availableFootnote 2 | 2,327 | 1,285 | 55.2 | 95 | 4.1 | 126 | 5.4 | 443 | 19.0 |
| Total | 214,120 |
117,760 |
55.0 |
10,888 |
5.1 |
11,087 |
5.2 |
38,145 |
17.8 |
Table 3.1: distribution of public service of Canada employees by designated group and occupational groups in force
The following table includes information (as of March 31, 2020) regarding indeterminates, terms of three months or more, and seasonal employees of organizations captured under the Financial Administration Act, Schedules I and IV (core public administration).
| Occupational group | All employees | Women | Men | Indigenous peoples | Persons with disabilities | Members of visible minorities | |||||
|---|---|---|---|---|---|---|---|---|---|---|---|
| Number | Number | % | Number | % | Number | % | Number | % | Number | % | |
| AI: Air Traffic Control | 10 | Footnote * | Footnote * | Footnote * | Footnote * | 0 | 0.0 | 0 | 0.0 | 0 | 0.0 |
| AO: Aircraft Operations | 382 | 40 | 10.5 | 342 | 89.5 | 11 | 2.9 | Footnote * | Footnote * | 10 | 2.6 |
| AU: Auditing | 152 | 76 | 50.0 | 76 | 50.0 | Footnote * | Footnote * | Footnote * | Footnote * | 42 | 27.6 |
| AV: Commerce and Purchasing | 6,200 | 3,229 | 52.1 | 2,968 | 47.9 | 251 | 4.0 | 329 | 5.3 | 1,118 | 18.0 |
| CX: Correctional Services | 7,092 | 2,014 | 28.4 | 5,075 | 71.6 | 808 | 11.4 | 268 | 3.8 | 809 | 11.4 |
| EB: Education and Library Science | 1,085 | 743 | 68.5 | 342 | 31.5 | 129 | 11.9 | 45 | 4.1 | 144 | 13.3 |
| EC: Economics and Social Science Services | 18,134 | 10,562 | 58.2 | 7,567 | 41.7 | 661 | 3.6 | 953 | 5.3 | 4,195 | 23.1 |
| EL: Electronics | 1,082 | 71 | 6.6 | 1,009 | 93.3 | 34 | 3.1 | 45 | 4.2 | 111 | 10.3 |
| EX: Executive | 5,895 | 2,970 | 50.4 | 2,925 | 49.6 | 244 | 4.1 | 278 | 4.7 | 681 | 11.6 |
| FB: Border Services | 9,673 | 3,932 | 40.6 | 5,741 | 59.4 | 372 | 3.8 | 330 | 3.4 | 1,509 | 15.6 |
| FI: Financial Management | 5,286 | 3,010 | 56.9 | 2,272 | 43.0 | 161 | 3.0 | 178 | 3.4 | 1,703 | 32.2 |
| FS: Foreign Service | 1,866 | 1,021 | 54.7 | 845 | 45.3 | 76 | 4.1 | 67 | 3.6 | 388 | 20.8 |
| HM: Human Resources Management | 4,379 | 3,518 | 80.3 | 861 | 19.7 | 213 | 4.9 | 303 | 6.9 | 781 | 17.8 |
| IT: Information Technology | 16,195 | 3,732 | 23.0 | 12,456 | 76.9 | 505 | 3.1 | 954 | 5.9 | 3,701 | 22.9 |
| LC: Law Management | 317 | 202 | 63.7 | 115 | 36.3 | 10 | 3.2 | 13 | 4.1 | 33 | 10.4 |
| LP: Law Practitioner | 3,026 | 1,767 | 58.4 | 1,253 | 41.4 | 125 | 4.1 | 177 | 5.8 | 525 | 17.3 |
| NR: Architecture, Engineering and Land Survey | 3,999 | 975 | 24.4 | 3,023 | 75.6 | 73 | 1.8 | 122 | 3.1 | 940 | 23.5 |
| PA: Program and Administrative Services | 89,149 | 64,881 | 72.8 | 24,210 | 27.2 | 5,626 | 6.3 | 5,541 | 6.2 | 16,576 | 18.6 |
| PM-MCO: Negotiation, Mediation and Conciliation Officer | 41 | 20 | 48.8 | 21 | 51.2 | Footnote * | Footnote * | Footnote * | Footnote * | Footnote * | Footnote * |
| PO: Police Operations Support | 415 | 298 | 71.8 | 115 | 27.7 | 15 | 3.6 | Footnote * | Footnote * | 47 | 11.3 |
| PR: Non-Supervisory Printing Services | 4 | Footnote * | Footnote * | Footnote * | Footnote * | Footnote * | Footnote * | 0 | 0.0 | 0 | 0.0 |
| RE: Research | 2,699 | 899 | 33.3 | 1,800 | 66.7 | 33 | 1.2 | 64 | 2.4 | 572 | 21.2 |
| RO: Radio Operations | 282 | 98 | 34.8 | 184 | 65.2 | 20 | 7.1 | 15 | 5.3 | Footnote * | Footnote * |
| SH: Health Services | 3,316 | 2,653 | 80.0 | 659 | 19.9 | 217 | 6.5 | 130 | 3.9 | 401 | 12.1 |
| SO: Ships’ Officers | 1,246 | 144 | 11.6 | 1,102 | 88.4 | 21 | 1.7 | 23 | 1.8 | 41 | 3.3 |
| SP: Applied Science and Patent Examination | 8,772 | 4,648 | 53.0 | 4,124 | 47.0 | 159 | 1.8 | 268 | 3.1 | 1,964 | 22.4 |
| SR(C): Ship Repair Chargehands and Production Supervisors (East) | 56 | Footnote * | Footnote * | Footnote * | Footnote * | Footnote * | Footnote * | Footnote * | Footnote * | Footnote * | Footnote * |
| SR(E): Ship Repair (East) | 599 | 35 | 5.8 | 564 | 94.2 | 23 | 3.8 | 26 | 4.3 | 18 | 3.0 |
| SR(W): Ship Repair (West) | 698 | 32 | 4.6 | 665 | 95.3 | 22 | 3.2 | 18 | 2.6 | 24 | 3.4 |
| SV: Operational Services | 10,403 | 2,141 | 20.6 | 8,251 | 79.3 | 540 | 5.2 | 465 | 4.5 | 525 | 5.0 |
| TC: Technical Services | 10,604 | 3,349 | 31.6 | 7,253 | 68.4 | 524 | 4.9 | 435 | 4.1 | 1,184 | 11.2 |
| TR: Translation | 842 | 638 | 75.8 | 204 | 24.2 | 7 | 0.8 | 21 | 2.5 | 56 | 6.7 |
| UT: University Teaching | 207 | 50 | 24.2 | 154 | 74.4 | Footnote * | Footnote * | Footnote * | Footnote * | 37 | 17.9 |
| Unknown | 14 | 7 | 50.0 | 7 | 50.0 | 0 | 0.0 | 0 | 0.0 | Footnote * | 14.3 |
| Total | 214,120 |
117,760 |
55.0 |
96,248 |
45.0 |
10,888 |
5.1 |
11,087 |
5.2 |
38,145 |
17.8 |
Table 3.2: distribution of public service of Canada employees by designated group and (outdated) occupational category
The following table includes information (as of March 31, 2020) regarding indeterminates, terms of three months or more, and seasonal employees of organizations captured under the Financial Administration Act, Schedules I and IV (core public administration).
| Occupational category (outdated) | All employees | Women | Indigenous peoples | Persons with disabilities | Members of visible minorities | ||||
|---|---|---|---|---|---|---|---|---|---|
| Number | Number | % | Number | % | Number | % | Number | % | |
| ExecutivesFootnote 1 | 6,212 | 3,172 | 51.1 | 254 | 4.1 | 291 | 4.7 | 714 | 11.5 |
| EX (Executive) | 5,895 | 2,970 | 50.4 | 244 | 4.1 | 278 | 4.7 | 681 | 11.6 |
| LC (Law Management) | 317 | 202 | 63.7 | 10 | 3.2 | 13 | 4.1 | 33 | 10.4 |
| Scientific and Professional | 41,355 | 22,342 | 54.0 | 1,378 | 3.3 | 1,765 | 4.3 | 8,816 | 21.3 |
| Administrative and Foreign Service | 105,165 | 65,623 | 62.4 | 5,639 | 5.4 | 6,071 | 5.8 | 20,716 | 19.7 |
| Technical | 13,640 | 3,733 | 27.4 | 631 | 4.6 | 523 | 3.8 | 1,354 | 9.9 |
| Administrative Support | 18,794 | 14,427 | 76.8 | 1,201 | 6.4 | 1,323 | 7.0 | 3,610 | 19.2 |
| Operational | 28,940 | 8,456 | 29.2 | 1,785 | 6.2 | 1,114 | 3.8 | 2,933 | 10.1 |
| Undetermined | 14 | 7 | 50.0 | 0 | 0.0 | 0 | 0.0 | Footnote * | Footnote * |
| Total | 214,120 |
117,760 |
55.0 |
10,888 |
5.1 |
11,087 |
5.2 |
38,145 |
17.8 |
Table 4: distribution of public service of Canada employees by designated group and salary range
The following table includes information (as of March 31, 2020) regarding indeterminates, terms of three months or more, and seasonal employees of organizations captured under the Financial Administration Act, Schedules I and IV (core public administration).
| Salary range ($) | All employees | Women | Indigenous peoples | Persons with disabilities | Members of visible minorities | |||||||||
|---|---|---|---|---|---|---|---|---|---|---|---|---|---|---|
| Number | % of all employees | Number | % of salary range | % of EEFootnote † group | Number | % of salary range | % of EEFootnote † group | Number | % of salary range | % of EEFootnote † group | Number | % of salary range | % of EEFootnote † group | |
| Under 5,000 | 61 | 0.0 | Footnote * | Footnote * | Footnote * | 0 | 0.0 | 0.0 | 0 | 0.0 | 0.0 | 0 | 0.0 | 0.0 |
| 5,000 to 9,999 | 175 | 0.1 | 52 | 29.7 | 0.0 | Footnote * | Footnote * | Footnote * | Footnote * | Footnote * | Footnote * | Footnote * | Footnote * | Footnote * |
| 10,000 to 14,999 | 66 | 0.0 | Footnote * | Footnote * | Footnote * | Footnote * | Footnote * | Footnote * | Footnote * | Footnote * | Footnote * | Footnote * | Footnote * | Footnote * |
| 15,000 to 19,999 | 201 | 0.1 | 118 | 58.7 | 0.1 | 10 | 5.0 | 0.1 | 12 | 6.0 | 0.1 | 43 | 21.4 | 0.1 |
| 20,000 to 24,999 | 214 | 0.1 | 149 | 69.6 | 0.1 | 9 | 4.2 | 0.1 | 8 | 3.7 | 0.1 | 40 | 18.7 | 0.1 |
| 25,000 to 34,999 | 651 | 0.3 | 527 | 81.0 | 0.4 | 44 | 6.8 | 0.4 | 40 | 6.1 | 0.4 | 102 | 15.7 | 0.3 |
| 35,000 to 49,999 | 8,948 | 4.2 | 6,162 | 68.9 | 5.2 | 507 | 5.7 | 4.7 | 545 | 6.1 | 4.9 | 1,593 | 17.8 | 4.2 |
| 50,000 to 74,999 | 92,653 | 43.3 | 57,986 | 62.6 | 49.2 | 5,137 | 5.5 | 47.2 | 5,234 | 5.6 | 47.2 | 17,670 | 19.1 | 46.3 |
| 75,000 to 99,999 | 67,327 | 31.4 | 32,610 | 48.4 | 27.7 | 3,675 | 5.5 | 33.8 | 3,235 | 4.8 | 29.2 | 11,322 | 16.8 | 29.7 |
| 100,000 to 149,999 | 40,265 | 18.8 | 18,338 | 45.5 | 15.6 | 1,384 | 3.4 | 12.7 | 1,816 | 4.5 | 16.4 | 6,920 | 17.2 | 18.1 |
| 150,000 to 199,999 | 3,240 | 1.5 | 1,615 | 49.8 | 1.4 | Footnote * | Footnote * | Footnote * | 170 | 5.2 | 1.5 | 406 | 12.5 | 1.1 |
| 200,000 to 249,999 | 314 | 0.1 | Footnote * | Footnote * | Footnote * | Footnote * | Footnote * | Footnote * | 15 | 4.8 | 0.1 | Footnote * | Footnote * | Footnote * |
| 250,000 and over | 5 | 0.0 | Footnote * | Footnote * | Footnote * | 0 | 0.0 | 0.0 | 0 | 0.0 | 0.0 | Footnote * | Footnote * | Footnote * |
| Total | 214,120 |
100.0 |
117,760 |
55.0 |
100.0 |
10,888 |
5.1 |
100.0 |
11,087 |
5.2 |
100.0 |
38,145 |
17.8 |
100.0 |
Table 5: hirings into, promotions within and separations from the public service of Canada by designated group
The following table includes information (as of March 31, 2020) regarding indeterminates, terms of three months or more, and seasonal employees of organizations captured under the Financial Administration Act, Schedules I and IV (core public administration).
| Action type | All employees | Women | Indigenous peoples | Persons with disabilities | Members of visible minorities | ||||
|---|---|---|---|---|---|---|---|---|---|
| Number | Number | % | Number | % | Number | % | Number | % | |
| Hirings | 24,901 | 14,505 | 58.3 | 988 | 4.0 | 977 | 3.9 | 5,302 | 21.3 |
| Promotions | 27,211 | 16,628 | 61.1 | 1,332 | 4.9 | 1,133 | 4.2 | 5,405 | 19.9 |
| Separations | 13,043 | 7,459 | 57.2 | 697 | 5.3 | 931 | 7.1 | 1,371 | 10.5 |
NotesThe source of the representation data is the Treasury Board of Canada Secretariat Employment Equity Data Bank, which is populated with self-identification information provided by employees. The sum of designated groups does not equal the total (“all employees”) because employees may have voluntarily chosen to self-identify in more than one designated group, and men are included in the total. “Hirings” refers to employees who were added to the public service of Canada payroll between April 1, 2019, and March 31, 2020. Data on promotions are obtained from the Public Service Commission of Canada and include information from departments and agencies that fall under both the Financial Administration Act, Schedules I and IV, and the Public Service Employment Act. “Separations” refers to employees who left the public service of Canada payroll between April 1, 2019, and March 31, 2020. Percentages are that designated group’s share of all actions of the given type. |
|||||||||
Table 6: distribution of public service of Canada employees by designated group and age range
The following table includes information (as of March 31, 2020) regarding indeterminates, terms of three months or more, and seasonal employees of organizations captured under the Financial Administration Act, Schedules I and IV (core public administration).
| Age range | All employees | Women | Indigenous peoples | Persons with disabilities | Members of visible minorities | |||||||||
|---|---|---|---|---|---|---|---|---|---|---|---|---|---|---|
| Number | % of all employees | Number | % of age range | % of EEFootnote † group | Number | % of age range | % of EEFootnote † group | Number | % of age range | % of EEFootnote † group | Number | % of age range | % of EEFootnote † group | |
| Under 20 | 116 | 0.1 | 50 | 43.1 | 0.0 | 6 | 5.2 | 0.1 | Footnote * | Footnote * | Footnote * | Footnote * | Footnote * | Footnote * |
| 20 to 24 | 5,920 | 2.8 | 3,537 | 59.7 | 3.0 | 267 | 4.5 | 2.5 | 177 | 3.0 | 1.6 | 1,370 | 23.1 | 3.6 |
| 25 to 29 | 18,657 | 8.7 | 11,143 | 59.7 | 9.5 | 755 | 4.0 | 6.9 | 633 | 3.4 | 5.7 | 4,538 | 24.3 | 11.9 |
| 30 to 34 | 22,030 | 10.3 | 12,258 | 55.6 | 10.4 | 1,032 | 4.7 | 9.5 | 736 | 3.3 | 6.6 | 4,663 | 21.2 | 12.2 |
| 35 to 39 | 29,342 | 13.7 | 16,536 | 56.4 | 14.0 | 1,372 | 4.7 | 12.6 | 1,073 | 3.7 | 9.7 | 5,603 | 19.1 | 14.7 |
| 40 to 44 | 33,762 | 15.8 | 19,312 | 57.2 | 16.4 | 1,699 | 5.0 | 15.6 | 1,501 | 4.4 | 13.5 | 6,357 | 18.8 | 16.7 |
| 45 to 49 | 32,181 | 15.0 | 18,007 | 56.0 | 15.3 | 1,856 | 5.8 | 17.0 | 1,708 | 5.3 | 15.4 | 5,427 | 16.9 | 14.2 |
| 50 to 54 | 30,284 | 14.1 | 16,461 | 54.4 | 14.0 | 1,822 | 6.0 | 16.7 | 1,906 | 6.3 | 17.2 | 4,529 | 15.0 | 11.9 |
| 55 to 59 | 25,519 | 11.9 | 12,872 | 50.4 | 10.9 | 1,346 | 5.3 | 12.4 | 1,937 | 7.6 | 17.5 | 3,260 | 12.8 | 8.5 |
| 60 to 64 | 11,836 | 5.5 | 5,634 | 47.6 | 4.8 | 556 | 4.7 | 5.1 | 1,015 | 8.6 | 9.2 | 1,677 | 14.2 | 4.4 |
| 65 to 69 | 3,516 | 1.6 | 1,555 | 44.2 | 1.3 | 145 | 4.1 | 1.3 | 317 | 9.0 | 2.9 | 533 | 15.2 | 1.4 |
| 70+ | 955 | 0.4 | 393 | 41.2 | 0.3 | 32 | 3.4 | 0.3 | 80 | 8.4 | 0.7 | 186 | 19.5 | 0.5 |
| Unknown | Footnote * | 0.0 | Footnote * | 100.0 | 0.0 | 0 | 0.0 | 0.0 | Footnote * | Footnote * | Footnote * | Footnote * | Footnote * | Footnote * |
| Total | 214,120 |
100.0 |
117,760 |
55.0 |
100.0 |
10,888 |
5.1 |
100.0 |
11,087 |
5.2 |
100.0 |
38,145 |
17.8 |
100.0 |
Table 7: representation in the public service of Canada by designated group and fiscal year
The following table includes information (as of March 31, 2020) regarding indeterminates, terms of three months or more, and seasonal employees of organizations captured under the Financial Administration Act, Schedules I and IV (core public administration).
| Public service representation | All employees | Women | Indigenous peoples | Persons with disabilities | Members of visible minorities | ||||
|---|---|---|---|---|---|---|---|---|---|
| Number | Number | % | Number | % | Number | % | Number | % | |
| As at March 31, 2020 | 214,120 | 117,760 | 55.0 | 10,888 | 5.1 | 11,087 | 5.2 | 38,145 | 17.8 |
| As at March 31, 2019 | 203,268 | 111,332 | 54.8 | 10,435 | 5.1 | 10,622 | 5.2 | 34,004 | 16.7 |
| As at March 31, 2018 | 192,467 | 105,465 | 54.8 | 9,876 | 5.1 | 10,181 | 5.3 | 30,273 | 15.7 |
| As at March 31, 2017 | 185,484 | 101,136 | 54.5 | 9,726 | 5.2 | 10,259 | 5.5 | 28,058 | 15.1 |
| As at March 31, 2016 | 181,674 | 98,846 | 54.4 | 9,358 | 5.2 | 10,092 | 5.6 | 26,336 | 14.5 |
| As at March 31, 2015 | 180,681 | 98,051 | 54.3 | 9,232 | 5.1 | 10,204 | 5.6 | 24,849 | 13.8 |
| As at March 31, 2014 | 181,356 | 98,078 | 54.1 | 9,239 | 5.1 | 10,390 | 5.7 | 23,919 | 13.2 |
| As at March 31, 2013 | 188,342 | 102,124 | 54.2 | 9,491 | 5.0 | 10,871 | 5.8 | 23,812 | 12.6 |
| As at March 31, 2012 | 198,793 | 108,620 | 54.6 | 9,785 | 4.9 | 11,418 | 5.7 | 23,978 | 12.1 |
| As at March 31, 2011 | 202,631 | 111,051 | 54.8 | 9,486 | 4.7 | 11,388 | 5.6 | 22,998 | 11.3 |
| As at March 31, 2010 | 202,386 | 110,867 | 54.8 | 9,307 | 4.6 | 11,620 | 5.7 | 21,567 | 10.7 |
| As at March 31, 2009 | 195,667 | 107,089 | 54.7 | 8,892 | 4.5 | 11,468 | 5.9 | 19,264 | 9.8 |
| As at March 31, 2008 | 186,754 | 101,589 | 54.4 | 8,190 | 4.4 | 11,001 | 5.9 | 17,207 | 9.2 |
| As at March 31, 2007 | 179,540 | 96,816 | 53.9 | 7,610 | 4.2 | 10,192 | 5.7 | 15,787 | 8.8 |
| As at March 31, 2006 | 176,630 | 95,013 | 53.8 | 7,381 | 4.2 | 10,169 | 5.8 | 15,112 | 8.6 |
| As at March 31, 2005 | 165,856 | 88,702 | 53.5 | 6,886 | 4.2 | 9,626 | 5.8 | 13,498 | 8.1 |
| As at March 31, 2004 | 165,976 | 88,175 | 53.1 | 6,723 | 4.1 | 9,452 | 5.7 | 13,001 | 7.8 |
| As at March 31, 2003 | 163,314 | 86,162 | 52.8 | 6,426 | 3.9 | 9,155 | 5.6 | 12,058 | 7.4 |
| As at March 31, 2002 | 157,510 | 82,663 | 52.5 | 5,980 | 3.8 | 8,331 | 5.3 | 10,772 | 6.8 |
| As at March 31, 2001 | 149,339 | 77,785 | 52.1 | 5,316 | 3.6 | 7,621 | 5.1 | 9,143 | 6.1 |
| As at March 31, 2000Footnote * (Revenue Canada excluded) |
141,253 | 72,549 | 51.4 | 4,639 | 3.3 | 6,687 | 4.7 | 7,764 | 5.5 |
| As at March 31, 1999 (Revenue Canada included) |
178,340 | 91,856 | 51.5 | 5,124 | 2.9 | 8,137 | 4.6 | 10,557 | 5.9 |
| As at March 31, 1998 | 179,831 | 90,801 | 50.5 | 4,770 | 2.7 | 6,943 | 3.9 | 9,260 | 5.1 |
| Workforce availability | |||||||||
| 2016 Census and 2017 Canadian Survey on Disability | n/a | n/a | 52.7 | n/a | 4.0 | n/a | 9.0 | n/a | 15.3 |
| 2011 National Household Survey and 2012 Canadian Survey on Disability | n/a | n/a | 52.5 | n/a | 3.4 | n/a | 4.4 | n/a | 13.0 |
| 2006 Census and Participation and Activity Limitation Survey (PALS) | n/a | n/a | 52.3 | n/a | 3.0 | n/a | 4.0 | n/a | 12.4 |
| 2001 Census and PALS | n/a | n/a | 52.2 | n/a | 2.5 | n/a | 3.6 | n/a | 10.4 |
| 1996 Census and 1991 Health and Activity Limitation Survey (HALS) | n/a | n/a | 48.7 | n/a | 1.7 | n/a | 4.8 | n/a | 8.7 |
| 1991 Census and HALS | n/a | n/a | 47.3 | n/a | 2.6 | n/a | 4.8 | n/a | 9.0 |
Footnotes
© Her Majesty the Queen in Right of Canada, represented by the President of the Treasury Board, 2021
ISSN: 1926-2485
Page details
- Date modified: