
Sodium reduction in select processed foods: Interim assessment
Background
Sodium is an essential nutrient that the body needs in small amounts to maintain health. Too much sodium increases the risk of chronic conditions such as high blood pressure, which affects about 1 in 4 adults in Canada. High blood pressure is a risk factor for heart disease and stroke, which continue to be leading causes of death in Canada, after cancer.Footnote 1
Most people in Canada eat too much sodium, with the majority coming from processed and commercially prepared foods. In 2012, Health Canada established the first set of voluntary sodium reduction targets to help reduce sodium levels in the food supply, encouraging the industry to meet them by the end of 2016. The targets were designed to encourage gradual reductions, while still maintaining food safety, quality, and consumer acceptance.
In 2017, when progress was measured, it was found that despite modest reductions, the sodium targets were not met for most food categories. Sodium intakes remain high among people living in Canada and excess sodium persists in many food products. As part of the Healthy Eating Strategy, Health Canada is committed to working with food industry stakeholders to gradually and safely reduce sodium levels in the food supply.
In December 2020, Health Canada released revised voluntary sodium reduction targets for many processed food categories. Targets were adjusted based on feedback from industry stakeholders and insights gained from the first set of targets and assessment of progress. The targets are intended to guide industry in reducing the sodium content of foods by the end of 2025. They continue to apply to processed foods sold in retail as well as those destined for further processing, such as ingredients and ready-to serve items sold to restaurants and foodservice establishments.
The targets have the same components: a sales-weighted average (SWA) that applies to the category and a maximum level that applies to individual items within a category. A SWA is an average amount of sodium in each food category that considers the amount of products sold for that category in one year in Canada.Footnote 2 The use of SWA is considered a best practice as it considers contribution of the product to sodium intakes more accurately than a simple average. It gives more weight to the products that people purchased more, and less weight to the products that people purchased less. Maximum levels were established to encourage reductions in the saltiest foods in each category. A detailed description of the targets and an example of how to calculate a SWA can be found in the components of the sodium reduction targets.
This report summarizes the results of Health Canada's assessment of progress toward the revised sodium targets in select processed food categories.
Methods
To assess progress toward the 2025 targets, Health Canada surveyed nine processed food categories:
- White pantry bread and rolls, bagels, croissants, and flatbreads (1ba)
- Whole wheat and mixed grain pantry bread and rolls, bagels, croissants, and flat breads (1bb)
- Pizza crust (1bc)
- Hearth bread (1ca)
- Hearth and non-hearth bread with savoury additions (1cb)
- Ready-to-eat cereals (2a)
- Processed cheese and other cheese products (3f)
- Ready-to-serve soups (9a)
- Tomato sauce (11c)
A category was chosen for one or more of the following reasons: its targets were revised in 2020, it is a staple food category, or it is an important contributor to the intake of sodium in the diets of people living in Canada.
Sales data were used to design a food label sampling plan to collect a representative number of foods from each of the nine categories which would cover about 80% of the market for each category. Information from the food labels including the Nutrition Facts table values, ingredients, and product description were coded and the data was verified to ensure accuracy and to minimize transcription errors.
Sodium information from the food labels was converted to milligrams of sodium per 100 grams. This information was combined with sales data (kilograms) to calculate the SWA sodium levels in each food category. This data was compared to baseline data collected by Health Canada in 2017Footnote 3 and to 2025 targets to determine the progress made by industry in reducing sodium in these categories.
Results
In total, 1,283 food labels were sampled from grocery stores across Canada between October 2023 and July 2024. The collected sample represented around 80% of market sales (kilograms), except for pizza crust, which was around 60%.
Overall, the results indicate that only modest progress has been made toward the 2025 SWA sodium targets (Figure 1). Table 1 shows the measured 2023-2024 SWA sodium levels, a comparison to 2017 levels (baseline) and the 2025 targets.
Hearth breads (e.g. baguettes, crusted bread, artisan breads, rye bread, and pumpernickel bread) made the most progress toward the SWA, achieving 40% of the 2025 target reduction. White bread products, breads with savoury additions (e.g. olives, garlic, onion, and cheese), processed cheeses, and ready-to-serve soups made less progress. Four categories had higher sodium levels compared to 2017: pizza crust, tomato sauce, ready-to-eat cereals, and whole wheat and mixed grain bread products.
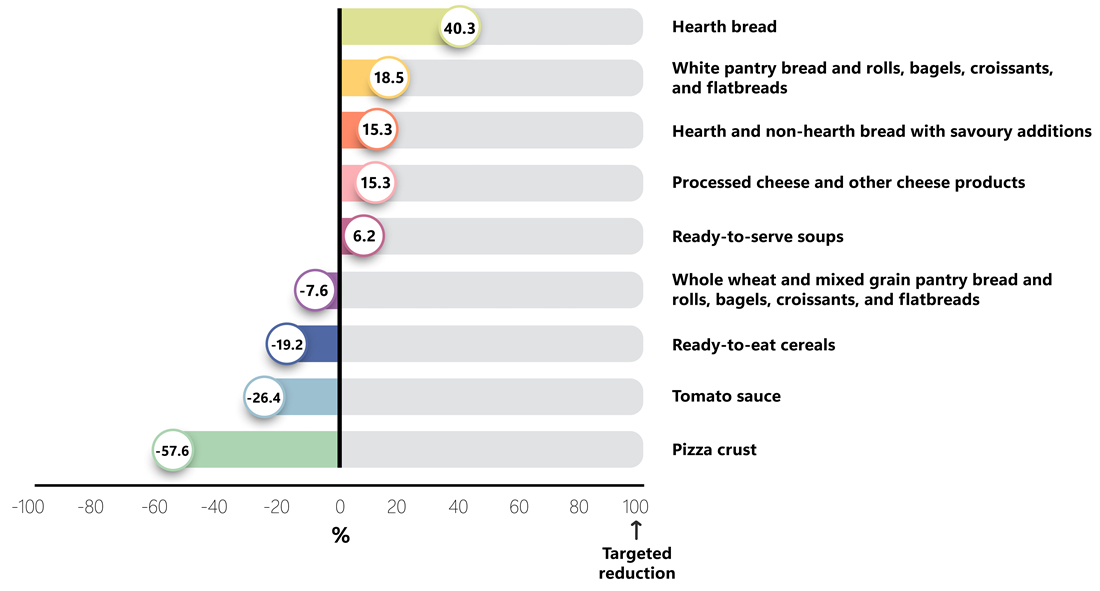
Figure 1 - Text equivalent
| Food category | Percentage progress |
|---|---|
| Hearth bread | 40.3 |
| White pantry bread and rolls, bagels, croissants, and flatbreads | 18.5 |
| Hearth and non-hearth bread with savoury additions | 15.3 |
| Processed cheese and other cheese products | 15.3 |
| Ready-to-serve soups | 6.2 |
| Whole wheat and mixed grain pantry bread and rolls, bagels, croissants, and flatbreads | −7.6 |
| Ready-to-eat cereals | −19.2 |
| Tomato sauce | −26.4 |
| Pizza crust | −57.6 |
Three categories (ready-to-serve soups, white bread products, and tomato sauce) successfully reduced sodium in their saltiest products close to the maximum level targets (results not shown).
Conclusion
These results are not intended to be a representative or comprehensive indication of the overall food supply. However, they are a critical checkpoint in assessing sodium reduction efforts in the categories studied. This assessment reveals that only modest progress has been made toward the 2025 SWA sodium targets in the categories surveyed.
Health Canada continues to encourage the food industry to achieve the targets for all processed food categories by the end of 2025 to help bring the average sodium intake of Canadians close to 2300 mg/day, the level expected to reduce the risk of developing chronic diseases such as cardiovascular disease.Footnote 4
Following 2025, Health Canada plans to conduct additional monitoring of processed food categories and report on progress toward meeting the targets.
Table 1: 2017 baseline levels, 2023-2024 interim monitoring results and 2025 targets for select food categories
The sales-weighted average targets apply to the sales-weighted average sodium for all company products within the category.
| Food Category | Food Category Description | 2017 Measured Level (baseline)Footnote 5 | 2023-2024 Measured Level | Change from baseline | 2025 Targets |
|---|---|---|---|---|---|
| Sales Weighted Average mg sodium per 100 g product |
Sales Weighted Average mg sodium per 100 g product |
Sales Weighted Average mg sodium per 100 g product |
Sales Weighted Average mg sodium per 100 g product |
||
| 1. Bakery products (levels also apply to gluten free products) | |||||
| 1ba. White pantry bread and rolls, bagels, croissants, and flatbreadsTable 1 Footnote ** | Prepackaged white sliced breads, bagels, croissants (includes frozen doughs as consumed), flatbreads (e.g. pita, Greek flatbread), diet or low calorie breads, and pantry rolls and buns. Also includes par-baked bread and rolls. | 445 | 429 | −16 | 360Table 1 Footnote ** |
| 1bb. Whole wheat and mixed grain pantry bread and rolls, bagels, croissants, and flatbreadsTable 1 Footnote ** | Prepackaged whole wheat and mixed grain sliced breads (includes breads with whole wheat and mixed grains as main ingredients), bagels, croissants (includes frozen doughs as consumed), flatbreads (e.g. pita, Greek flatbread), diet or low calorie breads, and pantry rolls and buns. Also includes par-baked bread and rolls. | 387 | 392 | +4 | 330 |
| 1bc. Pizza crustTable 1 Footnote ** | Pizza crust | 466 | 504 | +38 | 400Table 1 Footnote ** |
| 1ca. Hearth breadTable 1 Footnote ** | Bread baked directly on the hearth or in a pan without sides for crispier crusts, e.g. baguettes, crusted bread, artisan breads, rye bread, and pumpernickel bread. Also includes bread mixes and frozen dough as consumed. | 504 | 474 | −30 | 430Table 1 Footnote ** |
| 1cb. Hearth and non-hearth bread with savoury additionsTable 1 Footnote ** | Hearth and non-heart bread with additions, e.g. olives, garlic, onion, and cheese. Also includes bread mixes and frozen dough as consumed. | 548 | 536 | −12 | 470 |
| 2. Breakfast cereals | |||||
| 2a. Ready-to-eat cereals | Granola, muesli, shredded, flaked, puffed, extruded, and high-fibre compact cereals. | 393 | 399 | +6 | 360 |
| 3. Dairy products and substitutes | |||||
| 3f. Processed cheese and other cheese products | Processed cheese products made from an emulsified blend of natural cheese. Includes spreads, blocks, and slices with or without added ingredients. Excludes string cheese. | 1444 | 1413 | −31 | 1240 |
| 9. Soups | |||||
| 9a. Ready-to-serve soupsTable 1 Footnote *** | Ready-to-serve soups. | 279 | 277 | −2 | 240 |
| 11. Sauces, dips, gravies and condiments | |||||
| 11c. Tomato sauce | Shelf stable plain or flavoured tomato sauce. Excludes tomato-based pasta sauces and tomato paste. | 334 | 357 | +22 | 250 |