
Annual Report 2024
ISSN: 1495-0561
Catalogue number: H78E-PDF
PDF version (2.6 MB)
Table of Contents
Statistical Highlights 2024
Price Review Mandate
- In 2024, 1,137 patented medicines for human use were reported to the PMPRB, including 53 new medicines.
Price Trends
- The national list price for patented medicines increased by 1.0% in 2024, while the Consumer Price Index rose by 2.4%.
- Canadian list prices in 2024 were, on average, higher than those in each of the PMPRB11 countries. When expanding the comparison to a broader set of OECD countries using MIDAS® data, Canadian prices ranked fifth highest among 31 countries.
Sales Trends
- Sales of patented medicines in Canada were $22.1 billion in 2024, an increase of 10.9% over the previous year. This was driven primarily by an increase in the use of new and higher-cost medicines.
- Patented medicines accounted for 47% of the sales for all medicines in Canada in 2024.
Research and DevelopmentFootnote 1 (R&D)
- The R&D-to-sales ratio for all Rights Holders in Canada was 4.1% in 2024, an increase from 3.7% in 2023.
- Rights Holders reported $1.29 billion in total R&D expenditures, an increase of 21.1% over 2023.
Letter to the Minister
8 October 2025
The Honourable Marjorie Michel, P.C., M.P.
Minister of Health
House of Commons
Ottawa, Ontario
K1A 0A6
Dear Minister:
I have the pleasure to present to you, in accordance with sections 89 and 100 of the Patent Act, the Annual Report of the Patented Medicine Prices Review Board for the year ended December 31, 2024.
Yours very truly,
Anie Perrault, LL.L, ASC
Acting Chairperson
Chairperson’s Message

The Patented Medicine Prices Review Board (PMPRB) is an independent quasi-judicial body established by Parliament in 1987 under the Patent Act (the Act). The PMPRB’s mandate is to protect and inform Canadians by ensuring that the prices of patented medicines sold in Canada are not excessive and by reporting on trends in pharmaceutical pricing.
The PMPRB is currently moving into the implementation stage of our multi-year reform process, having introduced new PMPRB Guidelines in June 2025—which will take effect in January 2026—to address the amended Patented Medicines Regulations brought into force in July 2022. As a Board, we have been deeply appreciative for the feedback and collaboration received from interested parties over the course of this development process and are committed to providing support for the transition with clear and transparent communication of our next steps.
This Annual Report offers an update on the status of our price review process in 2024, as we operated under the Interim Guidance issued in September 2023, as well as pricing trends over the course of the year. For a forward look at the next five years at the PMPRB, I encourage you to read through our recently released Strategic Plan, which lays out our guiding principles and commitments for 2026 to 2030 and how we plan to achieve them.
Our analysis of the market for patented medicines in 2024 characterizes the difference in domestic and international markets for pharmaceuticals. Canadian list prices for patented medicines rose by 1.0% in 2024 while prices in most comparator countries declined. For this reason, Canadian prices were at the top of the PMPRB comparator countries (“PMPRB11”) this year and fifth among the broader set of OECD countries. In general, countries with a GDP per capita similar to Canada tended to have lower prices for patented medicines. Sales of patented medicines in Canada increased by 10.9% to reach $22.1 billion in 2024, representing 47% of the sales of all medicines. At the same time, Rights Holders reported close to $1.4 billion in total spending on research and development (R&D), up 21% from the year before. A closer look at these R&D expenditures shows that over three quarters of reporting companies had an R&D-to-sales ratio below 5%, with 46% reporting no R&D expenditures for 2024. Canada’s overall R&D-to-sales ratio remains well below the average for PMPRB11 countries.
As a last note, I would like to acknowledge the contributions of Mr. Thomas Digby, who stepped down from his post as Chairperson of the PMPRB in March 2025 to pursue other opportunities. In his two years at the helm, Mr. Digby led the Board through a period of realignment with considerable vision and a sincere engagement with the PMPRB’s mandate. As Vice-Chairperson, I am stepping into the role on an acting basis until such a time as a new Chairperson can be named. Together with the members of the Board, I had the pleasure of finalizing the new Guidelines and ensuring their publication, as promised, in June 2025. It is now an honor for me to work with my fellow Board members and all PMPRB staff on the implementation of these Guidelines, as we prioritize efficiency and evidence-based decision making in our work.
Anie Perrault, LL.L, ASC
Acting Chairperson
About the Patented Medicine Prices Review Board
The Patented Medicine Prices Review Board (PMPRB) is an independent, quasi-judicial body established by Parliament in 1987 under the Patent Act (Act).
The PMPRB is a quasi-judicial administrative body with the mandate to monitor the price at which rights holders sell their patented medicines in Canada to ensure that this price is not excessive. The PMPRB is also responsible for reporting annually to Parliament through the Minister of Health on its activities for the previous year, pricing trends of all patented medicines, and research and development (R&D) expenditures reported to the PMPRB by pharmaceutical rights holders.
The PMPRB contributes to sustainable spending on pharmaceuticals in Canada by:
- acting as an effective check on the prices of patented medicines and intervening where the Board determines a price to be excessive; and
- reporting annually on trends in pharmaceutical sales and pricing and on research and development spending by pharmaceutical rights holders.
In addition, at the request of the Minister of Health under section 90 of the Act, the PMPRB conducts analysis of price, utilization, and cost trends for patented and non-patented medicines under the National Drug Utilization Information System (NPDUIS) research initiative. The reports prepared through this initiative provide pharmaceutical payers and policy makers with information to support evidence-based reimbursement and pricing decisions.
The PMPRB is part of the Health Portfolio, which includes Health Canada, the Public Health Agency of Canada, the Canadian Institutes of Health Research, and the Canadian Food Inspection Agency. The Health Portfolio supports the Minister of Health in maintaining and improving the health of Canadians. Because of its quasi-judicial responsibilities, the PMPRB carries out its mandate at arm’s length from the Minister, who is responsible for the sections of the Act pertaining to the PMPRB.
Where does the PMPRB fit in Canada’s healthcare ecosystem?
The PMPRB’s mandate is an independent piece of a complex ecosystem that manages the medicines approved in Canada.
This includes healthcare-related bodies, such as:
- Health Canada, which approves medicines for marketing in Canada based on their safety, efficacy, and quality;
- Canada’s Drug Agency (CDA-AMC), which performs health technology assessment and assembles expert committees to make recommendations on which medicines should qualify for reimbursement under publicly funded drug programs, as well as the Institut national d’excellence en santé et en services sociaux (INESSS), which evaluates medicines to make recommendations on reimbursement by public plans in Quebec;
- The pan-Canadian Pharmaceutical Alliance (pCPA), which negotiates the list prices on behalf of the publicly funded drug programs across Canada (both federal and provincial, including Quebec); and
- Federal, provincial, and territorial (F/P/T) public and private drug plans, which approve the listing of medicines on their respective formularies for reimbursement purposes.
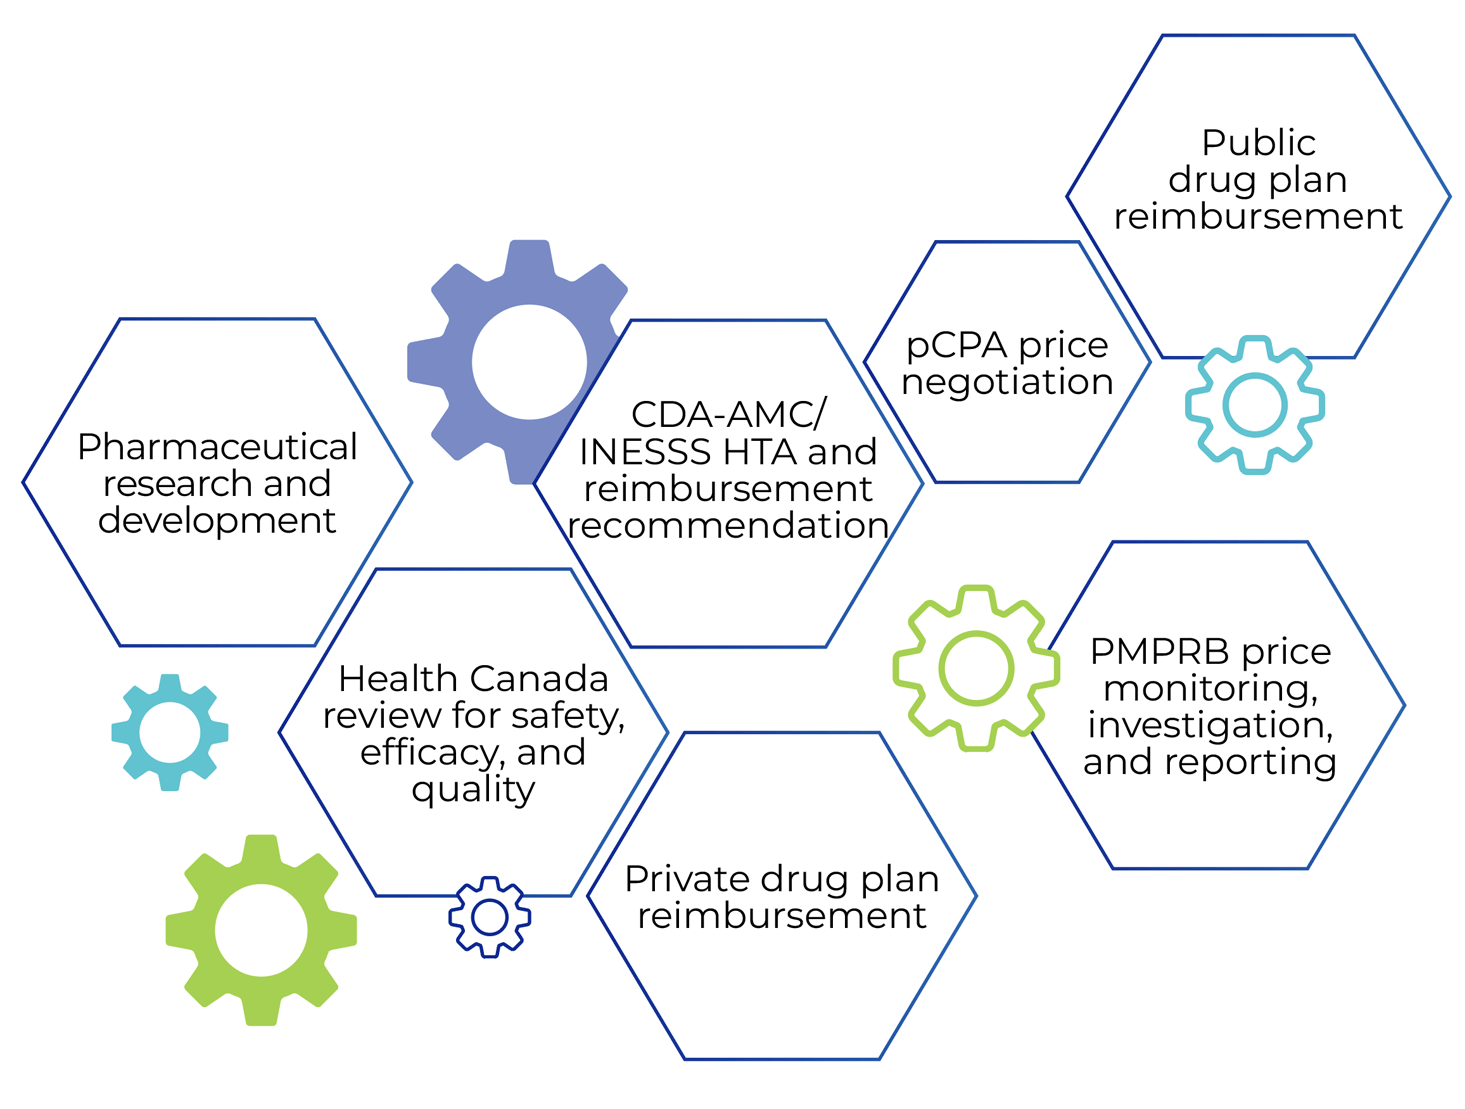
Figure description
This chart illustrates the multiple actors in the Canadian prescription medicine ecosystem, represented as gears:
- Pharmaceutical research and development;
- Health Canada review for safety, efficacy, and quality;
- PMPRB price monitoring and investigation;
- Private drug plan reimbursement;
- Canada Drug Agency (CDA-AMC) and Institut national d'excellence en santé et en services sociaux (INESSS) health technology assessment (HTA) and reimbursement recommendation;
- Pan-Canadian Pharmaceutical Alliance (pcPA) price negotiation;
- Public drug plan reimbursement.
CDA: Canada’s Drug Agency (formerly the Canadian Agency for Drugs and Technologies in Health); INESSS: Institut national d'excellence en santé et en services sociaux; HTA: health technology assessment; pCPA: pan-Canadian Pharmaceutical Alliance.
Did You Know?
Since 1987, costs for patented and generic (or non-patented) medicines in Canada have grown at an average annual rate of 6.7%, close to three times the rate of inflation. Pharmaceutical expenditures make up 13.7% of total health care spending.i
Spending on all prescription drugs in Canada in 2024 was estimated to be close to $43.7 billion. Of this, 41% was paid for by the public sector, 38% by private insurers, and 21% out of pocket by Canadians.i
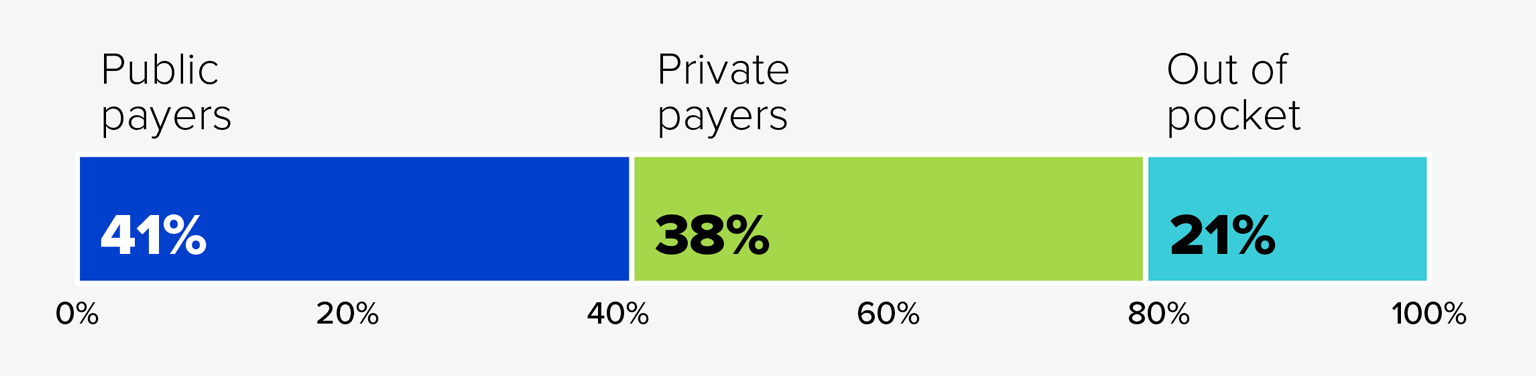
Figure description
This chart shows the distribution of prescription medicine sales in 2024 by payer. Public payers accounted for 41% of sales, private payers accounted for 38% of sales, and the remaining 21% were paid out of pocket.
Data source: Canadian Institute for Health Expenditures (CIHI), National health expenditure trends, 2024
In 2022, the Conference Board of Canada estimated that 2.8% of Canadians (approximately 1.1 million people) are not insured for prescription drug coverage.ii This gap has narrowed in recent years, owing largely to the introduction of OHIP+ in Ontario, but it does not consider the millions of Canadians who are underinsured for their prescribed medications. Two thirds (67%) of Canadians took or were prescribed medication in 2021, yet one fifth (21%) of the total population reported not having insurance to cover any of the cost of their prescription medications.iii This percentage fluctuated across the provinces and was higher among racialized groups (29%).
As a result, about 1 in 8 Canadians (13% of the Canadian population) spent $500 or more out of pocket on prescription medications in 2021, and close to 1 in 10 Canadians (9%) reported skipping doses, delaying filling, or otherwise not adhering to their prescriptions because of cost.iii
Notes
i Canadian Institute for Health Information (CIHI), National Health Expenditures Trends, 2024 (November 2024)
ii Conference Board of Canada, Understanding the Gap 2.0 (May 2022)
iii Statistics Canada, Pharmaceutical access and use during the pandemic (November 2022)
Jurisdiction
Price Review
The PMPRB reviews the price at which Rights Holders (companies) sell their products to wholesalers, hospitals, pharmacies, and other large distributors to ensure that this price is not excessive. This price is sometimes also known as the factory gate (or ex-factory) price.
The PMPRB only reviews the prices of patented medicines, which means that non-patented medicines are not under the PMPRB’s jurisdiction. Patents are a form of intellectual property that protect inventions by allowing the patent holder the right to stop others from making, using, or selling their invention during the life of the patent. Patented medicines, in the PMPRB context, are those that have an “invention pertaining to a medicine,” namely where the invention “is intended or capable of being used for medicine or for the preparation or production of medicine.”
The Act requires Rights Holders to inform the PMPRB of their intention to sell a new patented medicine. Rights Holders include any parties who are “entitled to the benefit of a patent” regardless of whether they are owners or licensees under those patents and regardless of whether they operate in the “brand” or “generic” sector of the market. Rights Holders are required to file price and sales information when a new patented medicine is first sold and regularly thereafter, until all relevant patents have expired. Rights Holders are not required to get approval of the price to be able to market their medicines. However, the Act requires the PMPRB to ensure that the prices of patented medicines sold in Canada are not excessive.
1,137 Patented Medicines were reported to the PMPRB in 2024.
Staff review the prices that Rights Holders charge for each individual strength and form of a patented medicine, in consideration of the factors set out in section 85 of the Act.Footnote 2 If the price of a patented medicine appears to be potentially excessive, the Rights Holder may volunteer to lower the price and/or make a payment to the Government of Canada through a voluntary undertaking. Otherwise, the Chairperson may consider whether a hearing on the matter is in the public interest. At the hearing, a panel composed of Board members acts as a neutral arbiter between Staff and the Rights Holder. If, after hearing all of the evidence in light of the factors set out in the Act, the Hearing Panel concludes that the price of a patented medicine is/was excessive in any market in Canada, it can order the price to be reduced to a non-excessive level. It can also order a Rights Holder to make a payment to the Government of Canada to offset the excess revenues earned and can double the amount of this payment if there has been a policy of excessive pricing.
Reporting
As required by the Act, the PMPRB reports annually to Parliament through the Minister of Health on its activities for the previous year, pricing trends of all medicines, and R&D expenditures reported to the PMPRB by pharmaceutical Rights Holders.
In addition, as a result of a request from the federal Minister of Health under section 90 of the Act, the PMPRB prepares reports for the Minister that contain critical analyses of price, utilization, and cost trends for patented and non-patented medicines. These reports are prepared by the NPDUIS research initiative group of the PMPRB and are also published online.
Communications and Outreach
The PMPRB takes a proactive and plain-language approach to its external communication activities. This includes targeted social media campaigns and more conventional (e.g., email) engagement with domestic, international, and specialized news media. The PMPRB continues to monitor for additional opportunities to leverage new and emerging media to communicate with the Canadian public.
The PMPRB recognizes the importance of openness and transparency as it modernizes the way it carries out its mandate. To this end, the PMPRB monitors and communicates progress made on projected timelines and key milestones. Engagement with interested groups remains a central part of this multi-faceted communications approach.
Governance
The PMPRB is composed of no more than five Board members who serve on a part-time basis and who are assisted in their work by public servants (Staff). Board members, including a Chairperson and a Vice-Chairperson, are appointed by the Governor in Council. The Chairperson, designated under the Act as the Chief Executive Officer of the PMPRB, has the authority and responsibility to supervise and direct its work. By law, the Vice-Chairperson exercises all the powers and functions of the Chairperson when the Chairperson is absent or incapacitated, or when the office of the Chairperson is vacant.
The members of the Board, including the Chairperson, are collectively responsible for implementing the applicable provisions of the Act. Together, they establish the guidelines, general rules, and by-laws of the PMPRB provided for by the Act (section 96) and consult, as necessary, with the federal and provincial ministers responsible for health; representatives of consumer groups, including those representing patients; the pharmaceutical industry; and others.
Members of the Board
For more information, see the Organizational Structure page of the PMPRB website.
Acting Chairperson
Anie Perrault
Anie Perrault was appointed Vice-Chairperson of the Board on August 10, 2023, and has been the Acting Chair since March 6, 2025.
Ms. Anie Perrault is a lawyer by training with more than 30 years of professional experience in the public and private sectors. Her career has focused on communications and public affairs related to genomic research and biotechnology and she has held several strategic positions at a national level in this field. She was Director General of BIOQuébec from 2013 to 2022 and Vice President, Communications of Genome Canada from 2001 to 2006. Ms. Perrault also served on the Canadian Human Rights Tribunal from 2015 to 2022, where she issued decisions and also acted as a mediator.
Vice-Chairperson
Anie Perrault – see above.
Members
Sharon Blady

Sharon Blady was appointed to the Board on October 11, 2024.
Sharon Blady (PhD) is a senior executive with more than 15 years of healthcare, government, and public policy expertise. She is the former Health Minister of Manitoba and Founder-CEO of Speak Up: Mental Health + Neurodiversity. Sharon has served on numerous healthcare-related boards, and taught in Indigenous studies, gender studies, nursing, social work, and psychology.
Peter Moreland-Giraldeau

Peter Moreland-Giraldeau was appointed to the Board on October 6, 2023.
Peter Moreland-Giraldeau is an administrative law lawyer currently working as Legal Counsel for the Appeals Commission for Alberta Workers’ Compensation. Peter obtained his LLB from the University of Leicester and his LLM from the University of British Columbia.
Dr. Emily Reynen

Dr. Emily Reynen was appointed to the Board on October 20, 2023.
Dr. Emily Reynen completed both undergraduate and doctorate degrees in Pharmacy at the University of Toronto Leslie Dan Faculty of Pharmacy, and obtained her medical degree from the McGill University Faculty of Medicine. Dr. Reynen currently practices as a staff intensivist at Quinte Health Care Belleville General Hospital site and is an Adjunct Assistant Professor at Queen’s University.
Organizational Structure and Staff
PMPRB Organizational Chart (August 2025)
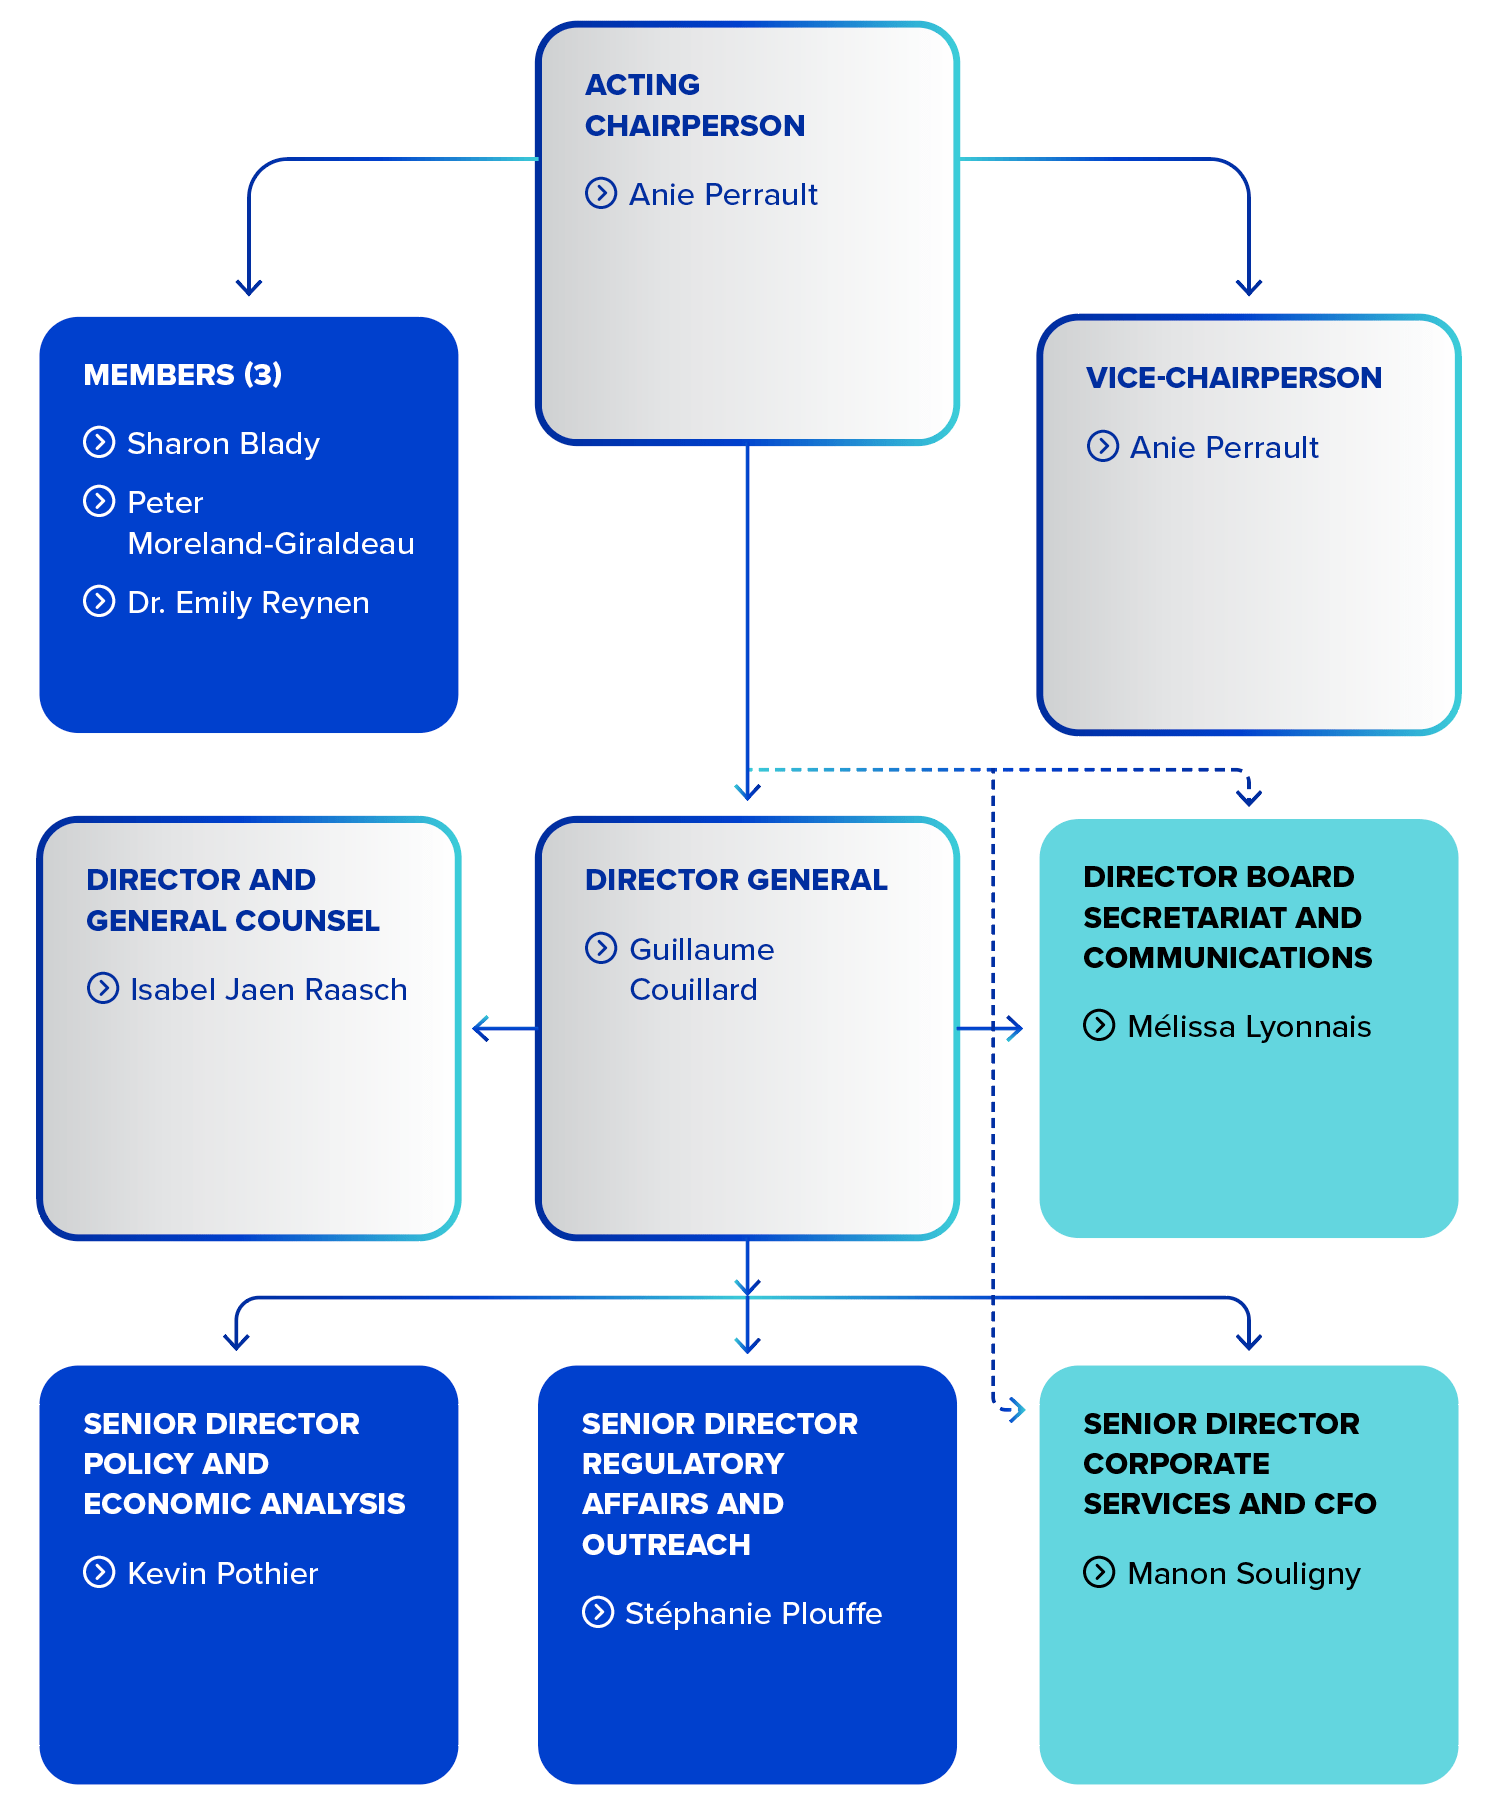
Figure description
This organizational chart illustrates the high-level reporting structure within the PMPRB and lists the current Board and Senior Staff members, as of August 2024. Board: Acting Chairperson— Anie Perrault; Vice-Chairperson— Anie Perrault; Members— Sharon Blady, Peter Moreland-Giraldeau, Dr. Emily Reynen. Senior Staff: Director General — Guillaume Couillard; Director and General Counsel— Isabel Jaen Raasch; Director Board Secretariat and Communications— Mélissa Lyonnais; Senior Director Policy and Economic Analysis— Kevin Pothier; Senior Director Regulatory Affairs and Outreach—Stéphanie Plouffe; Senior Director Corporate Services and CFO— Manon Souligny.
Director General
The Director General is responsible for advising the Board and for the leadership and management of Staff.
Regulatory Affairs and Outreach
The Regulatory Affairs and Outreach Branch reviews the prices of patented medicines sold in Canada, ensures that Rights Holders are fulfilling their filing obligations, conducts investigations on the prices of patented medicines, and conducts outreach sessions with Rights Holders.
Policy and Economic Analysis
The Policy and Economic Analysis Branch develops policy and strategic advice; leads consultations and makes recommendations on possible amendments to the PMPRB’s Guidelines; conducts research and analysis on the prices of medicines, pharmaceutical market developments, and R&D trends; and submits reports to the Minister of Health with centralized, objective, and credible information in support of evidence-based policy.
Corporate Services
The Corporate Services Branch provides advice and services in relation to human resources management; facilities; procurement; health, safety, and security; information technology; and information management.
It coordinates activities pursuant to the Access to Information Act and the Privacy Act, as well as strategic planning and reporting. It is also responsible for financial planning and reporting, accounting operations, audit and evaluation, and liaising with federal central agencies on these topics.
Board Secretariat and Communications
The Board Secretariat manages the Board’s meeting and hearing processes, including the official record of proceedings. The Communications team manages the PMPRB’s external and internal communications, including the PMPRB’s website, social media, NEWSletter, responses to public and media enquiries, and translation services.
General Counsel
The General Counsel advises the PMPRB on legal matters, leads the legal team representing Staff in proceedings before the Board, and liaises with counsel for the Attorney General in PMPRB-related proceedings before federal and provincial courts.
Budget
In 2024–25, the PMPRB had a Main Estimates budget of $17.7 million and an approved staff level of 81 full-time equivalent employees.
Table 1. Budget and Staffing
| 2023-24 | 2024-25 | 2025-26 | |
|---|---|---|---|
| Budget* | $17,093,674 | $17,746,047 | $18,128,932 |
| Salaries and employee benefits | $10,257,961 | $10,910,335 | $11,293,219 |
| Operating | $2,372,352 | $2,372,352 | $2,372,352 |
| Special Purpose Allotment† | $4,463,361 | $4,463,361 | $4,463,361 |
| Full Time Employees (FTEs) | 81 | 81 | 81 |
Notes
* Budget amounts are based on the Main Estimates.
† The Special Purpose Allotment is reserved strictly for external costs of public hearings (legal counsel, expert witnesses, etc.). Unspent funds are returned to the Consolidated Revenue Fund.
Price Review Activities
The PMPRB works in the interest of Canadians to ensure that the prices of patented medicines sold in Canada are not excessive. It does this by reviewing the prices that Rights Holders charge for individual patented medicines and by ensuring that Rights Holders reduce their prices and pay back excess revenues, where appropriate. This section provides a summary of the reporting requirements for Rights Holders, as well as price reviews, undertakings, hearings, and matters before the courts in 2024.
Reporting Requirements
By law, Rights Holders must file information about the sale of their medicines in Canada.Footnote 3 The Act and the Patented Medicines Regulations (Regulations) set out the information required and Staff review pricing information on an ongoing basis until all relevant patents have expired.
Amending Regulations to the Act that came into force on July 1, 2022, implemented a new basket of schedule countries for which Rights Holders must provide comparative price information and reduced reporting requirements for medicines at the lowest risk of excessive pricing. A broader group of 11 reference countries (PMPRB11) are now used in place of the previous seven (PMPRB7), removing the United States and Switzerland and adding Australia, Belgium, Japan, the Netherlands, Norway, and Spain.
New Guidelines were issued by the Board on June 30, 2025, and will take effect on January 1, 2026. At that time, the Interim Guidance will cease to apply, and the relevant provisions of the new Guidelines will apply to the prices of sales made during the Interim Period.
Meanwhile, the amended Interim Guidance issued by the Board on September 27, 2023, remains in effect and is applicable for the period covered in this Annual Report. The amended Interim Guidance constitutes measures that apply during a temporary period and does not constitute full “Guidelines”. It is instead designed as a simple and temporary process that allows Rights Holders to have some ability to predict how their international price filings based on the PMPRB11 would affect the level of scrutiny applied during internal administrative price reviews at the PMPRB, in the absence of full Guidelines.
Guidelines are not binding and are developed in consultation with stakeholders, including the federal and provincial ministers responsible for health; consumer groups, including those representing patients; health care professionals; and the pharmaceutical industry.
Failure to File Price and Sales Data
Failure to file occurs when a Rights Holder fails, either completely or partially, to report required information including sales and pricing information and/or investment in Canadian research and development information, to the PMPRB, as mandated by the Act and the Regulations. There were no Board Orders issued for failure to file in 2024.Footnote 4
Price Review
The PMPRB reviews the Canadian prices of each strength of each individual dosage form of each patented medicine reported by Rights Holders pursuant to the Regulations. In most cases, this unit is consistent with the Drug Identification Number(s) (DINs) assigned by Health Canada at the time the medicine is approved for sale in Canada.
New Patented Medicines Reported to the PMPRB in 2024
For the purpose of this report, a new patented medicine in 2024 is defined as any patented medicine or new dosage form or strength of a patented medicine first sold in Canada, or previously sold but first patented, between December 1, 2023, and December 1, 2024.
There were 53 new patented medicines for human use reported as sold in 2024. Some are one or more strengths of a new medicinal ingredient, and others are new presentations of existing medicines. Of these 53 new patented medicines, five were sold in Canada prior to the issuance of the Canadian patent that brought it under the PMPRB’s jurisdiction.
Price Review of Existing Patented Medicines for Human Use in 2024
For the purpose of this report, existing patented medicines include all patented medicines first sold and reported to the PMPRB prior to December 1, 2023.
At the time of this report, there were 1,084 existing patented medicines:
- 454 were not the subject of investigations;
- 430 were the subject of investigations (including investigations commenced prior to July 1, 2022);
- 198 were patented medicines without a MAPP (Maximum Average Potential Price) or projected NEAP (Non-Excessive Average Price) as of July 1, 2022;
- 1 was the subject of an undertaking;Footnote 5 and
- 1 was subject to a Settlement Agreement and Order.
Status Updates in 2024
Since the new Guidelines were only published in June 2025 and will not be in effect until January 1, 2026, status updates will be deferred until new Guidelines are in place.
Complaints Regarding Patented Over-the-Counter Medicines, Patented Generic Medicines, and Patented Medicines for Veterinary Use
Reduced reporting obligations for certain generic medicines (previously, reduced reporting obligations only applied to over-the-counter and veterinary medicines) came into force on July 1, 2022, as provided for in the Amended Regulations. Staff only review the prices of patented over-the counter medicines, patented generic medicines, and patented veterinary medicines when a complaint of excessive pricing has been received. No complaints related to these kinds of medicines were received in 2024.
Complaints Regarding Patented Medicines
The PMPRB investigates complaints from Canadians who are concerned that they are being charged too much for their medication. Once the complaint is received, Staff determine whether the medicine is patented and if it falls under the PMPRB’s jurisdiction. If the medicine is not patented, the matter is closed. If the medicine is patented, the price information that Rights Holders are required by law to file with the PMPRB is re-examined in light of the complaint. A total of 15 complaints were received by the PMPRB in 2024. As Interim Guidance is currently in place, no complaints-based investigations were opened.
Certificates of Supplemental Protection
Amendments made to the patented medicines section of the Act that came into force on June 30, 2021, extended the PMPRB’s jurisdiction to medicines that are protected by a Certificate of Supplementary Protection (CSP). A CSP gives the certificate holder the same legal rights given by the patent for a maximum period of two years after the patent expiry date. There were 7 CSPs reported to the PMPRB in 2024, with expiration dates ranging from 2030 to 2039. Each patent that had its duration extended through a CSP can be linked to multiple patented medicines. In total, there are 29 patented medicines linked to the 7 CSPs reported in 2024.
Undertakings and Hearings
Undertakings
An undertaking is a promise by a Rights Holder to adjust its price(s) and/or pay potential excess revenues to the Government of Canada.Footnote 6 The consideration of an undertaking is an administrative procedure and does not constitute an admission or determination by the PMPRB that the price submitted by the Rights Holder, or used to calculate potential excess revenues, is not excessive. However, the receipt of an undertaking can be taken into consideration by the Chairperson when deciding whether an investigation should be closed. No undertakings were approved in 2024 or between January 1 and March 31, 2025.
Hearings
The PMPRB holds hearings into two types of matters: excessive pricing and failure to file.
Excessive Pricing
The PMPRB can hold public hearings to determine whether the price of a medicine is excessive. During a hearing, submissions and evidence from the parties are heard by a Hearing Panel of at least two Board members. The Hearing Panel determines whether a patented medicine is being, or has been, sold at an excessive price in any market in Canada by taking into consideration the available information relating to the factors set out in section 85 of the Act. If the Hearing Panel finds the price is excessive, it can issue an order to reduce the maximum price of the patented medicine in question (or of another patented medicine of the Rights Holder) and/or to offset revenues received as a result of the excessive price. Judicial review of Board decisions can be sought in the Federal Court of Canada. No excessive pricing hearings were commenced in 2024 or between January 1 and March 31, 2025.
Failure to File
The PMPRB can hold public hearings to determine whether a Rights Holder has failed to file information as per the filing requirements set out in the Act and Regulations. If the Hearing Panel finds that the Rights Holder has failed to file, they can order the Rights Holder to report the required pricing and sales information.
No failure to file hearings were commenced in 2024 or between January 1 and March 31, 2025.
Summary
Since 1993, 175 undertakings have led to investigation closures. In addition, 31 notices of hearing have been issued, 14 of which were resolved through settlements prior to the hearing on the merits and 17 of which were subject to a full public hearing on the merits (10 related to allegations of excessive pricing and 7 related to allegations of failure to file). These measures resulted in price reductions and/or payments to the Government of Canada. Over $243 million has been collected through undertakings, settlements, and Board Orders through payments to the Government of Canada.
Matters Before the Federal Court, Federal Court of Appeal, and Supreme Court of Canada or Other Courts
T-906-20: On January 18, 2017, Galderma Canada Inc. filed an application for judicial review of the Board’s decision dated December 19, 2016. In that decision the Board found that Canadian Patent No. 2,478,237 pertains to the patented medicine adapalene sold under the trade name Differin and ordered Galderma to file the required information for the period between January 1, 2010, and March 14, 2016. The Federal Court granted Galderma’s judicial review application on November 9, 2017, and quashed the Board’s decision. On November 21, 2017, the Attorney General appealed the Federal Court’s grant of the judicial review application. On June 28, 2019, the Federal Court of Appeal granted the appeal and issued its decision sending the matter back to the Board for redetermination. The Board’s decision on redetermination, issued on May 7, 2020, again ordered Galderma to file the required information for the period between January 1, 2010, and March 14, 2016. On August 11, 2020, Galderma Canada Inc. filed an application for judicial review of the Board’s May 7, 2020, decision on redetermination (T-906-20), which was dismissed by the Federal Court on January 11, 2024. On February 9, 2024, Galderma Canada Inc. filed a notice of appeal against the Federal Court’s January 11, 2024, decision (A-61-24).
A-61-24: On December 3, 2024, the Federal Court of Appeal granted Galderma’s appeal and set aside the Federal Court’s decision. It also granted Galderma’s application for judicial review and set aside the Board’s order dated May 7, 2020, which would have required Galderma to file information for the period between January 1, 2010, and March 14, 2016. This matter is now closed.
Table 2. Status of Board Proceedings in 2023 up to May 31, 2024
| Medicine | Indication/use | Rights holder | Issuance of notice of hearing | Status |
|---|---|---|---|---|
| – | – | – | – | – |
| Medicine | Indication/use | Rights Holder | Issuance of notice of hearing | Status |
|---|---|---|---|---|
| Adapalene (sold under trade names Differin and Differin XP) | Acne | Galderma Canada Inc. | (redetermination) |
Board Order: May 7, 2020. Galderma to file the required information for the requested period. * Application for Judicial Review and prior litigation: see below. |
| Medicine | Indication/use | Applicant | Issue | Date of notice of hearing/status |
|---|---|---|---|---|
| Adapalene (sold under trade names Differin and Differin XP) | Acne | Galderma Canada Inc. | Failure to file (jurisdiction) |
Application for Judicial Review. Court File T-83-17 (Re. Board Panel’s decision of December 19, 2016): Decision issued November 9, 2017, quashing in part Board Panel’s decision. Notice of Appeal (Federal Court of Appeal) filed on November 21, 2017. Court File A-385-17. Decision issued on June 28, 2019. Matter sent for redetermination by the Board. Redetermination decision issued on May 7, 2020. Application for Judicial Review filed on August 11, 2020. Court File T-906-20. Application for Judicial Review dismissed on January 11, 2024. Notice of Appeal (Federal Court of Appeal) filed on February 9, 2024. Court File A-61-24. Decision issued on December 3, 2024. Appeal and judicial review both granted. Matter is now closed. |
Pharmaceutical Pricing Trends
The PMPRB fulfills its annual reporting mandate by providing information on trends in pharmaceutical pricing in Canada, based on information submitted by Rights Holders on their sales of patented medicines, including quantities sold, list and net prices, and net revenues. This section includes analysis on the price, use, and salesFootnote 7 of patented medicines in Canada and international markets, as well as the factors that contribute to these trends.Footnote 8
The analysis in this Annual Report is based on list prices, which refer to the ex-factory price (before any rebates or discounts) filed with the PMPRB by Rights Holders pursuant to paragraph 4(1)(f)(i) or (ii) of the Patented Medicines Regulations.
Disclaimer
Although select statistics reported in the Pharmaceutical Pricing Trends section are based in part on data obtained under license from the MIDAS® database proprietary to IQVIA Solutions Canada Inc. and/or its affiliates (“IQVIA”), the statements, findings, conclusions, views, and opinions expressed in this Annual Report are exclusively those of the PMPRB and are not attributable to IQVIA.
Methodology Note: List Prices
In past editions of the Annual Report, a portion of the analysis was based on average transaction prices (ATP), an estimate of net price calculated by dividing sales for a medicine by the number of units sold.Footnote 9 As of the 2023 Annual Report, this section is now based uniformly on list prices.
There are a number of reasons for this change. Firstly, list prices are directly related to the pharmaceutical ecosystem in Canada and are relevant to all Canadians. They are the prices that non-insured Canadians pay at the pharmacy (before applicable pharmacy mark-ups), and the base prices on which insured Canadians calculate their co-pays.
List prices are also the common ground for:
- price negotiations between insurers and industry;
- product listing agreements by drug plans;
- wholesale distributor prices; and
- pharmacy reimbursement by drug plans.
Secondly, the international price information filed by Rights Holders with the PMPRB consists of list prices. Comparisons of Canadian to foreign prices are most accurate if all prices are in the same category.
Lastly, by switching to list price for this analysis, the information presented below is now more consistent from figure to figure, more comparable from country to country, and more compatible with other public sources of pharmaceutical analysis.
It is important to note that neither the list price nor the net price (ATP) is the true price paid by insured Canadians or by public or private insurers, who often negotiate discounts with the companies selling the medicine, its distributors, and pharmacies.
Price Trends
Average list prices for patented medicines in Canada may increase or decrease from one year to the next, depending on several factors in the pharmaceutical market. To chart this trend, the PMPRB uses the Patented Medicines Price Index (PMPI). The PMPI measures the average year-over-year change in the list prices of patented medicines sold in Canada. The average is weighted by the sales of each individual medicine and is based on list price and sales information submitted by Rights Holders for a six-month period.Footnote 10
This is similar to the approach Statistics Canada uses for the Consumer Price Index (CPI).
Figure 1 shows the year-over-year changes in the PMPI and the CPI side by side over two decades, from 2005 to 2024. General price inflation, as measured by the CPI, has exceeded the average increase in the prices of patented medicines almost every year since 2005. In 2024, the CPI rose by 2.4%, while the PMPI increased by 1.0%.
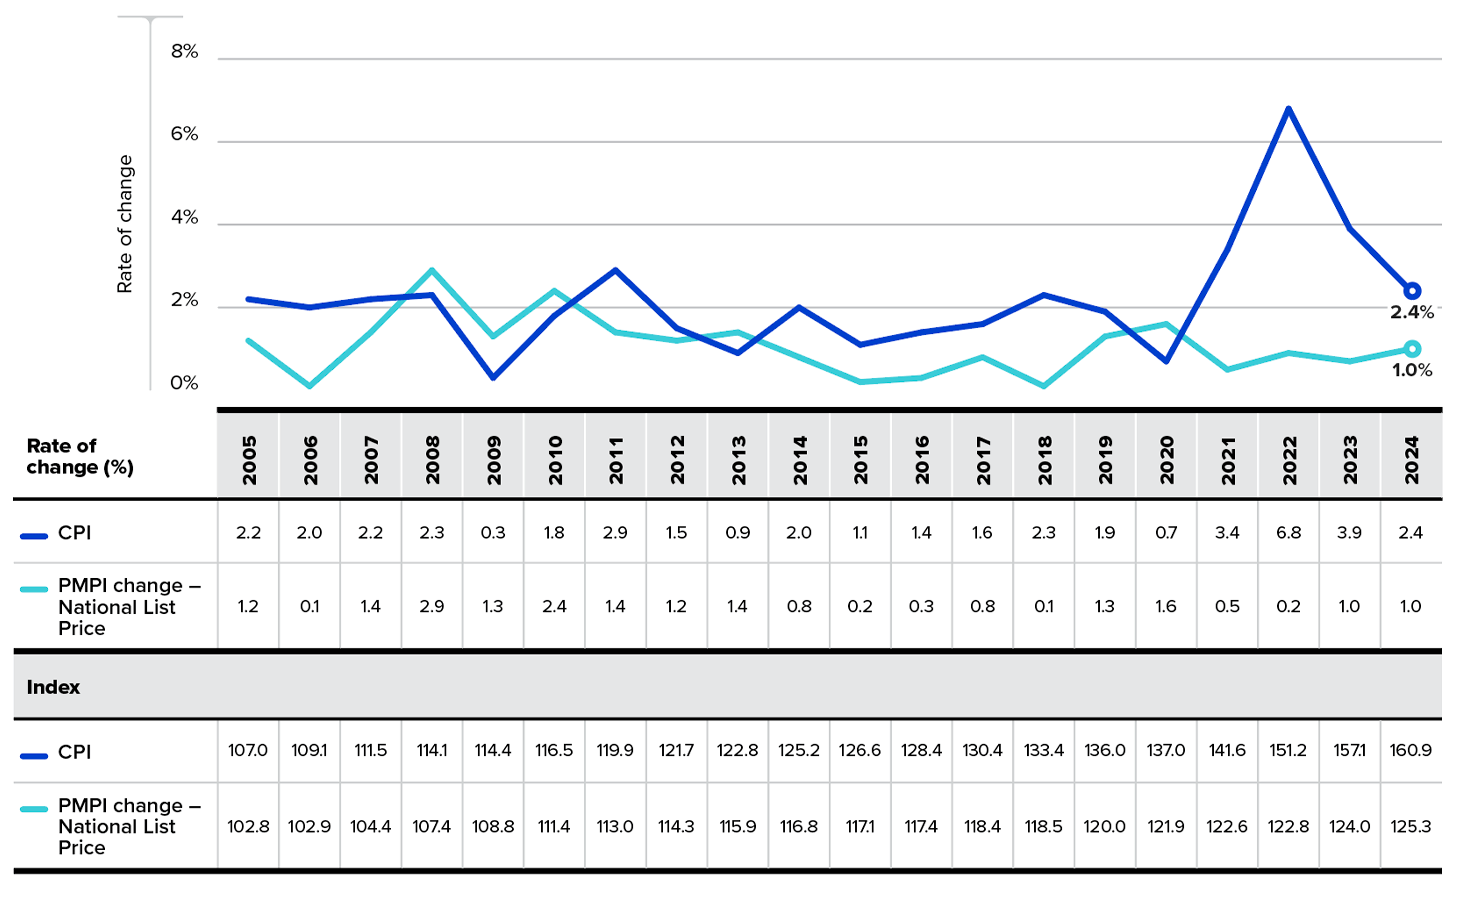
Figure description
This line graph depicts the year-over-year percent changes in the PMPI and CPI for the years 2005 to 2024. The PMPI is based on the national list price in Canada. Results are given as a rate of change and as an index in a table below the graph. The base year for the index is 2002, with the index set to 100.
| Year | CPI rate of change | CPI index | PMPI rate of change (National List Price) | PMPI index (National List Price) |
|---|---|---|---|---|
| 2005 | 2.2% | 107.0 | 1.2% | 102.8 |
| 2006 | 2.0% | 109.1 | 0.1% | 102.9 |
| 2007 | 2.2% | 111.5 | 1.4% | 104.4 |
| 2008 | 2.3% | 114.1 | 2.9% | 107.4 |
| 2009 | 0.3% | 114.4 | 1.3% | 108.8 |
| 2010 | 1.8% | 116.5 | 2.4% | 111.4 |
| 2011 | 2.9% | 119.9 | 1.4% | 113.0 |
| 2012 | 1.5% | 121.7 | 1.2% | 114.3 |
| 2013 | 0.9% | 122.8 | 1.4% | 115.9 |
| 2014 | 2.0% | 125.2 | 0.8% | 116.8 |
| 2015 | 1.1% | 126.6 | 0.2% | 117.1 |
| 2016 | 1.4% | 128.4 | 0.3% | 117.4 |
| 2017 | 1.6% | 130.4 | 0.8% | 118.4 |
| 2018 | 2.3% | 133.4 | 0.1% | 118.5 |
| 2019 | 1.9% | 136.0 | 1.3% | 120.0 |
| 2020 | 0.7% | 137.0 | 1.6% | 121.9 |
| 2021 | 3.4% | 141.6 | 0.5% | 122.6 |
| 2022 | 6.8% | 151.2 | 0.2% | 122.8 |
| 2023 | 3.9% | 157.1 | 1.0% | 124.0 |
| 2024 | 2.4% | 160.9 | 1.0% | 125.3 |
Notes
Note: To account for revised submissions from Rights Holders, price and quantity indices are recalculated for the five years preceding the current Annual Report year.
The base year for the PMPI and the CPI reported in the bottom half of this table is 2002 (Index = 100).
Data source: PMPRB; Statistics Canada
While Figure 1 compares the overall trends in the PMPI and CPI, Figure 2 provides additional detail by breaking down the distribution of annual list price changes by the percentage of medicines that experienced a price increase, a price decrease, or no change in price in the given year. While the PMPI increased by 1.0% overall in 2024, this growth was primarily driven by a minority of patented medicines. Approximately one fifth of medicines (157 out of 864) increased in price, while approximately three quarters had no year-over-year price change, a pattern that has remained consistent over the past two decades.
The PMPI only measures the sales growth that is directly tied to changes in the prices of patented medicines. It does not account for changes in the use of these medicines, shifts in prescribing patterns, or the introduction of new medicines, which are explored later in this section.
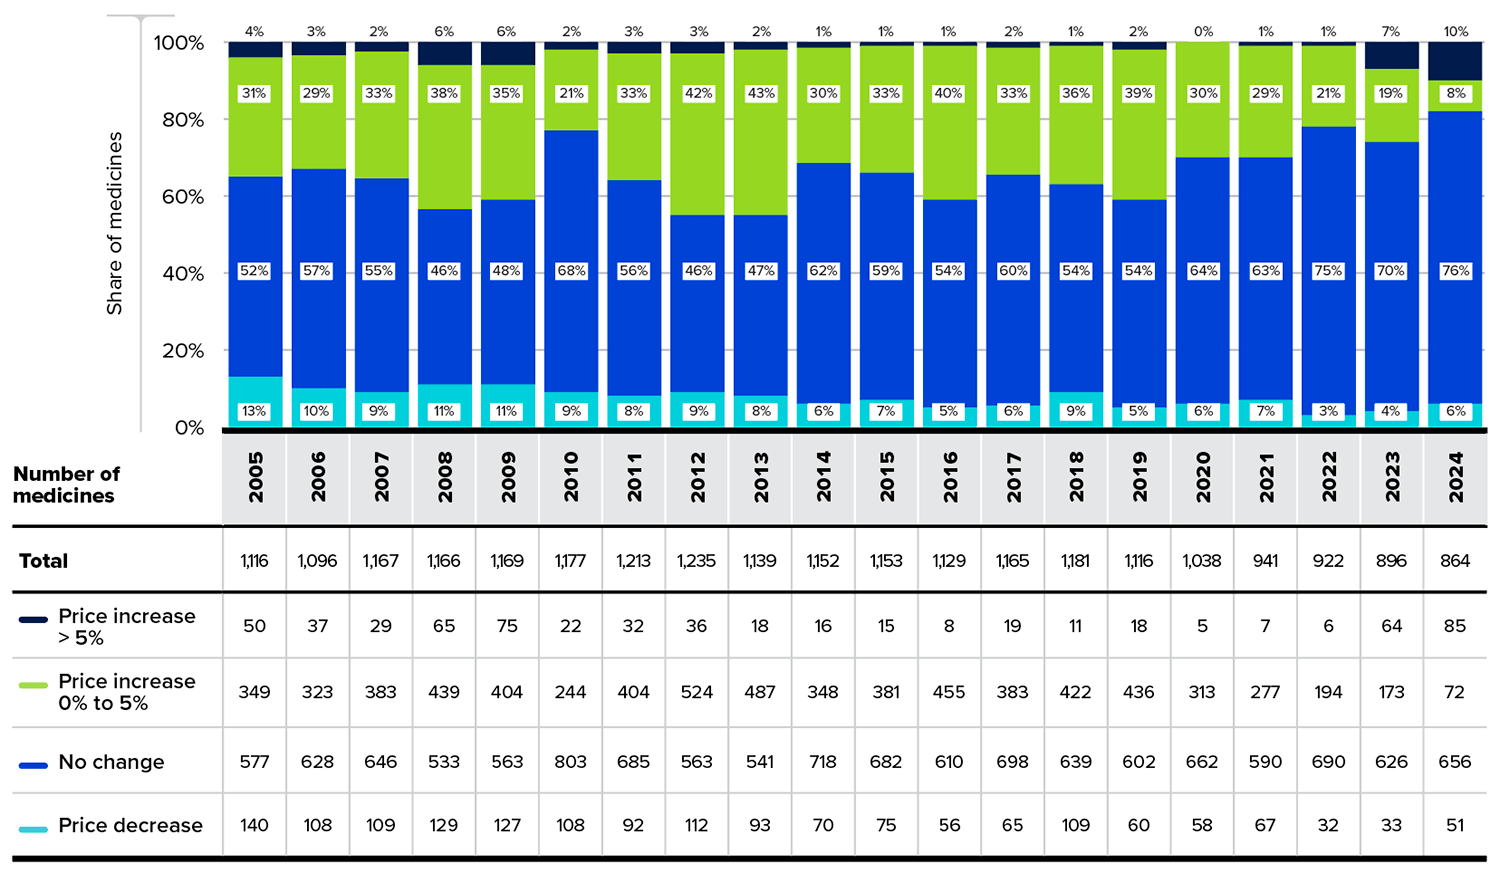
Figure description
This bar graph gives the distribution of the annual changes in the list prices of patented medicines in Canada. For each year, a bar set to 100% is broken into section by the degree of price increase, decrease, or no change. A table below the graph gives the number of medicines represented in each section.
Share of medicines
| Price decrease |
No change |
Price increase 0% to 5% |
Price increase > 5% |
Total | |
|---|---|---|---|---|---|
| 2005 | 13% | 52% | 31% | 4% | 100% |
| 2006 | 10% | 57% | 29% | 3% | 100% |
| 2007 | 9% | 55% | 33% | 2% | 100% |
| 2008 | 11% | 46% | 38% | 6% | 100% |
| 2009 | 11% | 48% | 35% | 6% | 100% |
| 2010 | 9% | 68% | 21% | 2% | 100% |
| 2011 | 8% | 56% | 33% | 3% | 100% |
| 2012 | 9% | 46% | 42% | 3% | 100% |
| 2013 | 8% | 47% | 43% | 2% | 100% |
| 2014 | 6% | 62% | 30% | 1% | 100% |
| 2015 | 7% | 59% | 33% | 1% | 100% |
| 2016 | 5% | 54% | 40% | 1% | 100% |
| 2017 | 6% | 60% | 33% | 2% | 100% |
| 2018 | 9% | 54% | 36% | 1% | 100% |
| 2019 | 5% | 54% | 39% | 2% | 100% |
| 2020 | 6% | 64% | 30% | 0% | 100% |
| 2021 | 7% | 63% | 29% | 1% | 100% |
| 2022 | 3% | 75% | 21% | 1% | 100% |
| 2023 | 4% | 70% | 19% | 7% | 100% |
| 2024 | 6% | 76% | 8% | 10% | 100% |
Number of medicines
| Price increase > 5% |
Price increase 0% to 5% |
No change |
Price decrease |
Total | |
|---|---|---|---|---|---|
| 2005 | 50 | 349 | 577 | 140 | 1,116 |
| 2006 | 37 | 323 | 628 | 108 | 1,096 |
| 2007 | 29 | 383 | 646 | 109 | 1,167 |
| 2008 | 65 | 439 | 533 | 129 | 1,166 |
| 2009 | 75 | 404 | 563 | 127 | 1,169 |
| 2010 | 22 | 244 | 803 | 108 | 1,177 |
| 2011 | 32 | 404 | 685 | 92 | 1,213 |
| 2012 | 36 | 524 | 563 | 112 | 1,235 |
| 2013 | 18 | 487 | 541 | 93 | 1,139 |
| 2014 | 16 | 348 | 718 | 70 | 1,152 |
| 2015 | 15 | 381 | 682 | 75 | 1,153 |
| 2016 | 8 | 455 | 610 | 56 | 1,129 |
| 2017 | 19 | 383 | 698 | 65 | 1,165 |
| 2018 | 11 | 422 | 639 | 109 | 1,181 |
| 2019 | 18 | 436 | 602 | 60 | 1,116 |
| 2020 | 5 | 313 | 662 | 58 | 1,038 |
| 2021 | 7 | 277 | 590 | 67 | 941 |
| 2022 | 6 | 194 | 690 | 32 | 922 |
| 2023 | 64 | 173 | 626 | 33 | 896 |
| 2024 | 85 | 72 | 656 | 51 | 864 |
Notes
Note: This analysis includes only medicines for which list prices were available in both the reported year and the prior year, allowing for the calculation of a year-over-year price change. As a result, this represents a subset of the total number of medicines reported to the PMPRB in any given year.
Data source: PMPRB
Comparison of Canadian Prices to Foreign Prices
In addition to reporting Canadian prices, Rights Holders are also required to report publicly available pricesFootnote 11 of patented medicines in 11 schedule countries: Australia, Belgium, France, Germany, Italy, Japan, Spain, Sweden, Norway, the Netherlands, and the United Kingdom (UK). This group of countries is referred to as the “PMPRB11”.
The PMPRB uses this information in its price reviews to conduct international price comparisons and in its reporting to measure Canadian prices of patented medicines relative to those in other countries.
Price Change by Country
Figure 3 presents the annual change in list prices for Canada and each of the PMPRB11 countries. This analysis applies the PMPI methodology, with weights based on Canadian sales, to the international price data that Rights Holders submitted to the PMPRB.
In 2024, Canadian list prices increased by 1.0%. Among PMPRB11 countries, Germany and Norway saw greater price increases than Canada, while prices remained relatively unchanged in Italy, Spain, and the UK. In contrast, list prices, on average, declined in several schedule countries, including Japan, Sweden, Australia, the Netherlands, France, and Belgium. These results are consistent with a long-term trend for patented medicine prices to rise in Canada while gradually declining over time in most schedule countries within the PMPRB11.
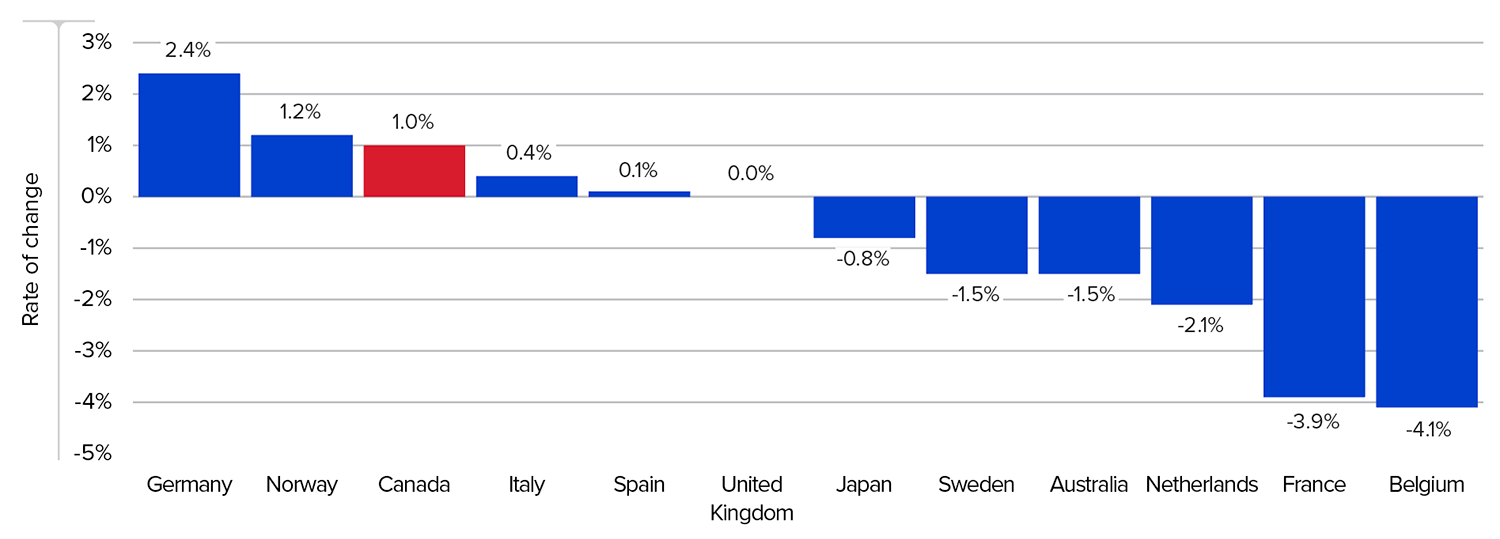
Figure description
This bar graph depicts the average annual rates of change in list prices of patented medicines for Canada and each of the PMPRB11 comparator countries.
| Country | Annual average rate of price change, 2024 |
|---|---|
| Germany | 2.4% |
| Norway | 1.2% |
| Canada | 1.0% |
| Italy | 0.4% |
| Spain | 0.1% |
| United Kingdom | 0.0% |
| Japan | -0.8% |
| Sweden | -1.5% |
| Australia | -1.5% |
| Netherlands | -2.1% |
| France | -3.9% |
| Belgium | -4.1% |
Notes
Data source: PMPRB
Bilateral Price Comparisons
Figures 4 and 5 provide bilateral comparisons of list prices in each of the PMPRB11 countries to list prices in Canada. The results are expressed as the percentage difference in foreign list prices relative to Canadian list prices.
A negative percentage indicates that list prices in the given country are, on average, lower than in Canada, while a positive percentage indicates higher prices.
Figure 4 shows that Canadian list prices in 2024 were, on average, higher than those in each of the PMPRB11 countries. List prices varied widely across the PMPRB11, ranging from 2% lower than Canadian prices in the UK to 33% lower in France, which had the lowest prices. It is important to note that it is not always possible to find a matching foreign price for every strength and dosage form of a patented medicine sold in Canada.
For example, of the 1,081 patented medicines that reported a patent to the PMPRB in 2024 and had Canadian sales available at the time of analysis, 40% had a publicly available ex-factory price for Japan, while 65% had a price for Germany.Footnote 12
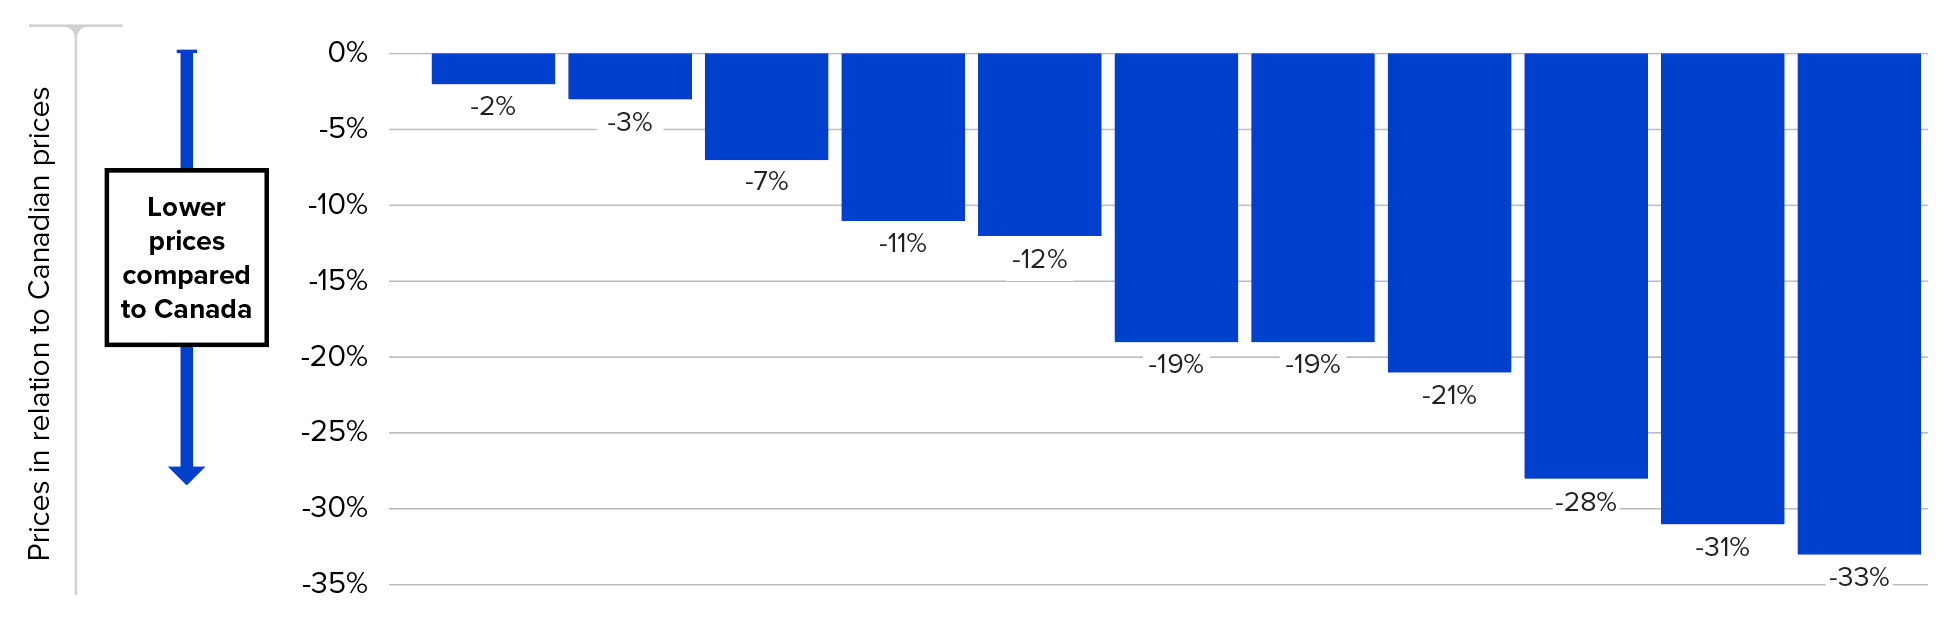
Figure description
This bar graph depicts the average foreign-to-Canadian price comparisons in 2024 for the PMPRB11 comparator countries, using list prices. Comparisons are shown as a percent difference relative to the Canadian price. A table below the graph shows the number of patented medicines compared for each country and the sales values that those medicines represented, in millions of dollars.
| Country | Average foreign list price in relation to Canadian list price, 2024 | Number of patented medicines compared, 2024 | Sales, in millions of dollars |
|---|---|---|---|
| Canada | 0% | 1,081 | 22,055 |
| United Kingdom | -2% | 684 | 17,649 |
| Spain | -3% | 643 | 16,377 |
| Italy | -7% | 605 | 16,868 |
| Germany | -11% | 699 | 17,775 |
| Netherlands | -12% | 650 | 17,768 |
| Japan | -19% | 434 | 13,614 |
| Norway | -19% | 668 | 17,630 |
| Belgium | -21% | 551 | 16,733 |
| Sweden | -28% | 497 | 11,515 |
| Australia | -31% | 470 | 16,440 |
| France | -33% | 478 | 13,005 |
Notes
Note: This analysis uses list prices in Canada and international markets. Results may not be directly comparable to Annual Reports prior to 2023, which used average transaction prices (net prices) for this figure. Previous versions of this figure also presented results as foreign-to-Canadian price indices, with the Canadian price set to 1.00, whereas this version shows the percentage difference in foreign prices relative to Canadian prices.
* Only medicines reported to the PMPRB in 2024 with available Canadian sales data at the time of the analysis are considered in this section. This is a subset of the total number of medicines reported to the PMPRB in 2024.
Data source: PMPRB
Figure 5 expands on the foreign-to-Canadian list price comparisons shown in Figure 4 by illustrating the distribution of prices in each PMPRB11 country relative to Canada. In 2024, some countries, like the United Kingdom, had a large share of medicines with prices above Canadian levels (45%), while others such as Australia, had fewer (7%).
The results also show the extent to which prices in each country align with Canadian prices. For example, over half of the patented medicines in Italy, the UK, and the Netherlands had list prices within 20% of Canadian prices, compared to one fifth of the medicines in France.
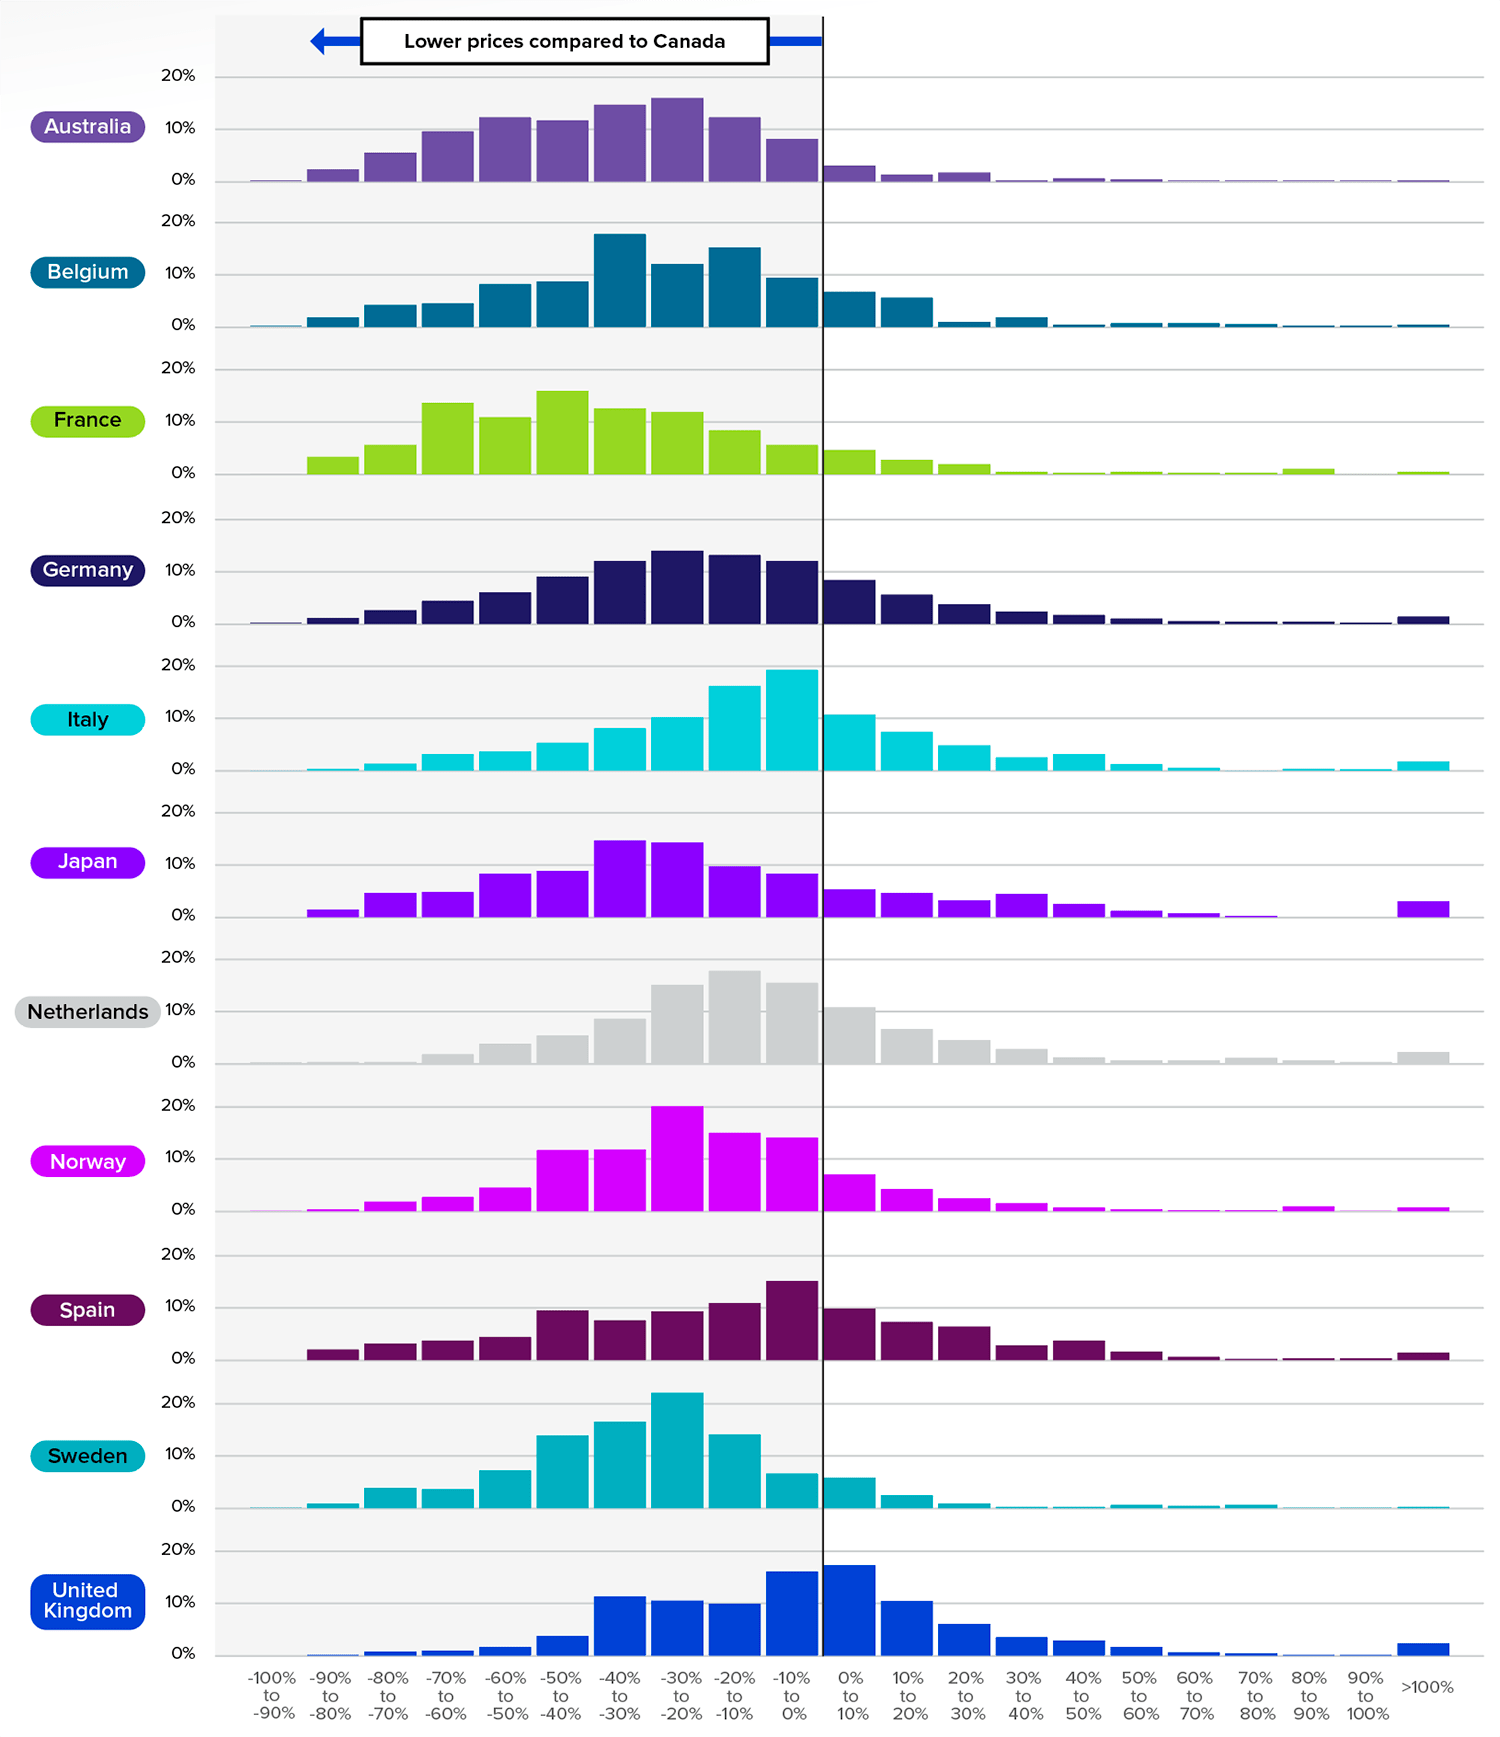
Figure description
A series of bar graphs shows the percentage distribution of patented medicines in each of the PMPRB11 countries by the difference in their prices and Canadian prices. A negative difference means the country has lower average list prices compared to those in Canada, whereas a positive difference means that their list prices are higher than those in Canada.
| Price difference relative to Canadian prices | Australia | Belgium | France | Germany | Italy | Japan | Netherlands | Norway | Spain | Sweden | United Kingdom |
|---|---|---|---|---|---|---|---|---|---|---|---|
| -100% to -90% | 0.0% | 0.0% | 0.0% | 0.0% | 0.0% | 0.0% | 0.0% | 0.0% | 0.0% | 0.0% | 0.0% |
| -90% to -80% | 2.3% | 1.8% | 3.3% | 0.3% | 0.3% | 1.4% | 0.3% | 0.3% | 2.0% | 0.8% | 0.1% |
| -80% to -70% | 5.5% | 4.2% | 5.6% | 0.7% | 1.3% | 4.6% | 0.3% | 1.8% | 3.1% | 3.8% | 0.7% |
| -70% to -60% | 9.6% | 4.5% | 13.6% | 4.1% | 3.1% | 4.8% | 1.8% | 2.7% | 3.7% | 3.6% | 0.9% |
| -60% to -50% | 12.3% | 8.2% | 10.9% | 5.3% | 3.6% | 8.3% | 3.8% | 4.5% | 4.4% | 7.2% | 1.6% |
| -50% to -40% | 11.7% | 8.7% | 15.9% | 8.6% | 5.3% | 8.8% | 5.4% | 11.7% | 9.5% | 13.9% | 3.7% |
| -40% to -30% | 14.7% | 17.8% | 12.6% | 12.0% | 8.1% | 14.7% | 8.6% | 11.8% | 7.6% | 16.5% | 11.3% |
| -30% to -20% | 16.0% | 12.0% | 11.9% | 14.3% | 10.2% | 14.3% | 15.1% | 20.1% | 9.3% | 22.1% | 10.5% |
| -20% to -10% | 12.3% | 15.2% | 8.4% | 14.2% | 16.2% | 9.7% | 17.8% | 15.0% | 10.9% | 14.1% | 9.9% |
| -10% to 0% | 8.1% | 9.4% | 5.6% | 8.7% | 19.3% | 8.3% | 15.5% | 14.1% | 15.1% | 6.6% | 16.1% |
| 0% to 10% | 3.0% | 6.7% | 4.6% | 7.2% | 10.7% | 5.3% | 10.8% | 7.0% | 9.8% | 5.8% | 17.3% |
| 10% to 20% | 1.3% | 5.6% | 2.7% | 5.6% | 7.4% | 4.6% | 6.6% | 4.2% | 7.3% | 2.4% | 10.4% |
| 20% to 30% | 1.7% | 0.9% | 1.9% | 5.6% | 4.8% | 3.2% | 4.5% | 2.4% | 6.4% | 0.8% | 6.0% |
| 30% to 40% | 0.2% | 1.8% | 0.4% | 4.4% | 2.5% | 4.4% | 2.8% | 1.5% | 2.8% | 0.2% | 3.5% |
| 40% to 50% | 0.6% | 0.4% | 0.2% | 2.3% | 3.1% | 2.5% | 1.2% | 0.7% | 3.7% | 0.2% | 2.8% |
| 50% to 60% | 0.4% | 0.7% | 0.4% | 1.6% | 1.2% | 1.2% | 0.6% | 0.3% | 1.6% | 0.6% | 1.6% |
| 60% to 70% | 0.0% | 0.7% | 0.2% | 1.0% | 0.5% | 0.7% | 0.6% | 0.1% | 0.6% | 0.4% | 0.6% |
| 70% to 80% | 0.0% | 0.5% | 0.2% | 0.7% | 0.0% | 0.2% | 1.1% | 0.1% | 0.2% | 0.6% | 0.4% |
| 80% to 90% | 0.0% | 0.2% | 1.0% | 0.4% | 0.3% | 0.0% | 0.6% | 0.9% | 0.3% | 0.0% | 0.1% |
| 90% to 100% | 0.0% | 0.2% | 0.0% | 0.7% | 0.2% | 0.0% | 0.3% | 0.0% | 0.3% | 0.0% | 0.1% |
| >100% | 0.2% | 0.4% | 0.4% | 2.3% | 1.7% | 3.0% | 2.2% | 0.7% | 1.4% | 0.2% | 2.3% |
| Total | 100.0% | 100.0% | 100.0% | 100.0% | 100.0% | 100.0% | 100.0% | 100.0% | 100.0% | 100.0% | 100.0% |
Notes
Note: This analysis uses list prices in Canada and international markets.
Data source: PMPRB
Methodology Note: Comparing Prices at Market Exchange Rates
Tables 3 and 4 compare the foreign prices of patented medicines to their Canadian prices at market exchange rates.
The price ratios are sales-weighted arithmetic means of price ratios for individual medicines, with weights based on Canadian sales patterns. They can help answer questions such as:
How much more/less would Canadians have paid for the patented medicines they purchased in 2024 had they paid Country X prices rather than Canadian prices?
For example, Table 3 states that the 2024 France-to-Canada price ratio for medicines available in both countries was 0.67. This means Canadians would have paid 33% less for the patented medicines they purchased in 2024 if they had paid French prices.
Foreign-to-Canadian price ratios are reported with foreign prices converted to their Canadian dollar equivalents by means of market exchange rates (more exactly, the 36-month moving averages of market rates the PMPRB normally uses in applying its Guidelines). Year-to-year changes in these ratios may be influenced by variations in international exchange rates.
Table 3 shows the foreign-to-Canadian price ratios over a two-year period. Foreign-to-Canadian price ratios are expressed as an index with the Canadian price set to a value of 1.00 and the international price reported relative to this value. For example, Figure 4 shows that prices in France were 33% lower than in Canada in 2024. This corresponds to a ratio of 0.67 in Table 3.
Table 3. Foreign-to-Canadian List Price Ratios, Bilateral Comparisons, Canada and the PMPRB11, 2023 and 2024
| Canada | Australia | Belgium | France | Germany | Italy | Japan | Netherlands | Norway | Spain | Sweden | United Kingdom | |
|---|---|---|---|---|---|---|---|---|---|---|---|---|
| Price ratio 2024 | 1.00 | 0.69 | 0.79 | 0.67 | 0.89 | 0.93 | 0.81 | 0.88 | 0.81 | 0.97 | 0.72 | 0.98 |
| Price ratio 2023 | 1.00 | 0.71 | 0.82 | 0.69 | 0.90 | 0.93 | 0.96 | 0.91 | 0.84 | 0.96 | 0.78 | 0.98 |
Notes
Note: This analysis uses list prices in Canada and international markets. Results may not be directly comparable to previous Annual Reports prior to 2023, which used average transaction prices (net prices) for this table. Year-to-year changes in these ratios may be influenced by variations in international exchange rates.
Data source: PMPRB
Multilateral Price Comparisons
Table 4 provides foreign-to-Canadian price ratios using several multilateral measures of foreign prices. The median international price (MIP) is the median of list prices observed in the PMPRB11, while the highest international price (HIP) is the highest of the list prices for the same group. Other multilateral price ratios compare the lowest and simple mean of PMPRB11 foreign list prices to the Canadian list price.
The HIP-Canadian price ratio in 2024 was 1.16, meaning that highest prices in the PMPRB11 were, on average, 16% higher than Canadian list prices. In other terms, Canadians would have paid 16% more for these patented medicines if they had paid the highest PMPRB11 price for each medicine instead of the Canadian price. Ratios below 1.00 indicate that Canadian prices are higher than the international benchmark; ratios above 1.00 indicate that they are lower.
Table 4. Foreign-to-Canadian List Price Ratios, Multilateral Comparisons, PMPRB11, 2024
| Multilateral measures | Number of patented medicines |
Sales ($millions) |
||||
|---|---|---|---|---|---|---|
| Median | Lowest | Highest | Mean | |||
| Price ratio 2024 | 0.84 | 0.59 | 1.16 | 0.85 | 815 | $19,935.38 |
Notes
Note: This analysis uses list prices in Canada and international markets. Results may not be directly comparable to Annual Reports prior to 2023, which used average transaction prices (net prices) for this table.
Data source: PMPRB
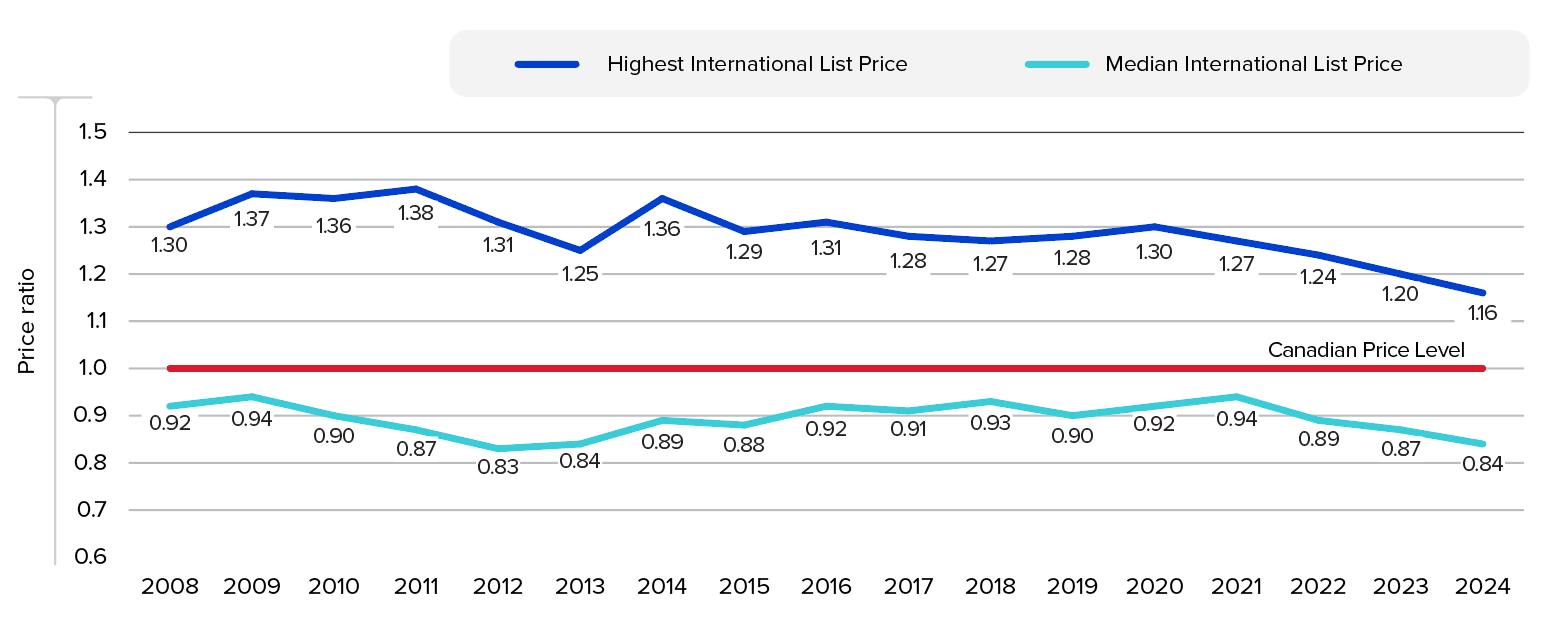
Figure description
This line graph depicts the trend in the average foreign-to-Canadian price ratios from 2008 to 2024 with the list price in Canada set to a value of 1.00. Two trend lines are given for the Highest International List Price (HIP) and the Median International List Price (MIP) in the PMPRB11.
| Year | Median International List Price |
Highest International List Price |
|---|---|---|
| 2008 | 0.92 | 1.30 |
| 2009 | 0.94 | 1.37 |
| 2010 | 0.90 | 1.36 |
| 2011 | 0.87 | 1.38 |
| 2012 | 0.83 | 1.31 |
| 2013 | 0.84 | 1.25 |
| 2014 | 0.89 | 1.36 |
| 2015 | 0.88 | 1.29 |
| 2016 | 0.92 | 1.31 |
| 2017 | 0.91 | 1.28 |
| 2018 | 0.93 | 1.27 |
| 2019 | 0.90 | 1.28 |
| 2020 | 0.92 | 1.30 |
| 2021 | 0.94 | 1.27 |
| 2022 | 0.89 | 1.24 |
| 2023 | 0.87 | 1.20 |
| 2024 | 0.84 | 1.16 |
Notes
Note: This analysis uses list prices in Canada and international markets. Results may not be directly comparable to Annual Reports prior to 2023, which used average transaction prices (net prices) for this figure.
PMPRB11 is Australia, Belgium, France, Germany, Italy, Japan, Netherlands, Norway, Spain, Sweden, and the UK.
Data source: PMPRB; MIDAS® database, 2008–2024, IQVIA (all rights reserved)
Figure 7 presents the number and percentage of patented medicine prices that were below the MIP, between the MIP and HIP, and greater than the HIP in each of the last three years. In 2024, there were 258 patented medicines with list prices that exceeded the HIP, accounting for close to one third (31.7%) of all patented medicines for which an international price comparison could be conducted. This percentage has remained relatively consistent since 2022. However, the proportion of patented medicines with prices below the MIP has steadily declined, from 27.6% in 2022 to 21.8% in 2024.
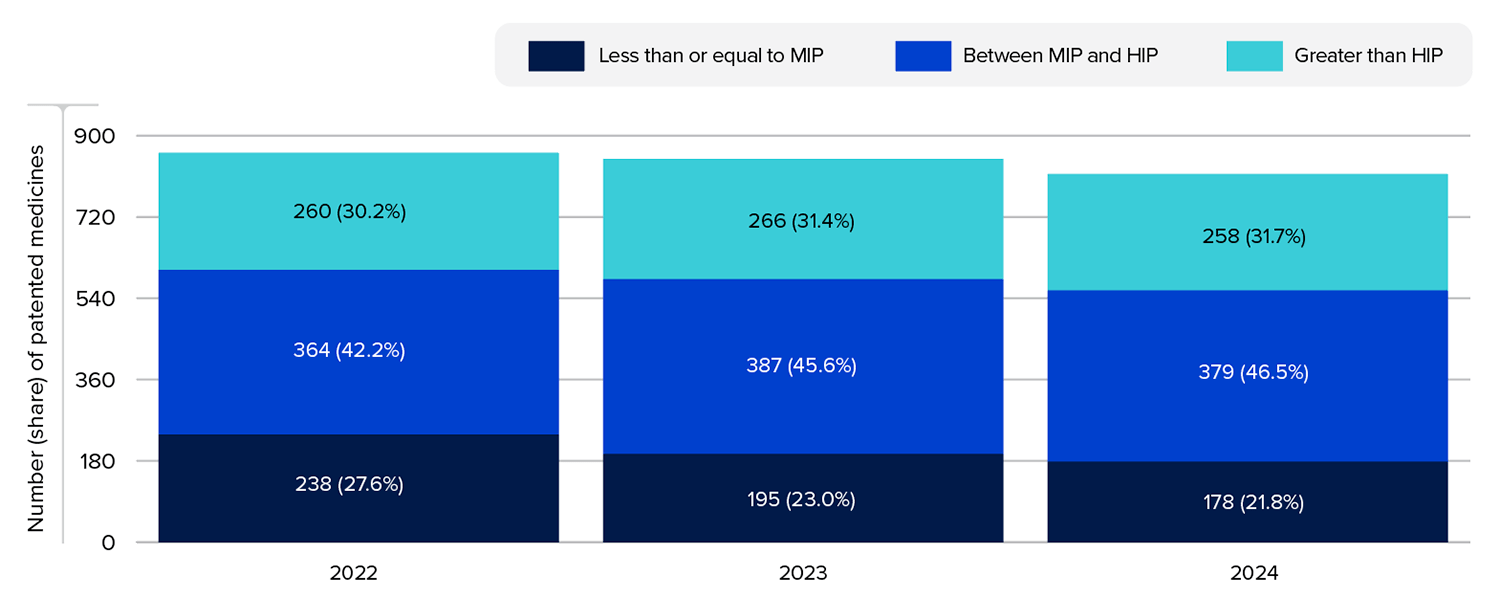
Figure description
This bar graph gives the distribution of patented medicines by their price relative to the median (MIP) and highest (HIP) international prices in 2022, 2023, and 2024. Results are given as a number of medicines and as a percentage share of total medicines for that year.
Number of medicines
| Less than or equal to MIP | Between MIP and HIP | Greater than HIP | |
|---|---|---|---|
| 2022 | 238 | 364 | 260 |
| 2023 | 195 | 387 | 266 |
| 2024 | 178 | 379 | 258 |
Share of total medicines
| Less than or equal to MIP | Between MIP and HIP | Greater than HIP | |
|---|---|---|---|
| 2022 | 27.6% | 42.2% | 30.2% |
| 2023 | 23.0% | 45.6% | 31.4% |
| 2024 | 21.8% | 46.5% | 31.7% |
Notes
Note: This analysis reflects only medicines for which an international price comparison (IPC) can be conducted. Specifically, it reflects only medicines with a Canadian list price reported to the PMPRB and for which a price is also reported in at least one PMPRB11 country. This subset reflects medicines with sufficient pricing data reported to the PMPRB to enable an IPC and does not represent the total number of medicines reported to the PMPRB during the given period.
Data source: PMPRB
Figure 8 provides a further breakdown of the 258 patented medicines with prices above the HIP. About half (52%) of these patented medicines have list prices less than 20% above the HIP, while the remainder exceed it by a wider margin.
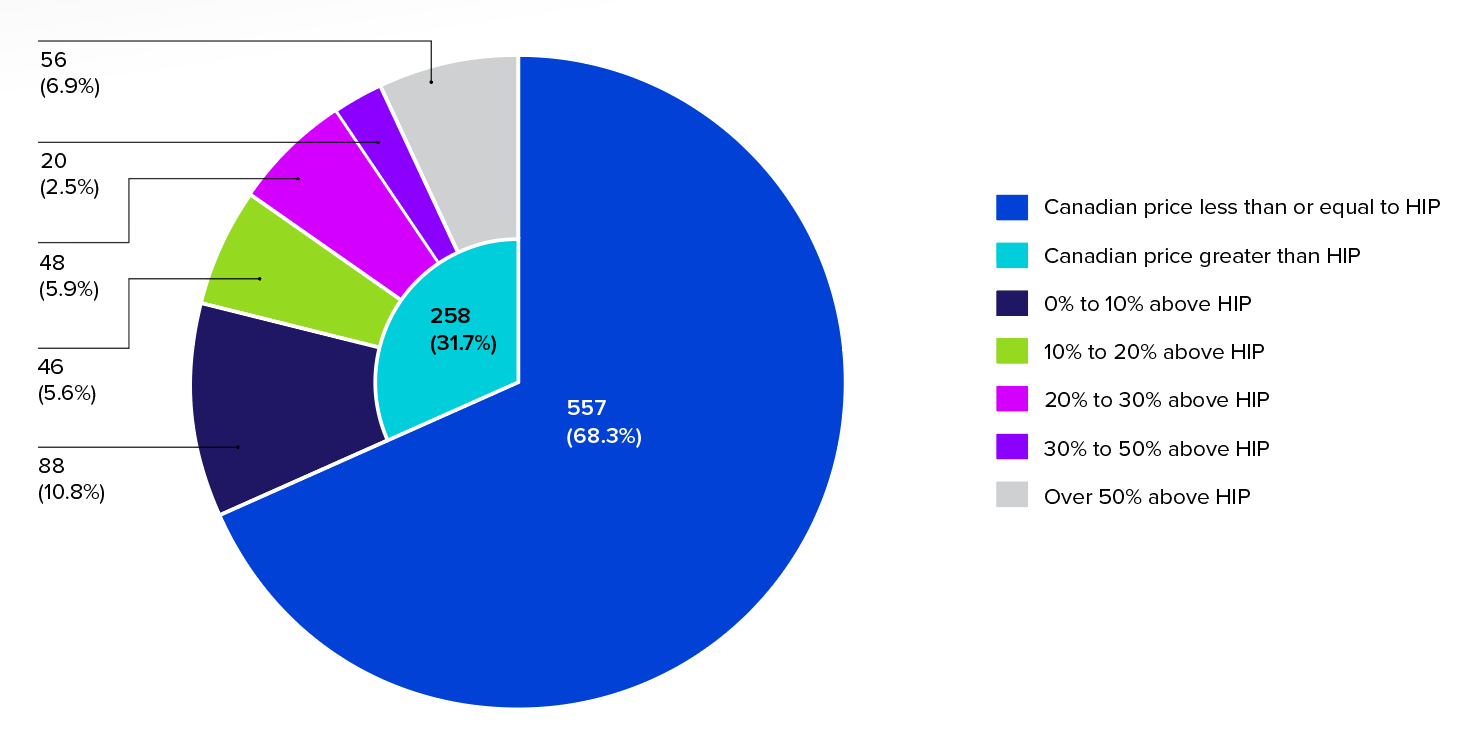
Figure description
A pie chart shows the distribution of patented medicines in Canada by the difference between their list price in Canada and the highest international price (HIP). Results are given as a number of medicines and a percentage share of the total medicines in Canada.
| Canadian price relative to the HIP | Number of medicines | Share of medicines |
|---|---|---|
| Total less than or equal to the HIP | 557 | 68.3% |
| Total greater than HIP | 258 | 31.7% |
| 0% to 10% above the HIP | 88 | 10.8% |
| 10% to 20% above the HIP | 46 | 5.6% |
| 20% to 30% above the HIP | 48 | 5.9% |
| 30% to 50% above the HIP | 20 | 2.5% |
| Over 50% above the HIP | 56 | 6.9% |
Notes
Data source: PMPRB
In Figure 9a, the 2024 sales of patented medicines are broken out by the difference between the MIP and Canadian prices for the medicines sold. Patented medicines with international prices similar to those in Canada (MIP within 10% of Canadian prices) accounted for 23.3% of sales. Those with international prices at least 10% lower than the Canadian price accounted for 70.1% of sales.
Figure 9b conducts the same analysis using the HIP. In this case, 52.5% of sales were for medicines with an HIP more than 10% above Canadian prices.
Figure 9. Range Distribution, Share of Sales by Difference in Foreign and Canadian Prices, 2024
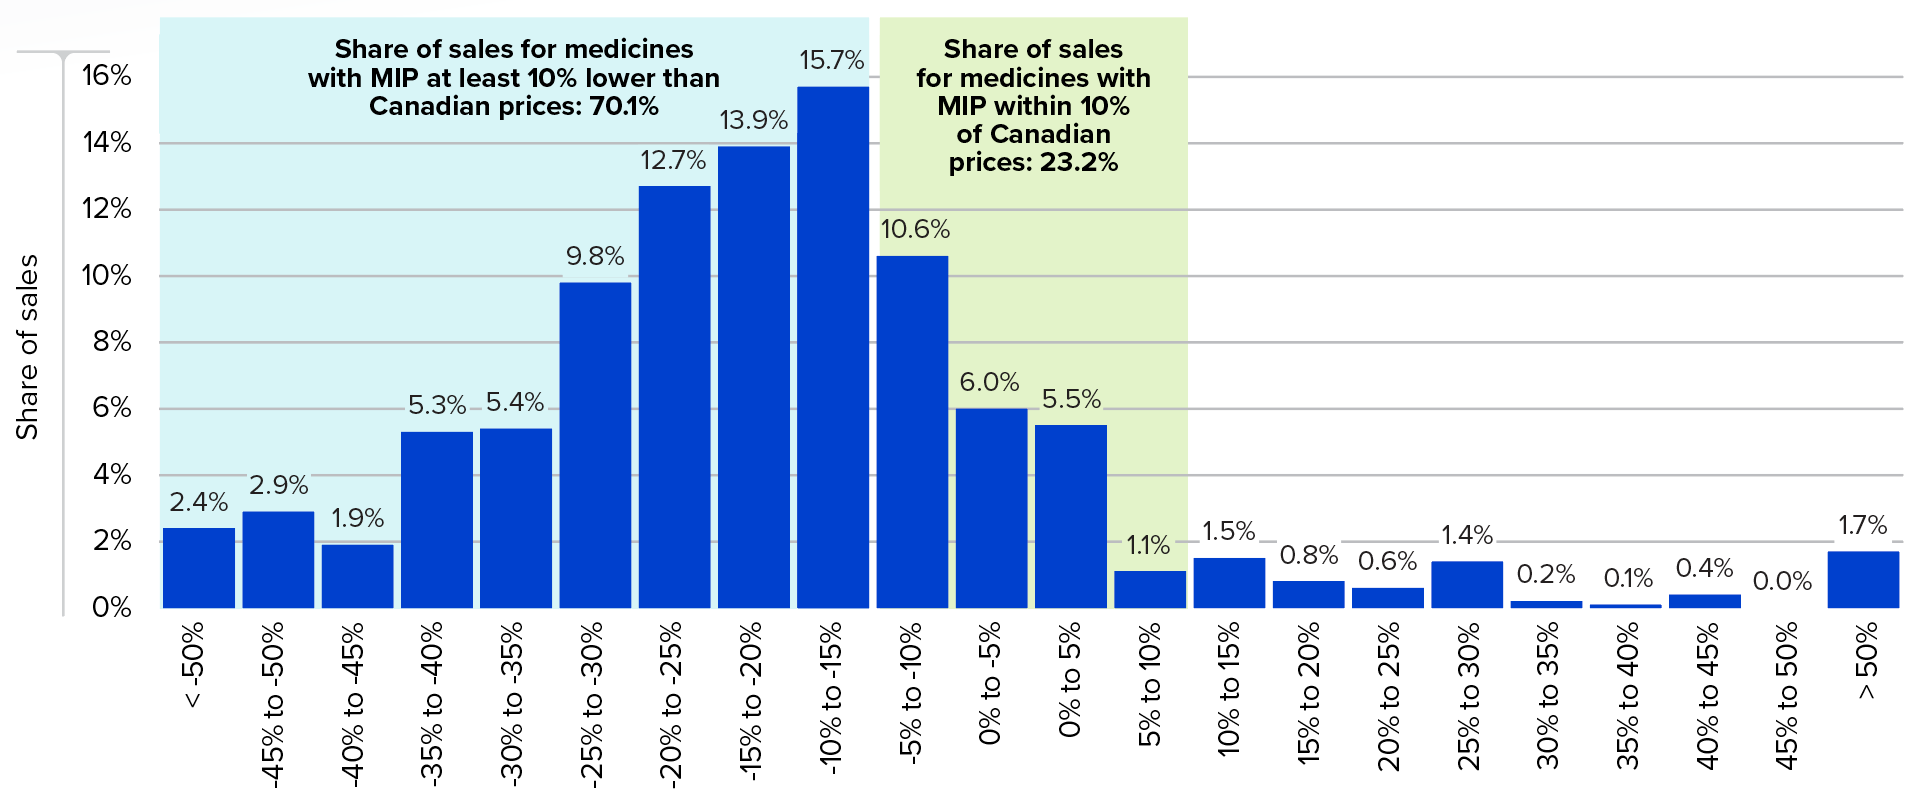
Figure description
This bar graph depicts the distribution of 2024 sales for patented medicines by the difference between the median international list price (MIP) and the Canadian prices for those medicines. The share of sales for medicines with an MIP at least 10% lower than Canadian prices was 70.1%. The share of sales for medicines with an MIP within 10% of Canadian prices was 23.2%.
| MIP-to-Canadian price ratio | Share of sales |
|---|---|
| < -50% | 2.4% |
| ‑45% to ‑50% | 2.9% |
| ‑40% to ‑45% | 1.9% |
| ‑35% to ‑40% | 5.3% |
| ‑30% to ‑35% | 5.4% |
| ‑25% to ‑30% | 9.8% |
| ‑20% to ‑25% | 12.7% |
| ‑15% to ‑20% | 13.9% |
| ‑10% to ‑15% | 15.7% |
| ‑5% to ‑10% | 10.6% |
| 0% to ‑5% | 6.0% |
| 0% to 5% | 5.5% |
| 5% to 10% | 1.1% |
| 10% to 15% | 1.5% |
| 15% to 20% | 0.8% |
| 20% to 25% | 0.6% |
| 25% to 30% | 1.4% |
| 30% to 35% | 0.2% |
| 35% to 40% | 0.1% |
| 40% to 45% | 0.4% |
| 45% to 50% | 0.0% |
| > 50% | 1.7% |
Notes
Note: This analysis uses list prices in Canada and international markets. Results may not be directly comparable to Annual Reports prior to 2023, which used average transaction prices (net prices) for this figure.
Data source: PMPRB
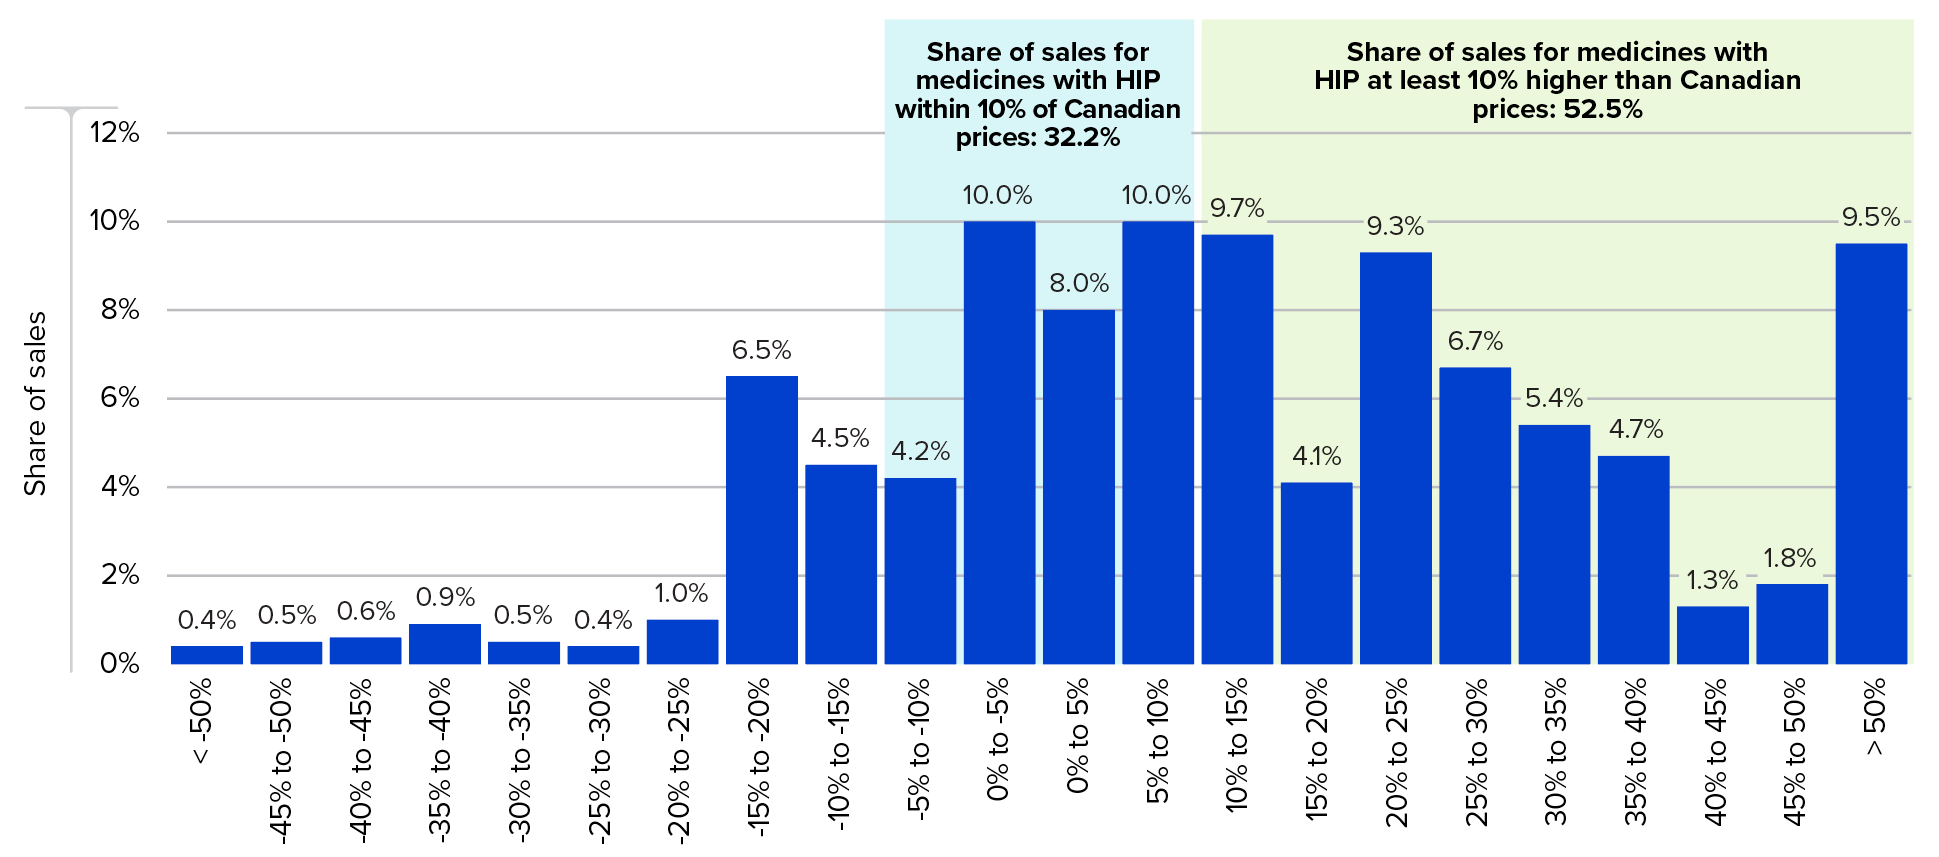
Figure description
This bar graph depicts the distribution of 2024 sales for patented medicines by the difference between the highest international list price (HIP) and the Canadian prices for those medicines. The share of sales for medicines with HIP at least 10% higher than Canadian prices was 52.5%. The share of sales for medicines with HIP within 10% of Canadian prices was 32.2%.
| HIP-to-Canadian price ratio | Share of sales |
|---|---|
| < -50% | 0.4% |
| -45% to -50% | 0.5% |
| -40% to -45% | 0.6% |
| -35% to -40% | 0.9% |
| -30% to -35% | 0.5% |
| -25% to -30% | 0.4% |
| -20% to -25% | 1.0% |
| -15% to -20% | 6.5% |
| -10% to -15% | 4.5% |
| -5% to -10% | 4.2% |
| 0% to -5% | 10.0% |
| 0% to 5% | 8.0% |
| 5% to 10% | 10.0% |
| 10% to 15% | 9.7% |
| 15% to 20% | 4.1% |
| 20% to 25% | 9.3% |
| 25% to 30% | 6.7% |
| 30% to 35% | 5.4% |
| 35% to 40% | 4.7% |
| 40% to 45% | 1.3% |
| 45% to 50% | 1.8% |
| > 50% | 9.5% |
Notes
Data source: PMPRB
Price comparisons beyond the PMPRB11
Rights Holders only report international sales data for PMPRB11 countries in which the patented medicine is sold. To assess how Canada compares to a basket of countries beyond the PMPRB11, Figure 10 uses Canadian and international prices reported in the IQVIA MIDAS® database for all countries in the Organisation for Economic Co-operation and Development (OECD) with available data. MIDAS data reflects ex-factory manufacturer prices and includes all sales in the pharmacy and hospital sectors.Footnote 13
Figure 10 presents a comparison of Canadian list prices relative to international prices across OECD countries, showing the average price difference for each country relative to Canadian levels. As shown in the bilateral comparison (Figure 10a), Canadian list prices were, on average, among the highest in the OECD in 2024, ranking fifth highest among 31 countries. However, many of the highest-priced countries had list prices closely clustered around Canadian levels, with differences generally within 5%.
Figure 10b presents a complimentary multilateral comparison. For each medicine, the highest and median foreign list prices across the OECD and PMPRB11 countries are identified and compared to the corresponding Canadian price. On average, OECD prices were approximately 17% lower than price levels in Canada (Figure 10b).
It is important to note that bilateral comparisons (Figure 10a) reflect how Canada compares to each country individually, while multilateral comparisons (Figure 10b) show how Canadian prices compare to the range of international prices for each medicine, where the highest- or median-priced country may differ from one medicine to another.
The foreign-to-Canadian price comparisons presented in this section are calculated using the same sales-weighted methodology used to produce the ratios given in Figure 4, but results will differ somewhat due to the use of different data sources.
Figure 10. Foreign-to-Canadian List Price Comparisons, Patented Medicines, OECD, 2024
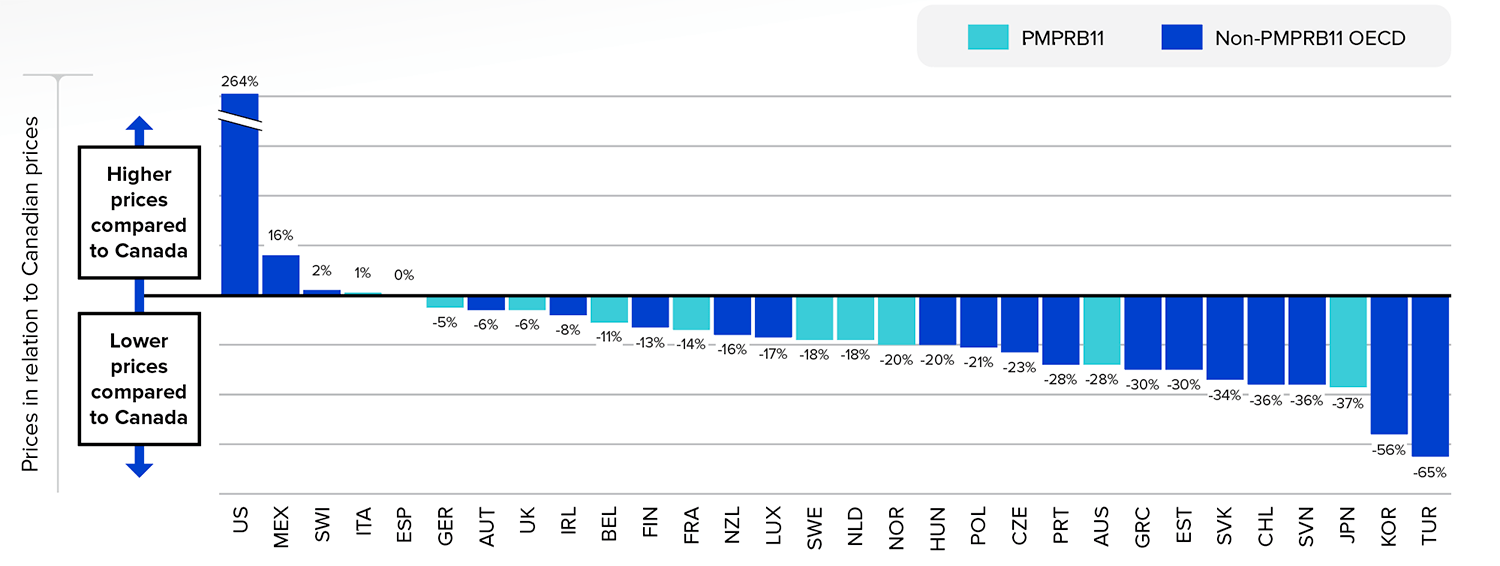
Figure description
This bar graph depicts the difference in the average list prices for patented medicines in Canada and each of the Organisation for Economic Co-operation and Development (OECD) countries in 2024. A positive percentage difference means the country had higher average list prices than Canada, whereas a negative percentage difference means their list prices were lower than those in Canada. This analysis uses bilateral price comparison based on Canadian and international prices reported in the IQVIA MIDAS® database.
| Country | Percent difference between foreign and Canadian list price |
|---|---|
| United States | 264% |
| Mexico | 16% |
| Switzerland | 2% |
| Italy | 1% |
| Spain | 0% |
| Germany | -5% |
| Austria | -6% |
| United Kingdom | -6% |
| Ireland | -8% |
| Belgium | -11% |
| Finland | -13% |
| France | -14% |
| New Zealand | -16% |
| Luxembourg | -17% |
| Sweden | -18% |
| Netherlands | -18% |
| Norway | -20% |
| Hungary | -20% |
| Poland | -21% |
| Czechia | -23% |
| Portugal | -28% |
| Australia | -28% |
| Greece | -30% |
| Estonia | -30% |
| Slovakia | -34% |
| Chile | -36% |
| Slovenia | -36% |
| Japan | -37% |
| South Korea | -56% |
| Turkey | -65% |
Notes
Data source: PMPRB; MIDAS® database, 2024, IQVIA (all rights reserved)
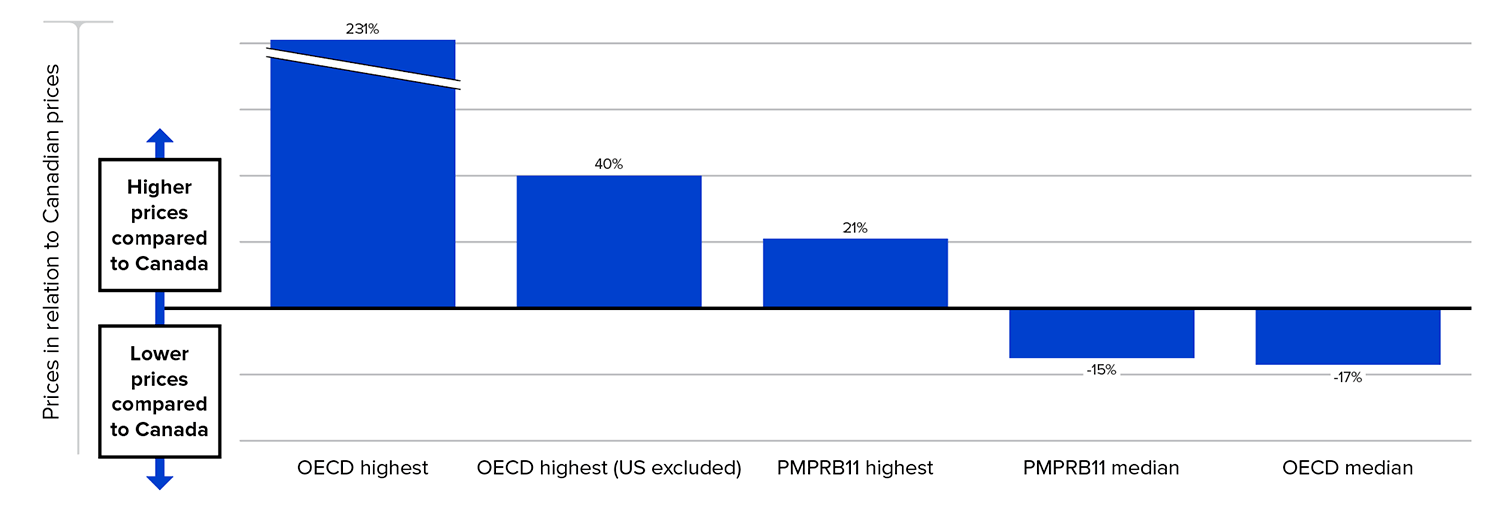
Figure description
This bar graph depicts multilateral measures of the difference in the average list prices for patented medicines in Canada and the highest or median of the Organisation for Economic Co-operation and Development (OECD) and PMPRB11 countries in 2024. For each medicine, the highest and median foreign list prices across the OECD and PMPRB11 countries are identified and compared to the corresponding Canadian price. A positive percentage difference means higher prices than those in Canada, whereas a negative percentage difference means lower list prices than those in Canada. This analysis uses multilateral price comparisons based on Canadian and international prices reported in the IQVIA MIDAS® database.
| Multilateral measure | Percent difference between foreign and Canadian list price |
|---|---|
| OECD highest | 231% |
| OECD highest, excluding the United States | 40% |
| PMPRB11 highest | 21% |
| PMPRB11 median | -15% |
| OECD median | -17% |
Notes
Data source: PMPRB; MIDAS® database, 2024, IQVIA (all rights reserved)
Methodology Note: Comparing Prices with the OECD
The PMPRB’s methodology focuses on the Canadian market, assessing how patented medicine prices in Canada compare to those in OECD countries. This approach addresses the question: How much more or less would Canadians have paid for the patented medicines they purchased if they had paid foreign prices rather than Canadian prices?
Studies with a different approach to medicine selection and weighting may result in variations in both the price comparisons shown and the international ranking. It is important to understand the methodology behind this analysis when comparing to other studies.
Medicine selection: For consistency, this analysis starts with the list of patented medicines in Canada, defined as those that reported sales to the PMPRB in the given year. From this list, only prescription medicines for human use available in both Canada and the comparison country are selected, with Canada as the base.
Multilateral price measures: A minimum of two foreign countries were required to determine the highest international comparison, while at least three foreign countries were needed to calculate the median price comparison. The median price comparison represents the median of list prices observed in the OECD and PMPRB11, while the highest price comparison reflects the highest of the list prices for the same group. To account for the large impact of US prices in determining the highest international price, a comparison excluding the US is also provided as additional context in Figure 10b.
Price index weight: Price comparisons are calculated bilaterally and weighted based on Canadian sales patterns for individual medicines.
While Figure 10 provides a snapshot of Canadian prices relative to the OECD in 2024, Figure 11 explores longer-term trends in these price comparison since 2019. Over the past five years, median prices of patented medicines in the OECD have been consistently about 20% lower than Canadian prices, while prices in Canada have held their position among the highest in the PMPRB11.
Figure 11. Foreign-to-Canadian List Price Comparisons, Patented Medicines, Canada, the PMPRB11, and the OECD Median, 2019 to 2024
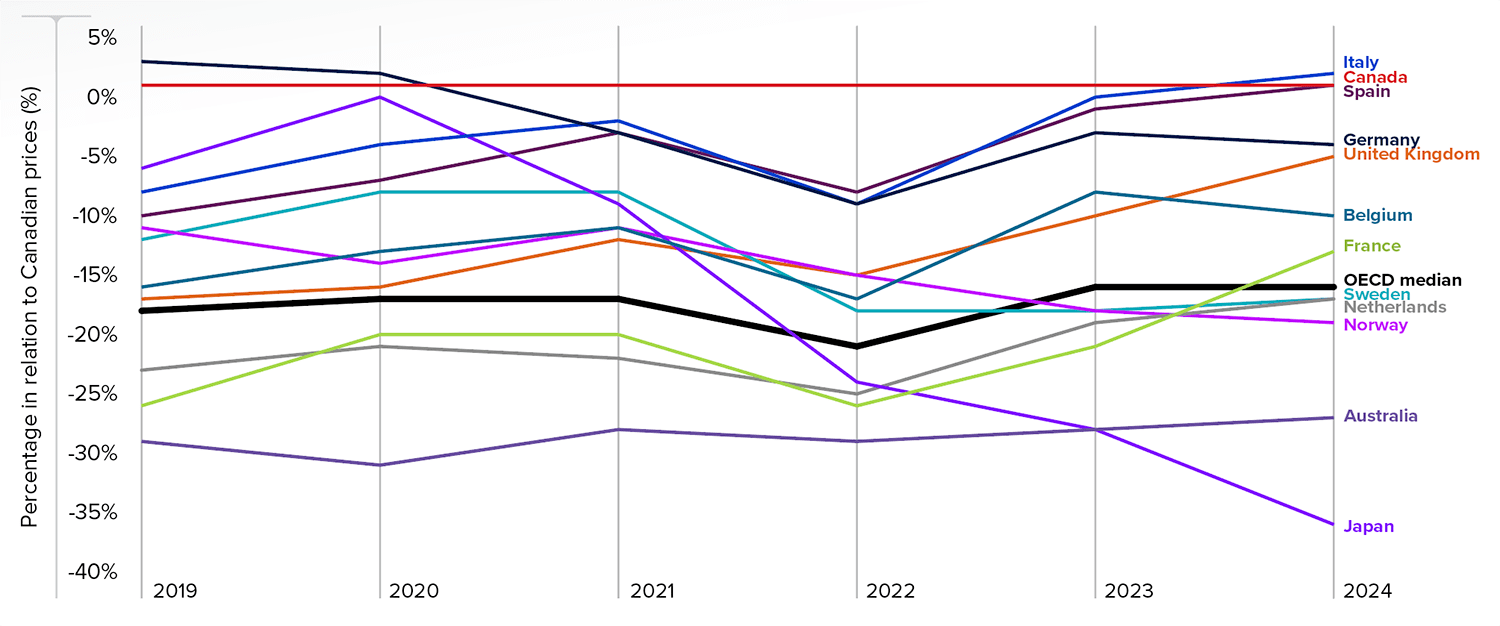
Figure description
This line graph shows the trend in foreign-to-Canadian price differences over time, from 2019 to 2024, for Canada, each of the PMPRB11 countries, and the median of the Organisation for Economic Co-operation and Development (OECD) countries. A positive percentage difference means the country had higher average list prices than Canada, whereas a negative percentage difference means their list prices were lower than those in Canada.
| 2019 | 2020 | 2021 | 2022 | 2023 | 2024 | |
|---|---|---|---|---|---|---|
| Australia | -30% | -32% | -29% | -30% | -29% | -28% |
| Belgium | -17% | -14% | -12% | -18% | -9% | -11% |
| Canada | 0% | 0% | 0% | 0% | 0% | 0% |
| France | -27% | -21% | -21% | -27% | -22% | -14% |
| Germany | 2% | 1% | -4% | -10% | -4% | -5% |
| Italy | -9% | -5% | -3% | -10% | -1% | 1% |
| Japan | -7% | -1% | -10% | -25% | -29% | -37% |
| Netherlands | -24% | -22% | -23% | -26% | -20% | -18% |
| Norway | -12% | -15% | -12% | -16% | -19% | -20% |
| Spain | -11% | -8% | -4% | -9% | -2% | 0% |
| Sweden | -13% | -9% | -9% | -19% | -19% | -18% |
| United Kingdom | -18% | -17% | -13% | -16% | -11% | -6% |
| OECD median | -19% | -18% | -18% | -22% | -17% | -17% |
Notes
Note: Year-to-year changes in these ratios may be influenced by variations in international exchange rates.
Data source: PMPRB; MIDAS® database, 2024, IQVIA (all rights reserved)
Economic context is important in understanding international price differences for patented medicines. Figure 12 presents a contextual analysis of foreign-to-Canadian price comparisons by plotting them against each country’s GDP per capita relative to Canada. The analysis is based on information from 2023, the most recent year for which consistent economic data was available.
The results show that countries with a GDP per capita similar to Canada tend to have lower patented medicine prices. Notably, the only countries with patented medicine prices higher than Canada in 2023 were economic outliers. The United States and Switzerland, which have GDP per capita more than 50% higher than Canada, had significantly higher patented medicine prices. Conversely, Mexico, which also had higher patented medicine prices, had a GDP per capita more than 50% lower than Canada.
It is also notable that some countries with much higher GDP per capita than Canada had lower patented medicine prices. For example, Luxembourg, despite having the highest GDP per capita among OECD countries (approximately 140% higher than Canada), had prices about 17% lower.
Figure 12. Foreign-to-Canadian List Prices in Relation to GDP Per Capita, Patented Medicines, OECD, 2023
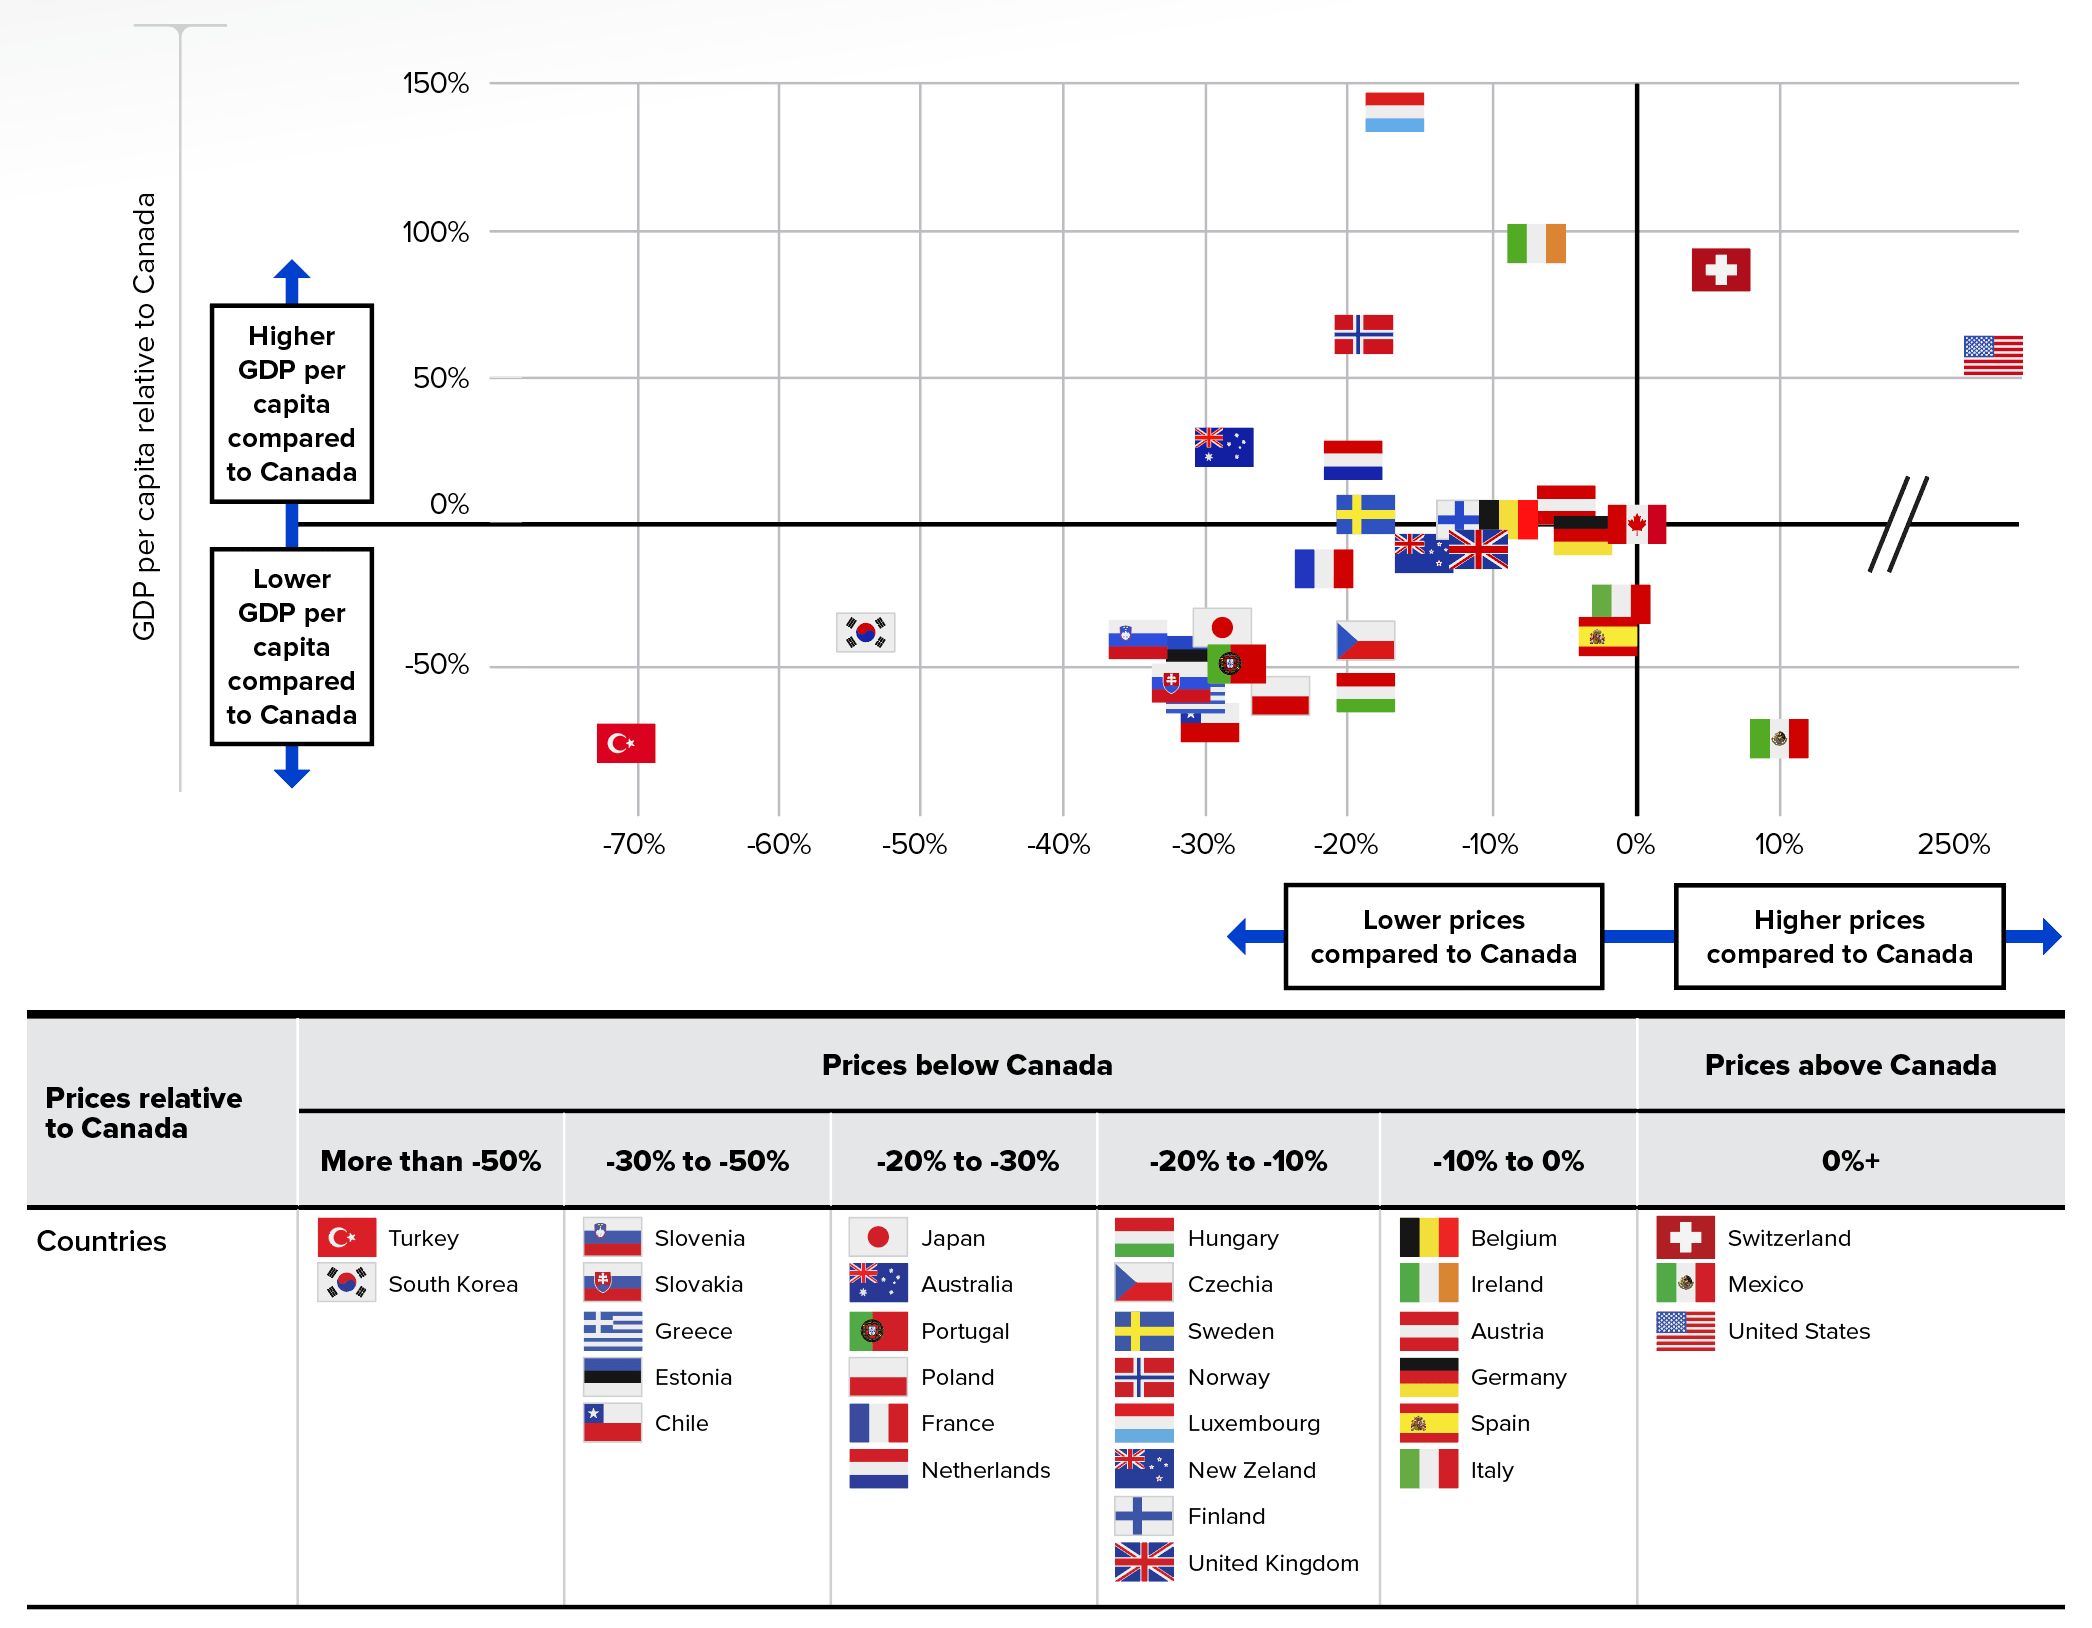
Figure description
This scatter plot locates each country in the Organisation for Economic Co-operation and Development (OECD) by its gross domestic product (GDP) per capita relative to that in Canada and by its average list prices for patented medicines relatives to those in Canada.
| Country | Difference between foreign and Canadian price | Difference between foreign and Canadian GDP per capita |
|---|---|---|
| Australia | -29% | 26% |
| Austria | -5% | 6% |
| Belgium | -9% | 1% |
| Canada | 0% | 0% |
| Chile | -30% | -68% |
| Czechia | -19% | -41% |
| Estonia | -31% | -44% |
| Finland | -12% | 0% |
| France | -22% | -16% |
| Germany | -4% | -1% |
| Greece | -31% | -58% |
| Hungary | -19% | -59% |
| Ireland | -7% | 95% |
| Italy | -1% | -28% |
| Japan | -29% | -36% |
| South Korea | -54% | -38% |
| Luxembourg | -17% | 140% |
| Mexico | 10% | -74% |
| Netherlands | -20% | 21% |
| New Zealand | -15% | -10% |
| Norway | -19% | 64% |
| Poland | -25% | -60% |
| Portugal | -28% | -48% |
| Slovakia | -32% | -55% |
| Slovenia | -35% | -40% |
| Spain | -2% | -39% |
| Sweden | -19% | 3% |
| Switzerland | 6% | 86% |
| Turkey | -71% | -75% |
| United Kingdom | -11% | -9% |
| United States | 264% | 53% |
Notes
Data source: MIDAS® database, 2023, IQVIA (all rights reserved); OECD Productivity Database
Utilization of Patented Medicines
The price and sales data used to calculate the PMPI also allow the PMPRB to examine trends in the quantities of patented medicines sold in Canada. The PMPRB maintains the Patented Medicines Quantity Index (PMQI) for this purpose.
Figure 13 provides rates of utilization growth, as measured by the PMQI, from 2005 through 2024. The results show that the quantity of patented medicines sold increased by 11.8% in 2024, a higher rate than the year before. The PMQI is reported only for Canada, as international data on utilization is not available.
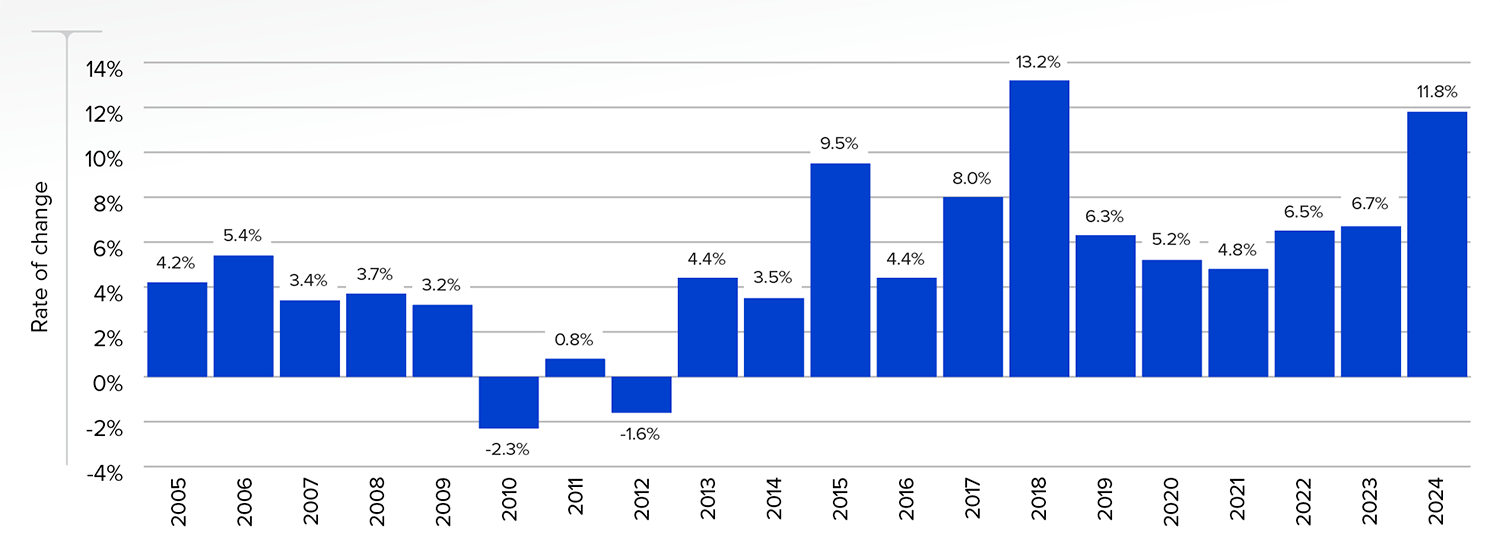
Figure description
This bar graph depicts the average annual rates of growth in utilization, as measured by the Patented Medicines Quantity Index (PMQI), from 2005 to 2024.
| Year | Rate of change |
|---|---|
| 2005 | 4.2% |
| 2006 | 5.4% |
| 2007 | 3.4% |
| 2008 | 3.7% |
| 2009 | 3.2% |
| 2010 | -2.3% |
| 2011 | 0.8% |
| 2012 | -1.6% |
| 2013 | 4.4% |
| 2014 | 3.5% |
| 2015 | 9.5% |
| 2016 | 4.4% |
| 2017 | 8.0% |
| 2018 | 13.2% |
| 2019 | 6.3% |
| 2020 | 5.2% |
| 2021 | 4.8% |
| 2022 | 6.5% |
| 2023 | 6.7% |
| 2024 | 11.8% |
Notes
Data source: PMPRB
Trends in Sales of Patented Medicines
Price and utilization are just two of the many factors that shape spending on patented medicines in Canada. A broader look at sales trends can provide context on which factors drove the change in sales revenues over the past year, how they compare to trends in previous years and where Canada stands relative to international markets.
Trends in Sales
Canadians spent an additional $2.17 billion on patented medicines in 2024 compared to the year before, bringing total annual spending to $22.1 billion. This represented an annual increase of 10.9%, compared to a five-year growth rate of 5.1% (Table 5).
Table 5. Sales of Patented Medicines, 2020 to 2024
| Year | Patented medicine | 5-year compound annual growth rate | Sales of patented medicines as a share of all medicine sales* | Patented medicine sales per capita | Change in patented medicine sales per capita | Patented medicine sales as a share of GDP | |
|---|---|---|---|---|---|---|---|
| Sales ($billions) | Change in sales | ||||||
| 2024 | $22.1 | 10.9% | 5.1% | 47.2% | $531.08 | 3.4% | 0.704% |
| 2023 | $19.9 | 7.9% | 3.7% | 47.3% | $513.60 | 10.4% | 0.670% |
| 2022 | $18.4 | 5.5% | 1.8% | 49.0% | $465.12 | 2.0% | 0.666% |
| 2021 | $17.4 | -1.9% | 2.2% | 51.0% | $456.14 | -3.3% | 0.758% |
| 2020 | $17.7 | 3.3% | 3.2% | 55.4% | $472.00 | 2.9% | 0.801% |
Notes
Values may not add due to rounding
* The denominator in this ratio comprises sales of patented and non-patented brand medicines and patented and non-patented generic medicines. This value is derived from data contained in IQVIA’s MIDAS® database.
Data source: PMPRB; MIDAS® database, 2020−2024, IQVIA (all rights reserved)
Figure 14 reports on trends in the sales of patented medicines from 1990 to 2024. Patented medicines accounted for 47.2% of the sales of all medicines in Canada in 2024, down from a peak of 72.7% in 2003 and relatively unchanged from 47.3% in 2023. As shown in Figure 14a, this percentage has generally declined since 2017, even as overall spending on patented medicines continues to trend upwards. This indicates that sales of non-patented brand and generic medicines have grown at a faster rate than sales of patented medicines in recent years.
The trends in sales per capita and sales as a percentage of the gross domestic product (GDP) displayed in Figure 14b show the ongoing importance of patented medicines in the Canadian economy. Since 1990, per capita sales of patented medicines have risen from $61.60 to $531.08, while sales as a percentage of GDP have risen from 0.25% to 0.70%.
Figure 14. Trends in Patented Medicine Sales, 1990 to 2024
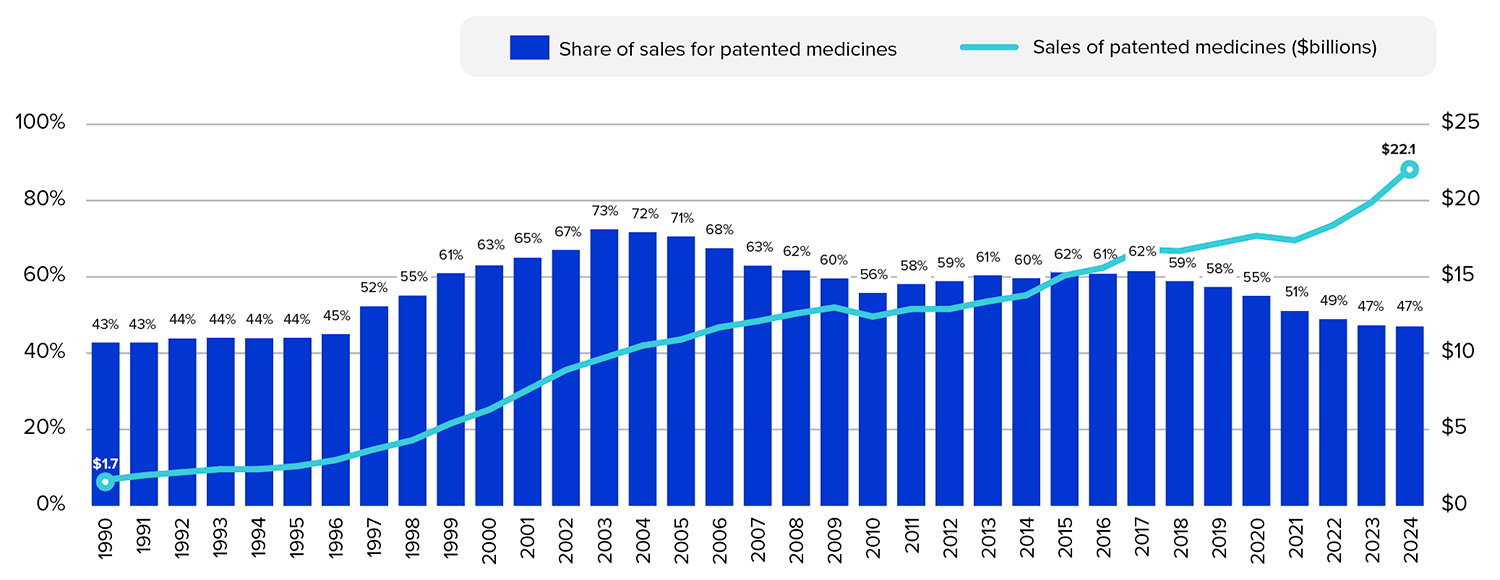
Figure description
This line and bar graphic depicts the annual sales of patented medicines and the patented medicine share of all medicine sales from 1990 to 2024.
| Year | Sales of patented medicines ($billions) | Share of sales for patented medicines |
|---|---|---|
| 1990 | $1.7 | 43% |
| 1991 | $2.0 | 43% |
| 1992 | $2.2 | 44% |
| 1993 | $2.4 | 44% |
| 1994 | $2.4 | 44% |
| 1995 | $2.6 | 44% |
| 1996 | $3.0 | 45% |
| 1997 | $3.7 | 52% |
| 1998 | $4.3 | 55% |
| 1999 | $5.4 | 61% |
| 2000 | $6.3 | 63% |
| 2001 | $7.6 | 65% |
| 2002 | $8.9 | 67% |
| 2003 | $9.7 | 73% |
| 2004 | $10.5 | 72% |
| 2005 | $10.9 | 71% |
| 2006 | $11.7 | 68% |
| 2007 | $12.1 | 63% |
| 2008 | $12.6 | 62% |
| 2009 | $13.0 | 60% |
| 2010 | $12.4 | 56% |
| 2011 | $12.9 | 58% |
| 2012 | $12.9 | 59% |
| 2013 | $13.4 | 61% |
| 2014 | $13.8 | 60% |
| 2015 | $15.1 | 62% |
| 2016 | $15.6 | 61% |
| 2017 | $16.8 | 62% |
| 2018 | $16.7 | 59% |
| 2019 | $17.2 | 58% |
| 2020 | $17.7 | 55% |
| 2021 | $17.4 | 51% |
| 2022 | $18.4 | 49% |
| 2023 | $19.9 | 47% |
| 2024 | $22.1 | 47% |
Notes
Note: To account for revised submissions from Rights Holders, sales are recalculated for the five years preceding the current Annual Report year.
The patented medicine share of all medicine sales is based on a denominator of sales of patented and non-patented brand medicines and patented and non-patented generic medicines. This value is derived from data in IQVIA’s MIDAS® database.
Data source: PMPRB; MIDAS® database, 1990–2024, IQVIA (all rights reserved)
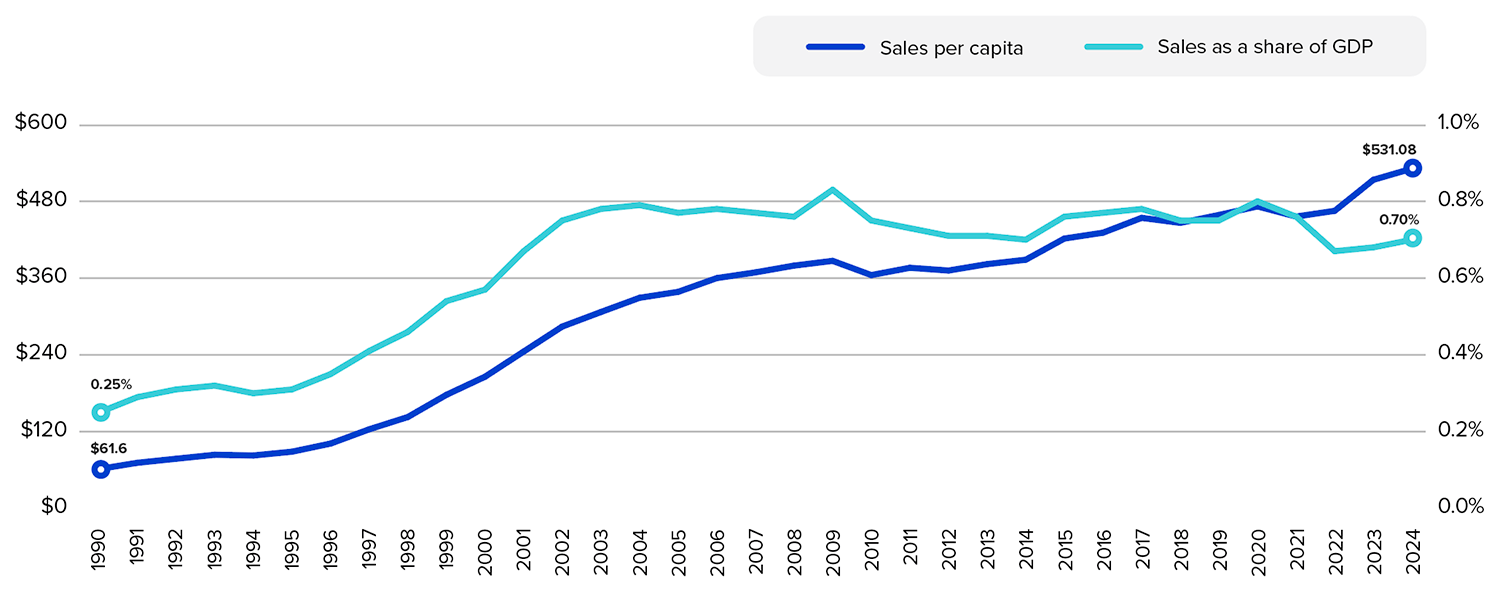
Figure description
This line graphic depicts patented medicine sales per capita and as a share of GDP in Canada from 1990 to 2024.
| Year | Sales per capita | Share as a share of GDP |
|---|---|---|
| 1990 | $61.60 | 0.25% |
| 1991 | $71.40 | 0.29% |
| 1992 | $77.70 | 0.31% |
| 1993 | $83.90 | 0.32% |
| 1994 | $82.80 | 0.30% |
| 1995 | $88.70 | 0.31% |
| 1996 | $101.40 | 0.35% |
| 1997 | $123.70 | 0.41% |
| 1998 | $142.90 | 0.46% |
| 1999 | $177.60 | 0.54% |
| 2000 | $205.90 | 0.57% |
| 2001 | $245.20 | 0.67% |
| 2002 | $284.30 | 0.75% |
| 2003 | $307.00 | 0.78% |
| 2004 | $329.20 | 0.79% |
| 2005 | $338.50 | 0.77% |
| 2006 | $360.00 | 0.78% |
| 2007 | $368.90 | 0.77% |
| 2008 | $379.50 | 0.76% |
| 2009 | $386.90 | 0.83% |
| 2010 | $364.70 | 0.75% |
| 2011 | $376.10 | 0.73% |
| 2012 | $371.80 | 0.71% |
| 2013 | $381.80 | 0.71% |
| 2014 | $388.70 | 0.70% |
| 2015 | $421.80 | 0.76% |
| 2016 | $430.94 | 0.77% |
| 2017 | $454.09 | 0.78% |
| 2018 | $446.30 | 0.75% |
| 2019 | $458.60 | 0.75% |
| 2020 | $472.00 | 0.80% |
| 2021 | $456.14 | 0.76% |
| 2022 | $465.12 | 0.67% |
| 2023 | $513.57 | 0.68% |
| 2024 | $531.08 | 0.70% |
Notes
Data source: PMPRB; Statistics Canada; OECD
Drivers of the Growth in Sales
Changes in patented medicine prices have played a minor role in year-over-year sales growth of patented medicines since 2019, suggesting that, on average, the prices of existing patented medicines are fairly stable. However, this does not reflect the overall increases in treatment costs due to the entry of newer, higher-priced patented medicines.
Figure 15 summarizes the major factors that drove the annual changes in patented medicine sales between 2019 and 2024. This analysis shows that the shift to new, higher-cost patented medicines has been a major driver of sales growth in recent years. In 2024, the use of higher-cost patented medicines (mix effect) put an upward pressure on expenditures of $3.1 billion (15.8%).
Counterbalancing these upward pressures, there was a moderate market segment shift as some high-selling medicines stopped reporting their sales to the PMPRB. The exiting effect accounted for a pull of $943 million (-4.9%) on sales in 2024.
Methodology Note: Drivers of Sales Growth
The growth in the sales of patented medicines is influenced by changes in several key factors:
- Volume effect: changes in the quantity or amount of patented medicines sold. This effect focuses on established medicines that were on the market for the period analyzed. Increases in the population, changes in demographic composition (e.g., shifts in the age distribution), increases in the incidence of disease, and changes in prescribing practices are among the factors that may contribute to this effect.
- Mix effect: shifts in use between lower- and higher-cost patented medicines. This effect applies to both new medicines and those that were already on the market. The switch to new higher-priced medicines, the use of new medicines that treat conditions for which no effective treatment previously existed, and changes in prescribing practices are among the factors that may contribute to this change.
- Exiting effect: previously patented medicines that have stopped reporting sales revenues to the PMPRB or are no longer sold in Canada.
- Loss-of-exclusivity effect: medicines that have lost market exclusivity and are open to some level of generic competition but are still patented.
- Price effect: changes in the prices of existing patented medicines. This effect applies to both increases and decreases in the prices of patented medicines over the time period analyzed.
Some factors, such as the mix effect, will generally put an upward pressure on sales, while others, such as the loss-of-exclusivity effect, have the opposite effect.
The cost driver analysis used here follows the approach detailed in the PMPRB report The Drivers of Prescription Drug Expenditures: A Methodological Report, 2013.
Figure 15. Key Drivers of Change in the Sales of Patented Medicines, 2019 to 2024
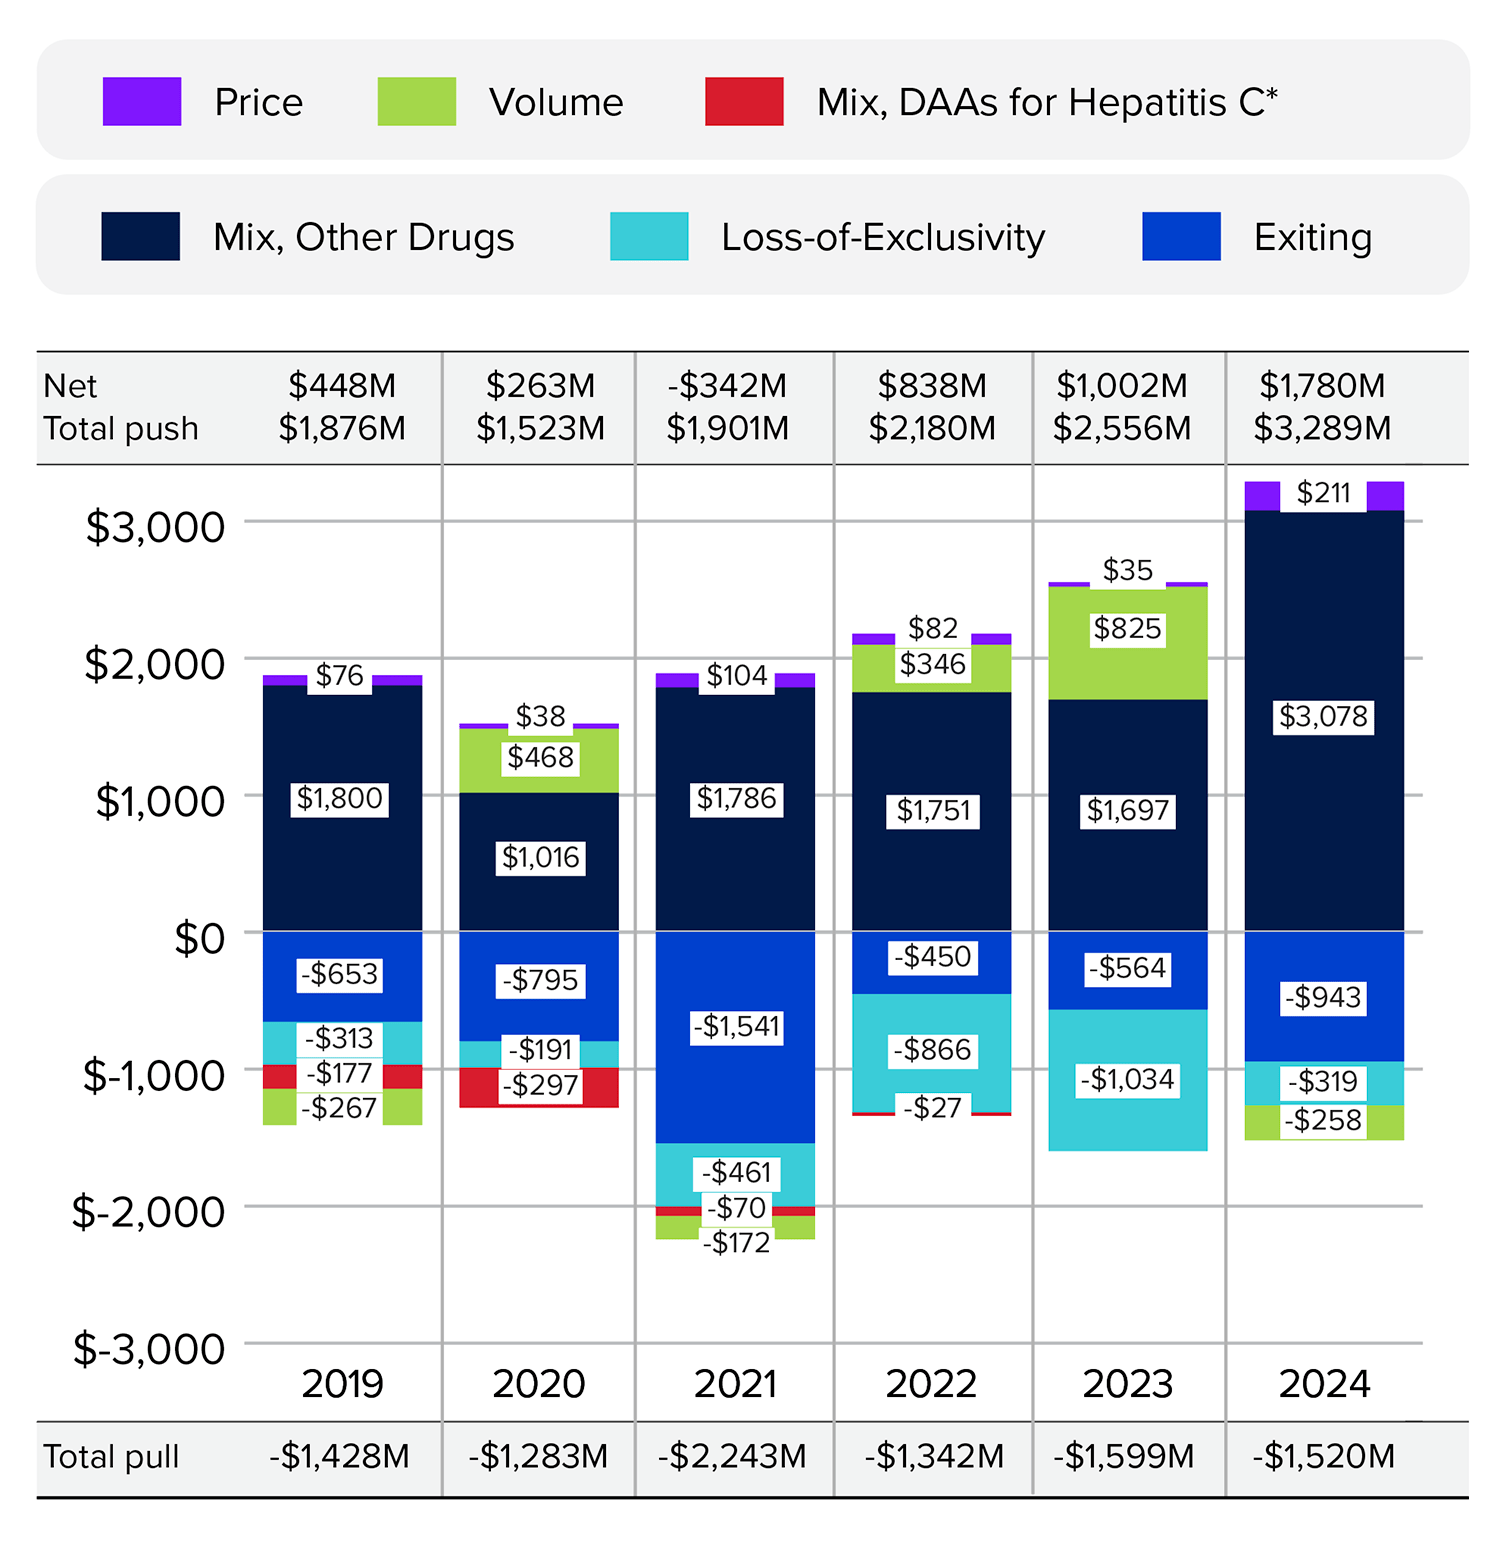
Figure description
This bar graph describes the factors that impacted the annual rates of change in the sales of patented medicines from 2019 to 2024 in absolute dollar amounts, along with the total push up (positive) and pull down (negative) effects. Direct-acting antiviral (DAA) medicines for hepatitis C are presented separately from the rest of the drug-mix effect up to 2022 because of their high impact but have been combined with the drug-mix effect for 2023 and 2024. The results shown here are in millions of dollars.
| Exiting | Loss-of-exclusivity | Mix, other drugs | Mix, DAAs for hepatitis C | Volume | Price | Total pull effects | Total push effects | Net change | |
|---|---|---|---|---|---|---|---|---|---|
| 2019 | -$653 | -$313 | $1,800 | -$177 | -$267 | $76 | -$1,428 | $1,876 | $448 |
| 2020 | -$795 | -$191 | $1,016 | -$297 | $468 | $38 | -$1,283 | $1,523 | $263 |
| 2021 | -$1,541 | -$461 | $1,786 | -$70 | -$172 | $104 | -$2,243 | $1,901 | -$342 |
| 2022 | -$450 | -$866 | $1,751 | -$27 | $346 | $82 | -$1,342 | $2,180 | $838 |
| 2023 | -$564 | -$1,034 | $1,697 | – | $825 | $35 | -$1,599 | $2,556 | $1,002 |
| 2024 | -$943 | -$319 | $3,078 | – | -$258 | $211 | -$1,520 | $3,289 | $1,780 |
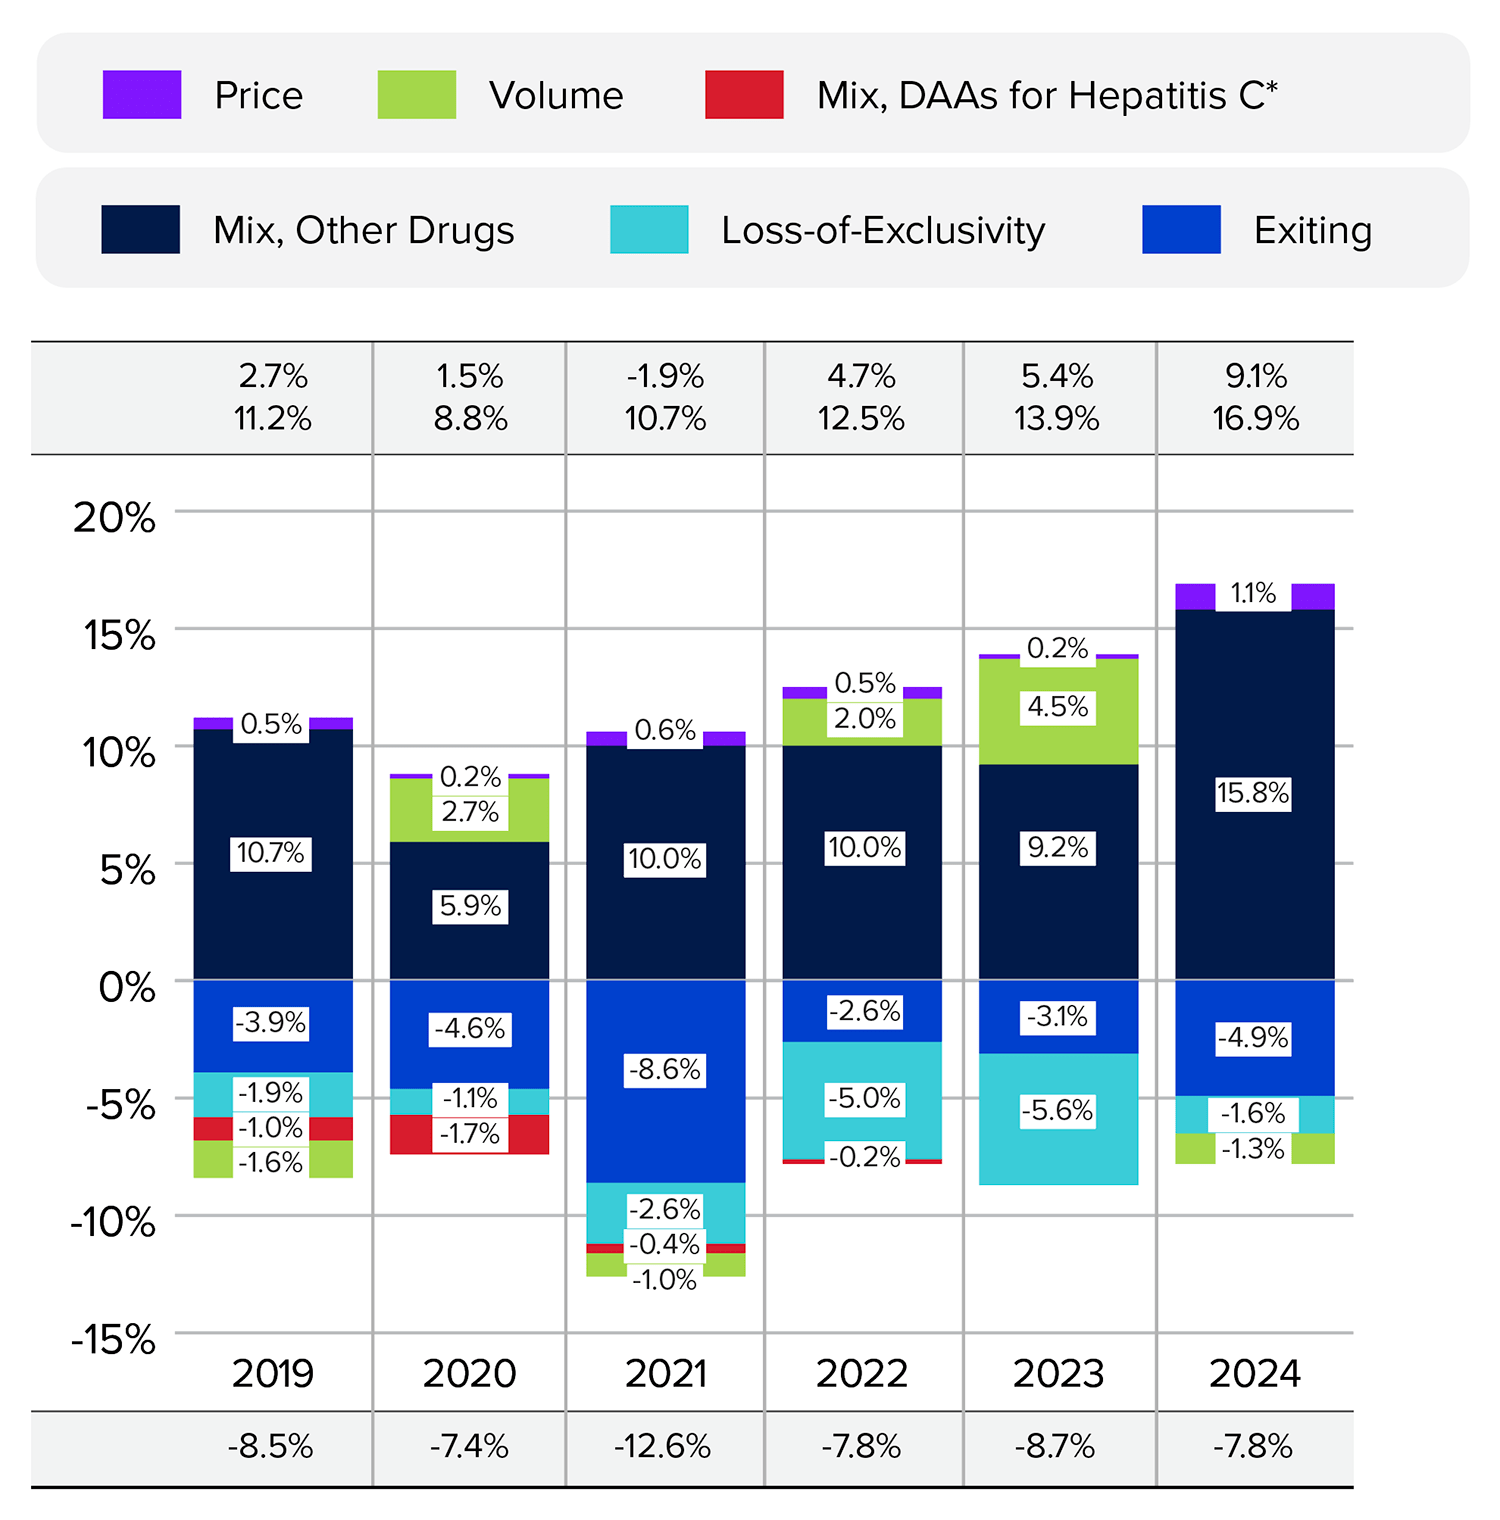
Figure description
This bar graph describes the factors that impacted the annual rates of change in the sales of patented medicines from 2019 to 2024 in percent rate of growth for each contributing factor, along with the total push up (positive) and pull down (negative) effects. Direct-acting antiviral (DAA) medicines for hepatitis C are presented separately from the rest of the drug-mix effect up to 2022 because of their high impact but have been combined with the drug-mix effect for 2023 and 2024.
| Exiting | Loss-of-exclusivity | Mix, other drugs | Mix, DAAs for hepatitis C | Volume | Price | Total pull effects | Total push effects | Net change | |
|---|---|---|---|---|---|---|---|---|---|
| 2019 | -3.9% | -1.9% | 10.7% | -1.0% | -1.6% | 0.5% | -8.5% | 11.2% | 2.7% |
| 2020 | -4.6% | -1.1% | 5.9% | -1.7% | 2.7% | 0.2% | -7.4% | 8.8% | 1.5% |
| 2021 | -8.6% | -2.6% | 10.0% | -0.4% | -1.0% | 0.6% | -12.6% | 10.7% | -1.9% |
| 2022 | -2.6% | -5.0% | 10.0% | -0.2% | 2.0% | 0.5% | -7.8% | 12.5% | 4.7% |
| 2023 | -3.1% | -5.6% | 9.2% | – | 4.5% | 0.2% | -8.7% | 13.9% | 5.4% |
| 2024 | -4.9% | -1.6% | 15.8% | – | -1.3% | 1.1% | -7.8% | 16.9% | 9.1% |
Notes
Note: When multiple factors change simultaneously, they create a residual or cross effect, which is not reported separately in this analysis, but is accounted for in the total cost change.
Values may not add to the net change due to rounding and the cross effect.
As this model uses various measures to isolate the factors contributing to growth, the net change reported here may differ slightly from the reported overall change in the patented medicines market reported in Table 5.
* DAA: Direct-acting antivirals for the treatment for hepatitis C. Mix, DAAs for Hepatitis C is included in Mix, Other Drugs starting in 2023.
Data source: PMPRB
Global Sales
To compare Canadian sales trends to those in international markets, the following figures and tables make use of global sales data for all prescription medicines from IQVIA.Footnote 14
Figure 16 shows the shares of global sales held by Canada and other major national markets, including the PMPRB11 countries.Footnote 15 Canadian sales accounted for 2.2% of the global market in 2024, making Canada the ninth largest national market for pharmaceuticals. Canada has consistently been within the 2.0%–2.5% range over the last decade.
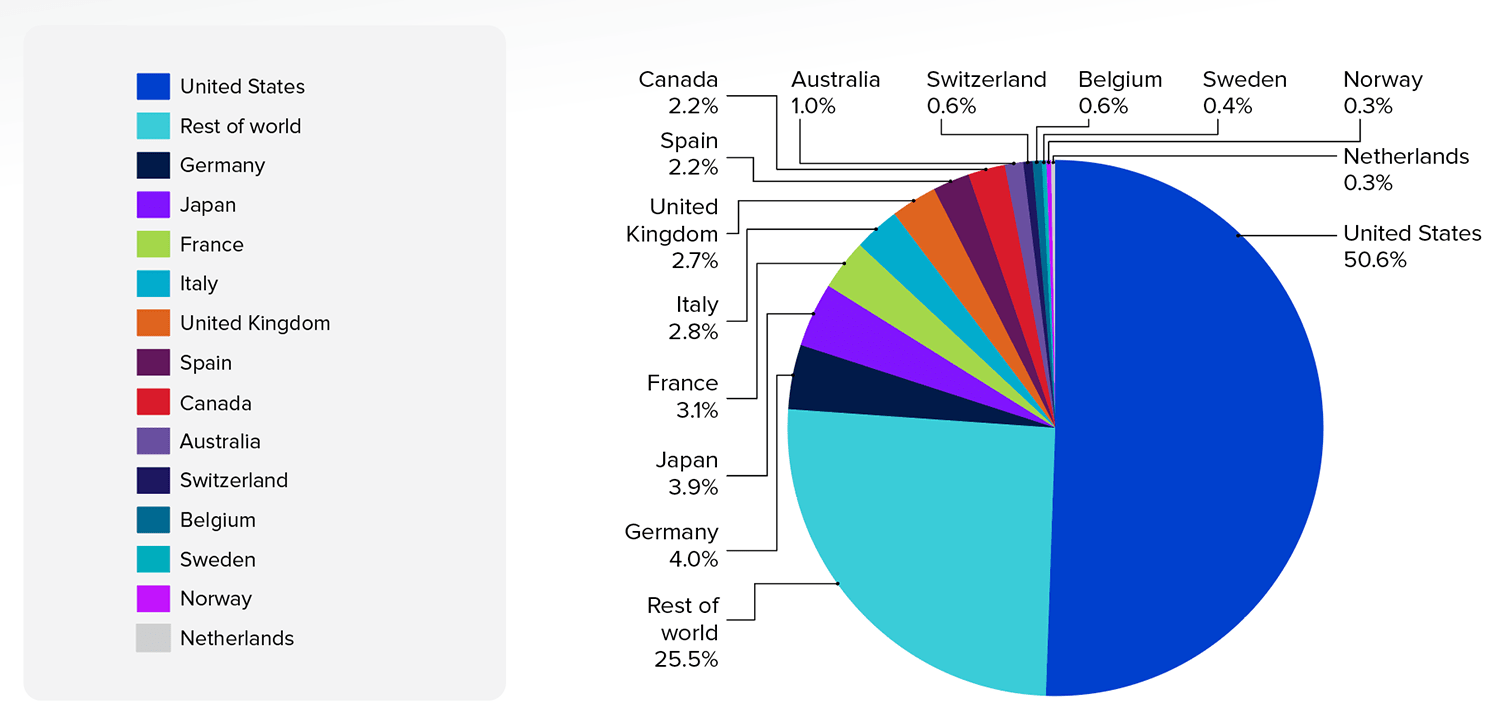
Figure description
This pie chart depicts the distribution of medicine sales among major global markets in 2024.
| Market | Share of medicine sales, 2024 |
|---|---|
| United States | 50.6% |
| Rest of world | 25.5% |
| Germany | 4.0% |
| Japan | 3.9% |
| France | 3.1% |
| Italy | 2.8% |
| United Kingdom | 2.7% |
| Spain | 2.2% |
| Canada | 2.2% |
| Australia | 1.0% |
| Switzerland | 0.6% |
| Belgium | 0.6% |
| Sweden | 0.4% |
| Norway | 0.3% |
| Netherlands | 0.3% |
Notes
Data source: MIDAS® database, 2024, IQVIA (all rights reserved)
Figure 17 compares rates of year-over-year growth in medicine sales for the entire pharmaceutical market in Canada and the PMPRB11 countries. In 2024, sales grew at a slightly faster rate in Canada than in the PMPRB11.
Canada represented 2.2% of worldwide pharmaceutical sales in 2024, making Canada the ninth largest national market.
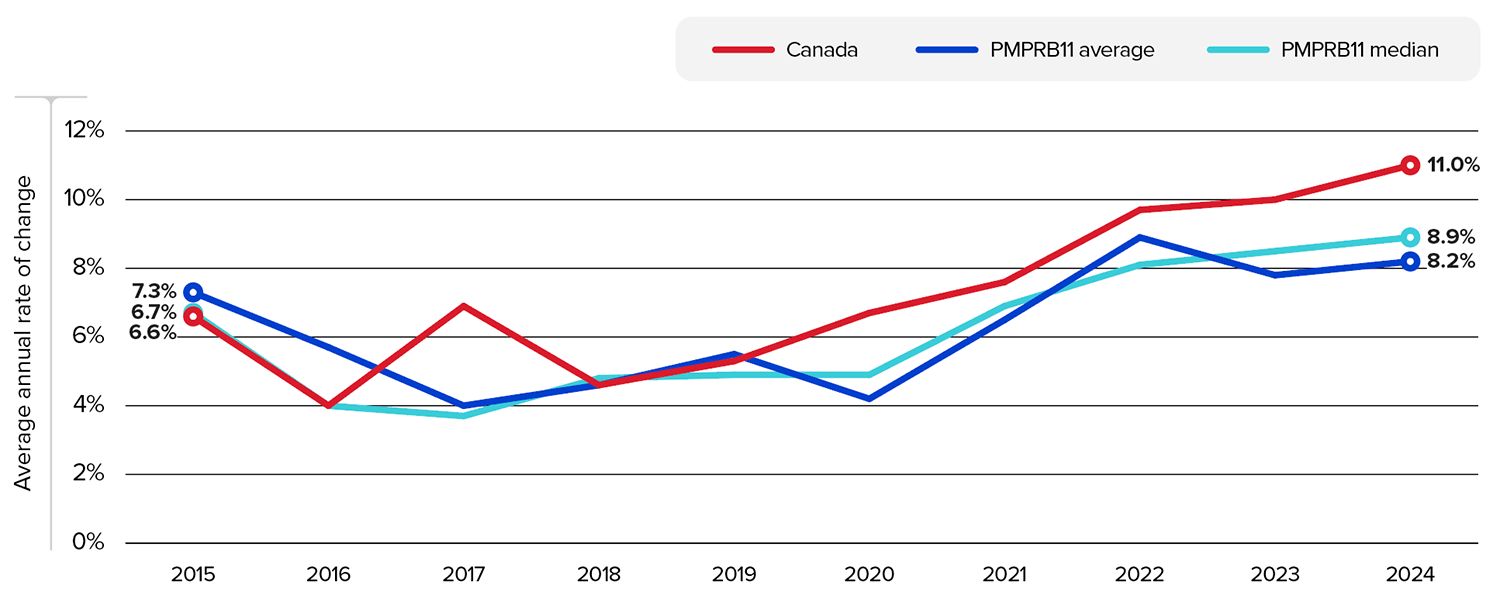
Figure description
This line graph depicts the average annual rate of change in medicine sales, using constant 2024 market exchange rates, for Canada, the average of the PMPRB11 countries, and the PMPRB11 median from 2015 to 2024.
| Year | Rate of change, Canada | Rate of change, PMPRB11 average | Rate of change, PMPRB11 median |
|---|---|---|---|
| 2015 | 6.6% | 7.3% | 6.7% |
| 2016 | 4.0% | 5.7% | 4.0% |
| 2017 | 6.9% | 4.0% | 3.7% |
| 2018 | 4.6% | 4.6% | 4.8% |
| 2019 | 5.3% | 5.5% | 4.9% |
| 2020 | 6.7% | 4.2% | 4.9% |
| 2021 | 7.6% | 6.5% | 6.9% |
| 2022 | 9.7% | 8.9% | 8.1% |
| 2023 | 10.0% | 7.8% | 8.5% |
| 2024 | 11.0% | 8.2% | 8.9% |
Notes
Data source: MIDAS® database, 2015–2024, IQVIA (all rights reserved)
The proportion of national income allocated to the purchase of medicines provides another way to compare medicine costs across countries. Comparisons made on this basis will reflect international differences in prices, overall utilization, and patterns of therapeutic choice, as well as differences in national income.
Table 6 provides a historical perspective on international pharmaceutical expenditures-to-GDP ratios and per capita spending, using the most recent data from the OECD.Footnote 16 Between 2013 and 2022, Canada’s expenditures-to-GDP ratio decreased from 1.77% to 1.62%. Ratios in eight PMPR11 countries—Australia, Belgium, France, the Netherlands, Norway, Spain, Sweden, and the UK— also declined. In 2022, Canada had the fourth-highest sales per capita on medicines compared to the PMPRB11, behind Belgium, Germany, and Japan.
In 2022, Canadians spent 1.6% of gross domestic product on medicines. This was the third-highest share in the PMPRB11, behind Germany and Japan.
Table 6. Medicine Expenditures as a Share of GDP and Per Capita, Canada and the PMPRB11, 2013 and 2022
| Country | Share: Medicine Expenditures/GDP 2013 | Share: Medicine Expenditures/GDP 2022 | Growth: GDP 2013–2022 | Pharmaceutical sales* per capita 2013 ($US PPP) |
Pharmaceutical sales* per capita 2022 ($US PPP) |
|---|---|---|---|---|---|
| Canada | 1.77% | 1.62% | 59.3% | $572 | $818 |
| Australia | 1.24% | 1.10% | 70.8% | $353 | $519 |
| Belgium | 1.33% | 1.18% | 62.6% | $663 | $1,026 |
| France | 1.70% | 1.54% | 46.4% | $502 | N/A |
| Germany | 1.54% | 1.71% | 53.0% | $504 | $929 |
| Italy | 1.50% | 1.56% | 51.0% | $437 | $687 |
| Japan | 2.02% | 2.03% | 18.1% | $534 | $839 |
| Netherlands | 0.82% | 0.71% | 63.8% | $321 | $391 |
| Norway | 0.68% | 0.56% | 96.3% | $421 | $614 |
| Spain | 1.48% | 1.42% | 58.7% | $339 | $816 |
| Sweden | 1.10% | 1.00% | 57.3% | $440 | $636 |
| United Kingdom | 1.20% | 1.07% | 54.5% | $328 | $428 |
Notes
Note: Pharmaceutical sales per capita in 2022 for France were not available in the OECD database at the time of analysis.
* Total sales of pharmaceutical products on the domestic market, based on retail prices (the final price paid by the customer). Converted to US dollars using purchasing power parity (PPP), which corrects for the relative cost of living based on a standard basket of goods.
Data source: OECD
Research and Development Expenditures
The Patent Act directs the PMPRB to monitor and report on pharmaceutical research and development (R&D) spending, which can improve global and national healthcare by expanding the choice of treatment options available. This section provides key statistics on the current state of pharmaceutical R&D investment in Canada.
Analysis of Research and Development Expenditures
Definition of R&D Expenditures
Pursuant to sections 5 and 6 of the Regulations, Rights Holders are required to report R&D expenditures that would have qualified for a Scientific Research and Experimental Development (SR&ED) investment tax credit under the provisions of the Income Tax Act that came into effect on December 1, 1987.Footnote 17
By this definition, R&D expenditures may include current expenditures, capital equipment costs, and allowable depreciation expenses. Current R&D expenditures consist of non-capital expenses directly related to research, including (a) wages and salaries; (b) direct material; (c) contractors and sub-contractors; (d) other direct costs such as factory overhead; (e) payments to designated institutions; (f) payments to granting councils; and (g) payments to other organizations.Footnote 18
Examples of R&D expenditures that may be reported to the PMRPB include basic chemical and biological research, manufacturing processes, pre-clinical trials, and clinical trials up to Phase III. While some payments to designated institutions, such as universities and research institutes, can also qualify, unrestricted grants to specific academic institutions and equity investments in early-stage companies generally do not qualify if the grants or investments may be used to fund other non-SR&ED projects or expenses.
Market research; sales promotions; quality control or routine testing of materials, devices, or products; and routine data collection are not eligible for an investment tax credit and, therefore, are not included in the R&D expenditures reported by Rights Holders.
Reporting Companies
Note that companies without sales of patented medicines do not need to report their R&D expenditures to the PMPRB. This has two implications:
First, the R&D expenditures reported to PMPRB are not representative of all pharmaceutical research conducted in Canada. Companies that sell only non-patented medicines, or those that conduct research but have no medicine sales at all, do not report their R&D expenditures.Footnote 19
Second, as new patented medicines enter the Canadian market and existing relevant patents expire, the number and identity of companies required to file R&D data to PMPRB may change from year to year. In 2024, 105 companies reported on their R&D activity.
Reporting Requirements
The statistical results in this section were derived from data submitted to the PMPRB by Rights Holders.
The Act requires each Rights Holder to report its total gross revenues from sales of all medicines for human or veterinary use (including revenues from sales of non-patented medicines and from licensing agreements) and R&D expenditures in Canada related to medicines (both patented and non-patented for human or veterinary use).
Failure to File
It is a Rights Holder’s responsibility to ensure that complete and accurate R&D-related data is filed within the time frame set out in the Regulations. If a Rights Holder fails to meet these filing requirements, the Board may issue an Order demanding compliance. No such Board Orders were issued for the 2024 reporting period.
Definition of Sales Revenues
For reporting purposes, sales revenues are defined in the Regulations as total gross revenues from sales in Canada of all medicines (patented and non-patented, for both human and veterinary use) and from licensing agreements (e.g., royalties and fees accruing to the Rights Holder related to sales in Canada by licensees).
Total Sales Revenues and R&D Expenditures
In Canada, the ratio of R&D expenditures to sales revenues for pharmaceutical Rights Holders steadily decreased between the late 1990s and 2022. In 2024, it increased from 3.7% to 4.1% relative to 2023, continuing the upward trend observed since 2022. However, it remains lower than the peak R&D-to-sales ratio of 11.7% in 1995.
Table 7 provides an overview of reported sales revenues and R&D expenditures from 2020 to 2024. Rights Holders reported total 2024 sales revenues of $31.8 billion, a 9.1% increase over 2023. Less than 1% of these sales revenues were generated by licensing agreements. Reported R&D expenditures totaled $1.29 billion, an increase of 21.1% over 2023 compared to an average annual growth rate of 8.3% between 2020 and 2024.
Rights Holders had an R&D-to-sales ratio of 4.1% in 2024. This represents a 65% decrease from a peak of 11.7% in 1995.
R&D-to-Sales Ratios
Table 7 and Figure 18 provide ratios of R&D expenditures to sales revenues.Footnote 20 In 1988, the then member companies of Innovative Medicines Canada (IMC) made a commitment to achieve an R&D-to-sales ratio of 10% by 1996.Footnote 21
The overall R&D-to-sales ratio, which includes current members of IMC as well as non-member companies, has been less than 10% for the past 23 years. In 2024, the R&D-to-sales ratio was 4.1%.
Table 7. Total R&D Expenditures and R&D-to-Sales Ratios of Rights Holders, 2020 to 2024
| Year | Number of companies reporting | R&D expenditures by all Rights Holders ($millions) | Change from previous year | Sales revenues ($millions) | Change from previous year | R&D-to-sales ratio |
|---|---|---|---|---|---|---|
| 2024 | 105 | $1,294.8 | 21.1% | $31,847.6 | 9.1% | 4.1% |
| 2023 | 104 | $1,069.3 | 17.0% | $29,204.2 | 0.2% | 3.7% |
| 2022 | 100 | $914.0 | -1.0% | $29,144.9 | 6.1% | 3.1% |
| 2021 | 100 | $922.9 | 12.2% | $27,478.5 | 13.2% | 3.4% |
| 2020 | 99 | $822.9 | -7.9% | $24,278.2 | 5.1% | 3.4% |
Notes
Data source: PMPRB
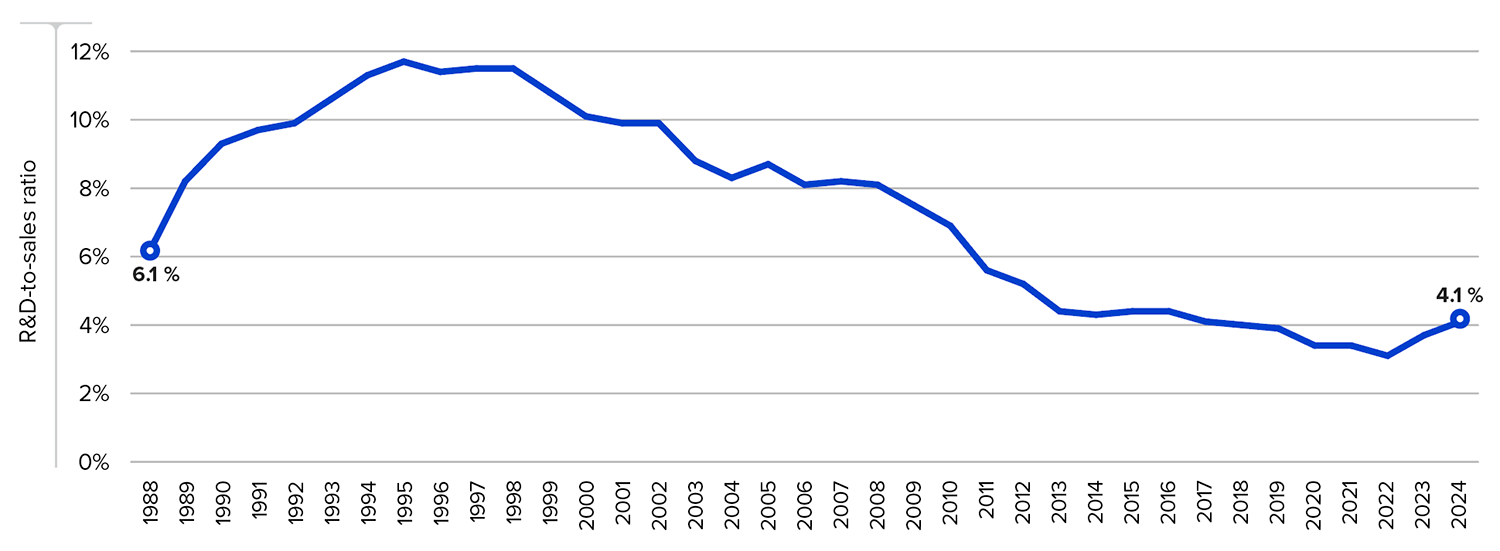
Figure description
This line graph depicts the annual R&D-to-sales ratio for pharmaceutical Rights Holders from 1988 to 2024.
| Year | R&D-to-sales ratios for Rights Holders |
|---|---|
| 1988 | 6.1% |
| 1989 | 8.2% |
| 1990 | 9.3% |
| 1991 | 9.7% |
| 1992 | 9.9% |
| 1993 | 10.6% |
| 1994 | 11.3% |
| 1995 | 11.7% |
| 1996 | 11.4% |
| 1997 | 11.5% |
| 1998 | 11.5% |
| 1999 | 10.8% |
| 2000 | 10.1% |
| 2001 | 9.9% |
| 2002 | 9.9% |
| 2003 | 8.8% |
| 2004 | 8.3% |
| 2005 | 8.7% |
| 2006 | 8.1% |
| 2007 | 8.2% |
| 2008 | 8.1% |
| 2009 | 7.5% |
| 2010 | 6.9% |
| 2011 | 5.6% |
| 2012 | 5.2% |
| 2013 | 4.4% |
| 2014 | 4.3% |
| 2015 | 4.4% |
| 2016 | 4.4% |
| 2017 | 4.1% |
| 2018 | 4.0% |
| 2019 | 3.9% |
| 2020 | 3.4% |
| 2021 | 3.4% |
| 2022 | 3.1% |
| 2023 | 3.7% |
| 2024 | 4.1% |
Notes
Data source: PMPRB
Figure 19 and Table 8 offer more detail on the R&D-to-sales ratios underlying the ratios reported in Table 7. Figure 19 shows the distribution of Rights Holders according to the value of their R&D-to-sales ratio (more exactly, according to the range into which the ratio fell).Footnote 22
In 2024, over three quarters (77%) of companies reported an R&D-to-sales ratio of less than 5%. This included 31 (31%) companies with an R&D-to-sales ratio between 0% and 5% and 46 (46%) companies that reported no R&D expenditures. These trends have been consistent over the past three years.
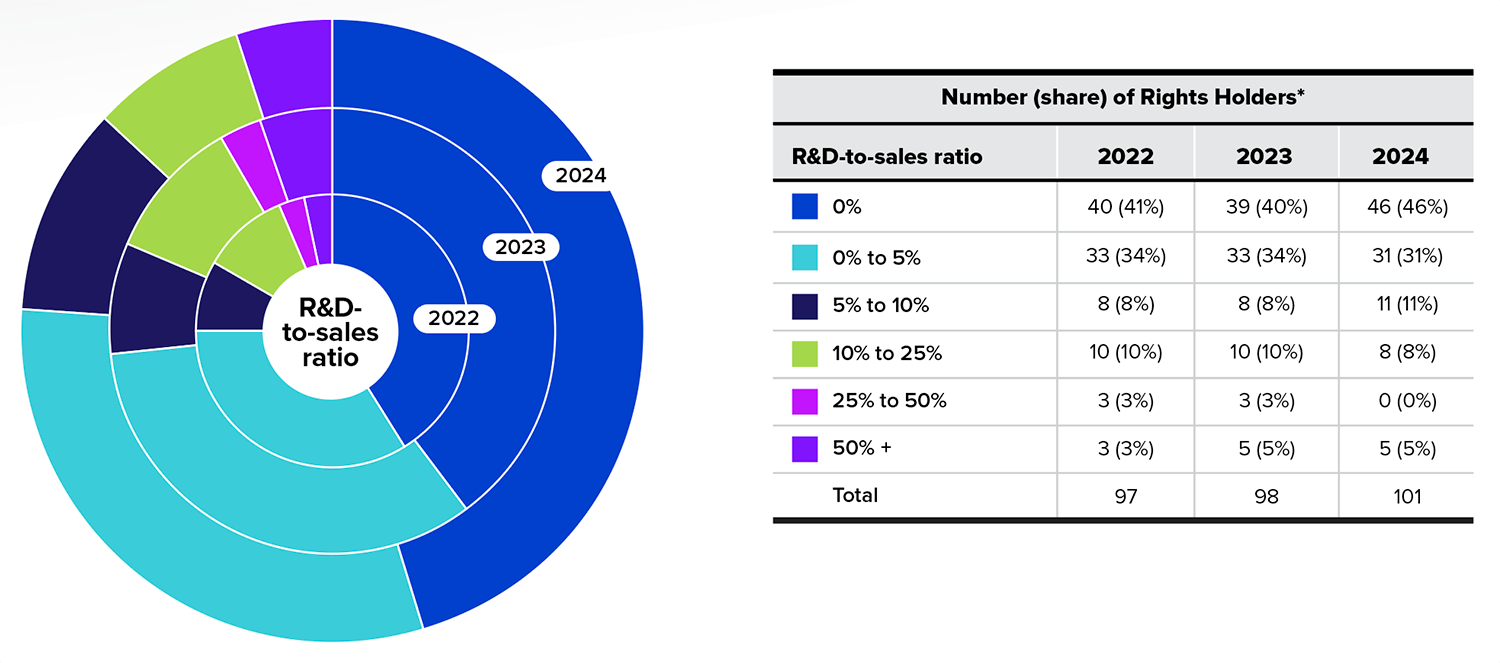
Figure description
A donut chart shows the distribution of Rights Holder companies by their R&D-to-sales ratio for 2022, 2023, and 2024. In a table below the chart, results are given as a number of Rights Holders that fell into the range of R&D-to-sales ratios, as well how that number translate into a percent share of all Rights Holders.
Number of Rights Holders
| R&D-to-sales ratio | 2022 | 2023 | 2024 |
|---|---|---|---|
| 0% | 40 | 39 | 46 |
| 0% to 5% | 33 | 33 | 31 |
| 5% to 10% | 8 | 8 | 11 |
| 10% to 25% | 10 | 10 | 8 |
| 25% to 50% | 3 | 3 | 0 |
| 50% and higher | 3 | 5 | 5 |
| Total number of companies | 97 | 98 | 101 |
Percent share of total Rights Holders
| R&D-to-sales ratio | 2022 | 2023 | 2024 |
|---|---|---|---|
| 0% | 41% | 40% | 46% |
| 0% to 5% | 34% | 34% | 31% |
| 5% to 10% | 8% | 8% | 11% |
| 10% to 25% | 10% | 10% | 8% |
| 25% to 50% | 3% | 3% | 0% |
| 50% and higher | 3% | 5% | 5% |
| Total | 100% | 100% | 100% |
Notes
* This reflects only those reporting companies for which an R&D-to-sales ratio could be calculated (i.e., companies that reported both R&D expenditures and positive sales). As such, it accounts for 101 of the total 105 companies reported in Table 7.
Data source: PMPRB
Table 8 provides additional granularity to Figure 19 by further distributing companies according to their annual sales revenues in Canada for 2024. Most R&D expenditures were concentrated among companies with higher sales revenues in Canada. Among companies with less than $30 million in Canadian sales, over half (57%) reported no R&D expenditures.
Table 8. Distribution of R&D-to-Sales Ratio by Sales Revenues in Canada, 2024
| Sales revenues in Canada | No. of companies |
Total R&D expenditures ($millions) |
Total revenues ($millions) |
R&D-to-sales ratio |
Number of reporting companies by distribution of R&D-to-sales ratio |
|||||
|---|---|---|---|---|---|---|---|---|---|---|
| 0% | 0%–5% | 5%–10% | 10%–25% | 25%–50% | >50% | |||||
| Greater than $90M | 45 | 1,086 | 30,226 | 3.6% | 13 | 21 | 6 | 5 | 0 | 0 |
| $30M–$90M | 23 | 37 | 1,259 | 3.0% | 12 | 5 | 4 | 2 | 0 | 0 |
| Less than $30M | 37 | 106 | 363 | 29.3% | 21 | 5 | 1 | 1 | 0 | 5 |
| No sales revenues* | 4 | 65 | – | – |
||||||
| Total | 105 | 1,295 | 31,848 | 4.1% | 46 | 31 | 11 | 8 | 0 | 5 |
Notes
* All medicines under PMPRB jurisdiction must report gross sales and R&D. The PMPRB considers a $0 transaction (e.g., through the Special Access Program, returns, etc.) as a transaction for the purposes of reporting to the PMPRB, and this considered as a sale. R&D-to-sales ratios cannot be calculated for companies with no positive sales revenues reported. As such, R&D expenditures reported do not reflect the full picture of R&D in Canada.
Data source: PMPRB
Current R&D Expenditures by Type of Research
Table 9 provides information on the allocation of current R&D expenditures (i.e., total R&D expenditures minus capital expenditures) in basic and applied research as well as other qualifying R&D.Footnote 23 Rights Holders reported spending $134.2 million on basic research in 2024, representing 10.7% of current R&D expenditures. A reported $743.9 million was spent on applied research, representing 59.2% of current R&D expenditures. Clinical trials (Phase I to III) accounted for 70.2% of applied research expenditures.
Table 9. Current R&D Expenditures by Type of Research, 2024 and 2023
| Type of research | Expenditures: 2024 ($millions) | Share: 2024 | Expenditures: 2023 ($millions) | Share: 2023 | Annual change in expenditures |
|---|---|---|---|---|---|
| Basic | $134.2 | 10.7% | $111.8 | 10.8% | 20.0% |
| Chemical | $81.5 | 6.5% | $61.4 | 5.9% | -32.7% |
| Biological | $52.7 | 4.2% | $50.4 | 4.9% | 4.6% |
| Applied | $743.9 | 59.2% | $615.3 | 59.3% | 20.9% |
| Manufacturing process | $152.8 | 12.2% | $66.9 | 6.5% | 128.4% |
| Pre-clinical trial I | $31.1 | 2.5% | $37.9 | 6.7% | -17.9% |
| Pre-clinical trial II | $37.6 | 3.0% | $39.9 | 3.8% | -5.8% |
| Clinical trial Phase I | $52.2 | 4.2% | $71.1 | 6.8% | -26.6% |
| Clinical trial Phase II | $90.2 | 7.2% | $89.4 | 8.6% | 0.9% |
| Clinical trial Phase III | $380.0 | 30.2% | $310.2 | 29.9% | 22.5% |
| Other qualifying R&D | $379.4 | 30.2% | $310.9 | 30.3% | 22.0% |
| Total* | $1,257.5 | 100% | $1,038.0 | 100% | 21.1% |
Notes
Note: This table is based on current R&D expenditures. Total R&D expenditures are the sum of current expenditures and capital expenditures (equipment + depreciation).
* Values may not add to totals due to rounding.
Data source: PMPRB
Current R&D Expenditures by Performer
Rights Holders report expenditures on research they conduct themselves (intramural) and research performed by other establishments, such as universities, hospitals, and other manufacturers (extramural).
In 2024, 55.3% of current research expenditures were intramural (Table 10). Research performed by other companies on behalf of Rights Holders made up 23.2% of current expenditures, while research conducted in universities and hospitals accounted for 12.3%.
Table 10. Current R&D Expenditures by Performer, 2024 and 2023
| R&D performer | Expenditures: 2024 ($millions) |
Share: 2024 |
Expenditures: 2023 ($millions) |
Share: 2023 |
Annual change in expenditures |
|---|---|---|---|---|---|
| Intramural | |||||
| Rights holders | $670.0 | 55.3% | $501.4 | 48.3% | 33.6% |
| Extramural | |||||
| Universities and hospitals | $154.6 | 12.3% | $140.1 | 13.5% | 10.3% |
| Other companies | $291.3 | 23.2% | $266.7 | 25.7% | 9.3% |
| Others | $141.6 | 11.3% | $129.9 | 12.5% | 9.0% |
| Total* | $1,257.5 | 100% | $1,038.0 | 100% | 21.1% |
Notes
Note: This table is based on current R&D expenditures. Total R&D expenditures are the sum of current expenditures and capital expenditures (equipment + depreciation).
* Values may not add to totals due to rounding.
Data source: PMPRB
Total R&D Expenditures by Source of Funds
Table 11 provides information on the sources of funds used by Rights Holders to finance their R&D activity. Internal company funds remained by far the single largest source of funding in 2024, accounting for 97.6% of total expenditures. Funds received from governments amounted to 0.4% of total expenditures.
Table 11. Total R&D Expenditures by Source of Funds, 2024 and 2023
| Source of funds | Expenditures: 2024 ($millions) |
Share: 2024 |
Expenditures: 2023 ($millions) |
Share: 2023 |
Annual change in expenditures |
|---|---|---|---|---|---|
| Company funds | $1,263.8 | 97.6% | $951.9 | 89.0% | 32.8% |
| Federal/provincial governments | $5.8 | 0.4% | $4.4 | 0.4% | 31.8% |
| Others | $25.2 | 1.9% | $113.0 | 10.6% | -77.7% |
| Total* | $1,294.8 | 100% | $1,069.3 | 100% | 21.1% |
Notes
* Values may not add to totals due to rounding.
Data source: PMPRB
Current R&D Expenditures by Region
Tables 12 and 13 show current R&D expenditures by region. As in previous years, current expenditures were heavily concentrated in Ontario and Quebec in 2024, with these provinces accounting for 82.0% of total expenditures. Between 2023 and 2024, Ontario had the largest year-over-year increase in R&D expenditures at 34.5%, followed by 17.0% in Western Canada.
Table 12. Current R&D Expenditures by Region, 2024 and 2023
| Region | Expenditures: 2024 ($millions) |
Share: 2024 |
Expenditures: 2023 ($millions) |
Share: 2023 |
Annual change in expenditures |
|---|---|---|---|---|---|
| Atlantic provinces | $15.6 | 1.2% | $14.9 | 1.4% | 4.7% |
| Quebec | $351.3 | 27.9% | $337.6 | 32.5% | 4.1% |
| Ontario | $680.5 | 54.1% | $505.9 | 48.7% | 34.5% |
| Alberta | $125.1 | 9.9% | $97.5 | 9.4% | 28.3% |
| British Columbia | $75.4 | 6.0% | $75.7 | 7.3% | -0.4% |
| Other Western provinces (MB, SK) | $9.5 | 0.8% | $6.3 | 0.6% | 50.8% |
| Territories | $0.1 | 0.0% | $0.1 | 0.0% | 10.8% |
| Total* | $1,257.5 | 100% | $1,038.0 | 100% | 21.1% |
Notes
Note: This table is based on current R&D expenditures. Total R&D expenditures are the sum of current expenditures and capital expenditures (equipment + depreciation).
* Values may not add to totals due to rounding.
Data source: PMPRB
Table 13. Current R&D Expenditures by Performer and Province/Territory, 2024
| Province | Rights Holders | Other companies | Universities | Hospitals | Others | |
|---|---|---|---|---|---|---|
| Newfoundland and Labrador | Expenditure ($thousands) | $612.9 | $939.41 | $8.22 | $30.53 | $131.08 |
| Share | 35.6% | 54.5% | 4.8% | 1.7% | 7.6% | |
| Prince Edward Island | Expenditure ($thousands) | $54.44 | $35.52 | $0.00 | $0.00 | $0.00 |
| Share | 60.5% | 39.5% | 0.0% | 0.0% | 0.0% | |
| Nova Scotia | Expenditure ($thousands) | $1,364.67 | $2,212.27 | $449.61 | $778.75 | $3,897.94 |
| Share | 15.7% | 25.4% | 5.2% | 8.9% | 44.8% | |
| New Brunswick | Expenditure ($thousands) | $1,702.29 | $1,393.43 | $123.54 | $85.60 | $1,762.38 |
| Share | 33.6% | 27.5% | 2.4% | 1.7% | 34.8% | |
| Quebec | Expenditure ($thousands) | $101,194.98 | $137,143.44 | $21,853.90 | $29,779.75 | $61,360.09 |
| Share | 28.8% | 39.0% | 6.2% | 8.5% | 17.5% | |
| Ontario | Expenditure ($thousands) | $424,508.13 | $120,401.82 | $38,785.27 | $45,320.48 | $51,478.39 |
| Share | 62.4% | 17.7% | 5.7% | 6.7% | 7.6% | |
| Manitoba | Expenditure ($thousands) | $5,443.06 | $617.85 | $641.45 | $516.81 | $480.50 |
| Share | 70.7% | 8.0% | 8.3% | 6.7% | 6.2% | |
| Saskatchewan | Expenditure ($thousands) | $389.27 | $433.95 | $872.12 | $24.98 | $92.94 |
| Share | 21.5% | 23.9% | 48.1% | 1.4% | 5.1% | |
| Alberta | Expenditure ($thousands) | $92,291.78 | $14,132.79 | $5,388.02 | $4,268.29 | $9,006.21 |
| Share | 73.8% | 11.3% | 4.3% | 3.4% | 7.2% | |
| British Columbia | Expenditure ($thousands) | $42,386.29 | $14,029.59 | $2,110.91 | $3,546.10 | $13,376.54 |
| Share | 56.2% | 18.6% | 2.8% | 4.7% | 17.7% | |
| Territories | Expenditure ($thousands) | $40.47 | $14.08 | $2.63 | $0.50 | $0.00 |
| Share | 70.2% | 24.4% | 4.6% | 0.9% | 0.0% | |
| Canada* | Expenditure ($thousands) | $669,988.24 | $291,354.14 | $70,234.86 | $84,351.78 | $141,586.07 |
| Share | 53.3% | 23.2% | 5.6% | 6.7% | 11.3% | |
Notes
Note: For each jurisdiction, the share for each category represents the percentage of total R&D expenditures for the given province or territory (or nationally for the total R&D in Canada).
This table is based on current R&D expenditures. Total R&D expenditures are the sum of current expenditures and capital expenditures (equipment + depreciation).
* Provincial/territorial expenditures may not add to totals for Canada and shares across individual rows may not add to 100% due to rounding.
Data source: PMPRB
Global R&D Expenditures
There are a multitude of factors that drive the location of pharmaceutical R&D, including where companies can find the best science base at a reasonable cost and have ready access to a quality clinical trials infrastructure.
Figure 20 compares Canadian pharmaceutical R&D-to-sales ratios to those of the PMPRB11 in 2001, 2012, and 2022. These three years of data provide a snapshot of observed market trends over the past 20 years. In 2022, Canada’s R&D-to-sales ratio was 3.1%, below the ratios provided for all schedule countries, and less than one fifth of the ratio obtained by aggregating R&D spending and sales across the PMPRB11 (19.7%).
Data for PMPRB11 R&D-to-sales ratios comes from the European Federation of Pharmaceutical Industries and Associations (EFPIA), which is a trade association and lobbying organization that represents the pharmaceutical industry in Europe. EFPIA data is self-reported by member associations, and it is unclear how their definition of R&D investment differs from the definition of R&D expenditure required for filing to the PMPRB. For this reason, the ratios in Canada are not directly comparable to those reported for the PMPRB11.
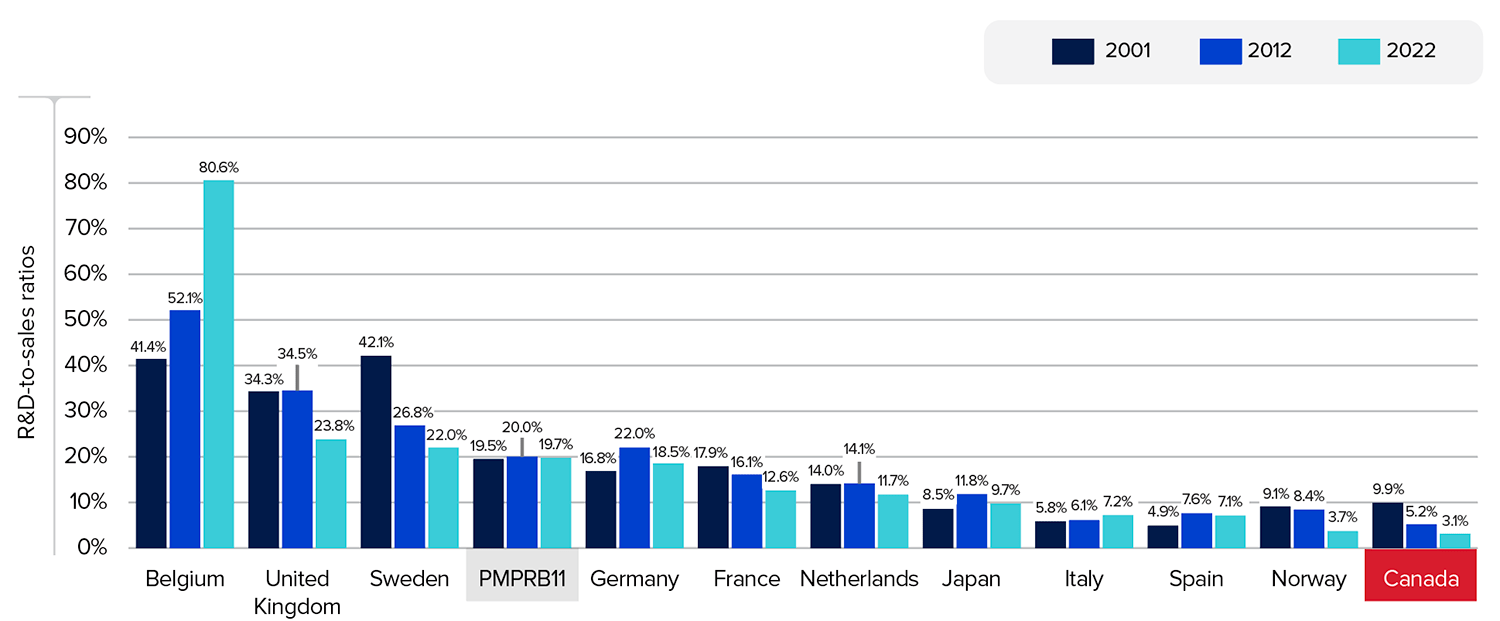
Figure description
This bar graph depicts R&D-to-sales ratios for Canada and the PMPRB11 comparator countries for 2001, 2012, and 2022.
| R&D-to-sales ratio, 2001 | R&D-to-sales ratio, 2012 | R&D-to-sales ratio, 2022 | |
|---|---|---|---|
| Belgium | 41.4% | 52.1% | 80.6% |
| United Kingdom | 34.3% | 34.5% | 23.8% |
| Sweden | 42.1% | 26.8% | 22.0% |
| PMPRB11 | 19.5% | 20.0% | 19.7% |
| Germany | 16.8% | 22.0% | 18.5% |
| France | 17.9% | 16.1% | 12.6% |
| Netherlands | 14.0% | 14.1% | 11.7% |
| Japan | 8.5% | 11.8% | 9.7% |
| Italy | 5.8% | 6.1% | 7.2% |
| Spain | 4.9% | 7.6% | 7.1% |
| Norway | 9.1% | 8.4% | 3.7% |
| Canada | 9.9% | 5.2% | 3.1% |
Notes
Note: Data for Australia was not available. Similarly, as data for 2002 was not available at the time of the analysis, 2001 was used to provide a 20-year comparison.
Data source: PMPRB; European Federation of Pharmaceutical Industries and Associations (EFPIA): The Pharmaceutical Industry in Figures 2023; Japan Pharmaceutical Manufacturers Association (JPMA)
National Prescription Drug Utilization Information System Research Initiative
The PMPRB’s National Prescription Drug Utilization Information System (NPDUIS) research initiative group contributes to Canada’s understanding of medicine usage by providing the Minister of Health with comprehensive, accurate reports to help guide decision making and support the sustainability of our pharmaceutical system. This section provides background on this initiative as well as links to the NPDUIS reports submitted to the Minister in 2024.
Background
At the request of the Minister of Health pursuant to section 90 of the Act, the PMPRB must provide reports to the Minister on critical information and intelligence on price, utilization, and cost trends so that Canada’s healthcare system has more comprehensive and accurate information on how medicines are being used and on sources of cost pressures.
At the Minister’s request, the specific research priorities and methodologies for the reports provided to the Minister by the PMPRB through NPDUIS are established with the guidance of the NPDUIS Advisory Committee to ensure they reflect its priorities. The Advisory Committee is named by the Minister and is composed of representatives from public drug plans in British Columbia, Alberta, Saskatchewan, Manitoba, Ontario, New Brunswick, Nova Scotia, Prince Edward Island, Newfoundland and Labrador, Yukon, the Non-Insured Health Benefits (NIHB) Program, and Health Canada. It also includes observers from the Canadian Institute for Health Information (CIHI), Canada’s Drug Agency (CDA-AMC), the Ministère de la Santé et des Services sociaux du Québec (MSSS), and the pan-Canadian Pharmaceutical Alliance (pCPA).
The NPDUIS research initiative operates independently of the price review activities of the PMPRB and partly in partnership with CIHI. NPDUIS reports do not contain information that is confidential or privileged under sections 87 and 88 of the Act.
Reports
The PMPRB submitted reports in the form of two analytical studies, five research briefs/presentations, and two academic journal articles to the Minister of Health in 2024. These and past studies are publicly accessible on the PMPRB website.
Annual Publications and Report Series
- Meds Entry Watch, 8th Edition (May 2024)
- Meds Pipeline Monitor 2023 (November 2024)
Research Briefs and Presentations
- Analyzing Drug Shortages and Pricing: Lessons from Canada
- Competition in generic drug markets: international progress and room for improvement, 2010–2021
- Cost drivers for Canada’s public and private drug plans during the COVID-19 pandemic: a 2019–2022 comparative analysis
- Cost-effectiveness of the top 100 drugs by public spending in Canada, 2015–2021: a repeated cross-sectional study
- Do higher prices provide protection against drug shortages? Real-world evidence lessons from Canada
Journal Articles
- Cost-effectiveness of the top 100 drugs by public spending in Canada, 2015–2021: a repeated cross-sectional study. BMJ Open 2024, 14:e082568. DOI: 10.1136/bmjopen-2023-082568 (March 2024)
- Competition in International Generic Drug Markets. JAMA Health Forum. 2024;5(10):e243391. doi:10.1001 / jamahealthforum.2024.3391 (October 2024)