
CompassRx, 10th Edition
Annual Public Drug Plan Expenditure Report, 2022/23
ISSN: 2369-0518
Cat. No.: H79-6E-PDF
October 2025
PDF - 1.5 MB
Data companion file
Table of Contents
- Executive Summary
- Key Findings
- Introduction
- Methods
- Limitations
- 1. Trends in Prescription Drug Expenditures, 2017/18 to 2022/23
- 2. The Drivers of Drug Costs, 2021/22 to 2022/23
- 3. The Drivers of Dispensing Costs, 2021/22 to 2022/23
- References
- Appendix A: Distribution of Patients on Biosimilar Initiative Medicines by Jurisdiction, 2022/23
- Appendix B: Biosimilar Switching Initiatives by Canadian Public Payers
About CompassRx
CompassRx is an annual Patented Medicine Prices Review Board (PMPRB) publication that explores trends in prescription drug expenditures for both patented and non-patented medicines in Canadian public drug plans. It focuses on the pressures that contribute to the annual change in drug and dispensing costs, including the switch in use between lower- and higher-priced drugs and changes in the beneficiary population, drug prices, and the volume of drugs used, as well as other key factors.
About the PMPRB
The Patented Medicine Prices Review Board (PMPRB)'s mandate is to protect and inform Canadians by ensuring that the prices of patented medicines sold in Canada are not excessive and by reporting on trends in pharmaceutical pricing as well as research and development activities conducted by patentees. The PMPRB is an independent quasi-judicial body that is part of the Health portfolio, and operates at arm’s-length from the Minister of Health.
The NPDUIS Research Initiative
The National Prescription Drug Utilization Information System (NPDUIS) research initiative was established by federal, provincial, and territorial Ministers of Health in September 2001. It is a partnership between the PMPRB and the Canadian Institute for Health Information (CIHI).
Pursuant to section 90 of the Patent Act, the PMPRB has the mandate to conduct analysis that provides decision makers with critical information and intelligence on price, utilization, and cost trends so that Canada’s healthcare system has more comprehensive and accurate information on how medicines are being used and on sources of cost pressures.
The specific research priorities and methodologies for the NPDUIS research initiative are established with the guidance of the NPDUIS Advisory Committee and reflect the priorities of the participating jurisdictions. The Advisory Committee is composed of representatives from public drug plans in British Columbia, Alberta, Saskatchewan, Manitoba, Ontario, New Brunswick, Nova Scotia, Prince Edward Island, Newfoundland and Labrador, Yukon, the Non-Insured Health Benefits (NIHB) Program, and Health Canada. It also includes observers from CIHI, Canada’s Drug Agency (CDA-AMC), the Ministère de la Santé et des Services sociaux du Québec (MSSS), and the pan-Canadian Pharmaceutical Alliance (pCPA) Office.
Acknowledgements
This report was prepared by the Patented Medicine Prices Review Board (PMPRB) as part of the National Prescription Drug Utilization Information System (NPDUIS) research initiative.
The PMPRB wishes to acknowledge the members of the NPDUIS Advisory Committee for their expert oversight and guidance in the preparation of this report. Please note that the statements and findings for this report do not necessarily reflect those of the members or their organizations.
Appreciation goes to Yvonne Zhang for leading this project, and to Kevin Pothier and Dr. Étienne Gaudette for their oversight and contributions to the report. The PMPRB also wishes to acknowledge the technical assistance from Lokanadha Cheruvu and the editorial contributions of Shirin Paynter.
Disclaimer
The NPDUIS research initiative operates independently of the regulatory activities of the Board of the PMPRB. The research priorities, data, statements, and opinions expressed or reflected in NPDUIS reports do not represent the position of the PMPRB with respect to any regulatory matter. NPDUIS reports do not contain information that is confidential or privileged under sections 87 and 88 of the Patent Act, and the mention of a medicine in an NPDUIS report is not and should not be understood as an admission or denial that the medicine is subject to filings under sections 80, 81, or 82 of the Patent Act or that its price is or is not excessive under section 85 of the Patent Act.
Although based in part on data provided by the Canadian Institute for Health Information (CIHI), the statements, findings, conclusions, views, and opinions expressed in this report are exclusively those of the PMPRB and are not attributable to CIHI.
Contact Information
Patented Medicine Prices Review Board
Standard Life Centre
Box L40
333 Laurier Avenue West Suite 1400
Ottawa, ON K1P 1C1
Tel.: 1-877-861-2350
TTY 613-288-9654
Email: PMPRB.Information-Renseignements.CEPMB@pmprb-cepmb.gc.ca
Suggested Citation
Patented Medicine Prices Review Board. (2025). CompassRx, 10th edition: Annual Public Drug Plan Expenditure Report, 2022/23. Ottawa: PMPRB.
Executive Summary
Prescription drug expenditures for the NPDUIS public drug plans rose by 7.4% in 2022/23 to reach over $14.1 billion, a faster pace than the 1.7% annual growth in total health care spending in 2022Footnote I and the 4.9% annual change to the Consumer Price Index (CPI) in Health and Personal Care in 2022/23Footnote II, with varying rates of change in its two main components: drug costs (which saw an increase of 7.9%) and dispensing costs (which saw an increase of 4.5%). The overall growth in prescription drug expenditures was primarily driven by a sustained increase in the use of newer, costlier drugs, along with a notable post-pandemic rebound in the number of active beneficiaries.
The PMPRB’s CompassRx report monitors and analyzes the cost pressures driving changes in prescription drug expenditures for both patented and non-patented medicines in Canadian public drug plans. This tenth edition of CompassRx provides insight into the factors driving growth in drug and dispensing costs in 2022/23, as well as a retrospective review of recent trends in public drug plan costs and utilization.
The main data source for this report is the National Prescription Drug Utilization Information System (NPDUIS) Database at the Canadian Institute for Health Information (CIHI), which includes data for the following jurisdictions: British Columbia, Alberta, Saskatchewan, Manitoba, Ontario, New Brunswick, Nova Scotia, Prince Edward Island, Newfoundland and Labrador, and Yukon.
The findings from this report will inform policy discussions and aid decision makers in anticipating and responding to evolving cost pressures.
Key Findings
The key findings cover the three areas of analysis in CompassRx: the trends in prescription drug expenditures; the drivers of drug costs; and the drivers of dispensing costs.
Prescription drug expenditures
Prescription drug expenditure for the NPDUIS public drug plans grew by 7.4% in 2022/23, building on a 6.8% increase in 2021/22.
- Between 2017/18 and 2022/23, the total prescription drug expenditure for Canada’s public drug plans rose by $3.4 billion, for a compound annual growth rate of 5.9%.
- Drug costs, which represent 83% of prescription drug expenditures, grew by 7.9% from 2021/22 to 2022/23, while dispensing costs, which account for the remaining 17% of expenditures, grew by 4.5%.
- NPDUIS public drug plans paid an average of 88% of the total $14.1 billion in prescription costs for 300 million prescriptions in 2022/23.
- The overall NPDUIS public plan active beneficiary population increased by 7.4% from 2021/22 to 2022/23, reaching 6.6 million and achieving a full rebound from the COVID-19 pandemic.
Drug costs
Drug cost growth for the NPDUIS public plans in 2022/23 was primarily driven by a sustained increase in the use of higher-cost drugs, coupled with a post-pandemic rebound in active beneficiaries.
- The increased use of higher-cost drugs remained the most pronounced driver in 2022/23, pushing costs upward by 7.1%
- By 2022/23, medicines costing over $10,000 and $25,000 annually were used by less than 3% and 1% of beneficiaries yet accounted for over 37% and 20% of drug costs, respectively. Of 6.6 million active beneficiaries, the 7.6% with annual drug costs exceeding $5,000 accounted for 62.3% of total public plan drug costs.
- The 2022/23 increase in active beneficiary numbers resulted in a 5.8% demographic push (upward) effect, though a reduced number of claims per patient caused a 0.3% pull (downward) volume effect.
- The price change effect reduced drug costs by 1.2%, while the substitution effect lowered costs by 3.0%.
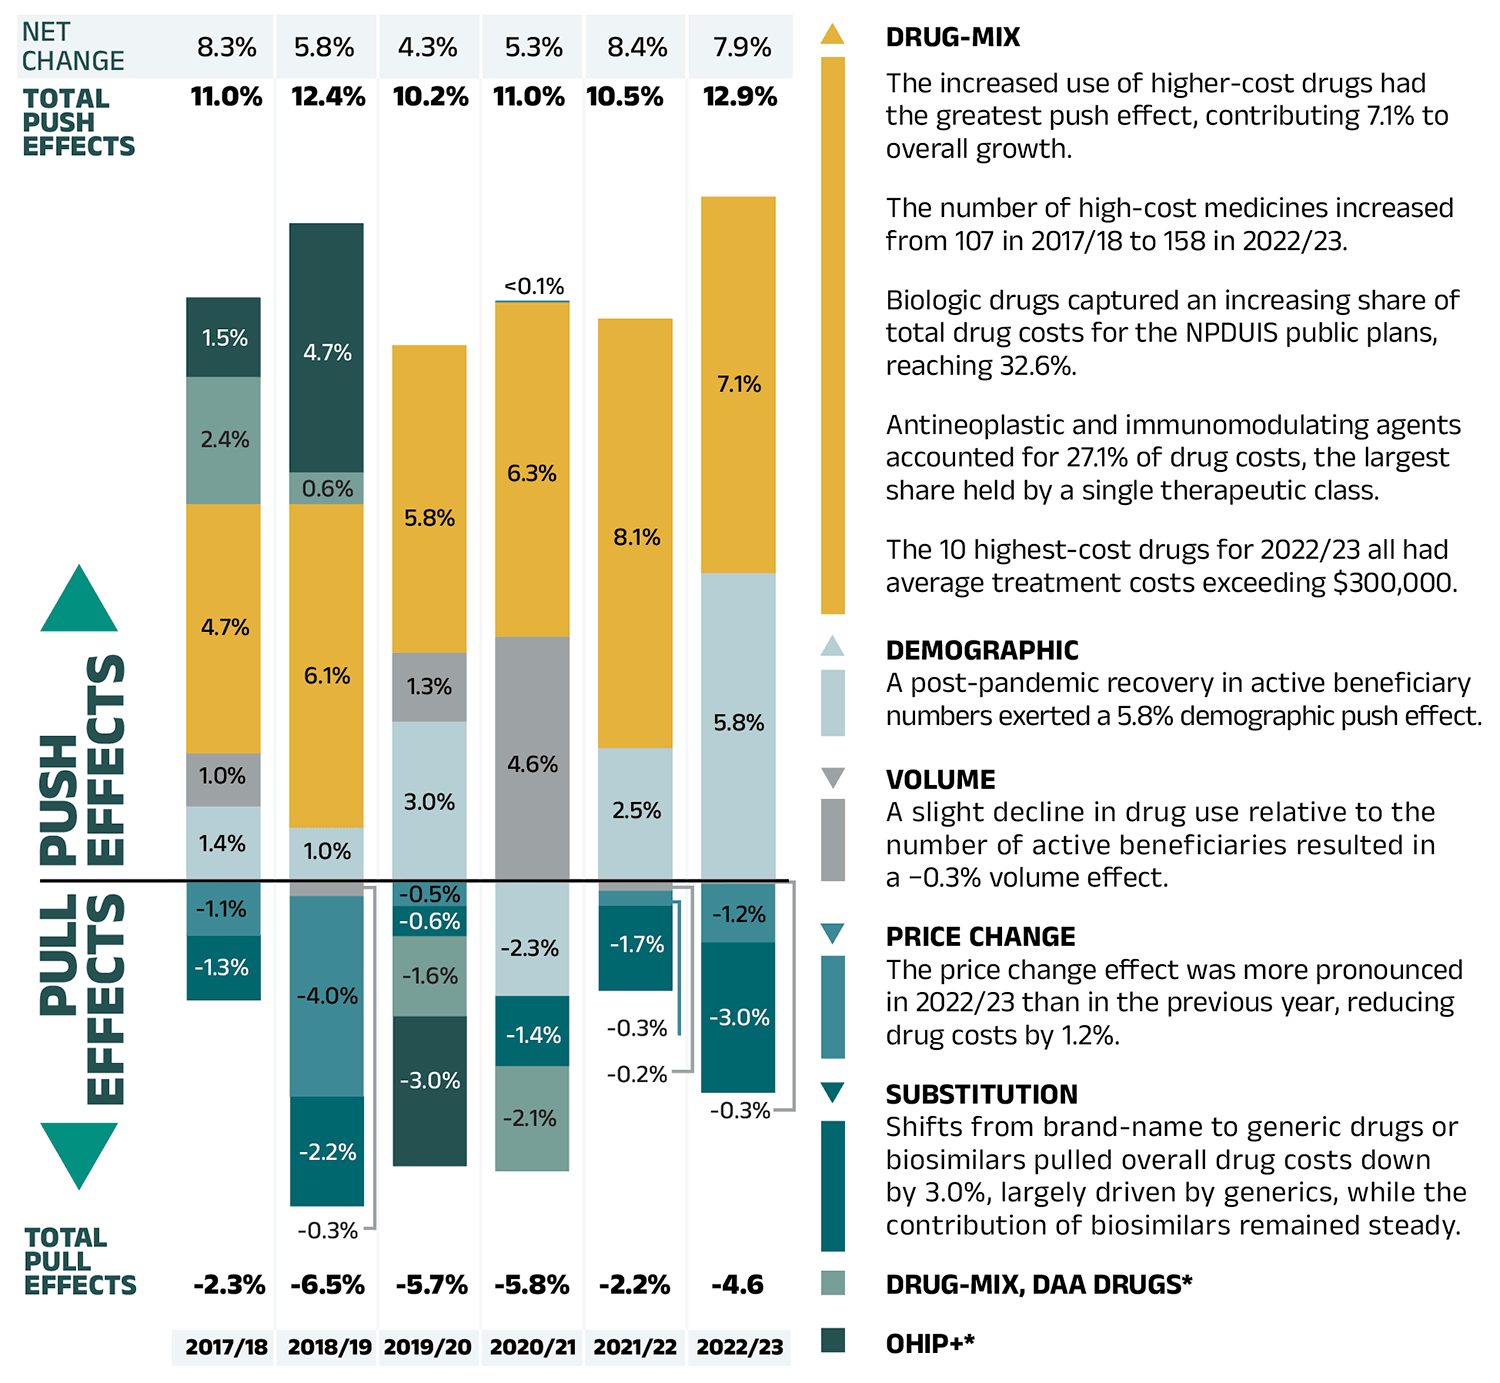
Figure – Text version
| 2017/18 | 2018/19 | 2019/20 | 2020/21 | 2021/22 | 2022/23 | |
|---|---|---|---|---|---|---|
| Drug-mix | 4.7% | 6.1% | 5.8% | 6.3% | 8.1% | 7.1% |
| Demographic | 1.4% | 1.0% | 3.0% | -2.3% | 2.5% | 5.8% |
| Volume | 1.0% | -0.3% | 1.3% | 4.6% | -0.2% | -0.3% |
| Price change | -1.1% | -4.0% | -0.5% | 0.04% | -0.3% | -1.2% |
| Substitution | -1.3% | -2.2% | -0.6% | -1.4% | -1.7% | -3.0% |
| Drug-mix, direct-acting antiviral (DAA) drugs* | 2.4% | 0.6% | -1.6% | -2.1% | - | - |
| OHIP+* | 1.5% | 4.7% | -3.0% | - | - | - |
| Total push effects | 11.0% | 12.4% | 10.2% | 11.0% | 10.5% | 12.9% |
| Total pull effects | -2.3% | -6.5% | -5.7% | -5.8% | -2.2% | -4.6% |
| Net change | 8.3% | 5.8% | 4.3% | 5.3% | 8.4% | 7.9% |
Drug-mix
- The increased use of higher-cost drugs had the greatest push effect, contributing 7.1% to overall growth.
- The number of high-cost medicines increased from 107 in 2017/18 to 158 in 2022/23.
- Biologic drugs captured an increasing share of total drug costs for the NPDUIS public plans, reaching 32.6%.
- Antineoplastic and immunomodulating agents accounted for 27.1% of drug costs, the largest share held by a single therapeutic class.
- The 10 highest-cost drugs for 2022/23 all had average treatment costs exceeding $300,000.
Demographic
- A post-pandemic recovery in active beneficiary numbers exerted a 5.8% demographic push effect.
Volume
- A slight decline in drug use relative to the number of active beneficiaries resulted in a −0.3% volume effect.
Price Change
- The price change effect was more pronounced in 2022/23 than in the previous year, reducing drug costs by 1.2%.
Substitution
- Shifts from brand-name to generic drugs or biosimilars pulled overall drug costs down by 3.0%, largely driven by generics, while the contribution of biosimilars remained steady.
Drug-mix, DAA Drugs*
OHIP+*
Note: This analysis is based on publicly available pricing information. It does not reflect confidential drug price discounts negotiated by the pan-Canadian Pharmaceutical Alliance on behalf of the public plans. Values may not add to totals due to rounding and the cross effect (see Section 2 for more detail).
* Not reported since 2020/21 (see Methods section of the previous edition).
Data source: National Prescription Drug Utilization Information System Database, Canadian Institute for Health Information.
Dispensing costs
The fees charged for the dispensing of prescriptions in the NPDUIS public plans increased by 4.5% in 2022/23, returning to the pre-pandemic growth trend
- The demographic effect, resulting from a significant post-pandemic rebound in the number of active beneficiaries, was the largest contributor to annual dispensing growth, pushing costs up by 5.1% in 2022/23.
- This increase was partially offset by a −2.2% pull-down effect due to the decrease in the quantity of drugs dispensed to patients.
- Additionally, higher average dispensing fees per prescription and a slightly smaller overall prescription size pushed costs upward by 1.0% and 0.5%, respectively.
Introduction
Canadian public drug plan expenditures represent a significant portion of the overall healthcare budget. The Canadian Institute for Health Information (CIHI) reported that the total cost of prescription drugs in Canada reached $42.1 billion in 2023, with the largest component financed by the public drug plans (42%Footnote III) and the remainder paid by private plans or out of pocket by households and individuals.Footnote 1
This edition of the report focuses on the 2022/23 fiscal year, with a retrospective look at recent trends. The results will aid stakeholders in anticipating and responding to the evolving cost pressures that affect Canada’s public drug plans.
The analysis focuses on the public drug plans participating in the National Prescription Drug Utilization Information System (NPDUIS) initiative, which includes all provincial public plans (with the exception of Quebec) and Yukon. These plans account for approximately one third (35%) of the total annual spending on prescription drugs in Canada.Footnote 1
Each public drug plan reimburses eligible beneficiaries according to its own specific plan design and implements policies related to the reimbursement of drug prices and dispensing fees. Summaries of the plan designs and policies are available on CIHI's website.Footnote 2
Methods
Data
The main data source for this report is the National Prescription Drug Utilization Information System (NPDUIS) Database, developed by the Canadian Institute for Health Information (CIHI). This database houses pan-Canadian information on public drug programs, including claims-level data collected from the plans that participate in the NPDUIS initiative. Data is reported on a fiscal year basis.
Results are presented for the following public drug plans: British Columbia, Alberta, Saskatchewan, Manitoba, Ontario, New Brunswick, Nova Scotia, Prince Edward Island, Newfoundland and Labrador, and Yukon. The Non-Insured Health Benefits (NIHB) Program, which was included in previous editions up to 2020/2021, has been excluded from this edition in accordance with current standards for data use and disclosure. Historical results have been revised accordingly, except for the drug cost and dispensing cost drivers, where the exclusion of NIHB data would not have materially affected the relative contributions of the cost drivers. As a result, some historical figures in this report may differ slightly from those published in earlier editions of CompassRx.
The analysis focuses exclusively on data for beneficiaries that met their deductible and received public reimbursement. Results reported for Saskatchewan and Manitoba include the accepted prescription drug expenditures for individuals who are eligible for coverage but have not submitted an application and, therefore, do not have a defined deductible. iv Specific examples include, but are not limited to: British Columbia (Plan Z – Assurance); New Brunswick (Pharmacy Administered Publicly Funded Vaccines and Testing Program); Newfoundland and Labrador (Provincial/Pandemic Plan).
For 2022/23, active beneficiaries who received public reimbursement solely due to the use of COVID-19 Rapid Antigen Tests and/or prescriptions of nirmatrelvir/ ritonavir (Paxlovid) under NPDUIS public drug plan coverage were excluded from the analysis. The inclusion of such beneficiaries, who may not typically qualify for public drug plan reimbursement for regular medicine use, could artificially inflate active beneficiary counts and utilization metrics, particularly in provinces with specific pandemic or immunization sub-programsFootnote IV, without a meaningful impact on drug or dispensing costs. This adjustment was applied universally across jurisdictions to ensure consistency in reporting. Future editions of the CompassRx report will continue to monitor and refine inclusion criteria as needed in response to evolving public health challenges.
Long-term care (LTC) sub-plans may not have a typical dispensing frequency due to the more specialized needs of their patients. The LTC sub-plan prescriptions were only separated out from the dispensing costs analysis in Ontario due to a notable influence from their size.
Analyses
The report is organized into three main sections. Section 1 presents the overall trends in prescription drug expenditures, with a focus on annual rates of change in drug expenditure, including demographic considerations. Sections 2 and 3 provide detailed insights into the factors driving these expenditures.
The components that make up prescription drug expenditures can be expressed from two perspectives: cost-sharing and pharmaceutical.
From a cost-sharing perspective, the expenditures reported in this report represent the total amount accepted for reimbursement by the NPDUIS public drug plans. These amounts reflect both the plan-paid and beneficiary-paid portions of the prescription costs, such as co-payments and deductibles.
From a pharmaceutical pricing perspective, the cost of a prescription drug plan is measured by the total of two components: the cost of the prescription drugs (including associated markups) and the cost of dispensing the prescription drugs. This perspective is represented by this formula:
Prescription Drug Expenditures = Drug Costs + Dispensing Costs
Section 2, “The Drivers of Drug Costs” and Section 3, “The Drivers of Dispensing Costs” detail each component of this formula by analyzing data trends and adding greater context in the form of Brief Insights.
This edition of the CompassRx report extends beneficiary demographic breakdowns by age (seniors and non-seniors) and sex. These analyses provide a more detailed view of age and sex compositions among active beneficiaries, capturing differences in prescription costs across demographic groups and jurisdictions. This provides further context on how demographic factors interact with policy approaches, plan design, and eligibility, contributing to jurisdictional differences in public drug plan spending.
The analysis of drug and dispensing cost drivers follows the methodological approach detailed in the PMPRB’s The Drivers of Prescription Drug Expenditures: A Methodological Report.Footnote 3 Drug costs include any associated markups. Analyses of the average prescription size, as well as pricing, are limited to oral solids to avoid data reporting inconsistencies that may exist in the days’ supply and unit reporting of other formulations. Anatomical Therapeutic Chemical (ATC) levels reported here are based on CIHI NPDUIS data and reflect the ATC classification system maintained by the World Health Organization Collaborating Centre for Drug Statistics Methodology. Vaccines and pharmaceutical services are not represented in this report.
Starting with this edition, newly approved medicines in Canada and their clinical and health economic assessments (previously shown in appendix) have been removed from the analysis. These will be documented in the NPDUIS research initiative’s Meds Entry Watch report.
Complementary data tables pertaining to public drug expenditure in Canada are available in a Data companion file accessible on the Canada.ca website.
A glossary of terms for NPDUIS studies is also available on the Canada.ca website.
Limitations
The drug spending figures in this report correspond to prescription-level costs and do not include broader program operational expenses, such as administrative and human resources costs. Drug expenditure and utilization levels vary widely among the jurisdictions and cross comparisons of the results are limited by differences in the plan designs and policies of the individual public drug plans, as well as the demographic and disease profiles of the beneficiary populations. For example, public drug plans in British Columbia, Saskatchewan, and Manitoba provide universal incomebased coverage, while other provincial public drug plans offer specific programs for seniors, income assistance recipients, and other select patient groups.
The NPDUIS Database includes available sub-plan data specific to particular jurisdictions, such as Alberta, Nova Scotia, and Prince Edward Island. This further limits the comparability of results across plans. A comprehensive summary of the sub-plans available in the database, along with their eligibility criteria, is available on CIHI's website.Footnote 2
High-cost medicines are defined as having an annual treatment cost greater than $10,000. If medicines reach this threshold in any given year, they are included in the count for all other years. Thus, the number and composition of high-cost medicines may vary depending on the time of analysis.
The number of oncology medicines and other high-cost medicines covered by public plans may be underestimated, as some are reimbursed through specialized programs, such as cancer care, that are not captured in the data.
The reported drug costs are the amounts accepted toward reimbursement by the public plans, which do not reflect price rebates or price reductions resulting from confidential product listing agreements.
1. Trends in Prescription Drug Expenditures, 2017/18 to 2022/23
Prescription drug expenditures for public plans rose by 7.4% in 2022/23. This marked a full return to the highest rate of change last seen in 2017/18. The growth was primarily driven by the increase of newer and higher-cost drugs and a notable post-pandemic rebound in the number of active beneficiaries.
Prescription Drug Expenditures
Prescription Drug Expenditures = Drug Costs (83%) + Dispensing Costs (17%)
Between 2017/18 and 2022/23, annual prescription drug expenditures for the public drug plans grew at a compound annual growth rate of 5.9%, rising from $10.8 billion to $14.1 billion, with nearly $1 billion of this growth seen over the last year (Figure 1.1).
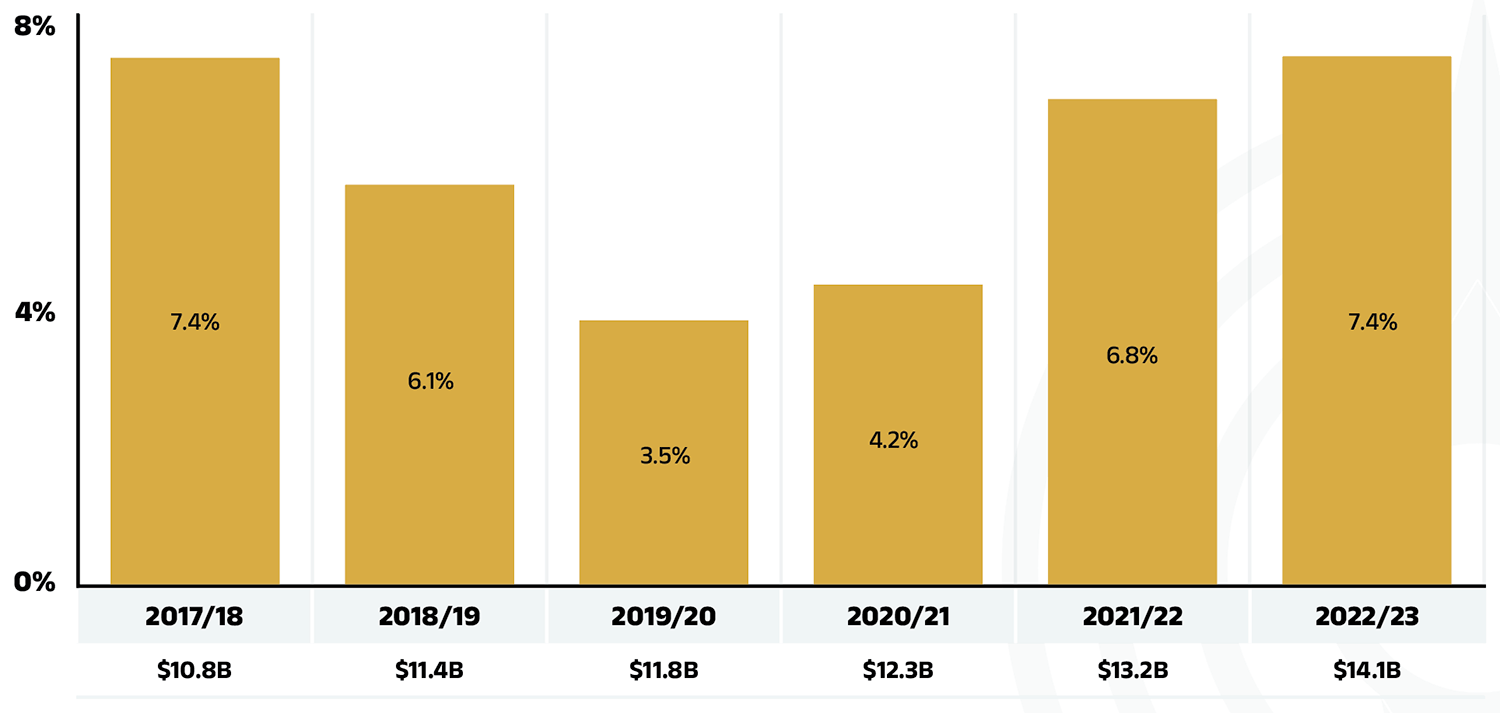
Figure 1.1 – Text version
| 2017/18 | 2018/19 | 2019/20 | 2020/21 | 2021/22 | 2022/23 | |
|---|---|---|---|---|---|---|
| Rate of change | 7.4% | 6.1% | 3.5% | 4.2% | 6.8% | 7.4% |
| Prescription drug expenditure (billions of dollars) | $10.8B | $11.4B | $11.8B | $12.3B | $13.2B | $14.1B |
Data source: National Prescription Drug Utilization Information System Database, Canadian Institute for Health Information.
The overall 7.4% growth in expenditures in 2022/23 consists of a 7.9% growth in drug costs (with associated markups) and a 4.5% increase in dispensing costs. Due to the difference in their rates of growth, the drug cost component grew as a share of overall expenditures, reaching 83.1%, while the dispensing costs share dropped to 16.9% (Figure 1.2), a shift from 2021/22 proportions as reported in the previous edition.
These amounts reflect both the plan-paid portions of prescription costs and beneficiary-paid portions, such as co-payments and deductibles.
Beneficiary Share of Prescription Drug Expenditures
Prescription Drug Expenditures = Plan-paid (88%) + Beneficiary-paid (12%)
In 2022/23, in line with historical trends, public plans paid an average of 88% (Figure 1.2) of the total expenditures for prescription drugs that were eligible for reimbursement, with the remainder paid by the beneficiaries either out of pocket or through a third-party private insurer. The beneficiary-paid share varied across jurisdictions, ranging from 8% (New Brunswick) to 34% (Prince Edward Island).
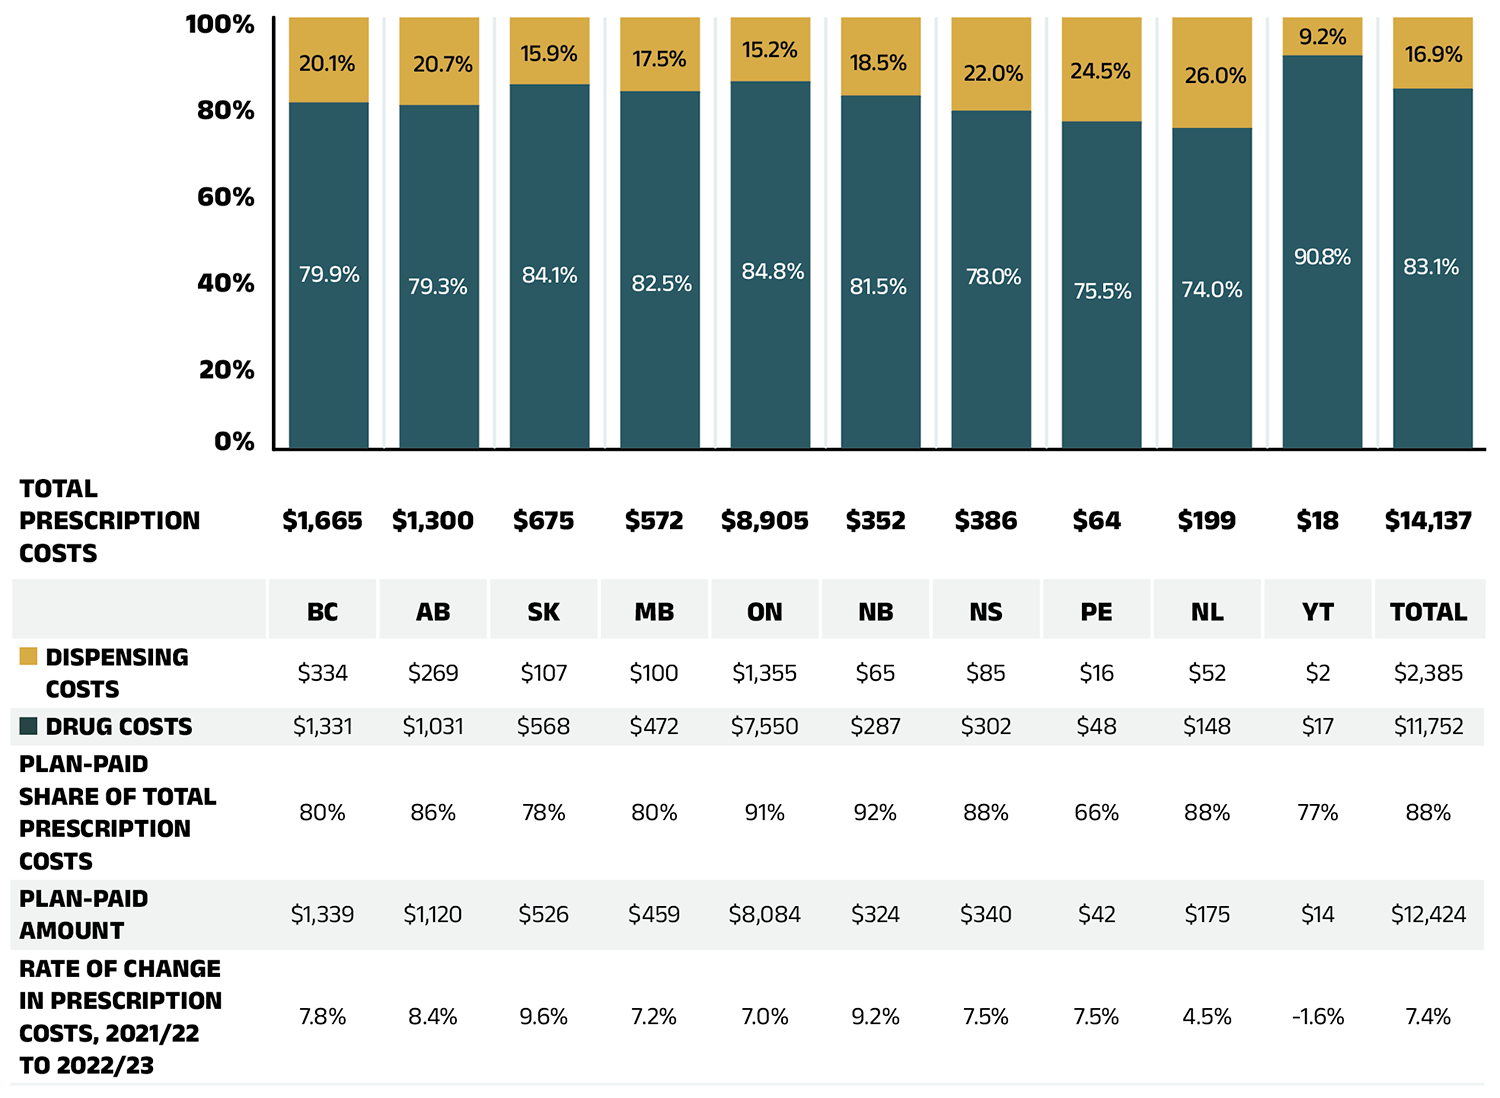
Figure 1.2 – Text version
| British Columbia | Alberta | Saskatchewan | Manitoba | Ontario | New Brunswick | Nova Scotia | Prince Edward Island | Newfoundland and Labrador | Yukon | Total | |
|---|---|---|---|---|---|---|---|---|---|---|---|
| Total prescription costs (millions of dollars) | $1,665 | $1,300 | $675 | $572 | $8,905 | $352 | $386 | $64 | $199 | $18 | $14,137 |
| Dispensing cost share of total prescription costs | 20.1% | 20.7% | 15.9% | 17.5% | 15.2% | 18.5% | 22.0% | 24.5% | 26.0% | 9.2% | 16.9% |
| Drug cost share of total prescription costs | 79.9% | 79.3% | 84.1% | 82.5% | 84.8% | 81.5% | 78.0% | 75.5% | 74.0% | 90.8% | 83.1% |
| Dispensing costs (millions of dollars) | $334 | $269 | $107 | $100 | $1,355 | $65 | $85 | $16 | $52 | $2 | $2,385 |
| Drug costs (millions of dollars) | $1,331 | $1,031 | $568 | $472 | $7,550 | $287 | $302 | $48 | $148 | $17 | $11,752 |
| Plan-paid share of total prescription costs | 80% | 86% | 78% | 80% | 91% | 92% | 88% | 66% | 88% | 77% | 88% |
| Plan-paid amount (millions of dollars) | $1,339 | $1,120 | $526 | $459 | $8,084 | $324 | $340 | $42 | $175 | $14 | $12,424 |
| Rate of change in prescription costs, 2021/22 to 2022/23 | 7.8% | 8.4% | 9.6% | 7.2% | 7.0% | 9.2% | 7.5% | 7.5% | 4.5% | -1.6% | 7.4% |
Note: Markup amounts are captured in the drug costs. Values may not add to totals due to rounding.
Data source: National Prescription Drug Utilization Information System Database, Canadian Institute for Health Information.
The annual growth in prescription expenditures is a function of increases in the number of active beneficiaries and their drug costs. Over the past three years, as noted in previous editions of this report, the COVID-19 pandemic caused significant fluctuations in the overall NPDUIS public plan beneficiary population. In 2020/21, there was an unprecedented decline of 366,000 active beneficiaries, reducing the total to below 6.0 million. This was followed by a partial rebound of 214,000 active beneficiaries in 2021/22, bringing the total to 6.2 million. By 2022/23, the numbers continued to recover, with a notable increase of 460,000, surpassing pre-pandemic levels and reaching 6.6 million.
In 2022/23, active beneficiaries filled 300 million prescriptions that were accepted towards a deductible or paid for (in full or in part) by the NPDUIS public drug plans. Beneficiaries aged 65 and over made up 61% of active beneficiaries, while beneficiaries aged less than 65 represented 39%. Among both age groups, more females made claims than males, comprising of 55% of active beneficiaries, compared to 45% for males. However, these proportions varied significantly across jurisdictions due to differences in plan design, eligibility, and demographics (Figure 1.3a).
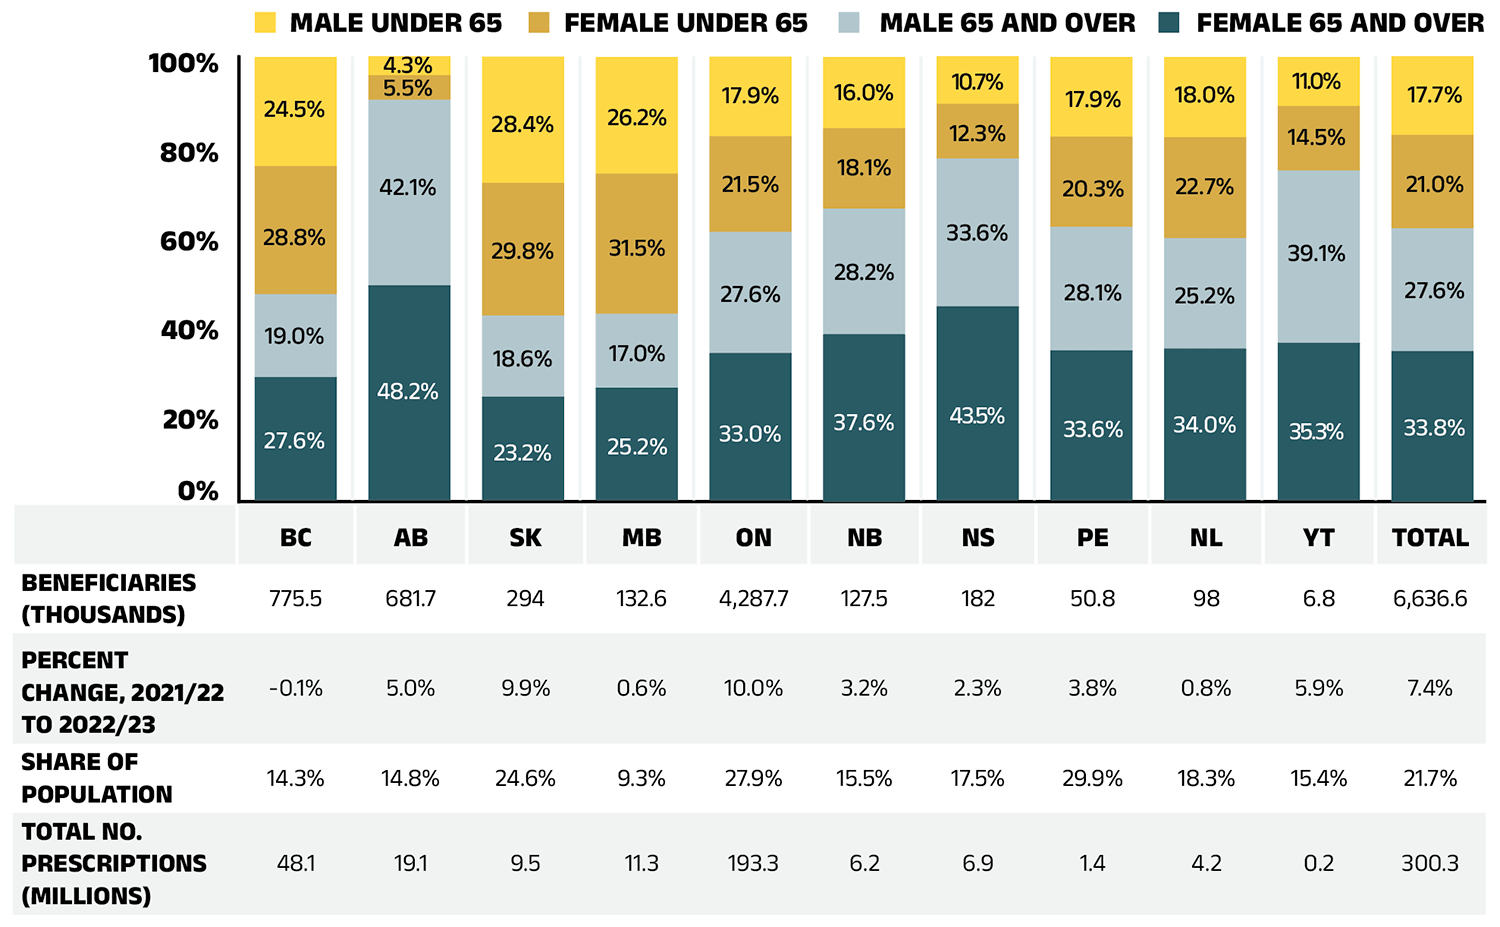
Figure 1.3a – Text version
| British Columbia | Alberta | Saskatchewan | Manitoba | Ontario | New Brunswick | Nova Scotia | Prince Edward Island | Newfoundland and Labrador | Yukon | Total | |
|---|---|---|---|---|---|---|---|---|---|---|---|
| Female 65 and over | 27.6% | 48.2% | 23.2% | 25.2% | 33.0% | 37.6% | 43.5% | 33.6% | 34.0% | 35.3% | 33.8% |
| Male 65 and over | 19.0% | 42.1% | 18.6% | 17.0% | 27.6% | 28.2% | 33.6% | 28.1% | 25.2% | 39.1% | 27.6% |
| Female under 65 | 28.8% | 5.5% | 29.8% | 31.5% | 21.5% | 18.1% | 12.3% | 20.3% | 22.7% | 14.5% | 21.0% |
| Male under 65 | 24.5% | 4.3% | 28.4% | 26.2% | 17.9% | 16.0% | 10.7% | 17.9% | 18.0% | 11.0% | 17.7% |
| Beneficiaries (thousands) | 775.5 | 681.7 | 294 | 132.6 | 4,287.7 | 127.5 | 182 | 50.8 | 98 | 6.8 | 6,636.6 |
| Percent change, 2021/22 to 2022/23 | -0.1% | 5.0% | 9.9% | 0.6% | 10.0% | 3.2% | 2.3% | 3.8% | 0.8% | 5.9% | 7.4% |
| Share of population | 14.3% | 14.8% | 24.6% | 9.3% | 27.9% | 15.5% | 17.5% | 29.9% | 18.3% | 15.4% | 21.7% |
| Total number of prescriptions (millions) | 48.1 | 19.1 | 9.5 | 11.3 | 193.3 | 6.2 | 6.9 | 1.4 | 4.2 | 0.2 | 300.3 |
Data source: National Prescription Drug Utilization Information System Database, Canadian Institute for Health Information; Statistics Canada, Table: 17-10-0009-01 Population estimates, quarterly.
Beneficiary demographics play a significant role in shaping prescription expenditure trends. New to this edition, Figure 1.3b presents a breakdown of average annual prescription costs per active beneficiary by demographic category across jurisdictions.
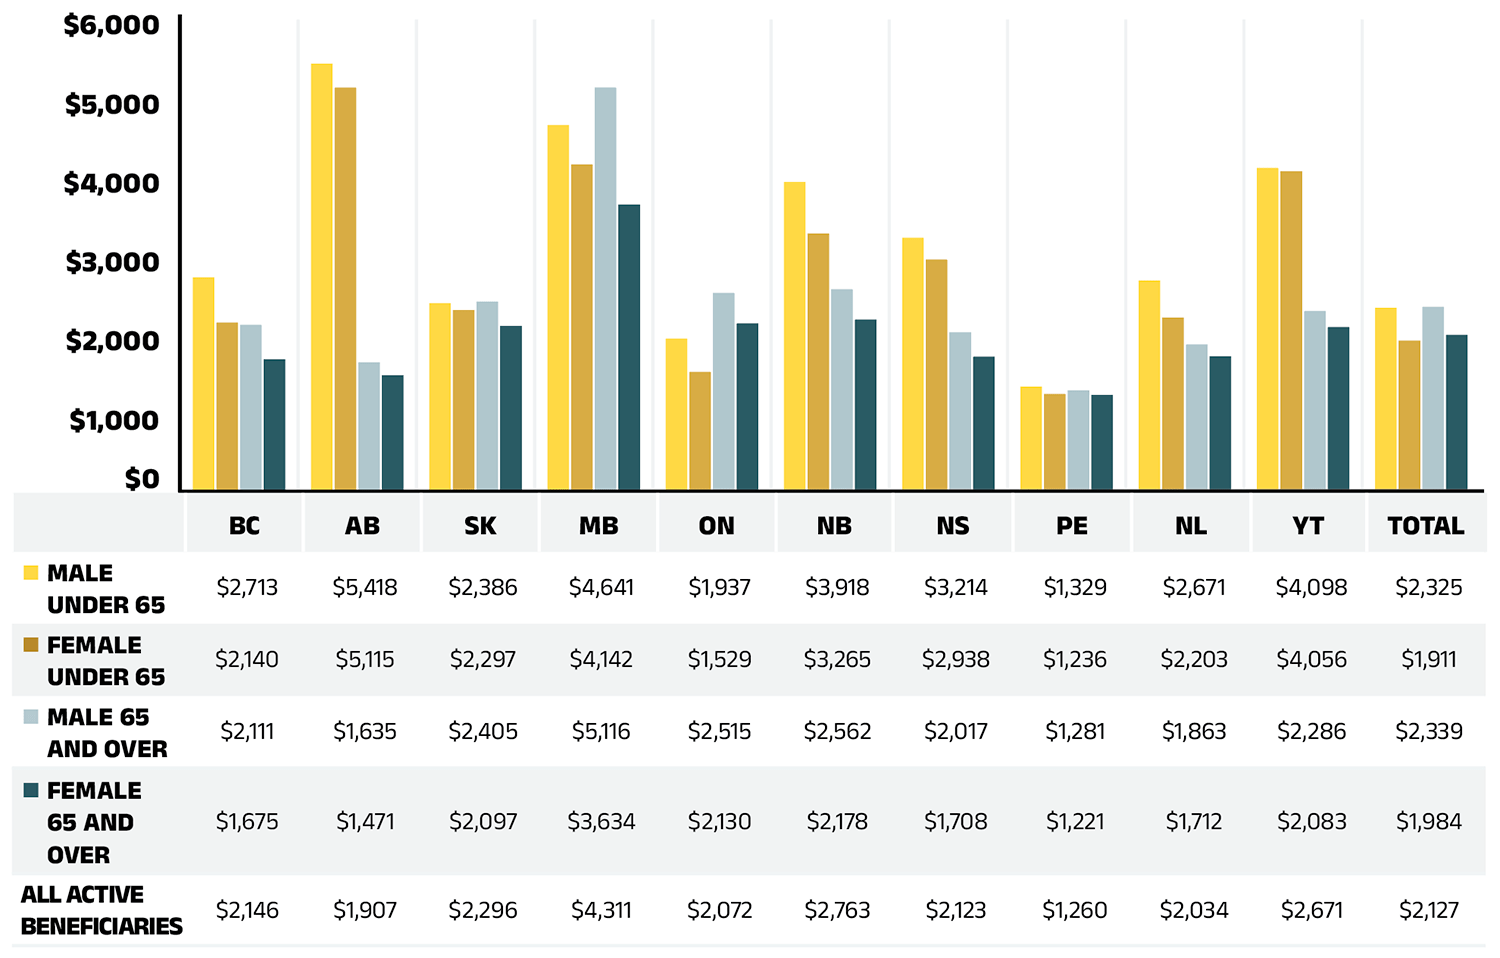
Figure 1.3b – Text version
| Male under 65 | Female under 65 | Male 65 and over | Female 65 and over | All active beneficiaries | |
|---|---|---|---|---|---|
| British Columbia | $2,713 | $2,140 | $2,111 | $1,675 | $2,146 |
| Alberta | $5,418 | $5,115 | $1,635 | $1,471 | $1,907 |
| Saskatchewan | $2,386 | $2,297 | $2,405 | $2,097 | $2,296 |
| Manitoba | $4,641 | $4,142 | $5,116 | $3,634 | $4,311 |
| Ontario | $1,937 | $1,529 | $2,515 | $2,130 | $2,072 |
| New Brunswick | $3,918 | $3,265 | $2,562 | $2,178 | $2,763 |
| Nova Scotia | $3,214 | $2,938 | $2,017 | $1,708 | $2,123 |
| Prince Edward Island | $1,329 | $1,236 | $1,281 | $1,221 | $1,260 |
| Newfoundland and Labrador | $2,671 | $2,203 | $1,863 | $1,712 | $2,034 |
| Yukon | $4,098 | $4,056 | $2,286 | $2,083 | $2,671 |
| Total | $2,325 | $1,911 | $2,339 | $1,984 | $2,127 |
Data source: National Prescription Drug Utilization Information System Database, Canadian Institute for Health Information.
In 2022/23, the average annual prescription cost per active beneficiary in NPDUIS public drug plans was $2,127. Despite representing a slightly smaller share of active beneficiaries, males generally incurred higher treatment costs than females. Non-seniors, who accounted for significantly fewer active beneficiaries, had higher annual prescription costs than seniors in most jurisdictions, except Ontario. In Ontario, the relatively lower average drug costs for non-seniors may be attributed to the OHIP+ program, which covers a broader and generally healthier youth population (under age 25 without private insurance) than other public plans. In 2022/23, these beneficiaries accounted for approximately 20% of Ontario’s public drug plan active beneficiaries.
The higher annual prescription costs for non-seniors compared to seniors may reflect public plans’ design and eligibility criteria. Non-seniors in public drug plans often represent a subgroup of sicker individuals requiring highercost treatments, while seniors include a broader population, many of whom require lower-cost, routine medications. Additionally, factors such as health-seeking behavior and treatment adherence may contribute to the higher proportion but lower costs of female active beneficiaries.
Brief Insights: Drug Plan Designs
The expenditure and utilization levels reported in this report depend on the specific plan design and policies of each jurisdiction, as well as the demographic and disease profiles of the beneficiary population. This affects the comparability of results across plans.
Supplementary reference documents providing information on individual public drug plan designs, policies governing markups and dispensing fees are available on CIHI’s website.Footnote 2
Significant variations in average annual prescription costs per active beneficiary were observed across jurisdictions, ranging from $1,221 for senior females in Prince Edward Island to $5,418 for non-senior males in Alberta. When considering overall demographic composition, Manitoba had the highest average annual treatment costs at $4,311.
These variations reflect differences in policy approaches, such as universal versus population-defined drug coverage, as well as the unique mix of public and private plans in each province. These factors result in distinct demographic and expenditure trends across jurisdictions.
For insights into corresponding demographic trends in private drug plans, including age-sex compositions by province, refer to the latest edition of the Private Drug Plans in Canada: Expenditure Report, 2018–2023.
Drug Costs of Prescription Drug Expenditures
Prescription Drug Expenditures = Drug Costs (83%) + Dispensing Costs (17%)
Drug costs, including average reported markups of about 5%Footnote V, represent the largest component of prescription drug expenditures and have the greatest influence on overall trends. Following an increase of 8.4% in 2021/22, drug costs grew by 7.9% in 2022/23. The average rate of change over the last three years was 7.2% across the public plans.
Figure 1.4 reports the annual rate of change in drug costs for each NPDUIS drug plan from 2020/21 to 2022/23. In 2022/23, drug costs increased considerably in all plans except Yukon, though the positive rates of change varied across jurisdictions, ranging from 5.4% in Newfoundland and Labrador to 11.4% in New Brunswick. Drug costs in Yukon declined by 2.8%.
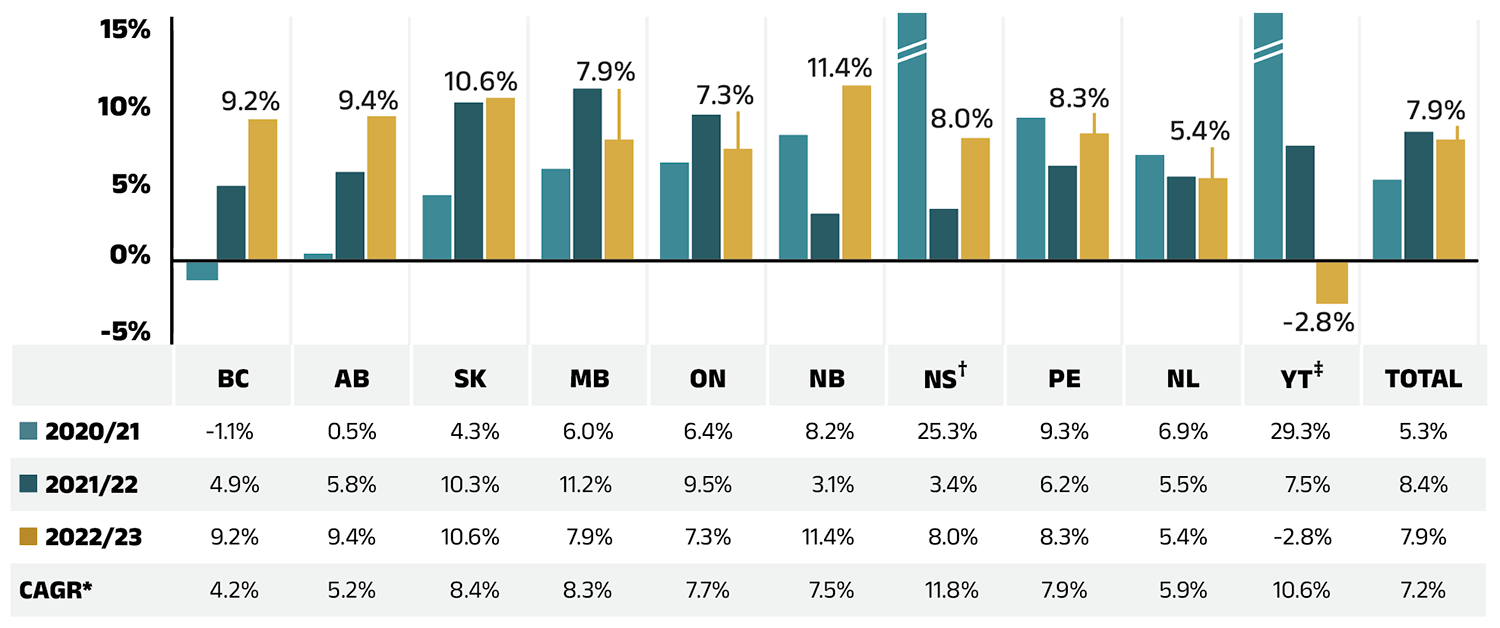
Figure 1.4 – Text version
| British Columbia | Alberta | Saskatchewan | Manitoba | Ontario | New Brunswick | Nova Scotia | Prince Edward Island | Newfoundland and Labrador | Yukon | Total | |
|---|---|---|---|---|---|---|---|---|---|---|---|
| 2020/21 | -1.1% | 0.5% | 4.3% | 6.0% | 6.4% | 8.2% | 25.3% | 9.3% | 6.9% | 29.3% | 5.3% |
| 2021/22 | 4.9% | 5.8% | 10.3% | 11.2% | 9.5% | 3.1% | 3.4% | 6.2% | 5.5% | 7.5% | 8.4% |
| 2022/23 | 9.2% | 9.4% | 10.6% | 7.9% | 7.3% | 11.4% | 8.0% | 8.3% | 5.4% | -2.8% | 7.9% |
| Compound annual growth rate | 4.2% | 5.2% | 8.4% | 8.3% | 7.7% | 7.5% | 11.8% | 7.9% | 5.9% | 10.6% | 7.2% |
* Compound annual growth rate.
† In Nova Scotia, Community Services Pharmacare Benefits (Plan F) data was not previously submitted to the CIHI NPDUIS database but has been submitted since 2020/21. This addition resulted in a large, one-time increase in the beneficiary population and their drug use in 2020/21.
‡ In small jurisdictions, significant annual fluctuations in rates of growth can be expected.
Data source: National Prescription Drug Utilization Information System Database, Canadian Institute for Health Information.
Figure 1.5 presents the share of drug costs by market segment in 2022/23 (pie chart) and breaks down the annual rate of change in drug costs from 2021/22 to 2022/23 for each segment (table). These results provide a snapshot of how the distribution of sales across market segments has shifted over the last year. As the market status of a medicine is dynamic, the medicines contributing to any one segment may differ from year to year.
Patented medicines represent the largest segment of the market, capturing 49.0% of public plan drug costs in 2022/23. Since 2022/23, several high selling patented medicines in Canada have shifted from the patented market segment to either the single-source or multisource non-patented segments. Notably, anti-TNF-α drugs golimumab (Simponi) and certolizumab pegol (Cimzia), which collectively accounted for $133 million (1.1%) of annual drug costs among public plans in 2022/23, have exited the patented segment during that year.Footnote VI Despite these shifts, the patented market segment grew by 1.1%.
In 2022/23, the single-source non-patented market grew significantly (32.8%) as a small number of commonlyused medicines changed patent status. In addition to the impact of two anti-TNF-α drugs, a drug for obstructive airway diseases, namely fluticasone furoate/ vilanterol (Breo Ellipta), also moved from the non-biologic patented market to the single-source non-patented market over the course of 2022/23. These were the top medicines in the segment in 2022/23 (see Table 4 in Data companion file). Of note, the marked cost increase in this market segment followed a 57.9% surge in 2021/22, documented in the previous edition of this report.
Costs for multi-source non-patented medicines, which include generics and their reference brand-name drugs as well as biosimilars and their originator biologics, increased by 9.3% in 2022/23, now accounting for 30.7% of drug costs. This segment can be broken down into two distinct sub-segments: multi-source generic medicines made up 17.7% ($2,076 million) of drug costs in 2022/23 and grew by 9.5%, while the remaining medicines, consisting of off-patent reference brandname drugs, biologics and biosimilars, grew at a rate of 9.1% to reach 13.0% ($1,535 million) of drug costs. Multi-source non-patented biologics and biosimilars have been an increasingly important group of medicines in recent years.
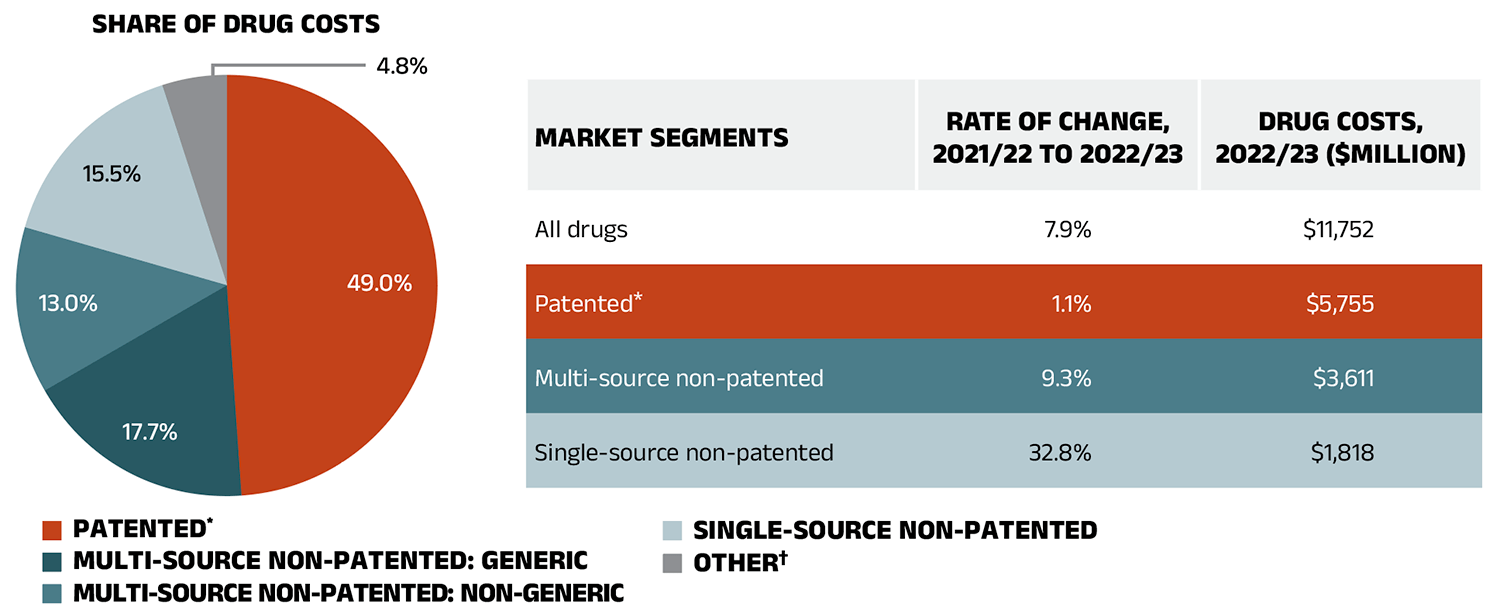
Figure 1.5 – Text version
Pie chart: Share of drug costs
| Patented | 49.0% |
|---|---|
| Multi-source non-patented: generic | 17.7% |
| Multi-source non-patented: non-generic | 13.0% |
| Single-source non-patented | 15.5% |
| Other† | 4.8% |
Table: Market segments
| Market Segment | Rate of change, 2021/22 to 2022/23 | Drug costs, 2022/23 (millions of dollars) |
|---|---|---|
| All drugs | 7.9% | $11,752 |
| Patented | 1.1% | $5,755 |
| Multi-source non-patented | 9.3% | $3,611 |
| Single-source non-patented | 32.8% | $1,818 |
Note: A glossary of terms with information on each of the market segments is available on the Canada.ca website.
* The patented medicines market segment includes all medicines that had patent protection in the period of analysis, whether or not the patent expired during that period. As such, the rate of growth does not reflect the loss of patent exclusivity for medicines over the course of the fiscal year.
† This market segment includes devices, compounded drugs, and other products that are reimbursed by public drug plans but do not have a Health Canada assigned Drug Identification Number (DIN).
Data source: National Prescription Drug Utilization Information System Database, Canadian Institute for Health Information.
Dispensing Costs of Prescription Drug Expenditures
Prescription Drug Expenditures = Drug Costs (83%) + Dispensing Costs (17%)
Dispensing costs make up an important part of prescription drug expenditures. They are the amount submitted by pharmacies and accepted towards reimbursement by a public plan, representing the fees charged for the dispensing of prescriptions. Overall, dispensing costs in the NPDUIS public plans grew at a rate of 4.5% in 2022/23, recovering from stagnation and minimal growth during the previous two pandemic years (2020/21 and 2021/22), contributing to a compound annual growth rate of 1.4% over the last three years. Figure 1.6 reports the annual rate of change in dispensing costs for each NPDUIS drug plan from 2020/21 to 2022/23. Jurisdictional variations may be due to changes in dispensing fee policies and plan designs, as well as changes in the number of prescriptions and their size, among other factors.
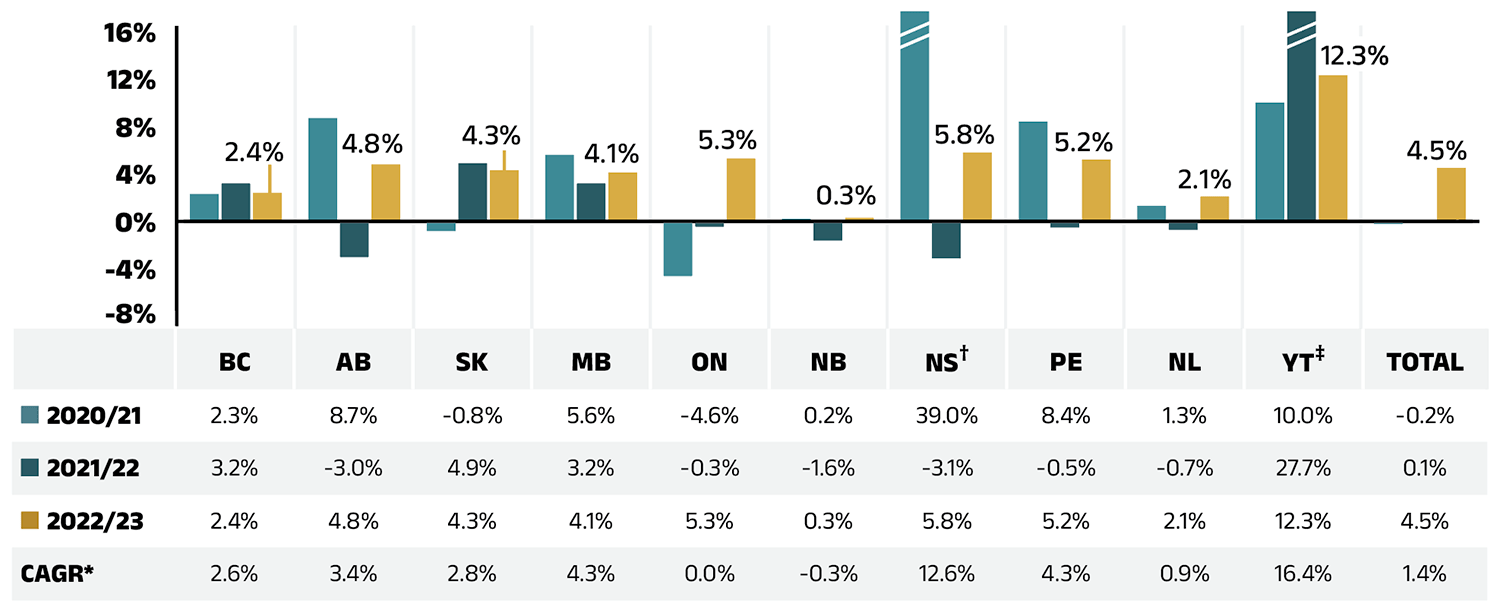
Figure 1.6 – Text version
| British Columbia | Alberta | Saskatchewan | Manitoba | Ontario | New Brunswick | Nova Scotia† | Prince Edward Island | Newfoundland and Labrador | Yukon‡ | Total | |
|---|---|---|---|---|---|---|---|---|---|---|---|
| 2020/21 | 2.3% | 8.7% | -0.8% | 5.6% | -4.6% | 0.2% | 39.0% | 8.4% | 1.3% | 10.0% | -0.2% |
| 2021/22 | 3.2% | -3.0% | 4.9% | 3.2% | -0.3% | -1.6% | -3.1% | -0.5% | -0.7% | 27.7% | 0.1% |
| 2022/23 | 2.4% | 4.8% | 4.3% | 4.1% | 5.3% | 0.3% | 5.8% | 5.2% | 2.1% | 12.3% | 4.5% |
| Compound annual growth rate | 2.6% | 3.4% | 2.8% | 4.3% | 0.0% | -0.3% | 12.6% | 4.3% | 0.9% | 16.4% | 1.4% |
* Compound annual growth rate.
† In Nova Scotia, Community Services Pharmacare Benefits (Plan F) data was not previously submitted to the CIHI NPDUIS database but has been submitted since 2020/21. This addition resulted in a large, one-time increase in the beneficiary population and their drug use in 2020/21.
‡ In small jurisdictions, significant annual fluctuations in rates of growth can be expected.
Data source: National Prescription Drug Utilization Information System Database, Canadian Institute for Health Information.
Brief Insights: Dispensing Fees and Policies
The temporary changes to policies on dispensing frequency implemented during the COVID-19 pandemic were lifted in 2020/21. The impact of these changes is reflected in Section 3, “The Drivers of Dispensing Costs”.
A summary of dispensing fee policies for each of the public drug plans is available on CIHI’s website.Footnote 2
Compared to drug costs, dispensing costs have grown at slower and at times negative rates over the last three years. Their share of overall prescription drug expenditures has steadily declined, from 18.5% in 2020/21 to 16.9% in 2022/23.
Figure 1.7 shows the trend in the dispensing cost share of total prescription expenditures for each NPDUIS drug plan from 2020/21 to 2022/23.
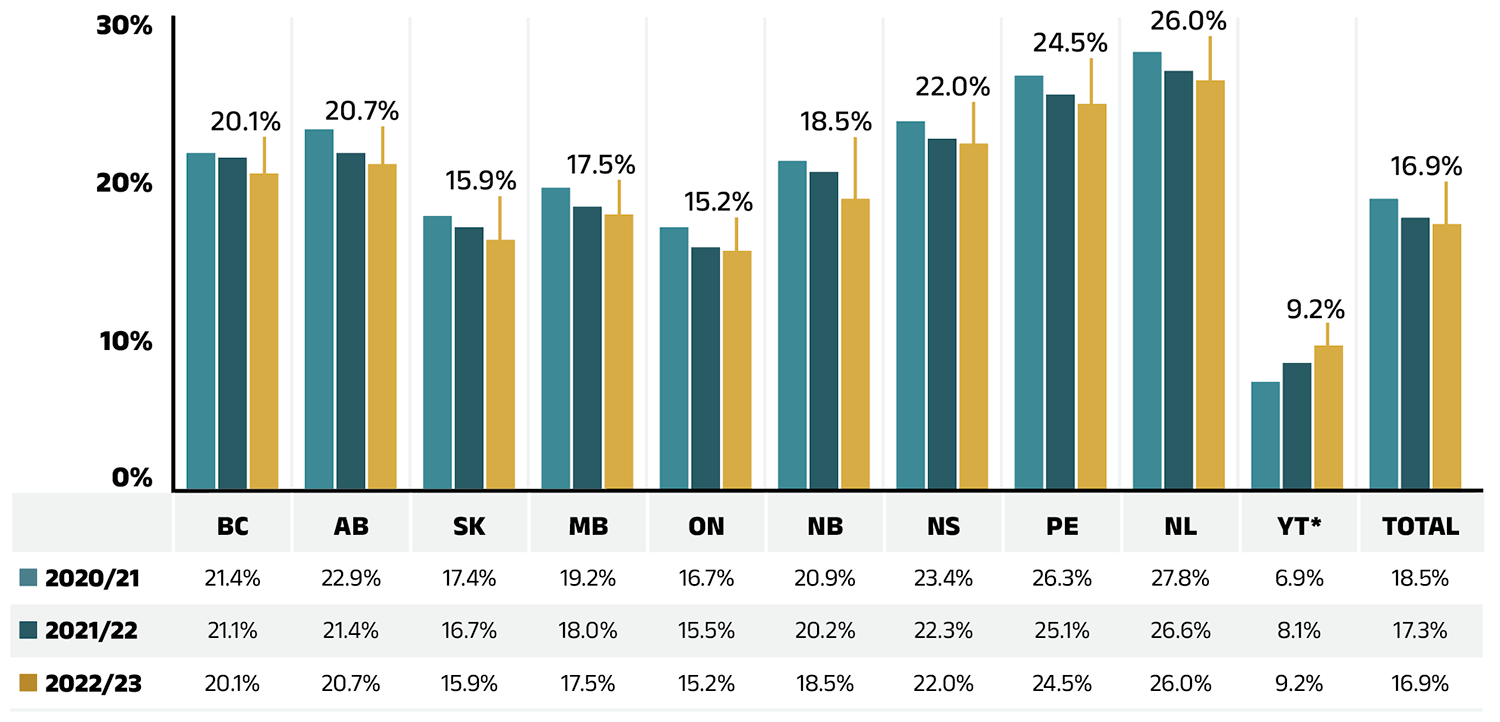
Figure 1.7 – Text version
| British Columbia | Alberta | Saskatchewan | Manitoba | Ontario | New Brunswick | Nova Scotia | Prince Edward Island | Newfoundland and Labrador | Yukon* | Total | |
|---|---|---|---|---|---|---|---|---|---|---|---|
| 2020/21 | 21.4% | 22.9% | 17.4% | 19.2% | 16.7% | 20.9% | 23.4% | 26.3% | 27.8% | 6.9% | 18.5% |
| 2021/22 | 21.1% | 21.4% | 16.7% | 18.0% | 15.5% | 20.2% | 22.3% | 25.1% | 26.6% | 8.1% | 17.3% |
| 2022/23 | 20.1% | 20.7% | 15.9% | 17.5% | 15.2% | 18.5% | 22.0% | 24.5% | 26.0% | 9.2% | 16.9% |
* Yukon allows for markups of up to 30%; as such, dispensing costs account for a smaller share of their total expenditures.
Data source: National Prescription Drug Utilization Information System Database, Canadian Institute for Health Information.
2. The Drivers of Drug Costs, 2021/22 to 2022/23
Drug cost increases in the NPDUIS public plans in 2022/23 were primarily driven by a continued increased use of higher-cost medicines and a post-pandemic rebound in active beneficiaries. As with previous editions of this report, the drug-mix effect remained the most pronounced driver, contributing 7.1% to overall growth, partially offset by −4.2% in savings from price and substitution effects. The recovery in active beneficiary numbers exerted a 5.8% demographic push effect, while a slight decline in claims per patient led to a −0.3% volume effect. Collectively, these dynamics resulted in an overall 7.9% increase in drug costs.
In this section, a comprehensive cost driver analysis is used to determine how much public plan drug costs would have changed between 2021/22 and 2022/23 if only one factor (e.g., the price of drugs) was considered while all the others remained the same.Footnote VII
Changes in drug costs are driven by a number of push (upward) and pull (downward) effects. The net effect of these opposing forces yields the overall rate of change.
Price change effect: Changes in the prices of both brand-name and generic drugs, determined at the molecule, strength, and form level.
Substitution effect: Shifts from brand-name to generic drugs, as well as shifts to biosimilar use.
Demographic effect: Changes in the number of active beneficiaries, as well as shifts in the distribution of age or gender.
Volume effect: Changes in the number of prescriptions dispensed to patients, the average number of units of a drug dispensed per prescription, and/or shifts in the use of various strengths or forms of a medicine.
Drug-mix effect: Shifts in use between lower- and higher-cost drugs, including those entering, exiting, or remaining in the market during the time period analyzed.
Figure 2.1 provides insight into the pressures driving the rates of change in drug costs from 2017/18 to 2022/23.
Typically, changes in the patient population and the volume of drugs prescribed contribute a slight to moderate increase to drug costs. Before the COVID-19 pandemic, the demographic effect ranged between 1% and 3%, while the volume effect remained stable around 1%. However, the pandemic significantly disrupted these baseline trends over the past three years. First, there was a −2.3% demographic pull effect in 2020/21 due to fewer reimbursed beneficiaries, followed by a 2.5% demographic push effect in 2021/22, as the number of active beneficiaries rebounded. By 2022/23, active beneficiary numbers fully recovered, surpassing prepandemic levels and contributing a considerable 5.8% demographic push effect.
Over the same three year period, in part due to the temporary impact of pandemic-related prescription size limits, the volume effect exerted a minor offset relative to the demographic effect. In 2022/23, a reduced number of claims per patient contributed a modest 0.3% volume pull-down effect, as claims per patient did not move in step with the demographic changes.
The most pronounced upward push on costs can be attributed to the use of higher-cost medicines, known as the drug-mix effect, which consistently contributed 5% to 6% to the annual growth in drug costs between 2017/18 and 2020/21, jumping to an average of 7.6% over the past two years in the NPDUIS public plans.
Counterbalancing these upward cost pressures, generic and biosimilar substitution and price reductions generally exert a downward pull on costs. The magnitude of these effects can vary from year to year depending on the timing of generic and biosimilar market entries and the implementation of relevant policies or initiatives. Following three years (2019/20 to 2021/22) of a combined impact ranging from −1% to −2%, the price change and substitution effects had a more sizable impact of −4.2% in 2022/23. The price change effect reduced drug costs by 1.2%, while the substitution effect continued to gain momentum, lowering costs by 3.0%.
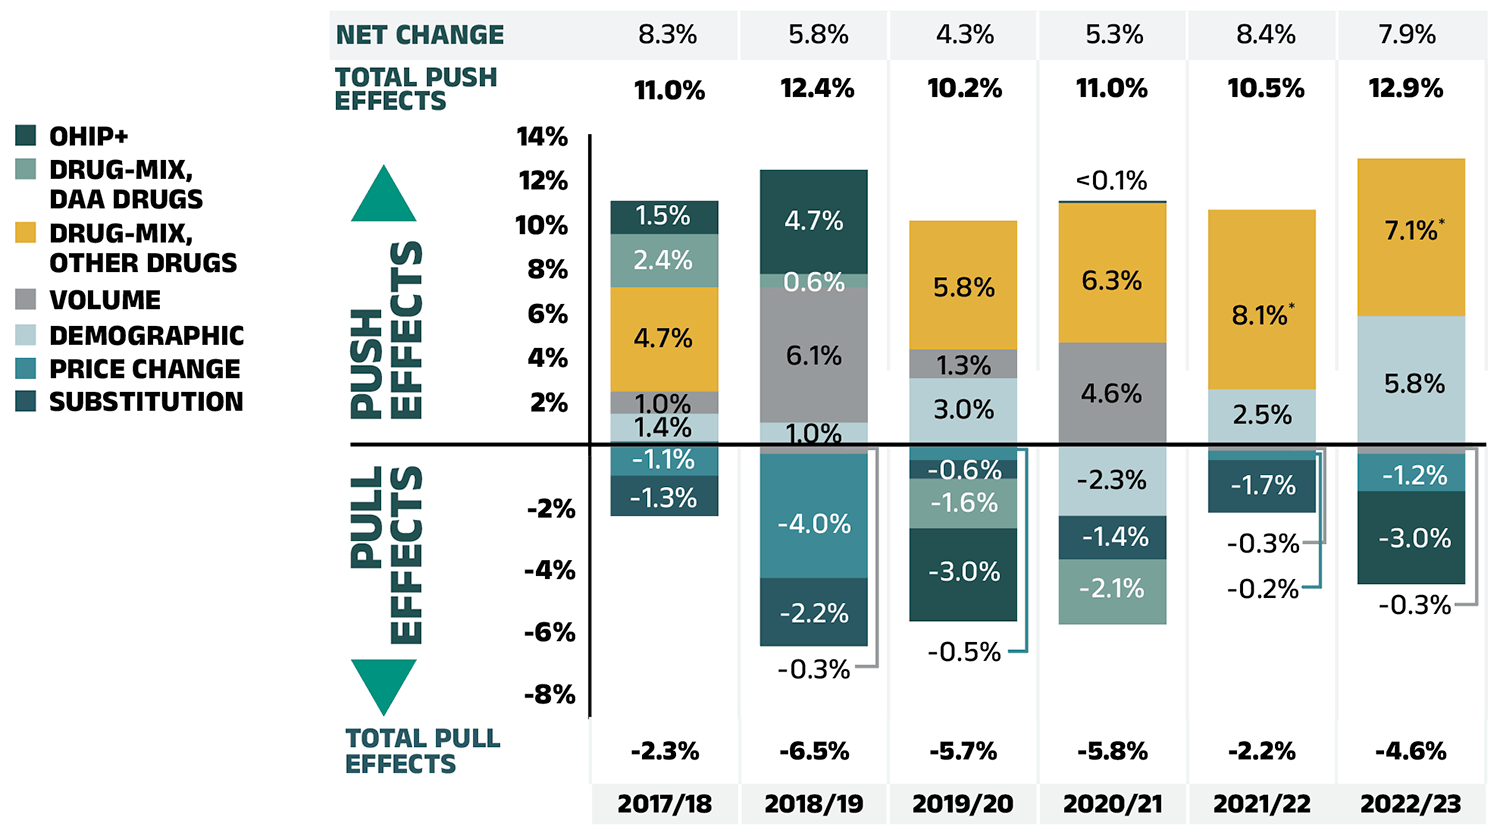
Figure 2.1 – Text version
| 2017/18 | 2018/19 | 2019/20 | 2020/21 | 2021/22 | 2022/23 | |
|---|---|---|---|---|---|---|
| Demographic | 1.4% | 1.0% | 3.0% | -2.3% | 2.5% | 5.8% |
| Volume | 1.0% | -0.3% | 1.3% | 4.6% | -0.2% | -0.3% |
| Drug-mix, other drugs | 4.7% | 6.1% | 5.8% | 6.3% | 8.1% | 7.1% |
| Price change | -1.1% | -4.0% | -0.5% | 0.04% | -0.3% | -1.2% |
| Substitution | -1.3% | -2.2% | -0.6% | -1.4% | -1.7% | -3.0% |
| Drug-mix, direct-acting antiviral (DAA) drugs* | 2.4% | 0.6% | -1.6% | -2.1% | - | - |
| OHIP+ | 1.5% | 4.7% | -3.0% | - | - | - |
| Total push effects | 11.0% | 12.4% | 10.2% | 11.0% | 10.5% | 12.9% |
| Total pull effects | -2.3% | -6.5% | -5.7% | -5.8% | -2.2% | -4.6% |
| Net change | 8.3% | 5.8% | 4.3% | 5.3% | 8.4% | 7.9% |
Note: This analysis is based on publicly available pricing information. It does not reflect confidential price discounts negotiated by the pCPA on behalf of the public plans.
Values may not add to totals due to rounding and the cross effect.
* Since 2021/22, the effect of direct-acting antiviral (DAA) drugs has been minor (−0.1%) and folded into the Drug-mix, other drugs effect.
Data source: National Prescription Drug Utilization Information System Database, Canadian Institute for Health Information.
The overall 7.9% increase in drug costs in 2022/23 represents an absolute growth of $865 million, with varying rates of growth among the public drug plans ranging from approximately 5.4% to 11.4% (Figure 2.2), with the exception of a 2.8% decrease in Yukon. These variations were mainly due to differences in the magnitude of the opposing factors. Jurisdictions with higher overall growth rates included New Brunswick (11.4%), Saskatchewan (10.6%), and Alberta (9.4%).
In all jurisdictions except Yukon, the increased use of higher-cost drugs, known as the drug-mix effect, had the greatest push effect. This effect’s overall impact was a cost growth of 7.1% ($769 million), ranging from 5.4% to 14.3% across public plans. Jurisdictions with the highest drug-mix effects included New Brunswick (14.3%), Manitoba (9.4%), and British Columbia (8.9%). Differences in the drug-mix effect across public drug plans may be related to plan designs, formulary listing decisions, or the disease profiles of the population, among other factors.
The demographic effect pushed drug costs in NPDUIS public plans by 5.8% ($633 million) in 2022/23, reflecting a significant post-pandemic rebound. This demographic push effect was strongest in Ontario (8.0%) and Yukon (5.9%). Beyond the pandemic-related factor, the increase in the active beneficiary population can typically be the result of growth in the overall population of a jurisdiction, an increase in the number of Canadians eligible for senior coverage (65+), and/or plan design changes that expanded coverage to new population or patient groups.
In contrast with the increased number of active beneficiaries, the volume effect had a modest impact on growth in 2022/23. The average number of prescriptions dispensed per patient decreased slightly, pulling overall drug costs down by 0.3% or $30 million. The magnitude of this effect varied significantly across public plans, as the impact of the number of prescriptions dispensed per patient ranged from an important push driver in British Columbia (3.9%) and Nova Scotia (3.3%) to a pull factor in Yukon (−4.9%) and Ontario (−1.7%).
The pronounced price change effect (−1.2% or -$135 million) in 2022/23 was primarily driven by Ontario (−1.7%). The cost savings effects of generic and biosimilar substitution ranged from −2.0% to −5.3% across jurisdictions.
Three key effects for 2022/23—price change, substitution, and drug-mix—are explored in more detail in the rest of this section.
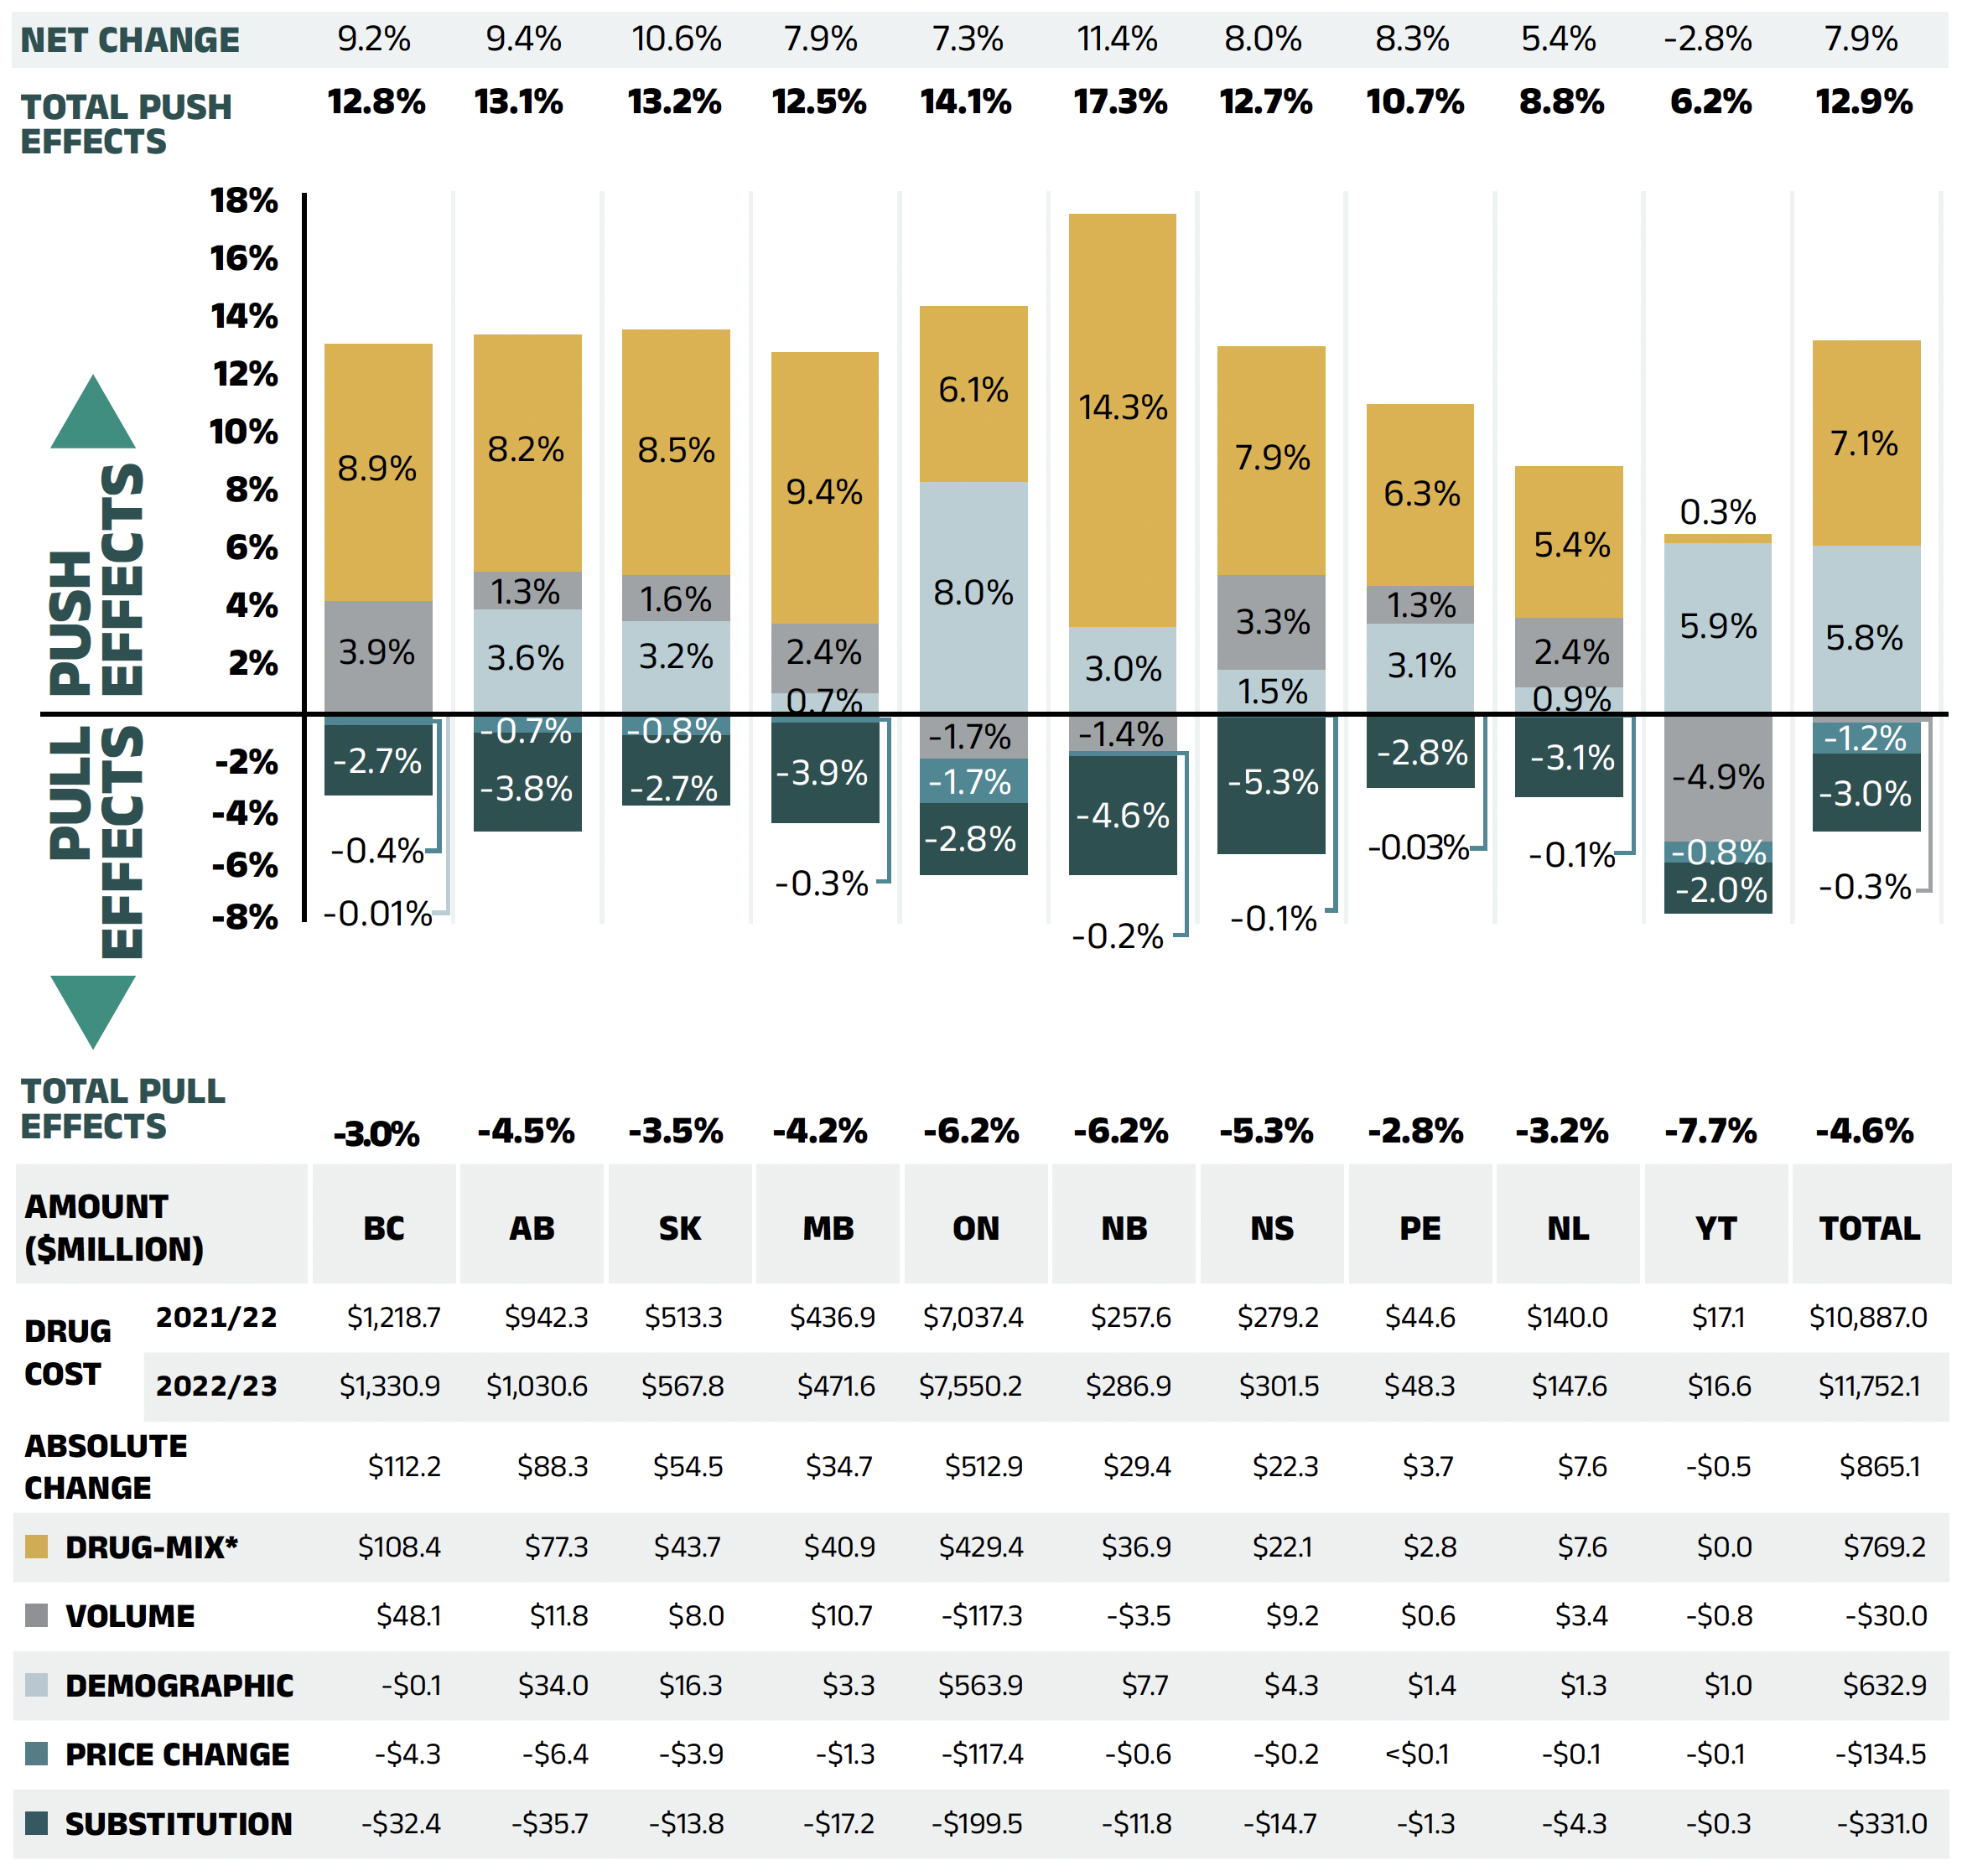
Figure 2.2 – Text version
| British Columbia | Alberta | Saskatchewan | Manitoba | Ontario | New Brunswick | Nova Scotia | Prince Edward Island | Newfoundland and Labrador | Yukon | Total | |
|---|---|---|---|---|---|---|---|---|---|---|---|
| Demographic | -0.01% | 3.6% | 3.2% | 0.7% | 8.0% | 3.0% | 1.5% | 3.1% | 0.9% | 5.9% | 5.8% |
| Volume | 3.9% | 1.3% | 1.6% | 2.4% | -1.7% | -1.4% | 3.3% | 1.3% | 2.4% | -4.9% | -0.3% |
| Drug-mix* | 8.9% | 8.2% | 8.5% | 9.4% | 6.1% | 14.3% | 7.9% | 6.3% | 5.4% | 0.3% | 7.1% |
| Price Change | -0.4% | -0.7% | -0.8% | -0.3% | -1.7% | -0.2% | -0.1% | -0.03% | -0.1% | -0.8% | -1.2% |
| Substitution | -2.7% | -3.8% | -2.7% | -3.9% | -2.8% | -4.6% | -5.3% | -2.8% | -3.1% | -2.0% | -3.0% |
| Total push effects | -0.01% | 3.6% | 3.2% | 0.7% | 8.0% | 3.0% | 1.5% | 3.1% | 0.9% | 5.9% | 5.8% |
| Total pull effects | -3.0% | -4.5% | -3.5% | -4.2% | -6.2% | -6.2% | -5.3% | -2.8% | -3.2% | -7.7% | -4.6% |
| Net change | 9.2% | 9.4% | 10.6% | 7.9% | 7.3% | 11.4% | 8.0% | 8.3% | 5.4% | -2.8% | 7.9% |
| British Columbia | Alberta | Saskatchewan | Manitoba | Ontario | New Brunswick | Nova Scotia | Prince Edward Island | Newfoundland and Labrador | Yukon | Total | |
|---|---|---|---|---|---|---|---|---|---|---|---|
| Drug cost 2021/22 | $1,218.7 | $942.3 | $513.3 | $436.9 | $7,037.4 | $257.6 | $279.2 | $44.6 | $140.0 | $17.1 | $10,887.0 |
| Drug cost 2022/23 | $1,330.9 | $1,030.6 | $567.8 | $471.6 | $7,550.2 | $286.9 | $301.5 | $48.3 | $147.6 | $16.6 | $11,752.1 |
| Absolute change | $112.2 | $88.3 | $54.5 | $34.7 | $512.9 | $29.4 | $22.3 | $3.7 | $7.6 | -$0.5 | $865.1 |
| Drug-mix* | $108.4 | $77.3 | $43.7 | $40.9 | $429.4 | $36.9 | $22.1 | $2.8 | $7.6 | $0.0 | $769.2 |
| Volume | $48.1 | $11.8 | $8.0 | $10.7 | -$117.3 | -$3.5 | $9.2 | $0.6 | $3.4 | -$0.8 | -$30.0 |
| Demographic | -$0.1 | $34.0 | $16.3 | $3.3 | $563.9 | $7.7 | $4.3 | $1.4 | $1.3 | $1.0 | $632.9 |
| Price change | -$4.3 | -$6.4 | -$3.9 | -$1.3 | -$117.4 | -$0.6 | -$0.2 | <$0.1 | -$0.1 | -$0.1 | -$134.5 |
| Substitution | -$32.4 | -$35.7 | -$13.8 | -$17.2 | -$199.5 | -$11.8 | -$14.7 | -$1.3 | -$4.3 | -$0.3 | -$331.0 |
Note: This analysis is based on publicly available pricing information. It does not reflect confidential drug price discounts negotiated by the pCPA on behalf of the public plans. Values may not add to totals due to rounding and the cross effect.
* In 2022/23, the effect of direct-acting antiviral (DAA) drugs was minor (−0.1%) and folded into the Drug-mix effect.
Data source: National Prescription Drug Utilization Information System Database, Canadian Institute for Health Information.
Price Change Effect
This effect captures changes in the prices of both brand-name and generic medicines. In 2022/23, changes in drug prices pulled the overall cost levels downward by −1.2% ($135 million). An analysis by market segment suggests that the downward pull was mainly due to a slight reduction in the average unit costs reimbursed in the multi-source non-patented category, as the average unit costs of patented medicines remained relatively stable while the costs of single-source non-patented medicines increased.
Figure 2.3 reports the trends in average unit costs from 2017/18 to 2022/23 by market segment for (a) patented medicines; (b) multi-source generic medicines; and (c) single-source non-patented medicines, along with their corresponding 2022/23 market shares.Footnote VIII The results are presented as an index, with the base year (2017/18) set to one and subsequent years reported relative to this value. The findings are a cost-weighted average of changes in the reimbursed unit costs for individual medicines. The analysis was restricted to oral solid formulations to ensure unit consistency.
From 2017/18 to 2022/23, the prices of patented medicines were stable, with a modest average increase of 3% over the period and a negligible change of just 0.1% in 2022/23. Prices for single-source non-patented medicines rose by an average of 12% over the same period, including a 2% increase in 2022/23. Despite the significant rise in prices, the impact of this segment was limited due to its small size: single-source non-patented medicines make up just 3.5% of prescriptions, while patented medicines represent 6.8% of prescriptions. The multi-source generics market shows a similar trend across all NPDUIS public drug plans that is often shaped by the various waves of generic price agreements. Following recent pricing initiatives, average unit costs dropped significantly by an average of 20% from 2017/18 to 2018/19, but remained steady from 2019/20 to 2021/22 with no further decreases. However, in 2022/23, prices declined modestly by an average of 1%, partly due to a price reduction in Ontario for lenalidomide. As a result, the average multi-source generic unit cost across all jurisdictions in 2022/23 was 79% of the 2017/18 average.
Brief Insights: pCPA Initiatives
Through the pan-Canadian Pharmaceutical Alliance (pCPA), the provinces, territories, and federal government have been working collectively to achieve greater value for generic and brand-name medicines for Canada’s publicly funded drug programs. Recent and ongoing initiatives are described below.
Generic medicines:
A new three-year pricing initiative between the pCPA and the Canadian Generic Pharmaceutical Association (CGPA) came into effect on October 1, 2023, with the option to extend for an additional two years. Quebec is included as a participant in the new agreement. Under this initiative, newly launched single-source generics are subject to an automatic price drop to 55% of the brand reference price after three months of public funding.
Brand-name medicines (including biosimilars):
As of December 31, 2024, a total of 638 negotiations had resulted in a letter of intent (LOI) through the pCPA, covering both brand-name and biosimilar medicines. These included 235 for oncology, 64 for biosimilars, and 74 for expensive drugs for rare diseases (EDRDs). The impact of negotiated confidential drug prices is not reflected in this report.
For more details, see the overview of generic pricing policies and pCPA initiatives available on CIHI’s website.Footnote 2
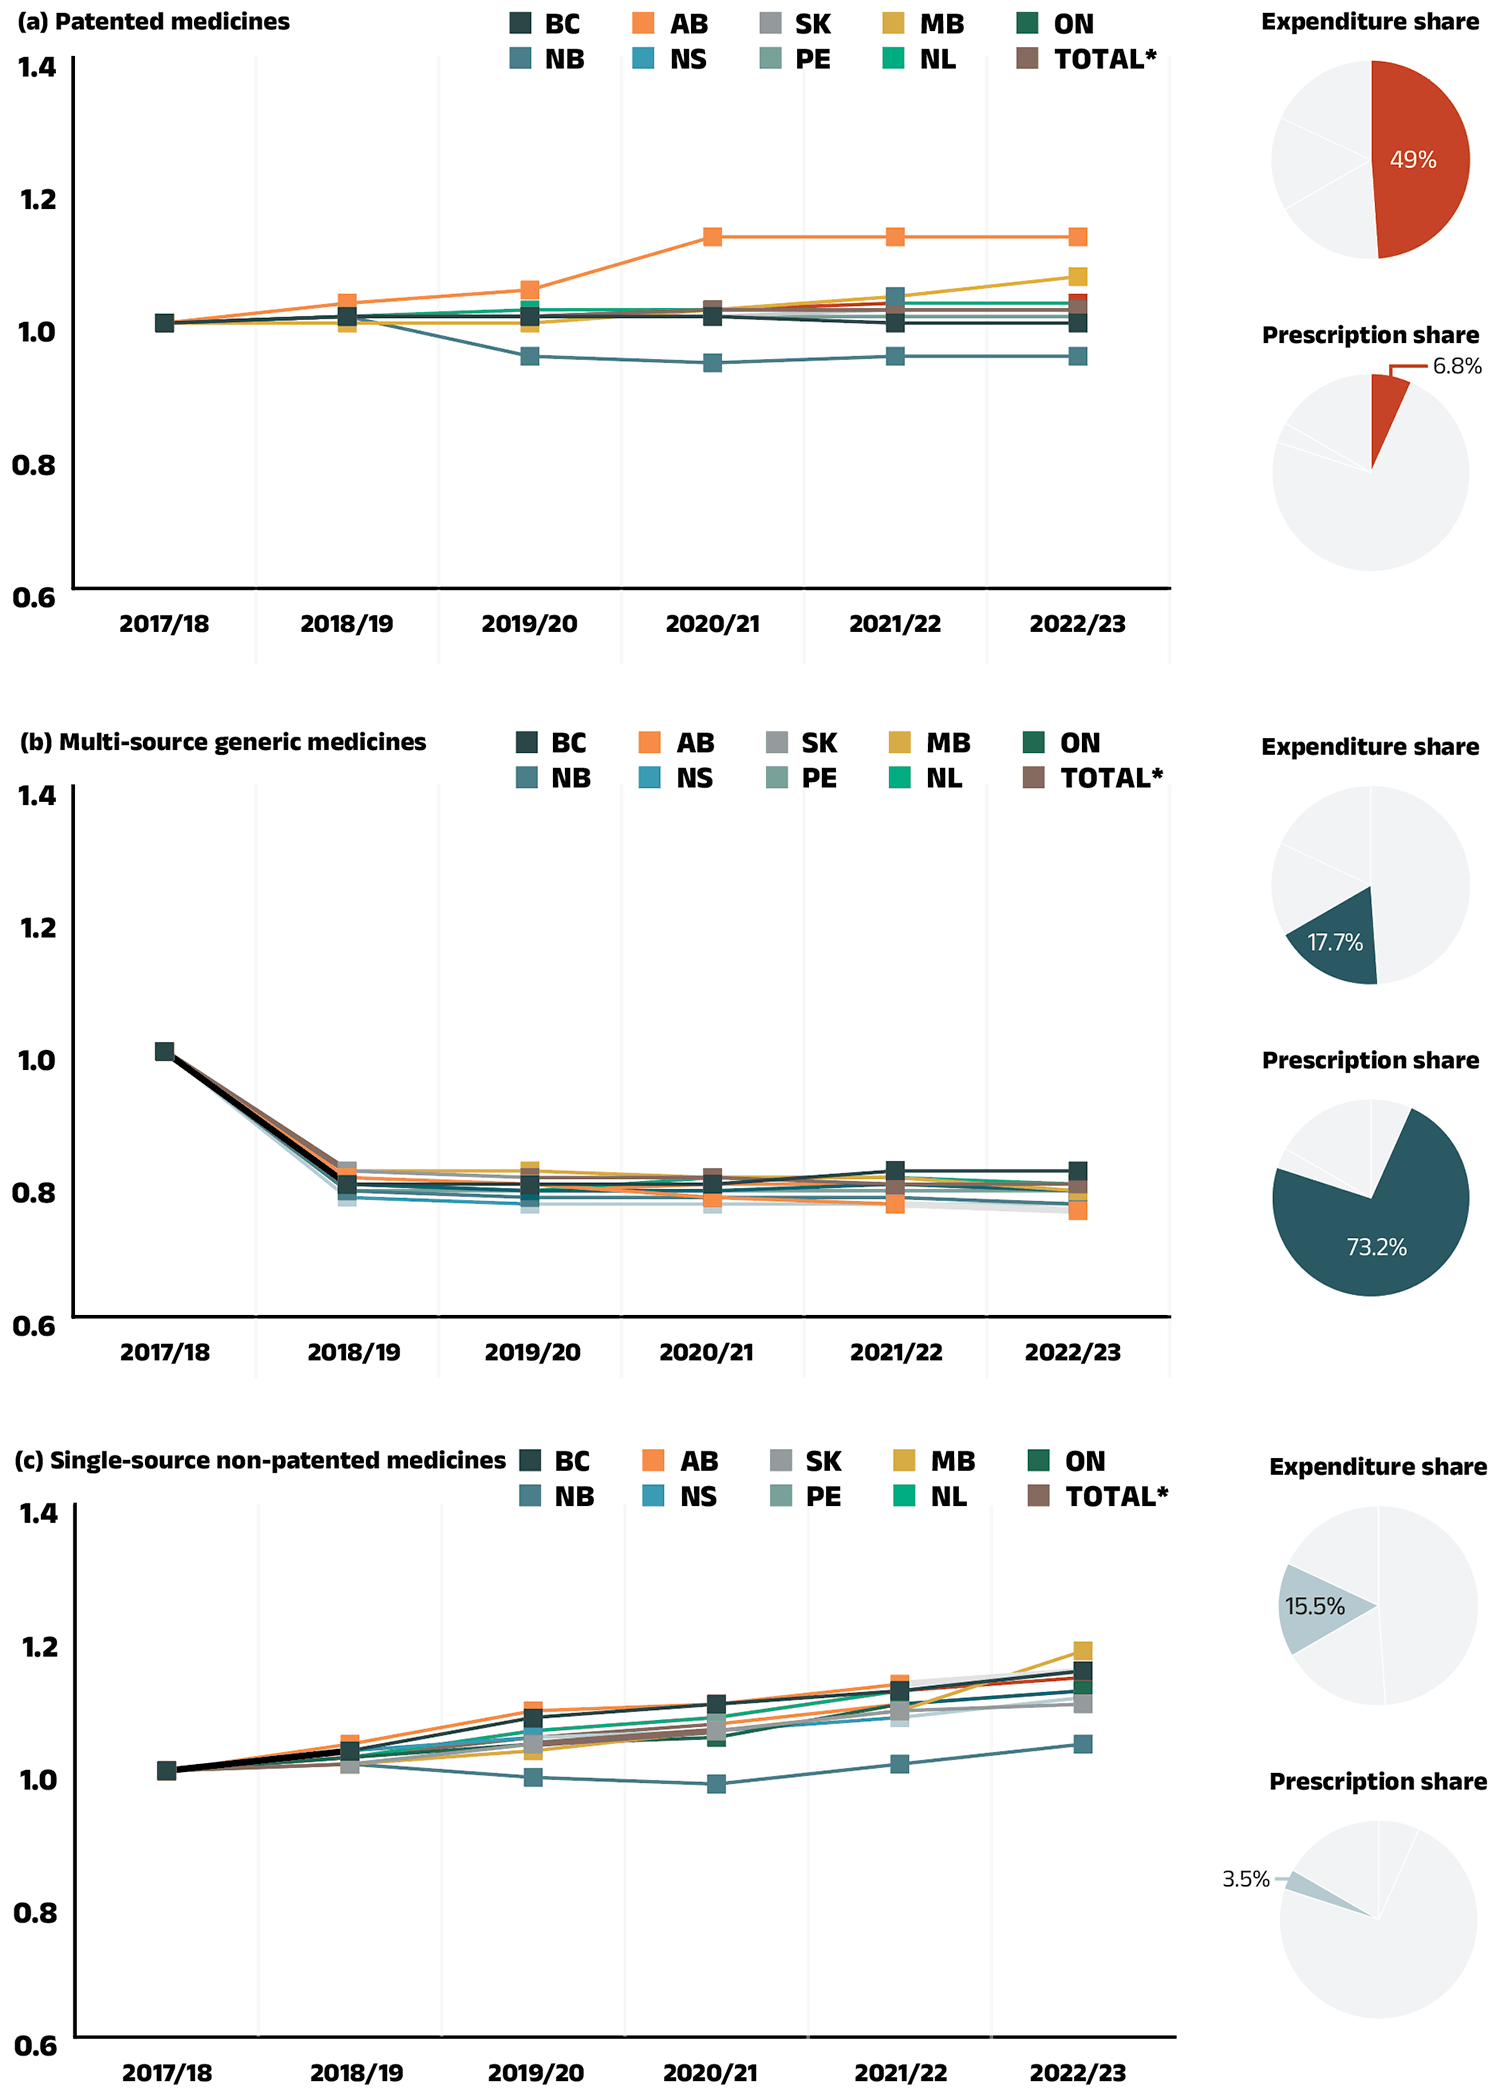
Figure 2.3 – Text version
(a) Patented medicines
Expenditure share: 49.0%
Prescription share: 6.8%
| 2017/18 | 2018/19 | 2019/20 | 2020/21 | 2021/22 | 2022/23 | |
|---|---|---|---|---|---|---|
| British Columbia | 1.00 | 1.01 | 1.01 | 1.01 | 1.00 | 1.00 |
| Alberta | 1.00 | 1.03 | 1.05 | 1.13 | 1.13 | 1.13 |
| Saskatchewan | 1.00 | 1.01 | 1.01 | 1.02 | 1.02 | 1.02 |
| Manitoba | 1.00 | 1.00 | 1.00 | 1.02 | 1.04 | 1.07 |
| Ontario | 1.00 | 1.01 | 1.01 | 1.02 | 1.02 | 1.02 |
| New Brunswick | 1.00 | 1.01 | 0.95 | 0.94 | 0.95 | 0.95 |
| Nova Scotia | 1.00 | 1.01 | 1.01 | 1.01 | 1.02 | 1.02 |
| Prince Edward Island | 1.00 | 1.01 | 1.01 | 1.01 | 1.01 | 1.01 |
| Newfoundland and Labrador | 1.00 | 1.01 | 1.02 | 1.02 | 1.03 | 1.03 |
| Total for drug plans captured | 1.00 | 1.01 | 1.01 | 1.02 | 1.03 | 1.03 |
(b) Multi-source generic medicines
Expenditure share: 17.7%
Prescription share: 73.2%
| 2017/18 | 2018/19 | 2019/20 | 2020/21 | 2021/22 | 2022/23 | |
|---|---|---|---|---|---|---|
| British Columbia | 1.00 | 0.80 | 0.80 | 0.80 | 0.82 | 0.82 |
| Alberta | 1.00 | 0.81 | 0.80 | 0.78 | 0.77 | 0.76 |
| Saskatchewan | 1.00 | 0.82 | 0.81 | 0.81 | 0.80 | 0.80 |
| Manitoba | 1.00 | 0.82 | 0.82 | 0.81 | 0.81 | 0.79 |
| Ontario | 1.00 | 0.80 | 0.79 | 0.79 | 0.80 | 0.79 |
| New Brunswick | 1.00 | 0.79 | 0.78 | 0.78 | 0.78 | 0.77 |
| Nova Scotia | 1.00 | 0.78 | 0.77 | 0.77 | 0.77 | 0.77 |
| Prince Edward Island | 1.00 | 0.79 | 0.79 | 0.79 | 0.79 | 0.79 |
| Newfoundland and Labrador | 1.00 | 0.80 | 0.79 | 0.81 | 0.81 | 0.80 |
| Total for drug plans captured | 1.00 | 0.80 | 0.79 | 0.80 | 0.80 | 0.79 |
(c) Single-source non-patented medicines
Expenditure share: 15.5%
Prescription share: 3.5%
| 2017/18 | 2018/19 | 2019/20 | 2020/21 | 2021/22 | 2022/23 | |
|---|---|---|---|---|---|---|
| British Columbia | 1.00 | 1.03 | 1.08 | 1.10 | 1.12 | 1.15 |
| Alberta | 1.00 | 1.04 | 1.09 | 1.10 | 1.13 | 1.15 |
| Saskatchewan | 1.00 | 1.01 | 1.04 | 1.06 | 1.09 | 1.10 |
| Manitoba | 1.00 | 1.01 | 1.03 | 1.06 | 1.09 | 1.18 |
| Ontario | 1.00 | 1.02 | 1.04 | 1.05 | 1.10 | 1.12 |
| New Brunswick | 1.00 | 1.01 | 0.99 | 0.98 | 1.01 | 1.04 |
| Nova Scotia | 1.00 | 1.03 | 1.05 | 1.06 | 1.08 | 1.11 |
| Prince Edward Island | 1.00 | 1.02 | 1.06 | 1.08 | 1.12 | 1.15 |
| Newfoundland and Labrador | 1.00 | 1.02 | 1.06 | 1.08 | 1.12 | 1.14 |
| Total for drug plans captured | 1.00 | 1.02 | 1.05 | 1.07 | 1.10 | 1.12 |
Note: Yukon is not reported due to data limitations. As of 2020/21, national results do not include the NIHB program. The findings are a cost-weighted average of changes in the reimbursed unit costs for individual medicines. The analysis was limited to data for oral solid formulations. The remaining share of prescriptions and expenditures includes devices, compounded drugs, and other products that are reimbursed by public drug plans but do not have a Health Canada assigned Drug Identification Number (DIN).
* Total results for the drugs plans captured in this figure.
Data source: National Prescription Drug Utilization Information System Database, Canadian Institute for Health Information.
Substitution Effect
Shifts from brand-name to generic or biosimilar medicines pulled overall drug costs down by 3.0% in 2022/23, translating to savings of $331 million for the NPDUIS public plans, nearly double the impact observed in 2021/22 (−1.7% or $171 million).
The substitution effect was largely driven by generics. The top three generic contributors to the substitution effect, which included an antithrombotic agent (apixaban), an antidiabetic drug (sitagliptin) and an immunosuppressant (lenalidomide), accounted for −1.3% in savings. Biosimilars contributed −0.7% to the substitution effect in 2022/23. Cost savings from biosimilars were led by two immunosuppressants: −0.5% for adalimumab and −0.1% for infliximab.
The share of prescriptions for multi-source non-patented medicines in public plans increased to 88.3% in 2022/23, a significant rise over 83.6% in 2017/18, while their corresponding share of total drug costs increased from 27.5% to 30.7% (Figure 2.4). This trend may reflect the implementation of generic pricing and switching policies, as well as the genericization of commonly used medicines that lost patent protection in recent years. Multi-source generics alone accounted for 73.2% of prescriptions and 17.7% of drug costs in 2022/23.
Patented medicines comprised a decreasing share of prescriptions in recent years, dropping from 11.4% in 2017/18 to 6.8% in 2022/23. Their share of total public plan drug costs also fell to 49.0%, driven by changes to the patent status of several top-selling medicines. Despite this decline, the segment remains a major contributor to drug costs, as a result of the increased use of high-cost drugs such as biologics and oral oncology medicines.
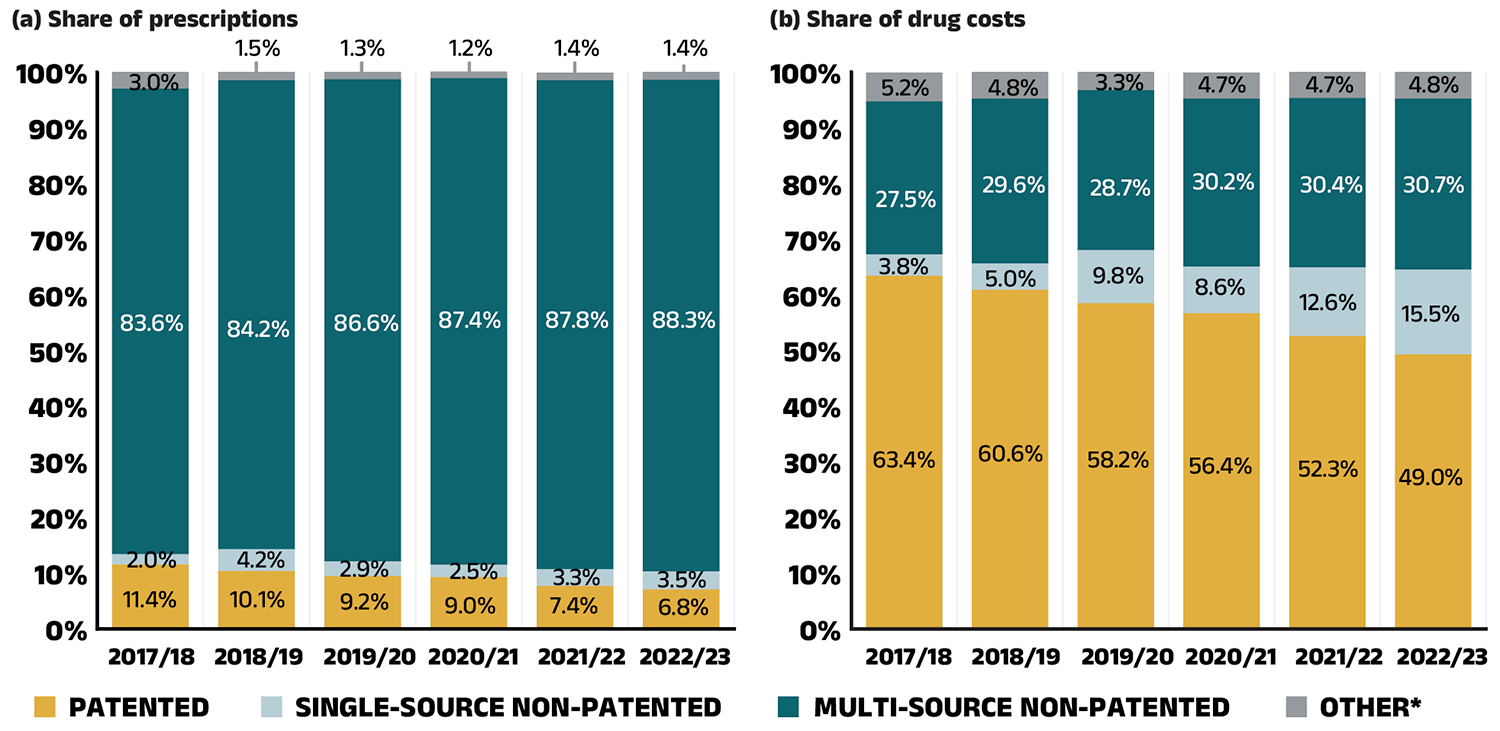
Figure 2.4 – Text version
(a) Share of prescriptions
| Market segment | 2017/18 | 2018/19 | 2019/20 | 2020/21 | 2021/22 | 2022/23 |
|---|---|---|---|---|---|---|
| Patented | 11.4% | 10.1% | 9.2% | 9.0% | 7.4% | 6.8% |
| Single-source non-patented | 2.0% | 4.2% | 2.9% | 2.5% | 3.3% | 3.5% |
| Multi-source non-patented | 83.6% | 84.2% | 86.6% | 87.4% | 87.8% | 88.3% |
| Other* | 3.0% | 1.5% | 1.3% | 1.2% | 1.4% | 1.4% |
(b) Share of drug costs
| Market segment | 2017/18 | 2018/19 | 2019/20 | 2020/2021 | 2021/22 | 2022/23 |
|---|---|---|---|---|---|---|
| Patented | 63.4% | 60.6% | 58.2% | 56.4% | 52.3% | 49.0% |
| Single-source non-patented | 3.8% | 5.0% | 9.8% | 8.6% | 12.6% | 15.5% |
| Multi-source non-patented | 27.5% | 29.6% | 28.7% | 30.2% | 30.4% | 30.7% |
| Other* | 5.2% | 4.8% | 3.3% | 4.7% | 4.7% | 4.8% |
* This market segment includes devices, compounded drugs, and other products that are reimbursed by public drug plans but do not have a Health Canada assigned Drug Identification Number (DIN).
Data source: National Prescription Drug Utilization Information System Database, Canadian Institute for Health Information.
A biosimilar drug, or biosimilar, is a biologic drug that is very similar to but less expensive than its originator biologic drug.Footnote IX Although biosimilars are not identical to their originator biologics, there are no expected differences in efficacy and safety between a biosimilar and the originator biologic drug.ix The biosimilars market is a relatively complex space—compared to traditional generic drug markets, the savings from biosimilars were initially limited by slower uptake but have improved with recent switching initiatives.
Table 2.1 provides an overview of the biosimilars recently approved in Canada. Inflectra, which was approved in Canada in 2014 and marketed publicly in 2016, was one of the first biosimilars available on the Canadian market and has one of the highest list price discounts. Inflectra, followed by Renflexis (approved in 2017), are both indicated for most of the same autoimmune inflammatory diseases as their originator infliximab product Remicade. Despite having list prices set at approximately half that of Remicade, their initial market uptake was slow. Over the last four years (2019/20 to 2022/23), several public drug plans, including British Columbia, Alberta, New Brunswick, Nova Scotia and Saskatchewan have implemented initiatives to encourage switching from biologics to biosimilars. The uptake of biosimilars targeted by switching initiatives has increased substantially: by 2022/23, the combined uptake of Inflectra, Renflexis and Avsola captured 57.9% of infliximab prescriptions.
Brenzys and Erelzi, biosimilars of another anti-TNF-α drug etanercept (Enbrel), were approved for market in Canada in 2016 and 2017, respectively. Their list prices were approximately two thirds of the price of their originator biologic. By 2022/23, as targets of biosimilar switching initiatives, these biosimilars captured 68.6% of etanercept prescriptions.
Truxima, Riximyo, Ruxience and Riabni, recent biosimilars approved in 2019, 2020 and 2021 for the monoclonal antibody medicine rituximab (Rituxan), were also targeted by biosimilar switching initiatives. Three years after they were first available in the NPDUIS public plans, these biosimilars captured 82.9% of rituximab prescriptions.
Several biosimilars (Amgevita, Hadlima, Hulio, Hyrimoz, Idacio, Abrilada, Yuflyma, and Simlandi) of another key anti-TNF-α drug adalimumab (Humira), became available in the NPDUIS public plans as recently as 2021 and 2022. These biosimilars, priced at 60% of the list price of the originator biologic, were also targeted by biosimilar switching initiatives. As a result, their uptake increased significantly, capturing 62.1% of adalimumab prescriptions by 2022/23.
Biosimilars used to treat an acute indication often achieve significantly higher uptake than those used for chronic indications. Grastofil, Nivestym, Lapelga, Fulphila, Ziextenzo, and Nyvepria, biosimilars of the white blood cell stimulators filgrastim (Neupogen) and pegfilgrastim (Neulasta), had the highest uptake in the public plans at 95.4% and 96.9%, respectively, in 2022/23. Their discount from the originator biologic list price ranged from 25% to 45%.
Biosimilars used in the management of diabetes included Basaglar and Semglee, biosimilars of insulin glargine (Lantus), Admelog, a biosimilar of insulin lispro (Humalog), and Trurapi and Kirsty, biosimilars of insulin aspart (NovoRapid). These biosimilars have experienced relatively gradual uptake in the NPDUIS public plans. Biosimilars of insulin glargine captured a 49.1% share of the prescriptions, while biosimilars of insulin lispro x The oncology medicines covered by public plans may be underestimated, as some are reimbursed through specialized programs, such as cancer care, that are not captured in the data. and insulin aspart achieved 23.8% and 18.7% uptake, respectively. Their 25% to 31.3% discount from the originator biologic list price places them at the lower end of cost savings offered by biosimilars.
Over the past few years, several biosimilars were newly available in the NPDUIS public plans, including blood thinners, bone health treatments, and cancer treatments. Teva-Teriparatide and Osnuvo (biosimilars of teriparatide (Forteo)) and Inclunox/HP, Noromby/HP, and Redesca/HP (biosimilars of enoxaparin (Lovenox)), have seen sustained uptake, reaching 80.8% and 46.6% of their respective markets in the public plans. Mvasi, a biosimilar of the oncologyFootnote X medicine bevacizumab (Avastin), only captured a 2.1% share of the bevacizumab market in 2022/23. These biosimilars’ discounts from their originator biologic’s list price ranged from 15% to 40%.
Table 2.1 Biosimilars recently approved in Canada, NPDUIS public drug plans, 2022/23
| Originator biologic | Biosimilar | ||||||
|---|---|---|---|---|---|---|---|
| Medicinal ingredient (trade name) |
Drug cost, $million | Trade name |
Market approval | First reimbursement |
Price discount* from reference biologic | Share of prescriptions for medicinal ingredient |
|
Infliximab (Remicade) |
$204.70 |
Inflectra | 15-Jan-14 | Q1 2016 | 46.8% | 42.3% | 57.9% |
| Renflexis | 01-Dec-17 | Q3 2018 | 50.1% | 14.3% | |||
| Avsola | 12-Mar-20 | Q4 2020 | 50.1% | 1.3% | |||
Etanercept (Enbrel) |
$56.10 |
Brenzys | 31-Aug-16 | Q3 2017 | 33.7% | 36.5% | 68.6% |
| Erelzi | 06-Apr-17 | Q4 2017 | 37.2% | 32.1% | |||
Rituximab (Rituxan) |
$8.20 |
Riximyo | 28-Apr-20 | Q3 2020 | 37.0% | 31.4% | 82.9% |
| Ruxience | 04-May-20 | Q3 2020 | 35.0% | 44.6% | |||
| Truxima | 04-Apr-19 | Q1 2020 | 30.0% | 6.8% | |||
| Riabni | 11-Mar-21 | Q4 2021 | 38.4% | 0.1% | |||
Adalimumab (Humira) |
$179.80 |
Hadlima / Hadlima Pushtouch | 08-May-18 | Q1 2021 | 40.0% | 15.1% | 62.1% |
| Amgevita | 04-Nov-20 | Q2 2021 | 40.0% | 14.5% | |||
| Hulio | 24-Nov-20 | Q2 2021 | 40.0% | 9.8% | |||
| Hyrimoz | 04-Nov-20 | Q2 2021 | 40.0% | 11.6% | |||
| Idacio | 30-Oct-20 | Q2 2021 | 40.0% | 7.2% | |||
| Abrilada | 29-Jun-21 | Q2 2022 | 40.0% | 2.6% | |||
| Yuflyma | 24-Dec-21 | Q2 2022 | 40.0% | 0.3% | |||
| Simlandi | 05-Jan-22 | Q2 2022 | 40.0% | 1.1% | |||
Insulin glargine (Lantus) |
$48.10 |
Basaglar | 01-Sep-15 | Q3 2017 | 25.0% | 49.1% | 49.1% |
| Semglee | 08-Apr-22 | Q4 2022 | 31.3% | <0.1% | |||
| Insulin lispro (Humalog) | $33.90 | Admelog | 16-Nov-17 | Q4 2020 | 25.0% | 23.8% | 23.8% |
Insulin aspart (NovoRapid) |
$35.20 |
Trurapi | 15-Oct-20 | Q3 2021 | 26.5% | 18.7% | 18.7% |
| Kirsty | 12-Oct-21 | Q1 2023 | 30.2% | <0.1% | |||
Filgrastim (Neupogen) |
$2.40 |
Grastofil | 07-Dec-15 | Q4 2016 | 25.0% | 94.5% | 95.4% |
| Nivestym | 16-Apr-20 | Q3 2020 | 25.0% | 0.9% | |||
Pegfilgrastim (Neulasta) |
$1.60 |
Lapelga | 05-Apr-18 | Q2 2019 | 25.0% | 95.5% | 96.9% |
| Fulphila† | 24-Dec-18 | Q1 2020 | 36.1% | 0.8% | |||
| Ziextenzo† | 21-Apr-20 | Q3 2020 | 43.1% | 0.5% | |||
| Nyvepria | 28-Oct-20 | Q2 2021 | 45.1% | – | |||
| Bevacizumab (Avastin) | $0.60 | Mvasi | 30-Apr-18 | Q2 2020 | 25.7% | 2.1% | 2.1% |
Teriparatide (Forteo) |
$0.10 |
Teva Teriparatide | 06-Aug-19 | Q3 2020 | 15.0% | 62.3% | 80.8% |
| Osnuvo | 13-Jan-20 | Q3 2022 | 40.0% | 18.4% | |||
Enoxaparin (Lovenox) |
$4.70 |
Inclunox / Inclunox HP | 05-Nov-20 | Q2 2021 | 25.0% | 17.9% | 46.6% |
| Noromby / Noromby HP | 14-Oct-20 | Q2 2021 | 20.0% | 4.4% | |||
| Redesca | 07-Dec-20 | Q2 2021 | 19.7% | 24.2% | |||
Note: This analysis is based on publicly available pricing information. It does not reflect confidential price discounts negotiated by the pCPA on behalf of the public plans.
* Based on Ontario Drug Benefit formulary listing price at the time of the biosimilar entry. This price may change over time; for example, the list price for Brenzys was recently lowered to match Erelzi. The price discounts do not reflect confidential rebates from negotiations.
† Based on the values reported in the CADTH Biosimilar Summary Dossier for Pegfilgrastim (Lapelga) and in the CADTH Biosimilar Summary Dossier for Bevacizumab (Mvasi), respectively. The price discounts do not reflect confidential rebates from negotiations.
Data source: National Prescription Drug Utilization Information System Database, Canadian Institute for Health Information.
To explore the accessibility of biosimilars and their impact in mitigating cost pressures in public drug plans, Figure 2.5 shows their availability and share of biologic drug costs in NPDUIS public drug plans. The total drug costs for biologics increased from $2,308 million in 2017/18 to $3,828 million in 2022/23. The number of distinct biologic molecules with available biosimilars reimbursed in public drug plans reached 12 in 2022/23, reflecting expanded treatment options and growing availability of biosimilars in the market.
The share of drug costs attributed to biologic medicines with available biosimilars fluctuated, declining from 31.3% in 2017/18 to a low of 26.1% in 2019/20, before peaking at 37.6% in 2020/21. It then fell to 32.9% in 2021/22, further decreasing to 28.0% by 2022/23 concurrently with the adoption of recent biosimilar policy initiatives.
The biosimilar share of overall biologic drug costs has steadily increased, rising to 13.2% in 2022/23. Despite a $395 million (11.3%) increase in the overall biologics market from 2021/22 to 2022/23, spending on biologic medicines with available biosimilars declined slightly by $57 million over the same period. This may be due to the introduction of new biosimilars and ongoing initiatives to improve biosimilar uptake, which aimed to reduce spending on biologic medicines with available biosimilars.
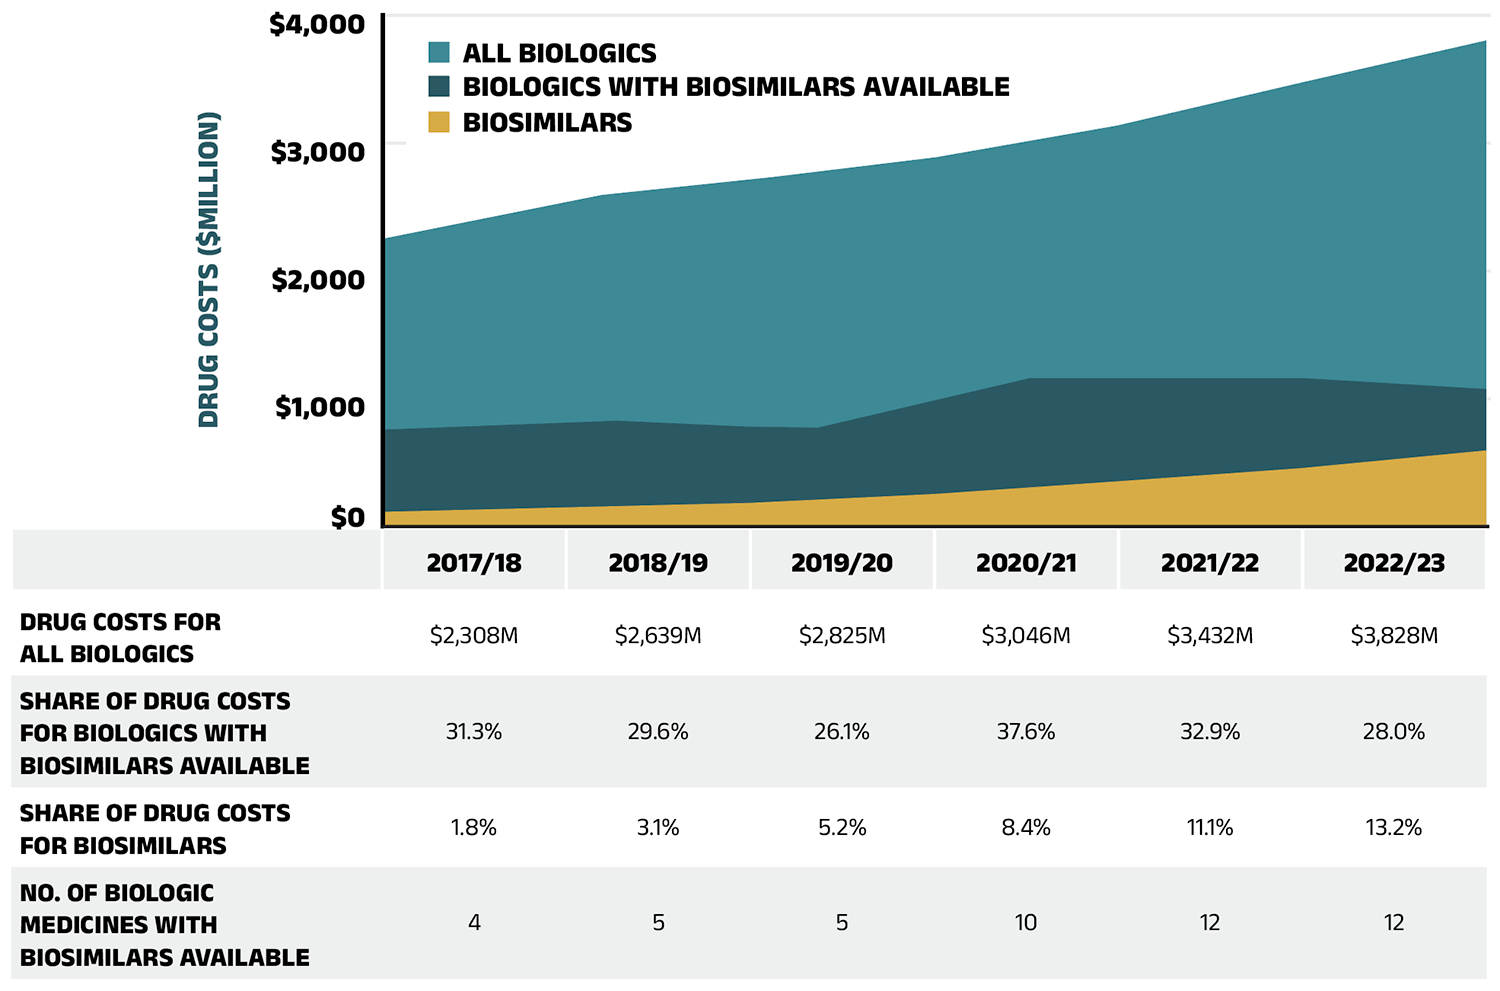
Figure 2.5 – Text version
| 2017/18 | 2018/19 | 2019/20 | 2020/21 | 2021/22 | 2022/23 | |
|---|---|---|---|---|---|---|
| Drug costs for all biologics | $2,308M | $2,639M | $2,825M | $3,046M | $3,432M | $3,828M |
| Share of drug costs for biologics with biosimilars available | 31.3% | 29.6% | 26.1% | 37.6% | 32.9% | 28.0% |
| Share of drug costs for biosimilars | 1.8% | 3.1% | 5.2% | 8.4% | 11.1% | 13.2% |
| Number of biologic medicines with biosimilars available | 4 | 5 | 5 | 10 | 12 | 12 |
Data source: National Prescription Drug Utilization Information System Database, Canadian Institute for Health Information.
For more information on the market distribution of biosimilars and their originator biologics in each of the NPDUIS public drug plans, see Appendix A.
Drug-Mix Effect
Shifts in use between lower- and higher-cost drugs pushed overall cost levels for the NPDUIS drug plans up by 7.1% ($769 million) in 2022/23.
Figure 2.6 reports the 10 medicines that made the greatest contribution to the drug-mix effect in 2022/23, together accounting for an upward push of 5.9% on overall drug costs. Four medicines made their first appearance on this list in 2022/23: apalutamide (Erleada), acalabrutinib (Calquence), tafamidis (Vyndaqel), and dapagliflozin (Forxiga). These medicines received their respective market authorizations from Health Canada between three and eight years prior.
Elexacaftor/tezacaftor/ivacaftor (Trikafta), a fixed-dose combination medication to treat cystic fibrosis (CF), topped the list after just two years on the market, driven by its extra high treatment cost (over $200k annually) and rapidly increasing usage. Three antidiabetics—semaglutide (Ozempic), empagliflozin (Jardiance), and dapagliflozin (Forxiga)—ranked among the list of high-impact drugs, collectively contributing 1.8% to the growth in drug costs. In-depth examinations of new antidiabetic drugs can be found in the previous edition of this report and in the NPDUIS research initiative’s Market Intelligence Report: Antidiabetic Drugs, 2012-2021 available on the Canada.ca website. Five of the other top contributors were high-cost drugs with average annual treatment costs ranging from $18,426 to $121,279, including one nonsteroidal antiandrogen, one oral oncology product, one nervous system drug, and two immunosuppressants. The highuse ophthalmological drug aflibercept (Eylea) maintained its status as a high-impact medication on the list.
The share of total drug costs for each of the top contributors is reported in the table accompanying Figure 2.6. Note that this value differs from the contribution to the drug-mix effect, which measures the growth (increase or decrease in costs over time) rather than the costs themselves.
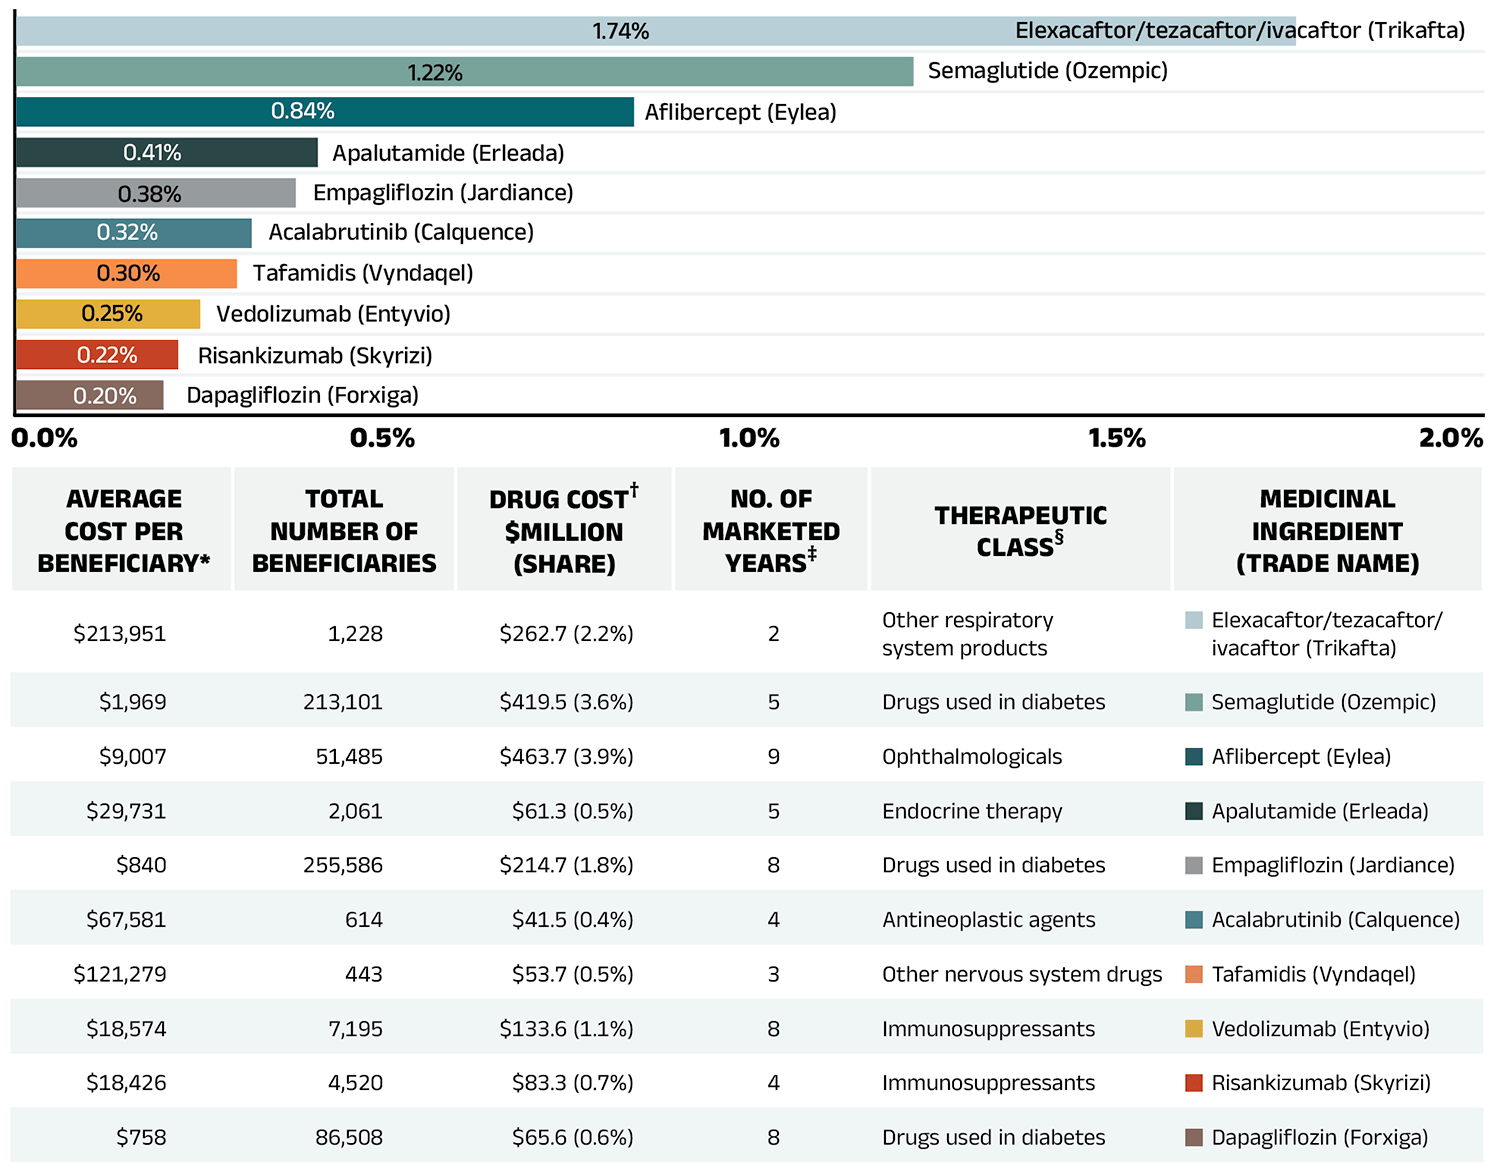
Figure 2.6 – Text version
| Average cost per beneficiary* | Total number of beneficiaries | Drug cost†, in millions of dollars and as a percent share | Number of marketed years‡ | Therapeutic class§ | Medicinal ingredient (trade name) |
Contribution to the drug-mix effect |
|---|---|---|---|---|---|---|
| $213,951 | 1,228 | $262.7 (2.2%) | 2 | Other respiratory system products | Elexacaftor/tezacaftor/ivacaftor (Trikafta) | 1.74% |
| $1,969 | 213,101 | $419.5 (3.6%) | 5 | Drugs used in diabetes | Semaglutide (Ozempic) | 1.22% |
| $9,007 | 51,485 | $463.7 (3.9%) | 9 | Ophthalmologicals | Aflibercept (Eylea) | 0.84% |
| $29,731 | 2,061 | $61.3 (0.5%) | 5 | Endocrine therapy | Apalutamide (Erleada) | 0.41% |
| $840 | 255,586 | $214.7 (1.8%) | 8 | Drugs used in diabetes | Empagliflozin (Jardiance) | 0.38% |
| $67,581 | 614 | $41.5 (0.4%) | 4 | Antineoplastic agents | Acalabrutinib (Calquence) | 0.32% |
| $121,279 | 443 | $53.7 (0.5%) | 3 | Other nervous system drugs | Tafamidis (Vyndaqel) | 0.30% |
| $18,574 | 7,195 | $133.6 (1.1%) | 8 | Immunosuppressants | Vedolizumab (Entyvio) | 0.25% |
| $18,426 | 4,520 | $83.3 (0.7%) | 4 | Immunosuppressants | Risankizumab (Skyrizi) | 0.22% |
| $758 | 86,508 | $65.6 (0.6%) | 8 | Drugs used in diabetes | Dapagliflozin (Forxiga) | 0.20% |
* The average cost per beneficiary may not represent the cost of a complete year of treatment.
† All of the top contributors to the push effect are associated with product listing agreements (PLAs) from pCPA negotiations for one or multiple indications; however, reported drug costs do not reflect price reductions resulting from confidential PLAs.
‡ The number of years since the drug was authorized for market by Health Canada, as of 2021/22.
§ The therapeutic class is based on ATC level 2. Jurisdictions that have special programs for ophthalmological drugs are not captured in the results.
Data source: National Prescription Drug Utilization Information System Database, Canadian Institute for Health Information.
A growing number of high-cost drugs have been reimbursed by NPDUIS public plans in recent years, often targeting relatively small patient populations. The number of medicines with an average annual cost per beneficiary exceeding $10,000 increased from 106 in 2017/18 to 158 in 2022/23. Similarly, the number of medicines costing over $25,000 annually increased from 58 to 93 during the same period. These high-cost drugs respectively accounted for 31.4% and 18.8% of the overall NPDUIS drug costs in 2017/18. By 2022/23, their respective shares increased to 37.4% and 20.5%. Despite the cost growth in these categories, drugs exceeding $10,000 per year were used by only 3.0% of active beneficiaries, and drugs over $25,000 were used by a mere 0.9%.
Among the highest cost bands ($50,000 and above), the collective share of total drug costs ranged between 9.0% and 12.1%, the steepest rise was in the top cost band—drugs exceeding $100,000 annually. The number of these drugs grew from 9 in 2017/18 to 25 in 2022/23, with their share of total drug costs rising fivefold, from 1.0% to 5.1%.
Figure 2.7 reports on trends in the market for high-cost drugs from 2017/18 to 2022/23 by average annual drug cost per active beneficiary determined at the medicinal ingredient level: $10,000–$25,000; $25,000–$50,000; $50,000–$100,000; and $100,000 or more.
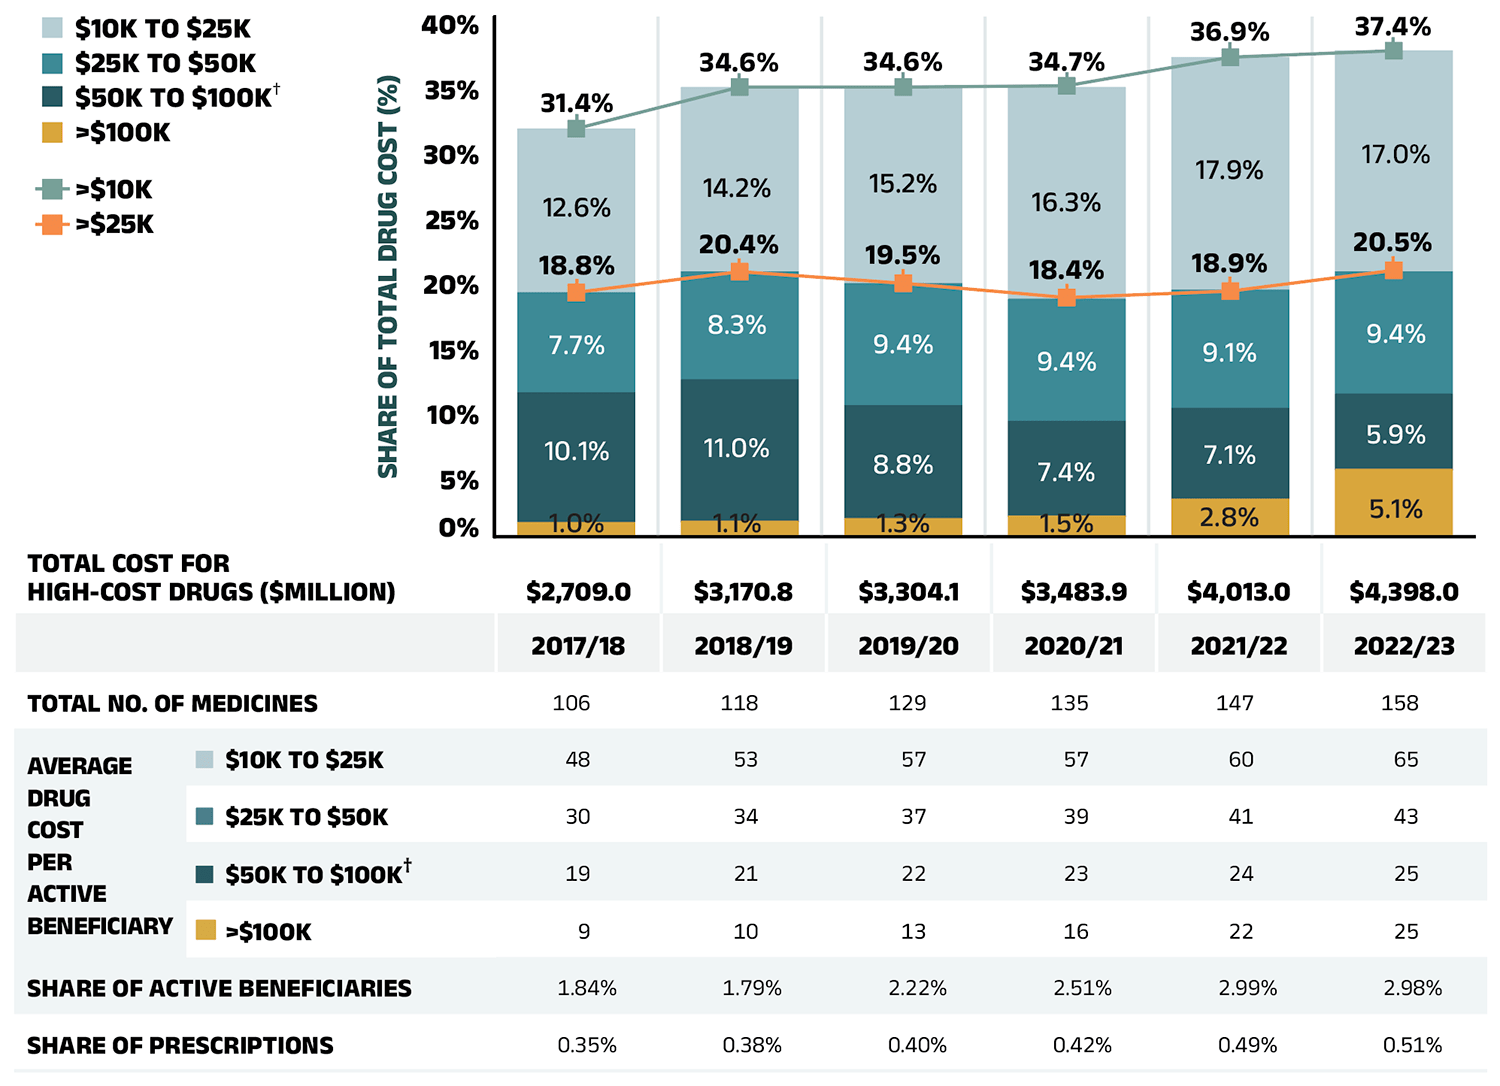
Figure 2.7 – Text version
| Share of total drug cost for drugs over $100,000 | Share of total drug cost for drugs $50,000 to $100,000 | Share of total drug cost for drugs $25,000 to $50,000 | Share of total drug cost for drugs $10,000 to $25,000 | Share of total drug cost for drugs over $25,000 | Share of total drug cost for drugs over $10,000 | |
|---|---|---|---|---|---|---|
| 2017/18 | 1.0% | 10.1% | 7.7% | 12.6% | 18.8% | 31.4% |
| 2018/19 | 1.1% | 11.0% | 8.3% | 14.2% | 20.4% | 34.6% |
| 2019/20 | 1.3% | 8.8% | 9.4% | 15.2% | 19.5% | 34.6% |
| 2020/21 | 1.5% | 7.4% | 9.4% | 16.3% | 18.4% | 34.7% |
| 2021/22 | 2.8% | 7.1% | 9.1% | 17.9% | 18.9% | 36.9% |
| 2022/23 | 5.1% | 5.91% | 9.4% | 17.0% | 20.5% | 37.4% |
| 2017/18 | 2018/19 | 2019/20 | 2020/21 | 2021/22 | 2022/23 | |
|---|---|---|---|---|---|---|
| Total cost for high-cost drugs (millions of dollars) | $2,709.0 | $3,170.8 | $3,304.1 | $3,483.9 | $4,013.0 | $4,398.0 |
| Total number of medicines | 106 | 118 | 129 | 135 | 147 | 158 |
| Average drug cost per active beneficiary - $10K to $25K | 48 | 53 | 57 | 57 | 60 | 65 |
| Average drug cost per active beneficiary - $25K to $50K | 30 | 34 | 37 | 39 | 41 | 43 |
| Average drug cost per active beneficiary - $50K to $100K† | 19 | 21 | 22 | 23 | 24 | 25 |
| Average drug cost per active beneficiary - >$100K | 9 | 10 | 13 | 16 | 22 | 25 |
| Share of active beneficiaries | 1.84% | 1.79% | 2.22% | 2.51% | 2.99% | 2.98% |
| Share of prescriptions | 0.35% | 0.38% | 0.40% | 0.42% | 0.49% | 0.51% |
Note: Results may be underestimated, as some high-cost drugs are reimbursed through special public drug plan programs that are not captured in the NPDUIS data. The methodology for this analysis was revised for the 2018/19 report; as such, historical results may not match those reported in previous editions.
* Average annual drug costs per active beneficiary exceeding $10,000.
† Including direct-acting antiviral (DAA) drugs used in the treatment of hepatitis C.
Data source: National Prescription Drug Utilization Information System Database, Canadian Institute for Health Information.
Figure 2.8 provides a breakdown of the share of high-cost drugs by jurisdiction in 2022/23. The proportion of total drug costs attributed to high-cost drugs (over $10,000 annually) varied across NPDUIS public plans, ranging from 22.2% in Yukon to 62.0% in Manitoba. These drugs accounted for a greater share of costs in income- and premium-based programs, such as those in Manitoba and Saskatchewan. These types of programs require beneficiaries to be responsible for a portion of prescription costs, either as a percentage of income or a premium, leading to higher public plan spending on beneficiaries with higher overall costs, including high-cost drugs.
When examining drugs costing over $25,000 annually, jurisdictional variations are more influenced by coverage structures and data limitations, particularly for oral oncology medicines, which often fall within this range. For example, in Ontario and the Atlantic provinces, these medicines are largely captured in the data and drugs exceeding $25,000 annually represent over 20% of drug costs. In other jurisdictions (e.g., British Columbia, Alberta), many of these drugs are reimbursed through specialized programs, such as cancer care, that are not captured in the NPDUIS database, resulting in a lower cost share (under 20%) for this category.
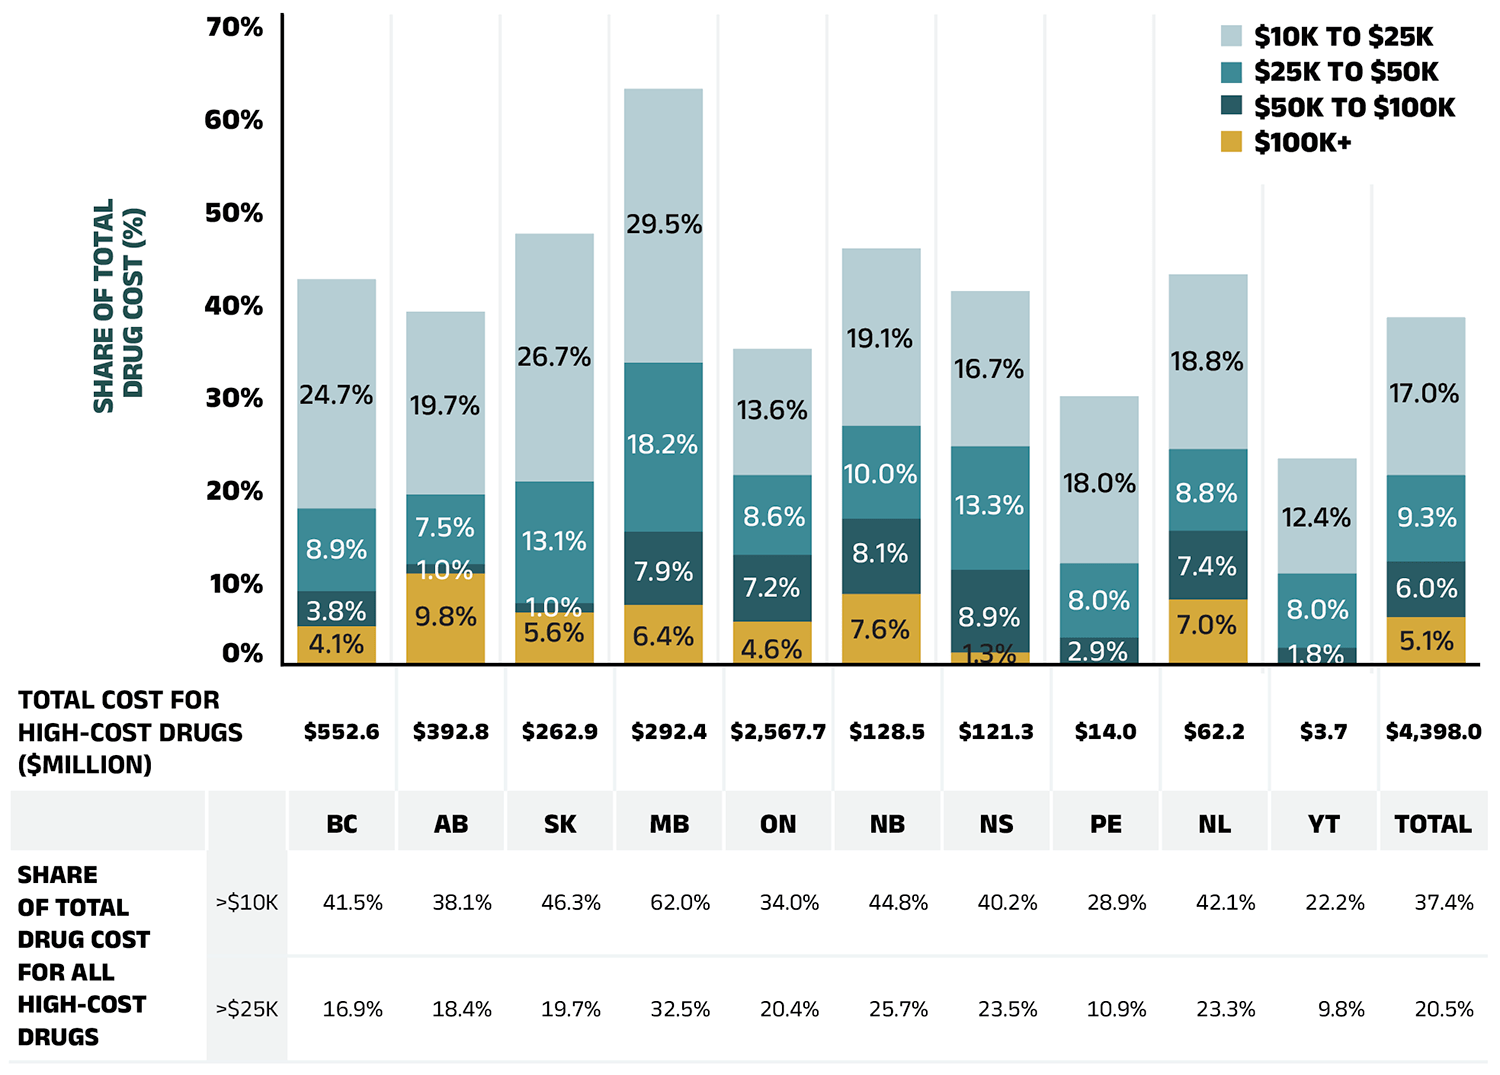
Figure 2.8 – Text version
| British Columbia | Alberta | Saskatchewan | Manitoba | Ontario | New Brunswick | Nova Scotia | Prince Edward Island | Newfoundland and Labrador | Yukon | Total | |
|---|---|---|---|---|---|---|---|---|---|---|---|
| Total drug cost for all high-cost drugs, in millions of dollars | $552.6 | $392.8 | $262.9 | $292.4 | $2,567.7 | $128.5 | $121.3 | $14.0 | $62.2 | $3.7 | $4,398.0 |
| Share of total drug cost for high-cost drugs over $10,000 | 41.5% | 38.1% | 46.3% | 62.0% | 34.0% | 44.8% | 40.2% | 28.9% | 42.1% | 22.2% | 37.4% |
| Share of total drug cost for high-cost drugs over $25,000 | 16.9% | 18.4% | 19.7% | 32.5% | 20.4% | 25.7% | 23.5% | 10.9% | 23.3% | 9.8% | 20.5% |
| Share of total drug cost for high-cost drugs $10,000 to $25,000 | 24.7% | 19.7% | 26.7% | 29.5% | 13.6% | 19.1% | 16.7% | 18.0% | 18.8% | 12.4% | 17.0% |
| Share of total drug cost for high-cost drugs $25,000 to $50,000 | 8.9% | 7.5% | 13.1% | 18.2% | 8.6% | 10.0% | 13.3% | 8.0% | 8.8% | 8.0% | 9.3% |
| Share of total drug cost for high-cost drugs $50,000 to $100,000 | 3.8% | 1.0% | 1.0% | 7.9% | 7.2% | 8.1% | 8.9% | 2.9% | 7.4% | 1.8% | 6.0% |
| Share of total drug cost for high-cost drugs $100,000 and over | 4.1% | 9.8% | 5.6% | 6.4% | 4.6% | 7.6% | 1.3% | - | 7.0% | - | 5.1% |
Note: Results may be underestimated, as some high-cost drugs are reimbursed through special public drug plan programs that are not captured in the NPDUIS data.
* Average annual drug costs per active beneficiary exceeding $10,000.
Data source: National Prescription Drug Utilization Information System Database, Canadian Institute for Health Information.
NPDUIS public plans paid the majority of drug costs for the relatively small number of high-cost beneficiaries that accounted for 62% of total drug costs in 2022/23. As shown in Figure 1.2, NPDUIS public plans paid an average of 88% of total prescription costs in 2022/23, while the remaining 12% was paid by the beneficiaries either out of pocket or through a private insurer. To understand to what extent the plan-paid and beneficiary-paid portions of prescription costs are associated with the beneficiary’s total annual drug costs, Figure 2.9 provides a breakdown of the plan-paid share of NPDUIS drug plan expenditures by average beneficiary annual drug cost level in 2022/23. Beneficiaries are grouped into five cost tiers: less than $5,000; $5,000–$10,000; $10,000–$20,000; $20,000–$50,000; and $50,000 or more.
The figure shows that plans paid a larger portion of prescription costs for higher-cost beneficiaries. In 2022/23, the 7.6% of beneficiaries that had annual drug costs over $5,000 accounted for 62% of overall drug costs for the public plans. For beneficiaries in the highest cost band—those with annual costs over $50,000—the plan-paid share of costs ranged from 92% to nearly 100%.
There were considerable jurisdictional differences in plan-paid shares, associated with variations in plan design, eligibility, and other factors.
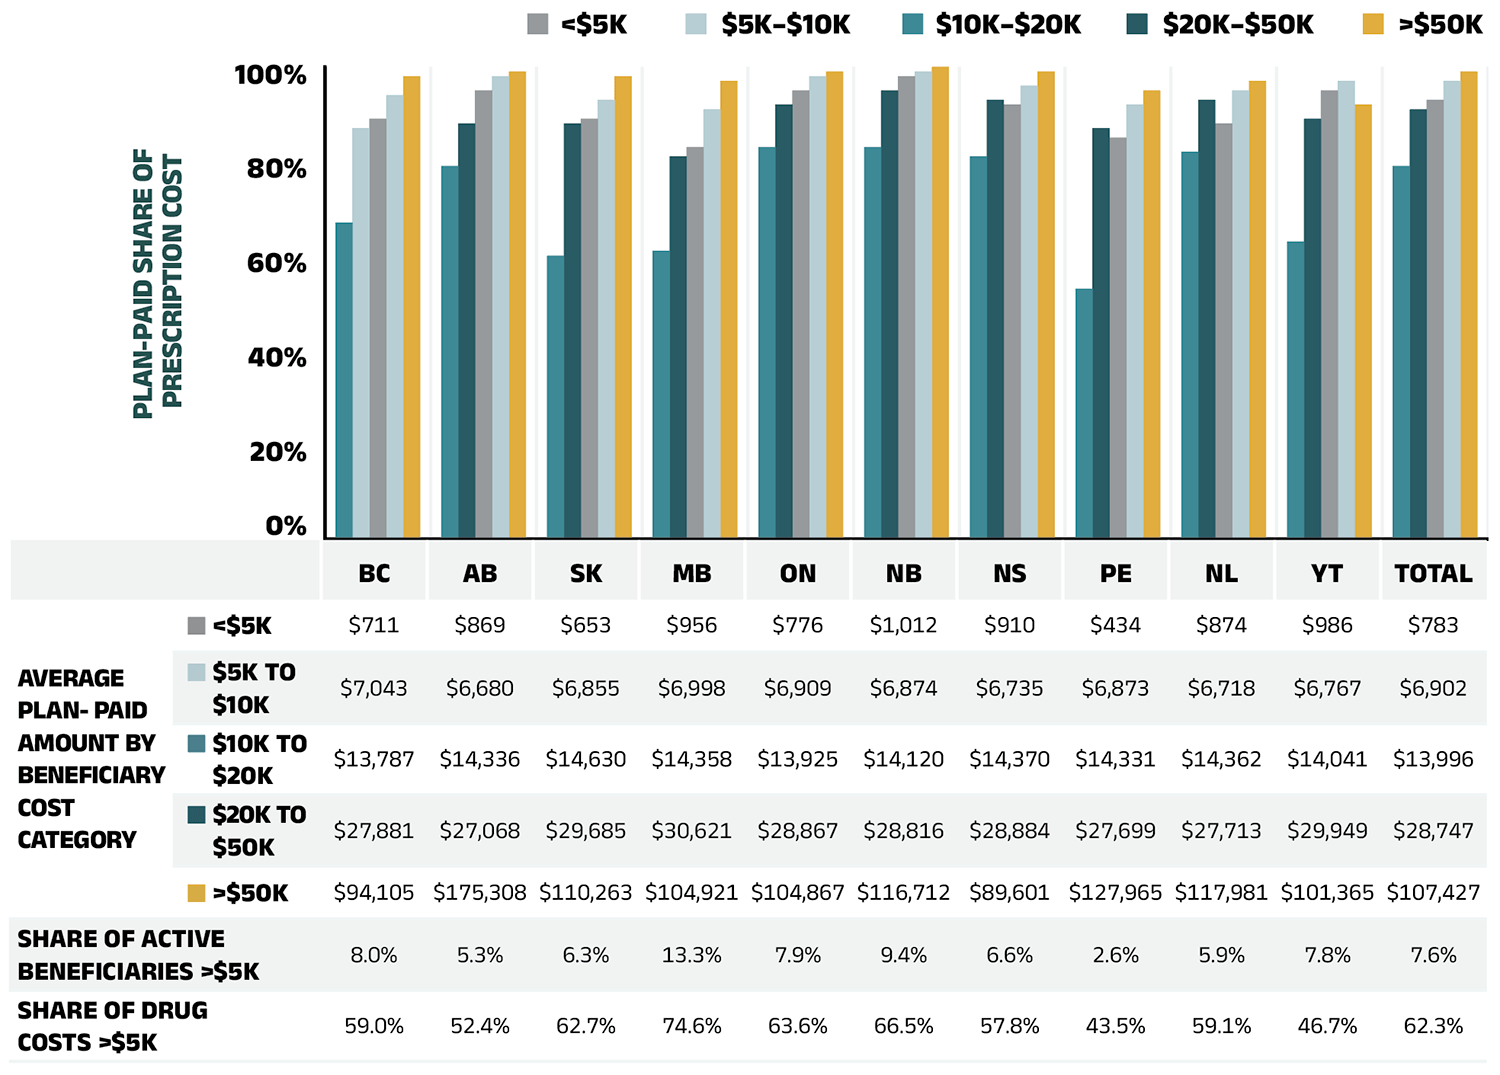
Figure 2.9 – Text version
| Average beneficiary annual drug cost | British Columbia | Alberta | Saskatchewan | Manitoba | Ontario | New Brunswick | Nova Scotia | Prince Edward Island | Newfoundland and Labrador | Yukon | Total | |
|---|---|---|---|---|---|---|---|---|---|---|---|---|
| Plan-paid share of prescription cost | Less than $5,000 | 67% | 79% | 60% | 61% | 83% | 83% | 81% | 53% | 82% | 63% | 79% |
| Plan-paid share of prescription cost | $5,000–$10,000 | 87% | 88% | 88% | 81% | 92% | 95% | 93% | 87% | 93% | 89% | 91% |
| Plan-paid share of prescription cost | $10,000–$20,000 | 89% | 95% | 89% | 83% | 95% | 98% | 92% | 85% | 88% | 95% | 93% |
| Plan-paid share of prescription cost | $20,000–$50,000 | 94% | 98% | 93% | 91% | 98% | 99% | 96% | 92% | 95% | 97% | 97% |
| Plan-paid share of prescription cost | Greater than $50,000 | 98% | 99% | 98% | 97% | 99% | 100% | 99% | 95% | 97% | 92% | 99% |
| Average beneficiary annual drug cost | British Columbia | Alberta | Saskatchewan | Manitoba | Ontario | New Brunswick | Nova Scotia | Prince Edward Island | Newfoundland and Labrador | Yukon | Total | |
|---|---|---|---|---|---|---|---|---|---|---|---|---|
| Average plan-paid amount | Less than $5,000 | $711 | $869 | $653 | $956 | $776 | $1,012 | $910 | $434 | $874 | $986 | $783 |
| Average plan-paid amount | $5,000–$10,000 | $7,043 | $6,680 | $6,855 | $6,998 | $6,909 | $6,874 | $6,735 | $6,873 | $6,718 | $6,767 | $6,902 |
| Average plan-paid amount | $10,000–$20,000 | $13,787 | $14,336 | $14,630 | $14,358 | $13,925 | $14,120 | $14,370 | $14,331 | $14,362 | $14,041 | $13,996 |
| Average plan-paid amount | $20,000–$50,000 | $27,881 | $27,068 | $29,685 | $30,621 | $28,867 | $28,816 | $28,884 | $27,699 | $27,713 | $29,949 | $28,747 |
| Average plan-paid amount | Greater than $50,000 | $94,105 | $175,308 | $110,263 | $104,921 | $104,867 | $116,712 | $89,601 | $127,965 | $117,981 | $101,365 | $107,427 |
| Share of active beneficiaries for drugs over $5,000 | 8.0% | 5.3% | 6.3% | 13.3% | 7.9% | 9.4% | 6.6% | 2.6% | 5.9% | 7.8% | 7.6% | |
| Share of drug costs over $5,000 | 59.0% | 52.4% | 62.7% | 74.6% | 63.6% | 66.5% | 57.8% | 43.5% | 59.1% | 46.7% | 62.3% | |
* Beneficiaries were categorized based on the amount that a drug program paid per year.
Data source: National Prescription Drug Utilization Information System Database, Canadian Institute for Health Information.
Table 2.2 reports the 10 highest-cost drugs reimbursed by the NPDUIS public plans in 2022/23 ranked by their average annual drug cost per active beneficiary. All 10 drugs were indicated to treat rare diseases and had treatment costs exceeding $300,000. Note that although Table 2.2 presents the overall results for all NPDUIS public drug plans, there are variations at the individual plan level.
Table 2.2 Top 10 drugs with the highest average annual drug cost per active beneficiary, NPDUIS public drug plans, 2022/23
| Medicinal ingredient (Trade name) | Therapeutic class, ATC level 2 | Average drug cost per beneficiary* | No. of marketed years† | No. of active beneficiaries‡ |
|---|---|---|---|---|
| Onasemnogene abeparvovec (Zolgensma) | Other drugs for disorders of the musculo-skeletal system |
$3,085,123 | 2 | <10 |
| Cerliponase alfa (Brineura) | Other alimentary tract and metabolism products | $695,118 | 4 | <10 |
| Elosulfase alfa (Vimizim) | Other alimentary tract and metabolism products | $639,146 | 9 | 19 |
| Asfotase alfa (Strensiq) | Other alimentary tract and metabolism products | $566,211 | 8 | <10 |
| Alglucosidase alfa (Myozyme) | Other alimentary tract and metabolism products | $495,702 | 17 | 25 |
| Eculizumab (Soliris) | Immunosuppressants | $461,060 | 14 | 138 |
| Patisiran (Onpattro) | Other nervous system drugs | $376,504 | 4 | 48 |
| Lanadelumab (Takhzyro) | Other hematological agents | $369,394 | 5 | 73 |
| Nusinersen (Spinraza) | Other drugs for disorders of the musculo-skeletal system | $326,043 | 6 | 62 |
| Inotersen (Tegsedi) | Other nervous system drugs | $313,511 | 4 | <10 |
Note: This list of drugs does not include high-cost drugs reimbursed through special programs, which are not captured in the NPDUIS data.
* Represents the total drug cost divided by the total number of beneficiaries and, thus, may include beneficiaries with incomplete treatment costs.
† The number of years since the drug was authorized for market by Health Canada, as of 2022/23.
‡ To safeguard patient privacy, drugs with fewer than 10 claimants are labeled “<10”.
Data source: National Prescription Drug Utilization Information System Database, Canadian Institute for Health Information.
Over the past few years, biologic medicines have captured an increasing share of the total drug costs for the NPDUIS public plans. In 2022/23, the biologics market share grew by 11.3% to reach 32.6% ($3.8 billion) of total drug costs. The top four biologic medicines—aflibercept (Eylea), semaglutide (Ozempic), infliximab (Remicade and biosimilars), and adalimumab (Humira and biosimilars)— were responsible for 13.2% of total NPDUIS drug costs. While the top ten biologic medicines accounted for 20% of the overall NPDUIS drug costs in 2022/23, they represented less than 10% of active beneficiaries.
Figure 2.10 reports on trends in the biologic share of total drug costs for the NPDUIS public drug plans, along with the growth in drug costs for this market segment and the current list of top 10 biologic medicines.
Saskatchewan and Manitoba had the highest levels of biologics-related costs relative to total drug costs in 2022/23 (44.6% and 42.1%, respectively), while Saskatchewan and Ontario had the highest rates of growth (13.9% and 13.2%, respectively).
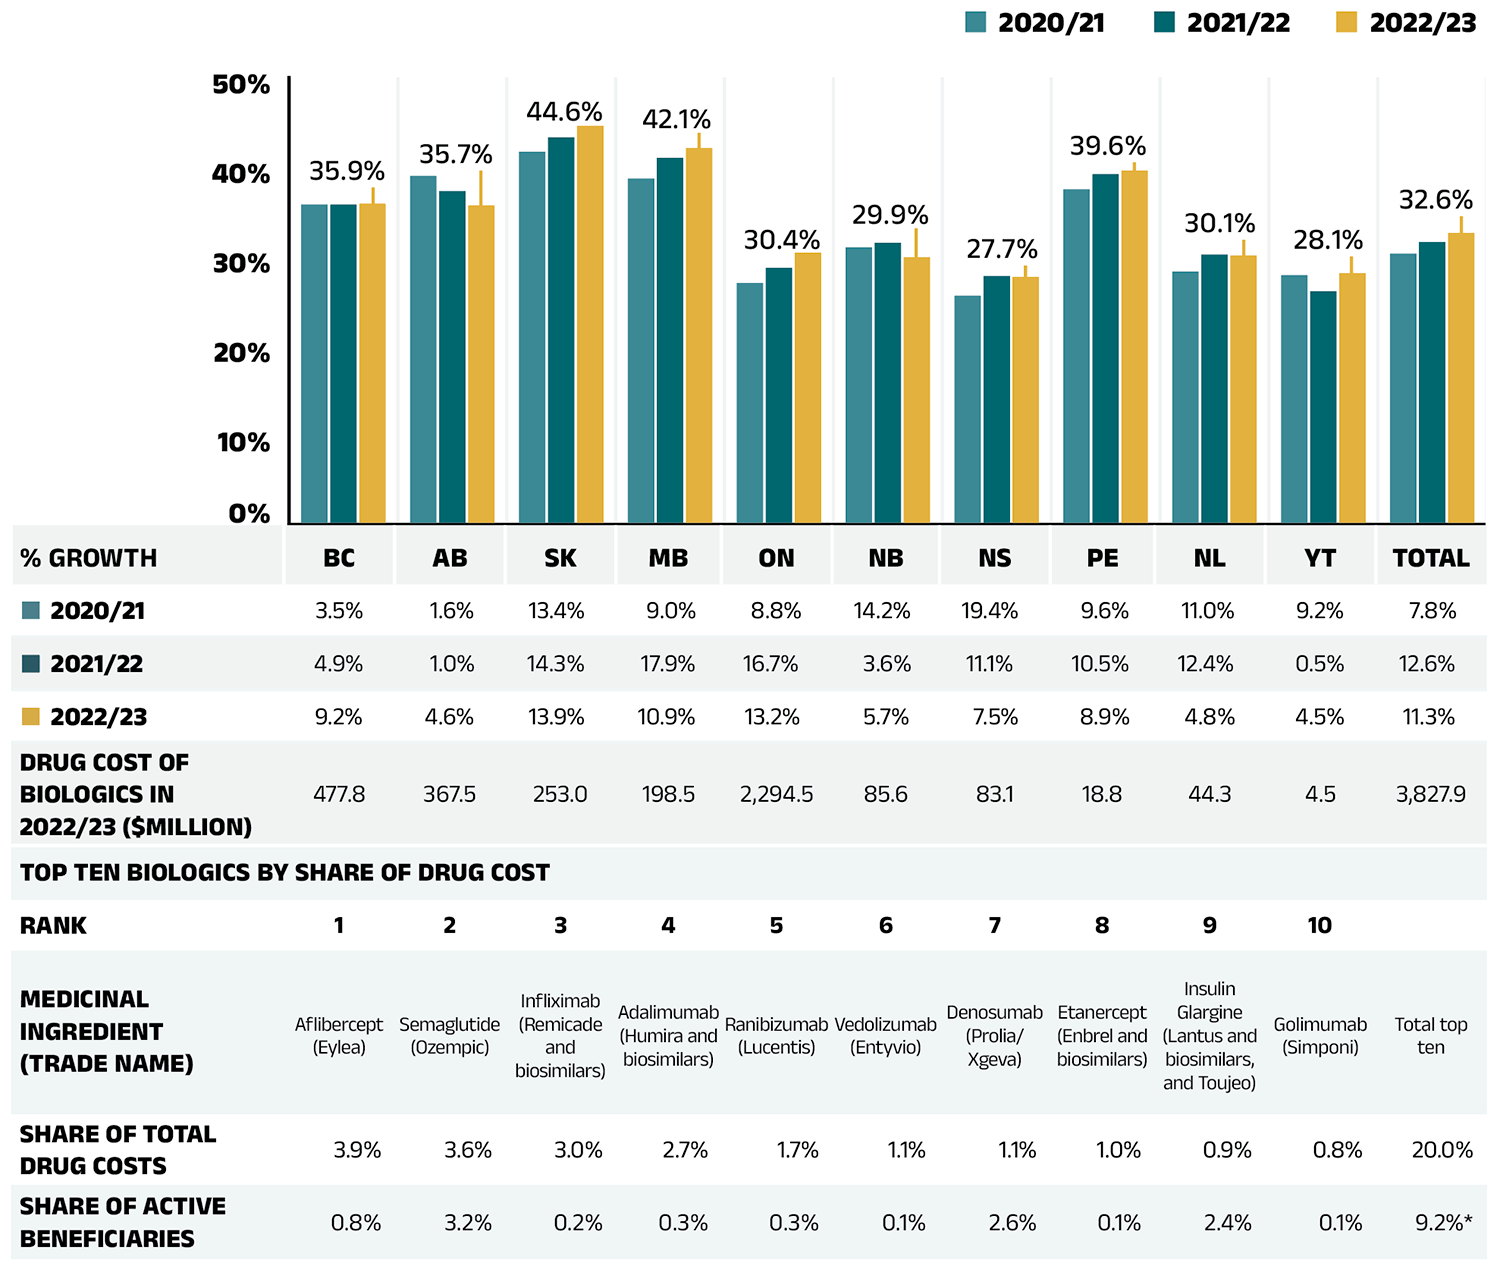
Figure 2.10 – Text version
| British Columbia | Alberta | Saskatchewan | Manitoba | Ontario | New Brunswick | Nova Scotia | Prince Edward Island | Newfoundland and Labrador | Yukon | Total | |
|---|---|---|---|---|---|---|---|---|---|---|---|
| Biologic share of total drug costs per year | |||||||||||
| 2020/21 | 35.8% | 39.0% | 41.7% | 38.7% | 27.0% | 31.0% | 25.6% | 37.5% | 28.3% | 27.9% | 30.3% |
| 2021/22 | 35.8% | 37.3% | 43.3% | 41.0% | 28.7% | 31.5% | 27.8% | 39.2% | 30.2% | 26.1% | 31.6% |
| 2022/23 | 35.9% | 35.7% | 44.6% | 42.1% | 30.4% | 29.9% | 27.7% | 39.6% | 30.1% | 28.1% | 32.6% |
| Percent growth | |||||||||||
| 2020/21 | 3.5% | 1.6% | 13.4% | 9.0% | 8.8% | 14.2% | 19.4% | 9.6% | 11.0% | 9.2% | 7.8% |
| 2021/22 | 4.9% | 1.0% | 14.3% | 17.9% | 16.7% | 3.6% | 11.1% | 10.5% | 12.4% | 0.5% | 12.6% |
| 2022/23 | 9.2% | 4.6% | 13.9% | 10.9% | 13.2% | 5.7% | 7.5% | 8.9% | 4.8% | 4.5% | 11.3% |
| Drug cost of biologics in 2021/22, in millions of dollars | 477.8 | 367.5 | 253 | 198.5 | 2,294.5 | 85.6 | 83.1 | 18.8 | 44.3 | 4.5 | 3,827.9 |
| Rank | Medicinal ingredient (trade name) | Share of total drug cost | Share of active beneficiaries |
|---|---|---|---|
| 1 | Aflibercept (Eylea) | 3.9% | 0.8% |
| 2 | Semaglutide (Ozempic) | 3.6% | 3.2% |
| 3 | Infliximab (Remicade and biosimilars) | 3.0% | 0.2% |
| 4 | Adalimumab (Humira and biosimilars) | 2.7% | 0.3% |
| 5 | Ranibizumab (Lucentis) | 1.7% | 0.3% |
| 6 | Vedolizumab (Entyvio) | 1.1% | 0.1% |
| 7 | Denosumab (Prolia/Xgeva) | 1.1% | 2.6% |
| 8 | Etanercept (Enbrel and biosimilars) | 1.0% | 0.1% |
| 9 | Insulin Glargine (Lantus and biosimilars, and Toujeo) | 0.9% | 2.4% |
| 10 | Golimumab (Simponi) | 0.8% | 0.1% |
| Total top 10 | 20.0% | 9.2%* | |
* For a given year, each active beneficiary who used any of the top biologics was only counted once; therefore, the share of total active beneficiaries may be lower than the sum of each biologic medicine’s share of active beneficiaries.
Data source: National Prescription Drug Utilization Information System Database, Canadian Institute for Health Information.
An analysis by therapeutic area shows that nearly 70% of the total drug costs in 2022/23 were concentrated in five classes. Antineoplastic and immunomodulating agents topped the list of therapeutic classes, the same as in 2017/18; however, they represented a significantly higher share of the total costs. This reflects an ongoing shift towards greater use of oral oncology medicines and immunomodulating drugs, which saw an increase in the number and share of prescriptions and patients during the period. Alimentary tract and metabolism medicines held the second-highest share of costs (16.2%), due in part to new antidiabetics. Nervous system medicines, which include relatively low-cost drugs used by a large number of active beneficiaries, represented a lower share of costs (11.3%) in 2022/23, primarily due to significant increases in other therapeutic areas. The cost share of anti-infectives for systemic use was largely influenced by changes in the use of direct-acting antiviral (DAA) drugs for the treatment of hepatitis C from 2017/18 to 2022/23.
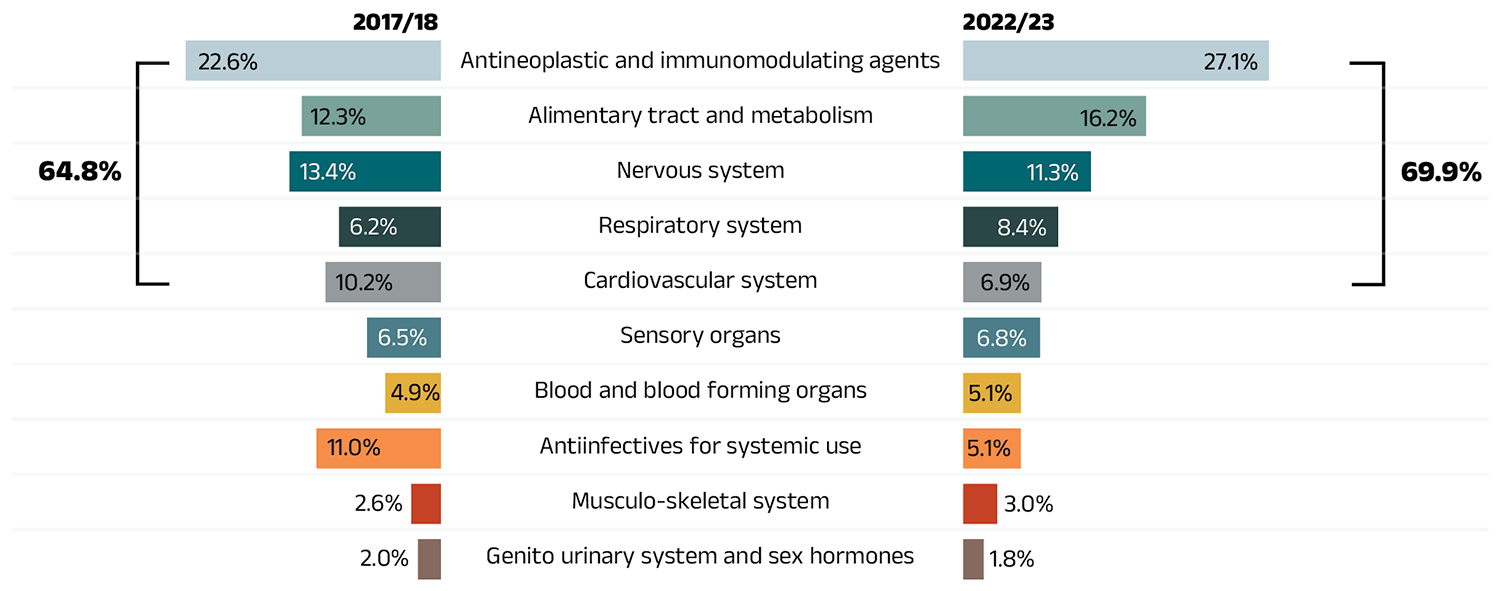
Figure 2.11 – Text version
| Top 10 therapeutic classes | Share of total drug costs, 2017/18 | Share of total drug costs for top 5 therapeutic classes, 2017/18 | Share of total drug costs, 2022/23 | Share of total drug costs for top 5 therapeutic classes, 2022/23 |
|---|---|---|---|---|
| Antineoplastic and immunomodulating agents | 22.6% | 64.8% | 27.1% | 69.9% |
| Alimentary tract and metabolism | 12.3% | 64.8% | 16.2% | 69.9% |
| Nervous system | 13.4% | 64.8% | 11.3% | 69.9% |
| Respiratory system | 6.2% | 64.8% | 8.4% | 69.9% |
| Cardiovascular system | 10.2% | 64.8% | 6.9% | 69.9% |
| Sensory organs | 6.5% | - | 6.8% | - |
| Blood and blood forming organs | 4.9% | - | 5.1% | - |
| Antiinfectives for systemic use | 11.0% | - | 5.1% | - |
| Musculo-skeletal system | 2.6% | - | 3.0% | - |
| Genito urinary system and sex hormones | 2.0% | - | 1.8% | - |
* Anatomical Therapeutic Chemical (ATC) classification system maintained by the World Health Organization.
Data source: National Prescription Drug Utilization Information System Database, Canadian Institute for Health Information.
3. The Drivers of Dispensing Costs, 2021/22 to 2022/23
The 4.5% growth in dispensing costs in 2022/23 marked a full recovery from the negligible growth observed in the previous two pandemic years (2020/21 to 2021/22). The demographic effect, driven by a significant post-pandemic rebound in the number of active beneficiaries, was the most pronounced driver, partially offset by a decline in the quantity of drugs dispensed per beneficiary. Higher average dispensing fees per prescription and a slight reduction in overall prescription size further contributed to cost growth in 2022/23.
Like drug costs, changes in dispensing costs are driven by a number of push (upward) and pull (downward) effects. The net effect of these opposing forces yields the overall rate of change.
Demographic effect: Changes in the number of active beneficiaries, as well as shifts in the age or gender distribution.
Drug volume effect: Changes in the number of units dispensed to patients.
Fee effect: Changes in the average dispensing fee per prescription.
Prescription size effect: Changes in the number of units dispensed per prescription.
In this section, a comprehensive cost driver analysis is used to determine how much public plan dispensing costs would have changed between 2021/22 and 2022/23 if only one factor (e.g., the average dispensing fee) was considered while all the others remained the same.Footnote XI
Figure 3.1 provides insight into the pressures driving changes in dispensing costs from 2017/18 to 2022/23. The demographic effect, after a 3.2% rebound in 2021/22 that reversed the pandemic-related decline in 2020/21, continued to push costs upward as active beneficiary numbers recovered. As in 2021/22, the demographic effect was the largest annual contributor to dispensing growth in 2022/23, pushing costs up by 5.1%.
However, the quantity of drugs dispensed per patient did not keep pace with the rise in active beneficiaries. Drug volume offset costs with a −2.2% pull-down effect in 2022/23.
Following pandemic-driven adjustments to temporary dispensing frequency policies in 2020/21 and 2021/22, overall prescription sizes remained steady, with a slight reduction contributing a 0.5% push to dispensing cost growth in 2022/23. Changes in the average dispensing fee per prescription further increased dispensing costs by 1.0% in 2022/23.
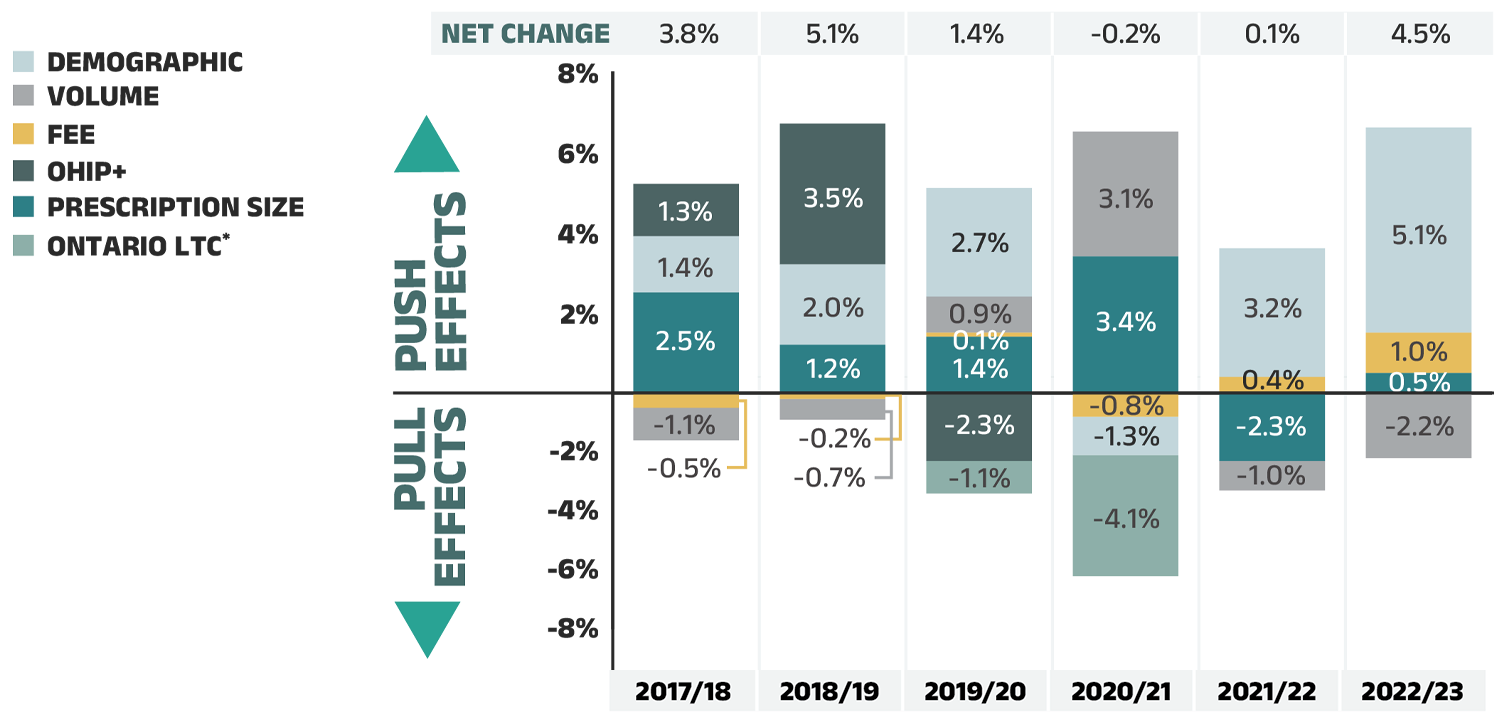
Figure 3.1 – Text version
| 2017/18 | 2018/19 | 2019/20 | 2020/21 | 2021/22 | 2022/23 | |
|---|---|---|---|---|---|---|
| Prescription size | 2.5% | 1.2% | 1.4% | 3.4% | -2.3% | 0.5% |
| Fee | -0.5% | -0.2% | 0.1% | -0.8% | 0.4% | 1.0% |
| Volume | -1.1% | -0.7% | 0.9% | 3.1% | -1.0% | -2.2% |
| Demographic | 1.4% | 2.0% | 2.7% | -1.3% | 3.2% | 5.1% |
| OHIP+ | 1.3% | 3.5% | -2.3% | - | - | - |
| Ontario long-term care* | - | - | -1.1% | -4.1% | - | - |
| Net Change | 3.8% | 5.1% | 1.4% | -0.2% | 0.1% | 4.5% |
Note: Values may not add to totals due to rounding and the cross effect.
* Long-term care (LTC) prescriptions in Ontario are excluded from the dispensing costs analysis for most years, as their dispensing differs from those of the general beneficiary population. However, they were added as a separate factor in 2019/20 and 2020/21 to reflect the overall impact of the introduction of a capitation funding model to the LTC sub-program in January 2020.
Data source: National Prescription Drug Utilization Information System Database, Canadian Institute for Health Information.
The overall rate of change in dispensing costs varied widely among individual plans, though all showed positive growth, from a high of 12.3% in Yukon to a low of 0.3% in New Brunswick (Figure 3.2). The high growth in Yukon was driven by a significant increase in the average dispensing fee per prescription from 2021/22 to 2022/23. In New Brunswick, the cost pressure from the rebound in active beneficiaries was nearly offset by the combined pull-down effects of a decline in quantity of drugs dispensed per patient and an increase in overall prescription size. In other jurisdictions, dispensing costs growth was more moderate, ranging between 2% and 6%.
Long-term care (LTC) prescriptions were separated out from Ontario results in this cost driver analysis. The implementation of a LTC capitation funding model had a significant impact during 2019/20 and 2020/21. However, the program has now stabilized and has a negligible contribution to the rate of change in Ontario dispensing costs. As a result, LTC prescriptions are not displayed as of 2021/22 in Figure 3.2. For historical data, please consult previous editions.
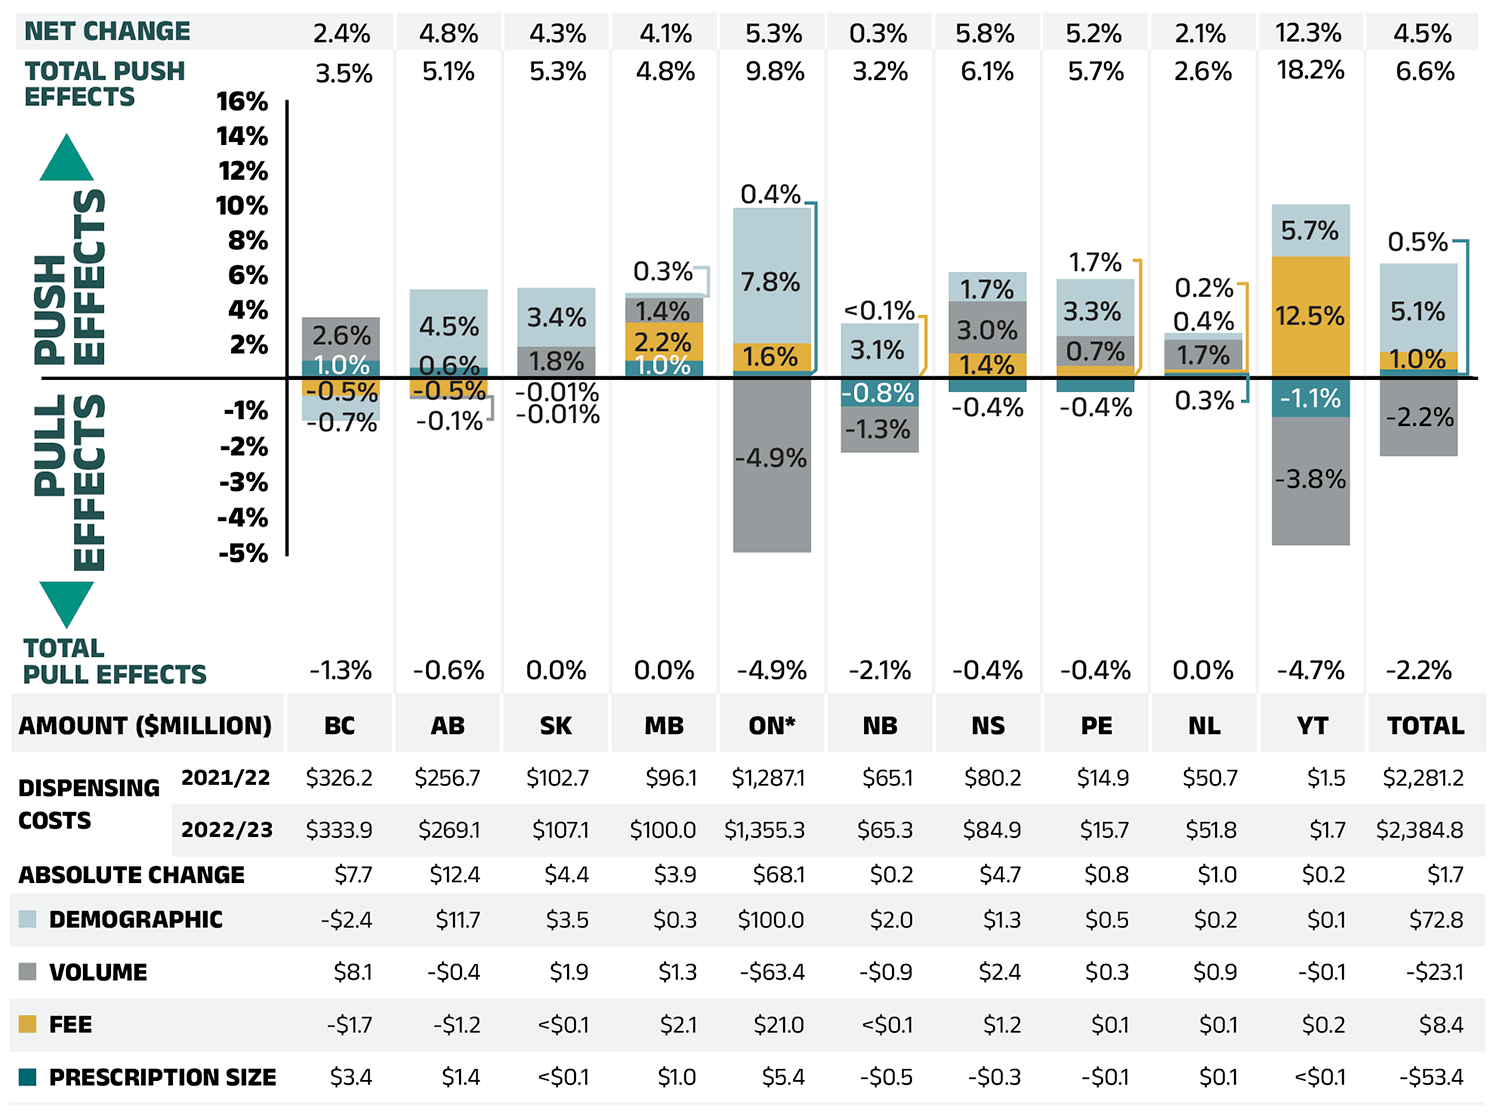
Figure 3.2 – Text version
| British Columbia | Alberta | Saskatchewan | Manitoba | Ontario | New Brunswick | Nova Scotia | Prince Edward Island | Newfoundland and Labrador | Yukon | Total | |
|---|---|---|---|---|---|---|---|---|---|---|---|
| Demographic | -0.7% | 4.5% | 3.4% | 0.3% | 7.8% | 3.1% | 1.7% | 3.3% | 0.4% | 3.0% | 5.1% |
| Volume | 2.5% | -0.1% | 1.8% | 1.4% | -4.9% | -1.3% | 3.0% | 1.7% | 1.7% | -3.6% | -2.2% |
| Fee | -0.5% | -0.5% | -0.01% | 2.2% | 1.6% | 0.04% | 1.4% | 0.7% | 0.2% | 7.0% | 1.0% |
| Prescription size | 1.0% | 0.6% | -0.01% | 1.0% | 0.4% | -0.8% | -0.4% | -0.4% | 0.3% | -1.1% | 0.5% |
| Total push effect | 4% | 5% | 5% | 5% | 10% | 3% | 6% | 6% | 3% | 18% | 7% |
| Total pull effect | -1% | -1% | 0% | 0% | -5% | -2% | 0% | 0% | 0% | -5% | -2% |
| Net change | 2% | 5% | 4% | 4% | 5% | 0% | 6% | 5% | 2% | 12% | 5% |
Amount in millions of dollars
| British Columbia | Alberta | Saskatchewan | Manitoba | Ontario | New Brunswick | Nova Scotia | Prince Edward Island | Newfoundland and Labrador | Yukon | Total | |
|---|---|---|---|---|---|---|---|---|---|---|---|
| Dispensing costs, 2021/22 | $326.20 | $256.70 | $102.70 | $96.10 | $1,287.10 | $65.10 | $80.20 | $14.90 | $50.70 | $1.50 | $2,281.20 |
| Dispensing costs, 2022/23 | $333.90 | $269.10 | $107.10 | $100.00 | $1,355.30 | $65.30 | $84.90 | $15.70 | $51.80 | $1.70 | $2,384.80 |
| Absolute change | $7.70 | $12.40 | $4.40 | $3.90 | $68.10 | $0.20 | $4.70 | $0.80 | $1.00 | $0.20 | $1.70 |
| Demographic | -$2.40 | $11.70 | $3.50 | $0.30 | $100.00 | $2.00 | $1.30 | $0.50 | $0.20 | $0.10 | $72.80 |
| Volume | $8.10 | -$0.40 | $1.90 | $1.30 | -$63.40 | -$0.90 | $2.40 | $0.30 | $0.90 | -$0.10 | -$23.10 |
| Fee | -$1.70 | -$1.20 | <$0.1 | $2.10 | $21.01 | <$0.1 | $1.20 | $0.10 | $0.10 | $0.20 | $8.40 |
| Prescription size | $3.40 | $1.40 | <$0.1 | $1.00 | $5.40 | -$0.50 | -$0.30 | -$0.10 | $0.10 | <$0.1 | -$53.40 |
Note: Values may not add to totals due to rounding and the cross effect.
* In Ontario, the long-term care (LTC) prescriptions were excluded from the dispensing costs as their dispensing differs from those of the general beneficiary population. The LTC sub-program contributed less than 0.1% to the total change in dispensing costs for all NPDUIS public plans.
Data source: National Prescription Drug Utilization Information System Database, Canadian Institute for Health Information.
The contribution of fee per prescription is directly related to the reimbursement policies of each public drug plan.
In 2022/23, most NPDUIS drug plans had increases in the average dispensing fee per prescription ranging from 0.2% to 12.5%. British Columbia and Alberta had modest decreases. Over the past five years, Yukon and Nova Scotia have had a relatively high growth in fees, with compound annual growth rates of 5.9% and 1.5%, respectively.
Table 3.1 reports the average dispensing fee per prescription from 2017/18 to 2022/23, along with the rate of growth between 2021/22 and 2022/23 and the compound annual growth rate for the entire period. The results are an average across all prescriptions and include a range of dispensing fees.
Various plans have specific policies in place related to dispensing frequency and compensation. The average dispensing fee per prescription is also related to prescription size: plans with lower average dispensing fees generally reimburse prescriptions with shorter days’ supply and vice versa. British Columbia, Ontario, and Manitoba, which had some of the lowest dispensing fees in 2022/23, generally reimbursed prescriptions with relatively small average sizes. Decreases in the average days’ supply per prescription can exert an upward pressure on dispensing costs, as a greater number of prescriptions are required to dispense the same volume of drugs, while increases in average days’ supply have the reverse effect. An overview of the dispensing fee policies of NPDUIS public drug plans is available on CIHI’s website.Footnote 2
Table 3.1 Average dispensing fee per prescription, NPDUIS public drug plans, 2017/18 to 2022/23
| Jurisdiction | 2017/18 | 2018/19 | 2019/20 | 2020/21 | 2021/22 | 2022/23 | Growth rate, 2021/22 to 2022/23* |
CAGR†, 2017/18 to 2022/23 |
|---|---|---|---|---|---|---|---|---|
| British Columbia | $7.18 | $7.13 | $7.10 | $7.03 | $6.97 | $6.94 | -0.50% | -0.70% |
| Alberta | $14.45 | $14.18 | $14.11 | $13.96 | $14.18 | $14.11 | -0.50% | -0.50% |
| Saskatchewan | $10.92 | $10.92 | $11.04 | $11.09 | $11.25 | $11.25 | <0.1% | 0.60% |
| Manitoba | $8.82 | $8.19 | $8.24 | $8.58 | $8.68 | $8.87 | 2.20% | 0.10% |
| Ontario‡ | $7.55 | $7.58 | $7.58 | $7.52 | $7.53 | $7.65 | 1.60% | 0.30% |
| New Brunswick | $10.48 | $10.43 | $10.48 | $10.50 | $10.50 | $10.50 | <0.1% | 0.00% |
| Nova Scotia | $11.32 | $11.48 | $11.67 | $11.87 | $12.05 | $12.22 | 1.40% | 1.50% |
| Prince Edward Island | $11.23 | $11.38 | $11.42 | $11.54 | $11.52 | $11.60 | 0.70% | 0.60% |
| Newfoundland and Labrador | $12.38 | $12.41 | $12.37 | $12.14 | $12.20 | $12.23 | 0.20% | -0.20% |
| Yukon | $5.81 | $5.76 | $7.16 | $5.83 | $6.87 | $7.72 | 12.50% | 5.90% |
* Corresponds to the “Fee effect” of dispensing costs shown in Figure 3.2.
† Compound annual growth rate.
‡ Ontario long-term care (LTC) sub-plan prescriptions were excluded from this analysis as their dispensing differs from those of the general beneficiary population.
Data source: National Prescription Drug Utilization Information System Database, Canadian Institute for Health Information.
Figure 3.3 shows the trend in average days’ supply per prescription from 2017/18 to 2022/23. The results represent the average across all prescriptions for oral solid formulations and encompass brand-name and generic medicines for both acute and maintenance therapies. Pandemic-driven adjustments to dispensing frequency policies were associated with a sizable decline in days’ supply per prescription in Alberta and Nova Scotia in 2020/21. Average days’ supply per prescription were mostly stable from 2021/22 to 2022/23, with slight declines in most public drug plans.
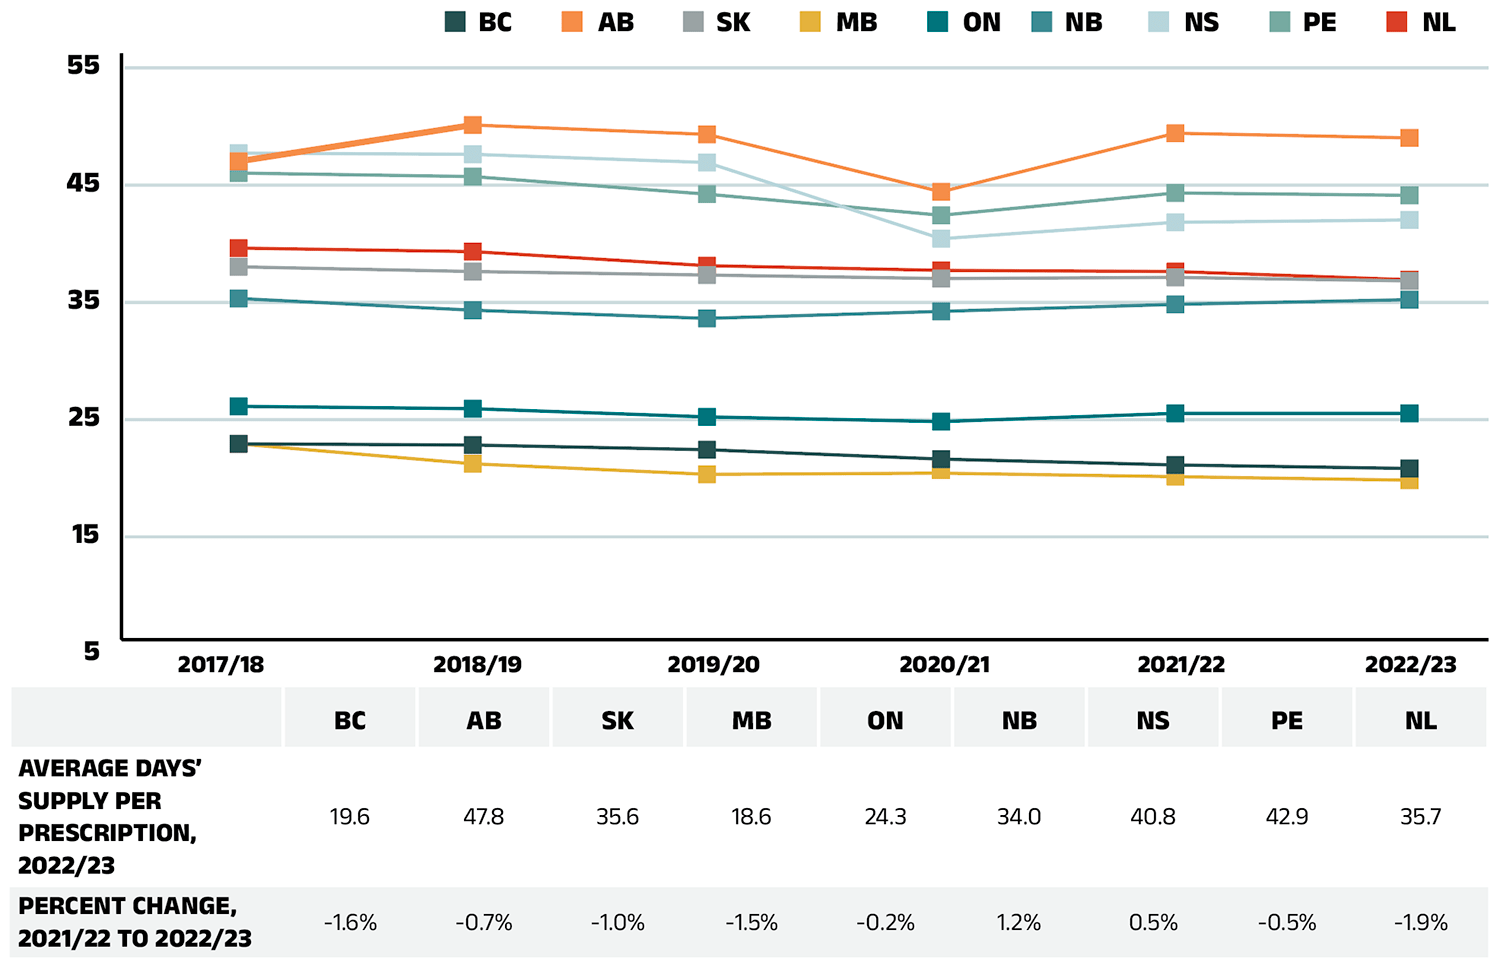
Figure 3.3 – Text version
| 2017/18 | 2018/19 | 2019/20 | 2020/21 | 2021/22 | 2022/23 | Percent change, 2021/22 to 2022/23 |
|
|---|---|---|---|---|---|---|---|
| British Columbia | 21.7 | 21.6 | 21.2 | 20.4 | 19.9 | 19.6 | -1.6% |
| Alberta | 45.8 | 48.9 | 48.1 | 43.2 | 48.2 | 47.8 | -0.7% |
| Saskatchewan | 36.8 | 36.4 | 36.1 | 35.8 | 35.9 | 35.6 | -1.0% |
| Manitoba | 21.7 | 20.0 | 19.1 | 19.2 | 18.9 | 18.6 | -1.5% |
| Ontario | 24.9 | 24.7 | 24.0 | 23.6 | 24.3 | 24.3 | -0.2% |
| New Brunswick | 34.1 | 33.1 | 32.4 | 33.0 | 33.6 | 34.0 | 1.2% |
| Nova Scotia | 46.5 | 46.4 | 45.7 | 39.2 | 40.6 | 40.8 | 0.5% |
| Prince Edward Island | 44.8 | 44.5 | 43.0 | 41.2 | 43.1 | 42.9 | -0.5% |
| Newfoundland and Labrador | 38.4 | 38.1 | 36.9 | 36.5 | 36.4 | 35.7 | -1.9% |
Note: The analysis was limited to data for oral solid formulations. Yukon is not reported due to data limitations.
Data source: National Prescription Drug Utilization Information System Database, Canadian Institute for Health Information.
Although the average days’ supply and dispensing fee per prescription are useful measures for comparison, the roster of medicines covered by each plan also factors into the average dispensing cost. Comparing the dispensing costs for the same suite of medicines can provide greater insight into the differences between plans.
Figure 3.4 compares the dispensing costs across jurisdictions for the generic medicines reduced to 10% (previously 18%) of their brand-name reference price through the 2018 pCPA–CGPA agreement. Dispensing costs for one million units (mostly tablets) of these medicines are given for two fiscal years: 2017/18 and 2022/23. These medicines collectively accounted for 18.5% and 20.0% of the total NPDUIS public drug plan dispensing costs in 2017/18 and 2022/23, respectively.
Dispensing costs for the select medicines were stable or increased between 2017/18 and 2022/23 in most provinces, although the size of the changes varied considerably. The highest rates of increase were observed in Manitoba and Prince Edward Island, while Alberta and New Brunswick experienced moderate decreases. In four NPDUIS public plans—British Columbia, Saskatchewan, Manitoba, and Newfoundland and Labrador—dispensing costs for one million units exceeded $200,000 in both 2017/18 and 2022/23. Notably, Manitoba led all jurisdictions, with dispensing costs exceeding $300,000 for one million tablets.
While the same drugs were studied across all plans, the disease profile of the beneficiary populations and the type of therapy for which the drugs were prescribed (acute or maintenance) may have influenced the average days’ supply and, hence, the overall dispensing costs for each jurisdiction.
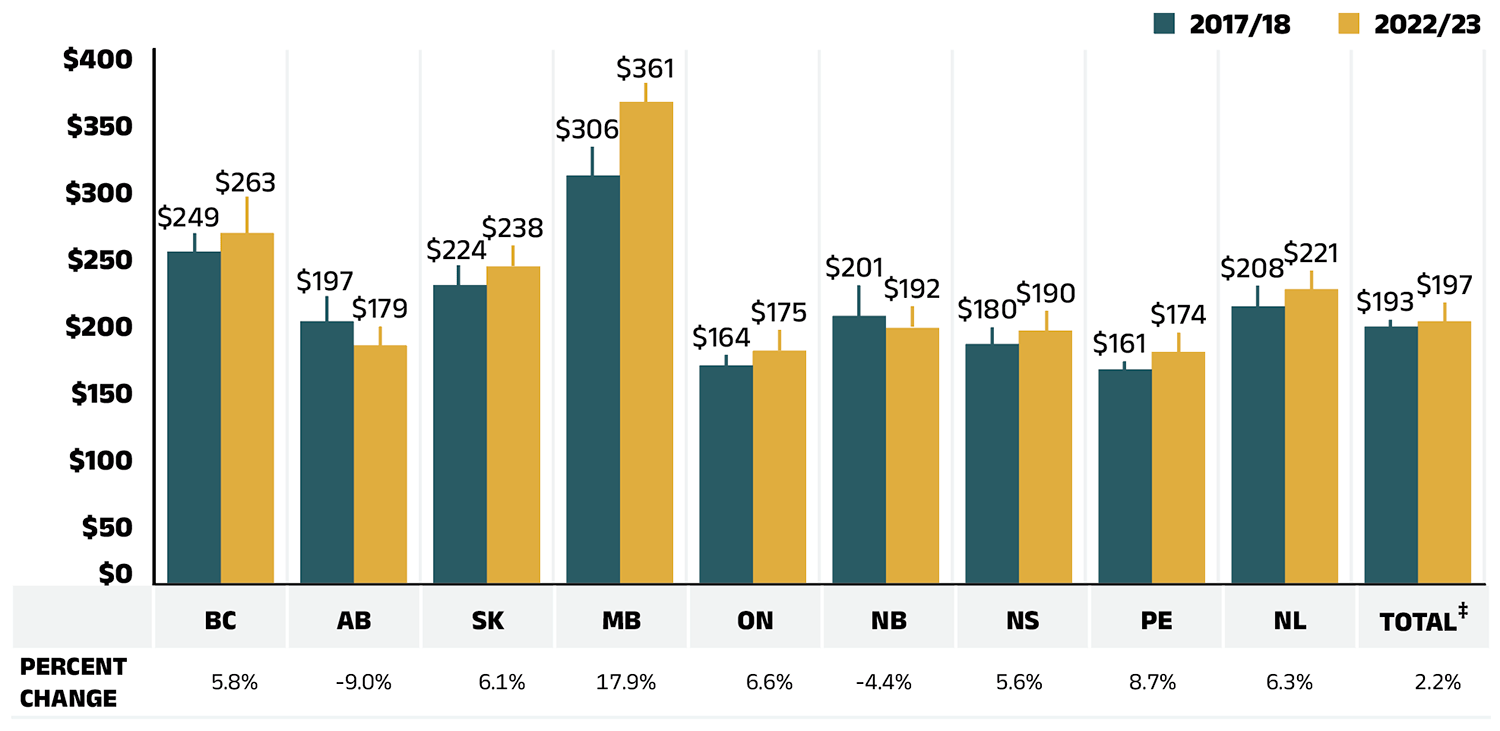
Figure 3.4 – Text version
| British Columbia | Alberta | Saskatchewan | Manitoba | Ontario | New Brunswick | Nova Scotia | Prince Edward Island | Newfoundland and Labrador | Total‡ | |
|---|---|---|---|---|---|---|---|---|---|---|
| 2017/18 | $249 | $197 | $224 | $306 | $164 | $201 | $180 | $161 | $208 | $193 |
| 2022/23 | $263 | $179 | $238 | $361 | $175 | $192 | $190 | $174 | $221 | $197 |
| Percent change | 5.8% | -9.0% | 6.1% | 17.9% | 6.6% | -4.4% | 5.6% | 8.7% | 6.3% | 2.2% |
Note: Long-term care homes were excluded from this analysis, as they may not have a typical dispensing frequency due to the more specialized needs of their patients. The following sub-plans were not included in the analysis: BC: Permanent Residents of Licensed Residential Care Facilities; MB: Personal Home Care/Nursing Homes; NB: Individuals in Licensed Residential Facilities, Nursing Home Residents; ON: Long Term Care, Home Care and Homes for Special Care. Yukon is not reported due to data limitations.
* Approximately 88% of the units in this analysis were tablets; the remainder were primarily capsules.
† Subject to the pCPA–CGPA agreement that reduced the prices of these medicines to 10% of their brand-name reference price: atorvastatin, ramipril, venlafaxine, amlodipine, omeprazole, rabeprazole, rosuvastatin, pantoprazole, citalopram, simvastatin, clopidogrel, gabapentin, metformin, olanzapine, olanzapine ODT, donepezil, ezetimibe, quetiapine, ranitidine, and zopiclone.
‡ Total results for the drug plans captured in this figure.
Data source: National Prescription Drug Utilization Information System Database, Canadian Institute for Health Information.
Appendix A: Distribution of Patients on Biosimilar Initiative Medicines by Jurisdiction, 2022/23
Recently, numerous Canadian public payers have announced or undertaken initiatives to increase biosimilar uptake (see Appendix B). In 2019, British Columbia became the first Canadian province to initiate a switch to biosimilar medicines for patients covered under the PharmaCare program. By the end of fiscal year 2021/22, British Columbia had launched four phases of its non-medical switching policy with expansions continuing into 2022/23. Alberta also implemented a switching policy in January 2021, followed by New Brunswick in April 2021. More recently, Nova Scotia and Saskatchewan adopted similar initiatives in February and October 2022, respectively. These initiatives require originator biologic patients on Remicade (infliximab), Enbrel (etanercept), Lantus (insulin glargine, 100 IU/mL), Rituxan (rituximab), Humira (Adalimumab), Humalog (insulin lispro), Lovenox (enoxaparin) and NovoRapid (insulin aspart) for select indications to switch to biosimilar alternatives.
To monitor the uptake of biosimilars and explore the impact of switching policies in the public drug plans, Figures A1 to A4 present the distribution of public plan patients on the above-mentioned biologics targeted by the switching initiatives in each NPDUIS jurisdiction with available data. Future editions of this report will continue to monitor the impact of these initiatives as they take effect.
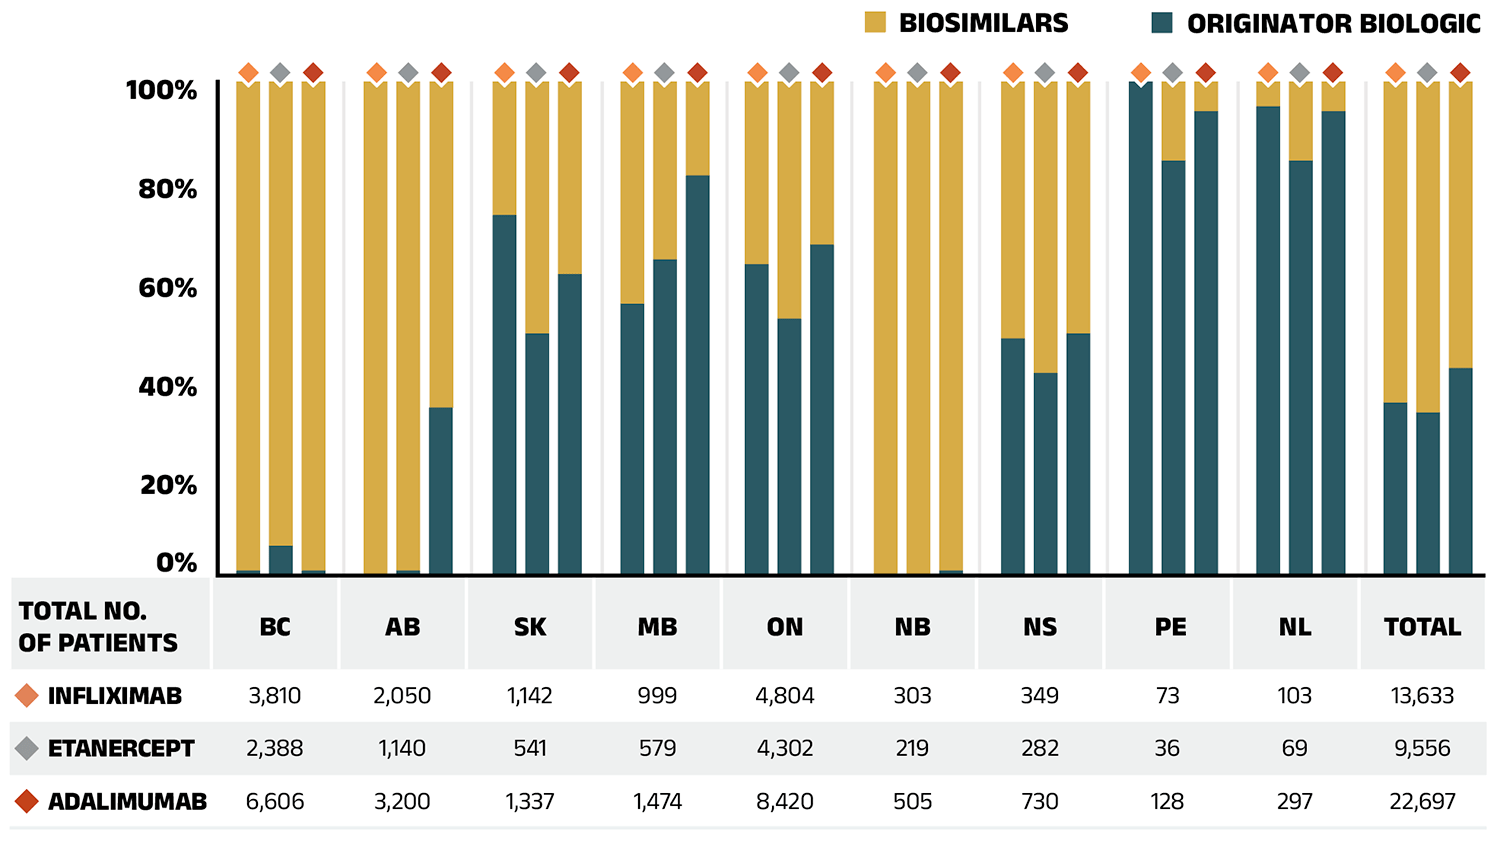
Figure A1 – Text version
| British Columbia | Alberta | Saskatchewan | Manitoba | Ontario | New Brunswick | Nova Scotia | Prince Edward Island | Newfoundland and Labrador | Total | |
|---|---|---|---|---|---|---|---|---|---|---|
| Infliximab | ||||||||||
| Infliximab (originator biologic) | 1% | 0% | 73% | 55% | 63% | 0% | 48% | 100% | 95% | 35% |
| Infliximab (biosimilars) | 99% | 100% | 27% | 45% | 37% | 100% | 52% | 0% | 5% | 65% |
| Total number of patients on infliximab | 3,810 | 2,050 | 1,142 | 999 | 4,804 | 303 | 349 | 73 | 103 | 13,633 |
| Etanercept | ||||||||||
| Etanercept (originator biologic) | 6% | 1% | 49% | 64% | 52% | 0% | 41% | 84% | 63% | 33% |
| Etanercept (biosimilars) | 94% | 99% | 51% | 36% | 48% | 100% | 59% | 16% | 37% | 67% |
| Total number of patients on etanercept | 2,338 | 1,140 | 541 | 579 | 4,302 | 219 | 282 | 36 | 69 | 9,556 |
| Adalimumab | ||||||||||
| Adalimumab (originator biologic) | 1% | 34% | 61% | 81% | 67% | 1% | 49% | 94% | 86% | 42% |
| Adalimumab (biosimilars) | 99% | 66% | 39% | 19% | 33% | 99% | 51% | 6% | 14% | 58% |
| Total number of patients on adalimumab | 6,606 | 3,200 | 1,337 | 1,474 | 8,420 | 505 | 730 | 128 | 297 | 22,697 |
Note: Results do not distinguish between indications.
Results for Yukon are not reported due to data limitations.
Totals may not add to 100% due to rounding.
Data source: National Prescription Drug Utilization Information System Database, Canadian Institute for Health Information.
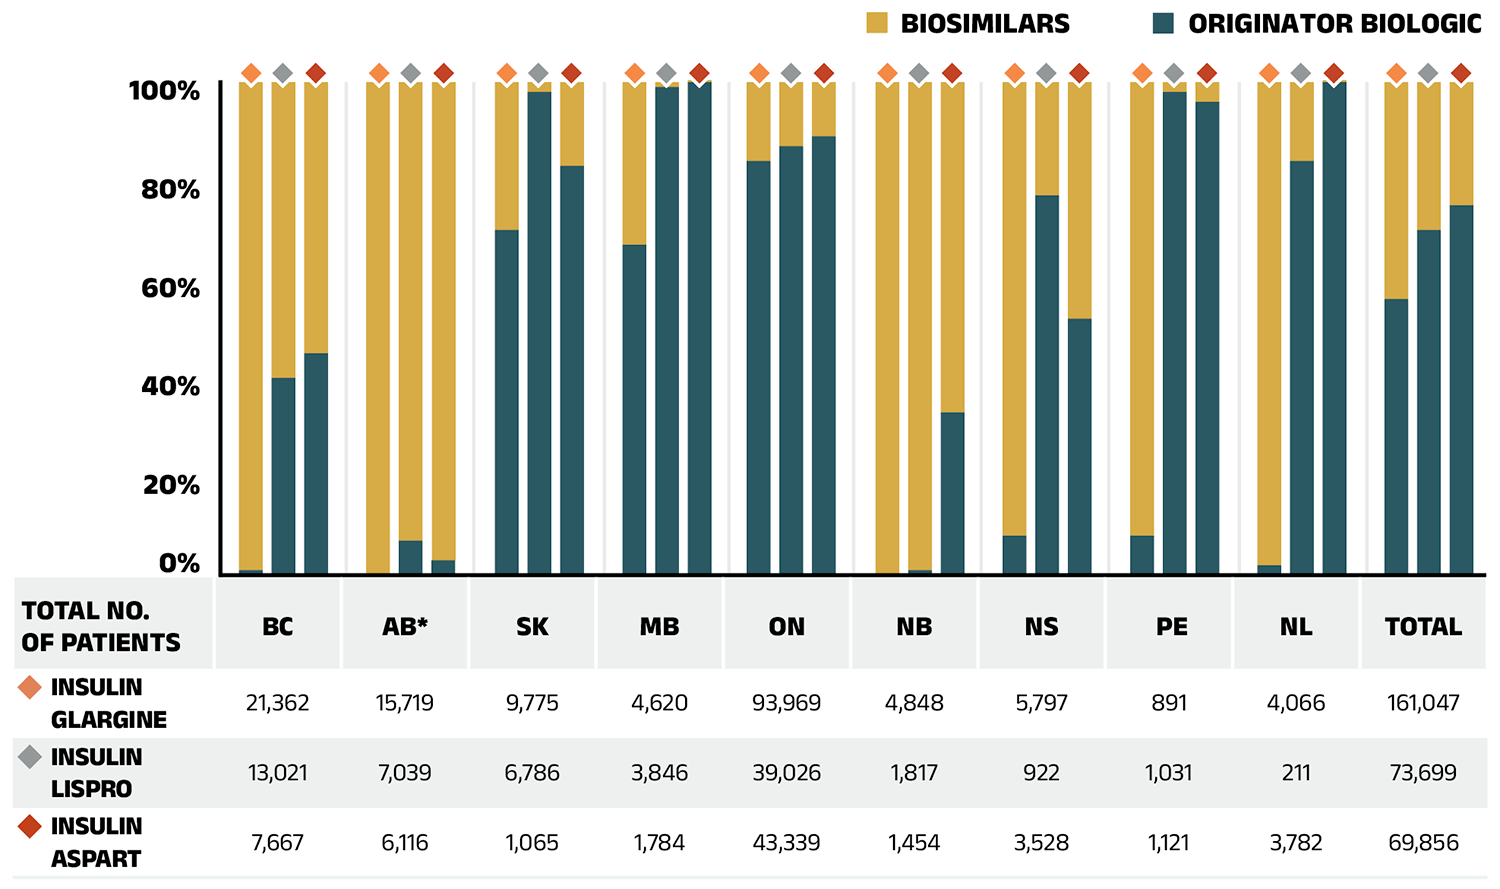
Figure A2 – Text version
| British Columbia | Alberta | Saskatchewan | Manitoba | Ontario | New Brunswick | Nova Scotia | Prince Edward Island | Newfoundland and Labrador | Total | |
|---|---|---|---|---|---|---|---|---|---|---|
| Insulin glargine | ||||||||||
| Insulin glargine (originator biologic) | 1% | 0% | 70% | 67% | 84% | <0.1% | 8% | 8% | 2% | 56% |
| Insulin glargine (biosimilars) | 99% | 100% | 30% | 33% | 16% | 100% | 92% | 92% | 98% | 44% |
| Total number of patients on insulin glargine | 21,362 | 15,719 | 9,775 | 4,620 | 93,969 | 4,848 | 5,797 | 891 | 4,066 | 161,047 |
| Insulin lispro | ||||||||||
| Insulin lispro (originator biologic) | 40% | 7% | 98% | 99% | 87% | 1% | 77% | 98% | 84% | 70% |
| Insulin lispro (biosimilars) | 60% | 93% | 2% | 1% | 13% | 99% | 23% | 2% | 16% | 30% |
| Total number of patients on insulin lispro | 13,021 | 7,039 | 6,786 | 3,846 | 39,026 | 1,817 | 922 | 1,031 | 211 | 73,699 |
| Insulin aspart | ||||||||||
| Insulin aspart (originator biologic) | 45% | 3% | 83% | 100% | 89% | 33% | 52% | 96% | 100% | 75% |
| Insulin aspart (biosimilars) | 55% | 97% | 17% | 0.4% | 11% | 67% | 48% | 4% | 0.4% | 25% |
| Total number of patients on insulin aspart | 7,667 | 6,116 | 1,065 | 1,784 | 43,339 | 1,454 | 3,528 | 1,121 | 3,782 | 69,856 |
Note: Results for Yukon are not reported due to data limitations.
Totals may not add to 100% due to rounding.
* For comparison purposes, this analysis only considers patients using the 100 IU/mL strength of insulin glargine; those using 300 IU/mL or a multi-strength 100 IU/mL + 300 IU/mL were excluded.
Data source: National Prescription Drug Utilization Information System Database, Canadian Institute for Health Information.
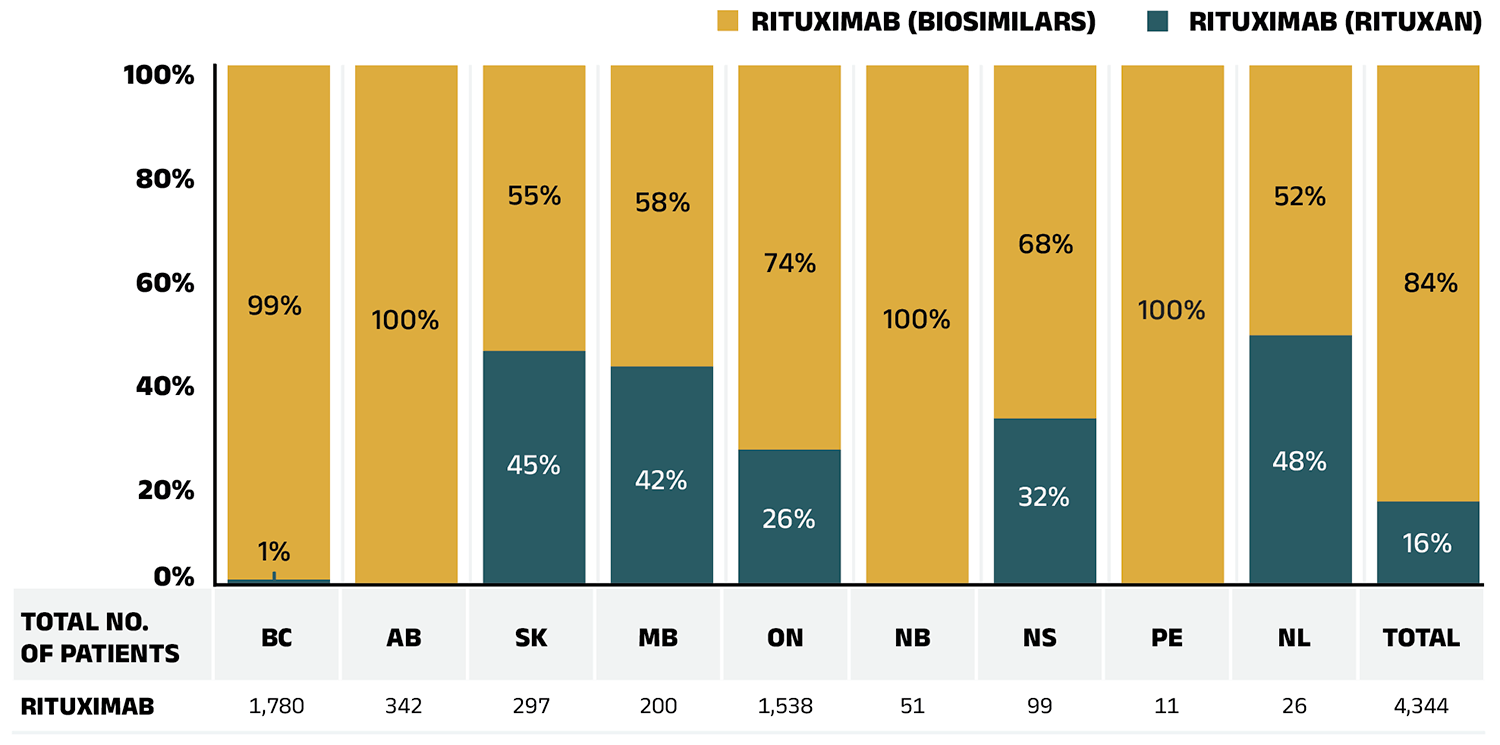
Figure A3 – Text version
| British Columbia | Alberta | Saskatchewan | Manitoba | Ontario | New Brunswick | Nova Scotia | Prince Edward Island | Newfoundland and Labrador | Total | |
|---|---|---|---|---|---|---|---|---|---|---|
| Rituximab (Rituxan) | 1% | 0% | 45% | 42% | 26% | 0% | 32% | 0% | 48% | 16% |
| Rituximab (biosimilars) | 99% | 100% | 55% | 58% | 74% | 100% | 68% | 100% | 52% | 84% |
| Total number of patients on rituximab | 1,780 | 342 | 297 | 200 | 1,538 | 51 | 99 | 11 | 26 | 4,344 |
Note: Results do not distinguish between indications.
Results for Yukon are not reported due to data limitations.
Totals may not add to 100% due to rounding.
Data source: National Prescription Drug Utilization Information System Database, Canadian Institute for Health Information.
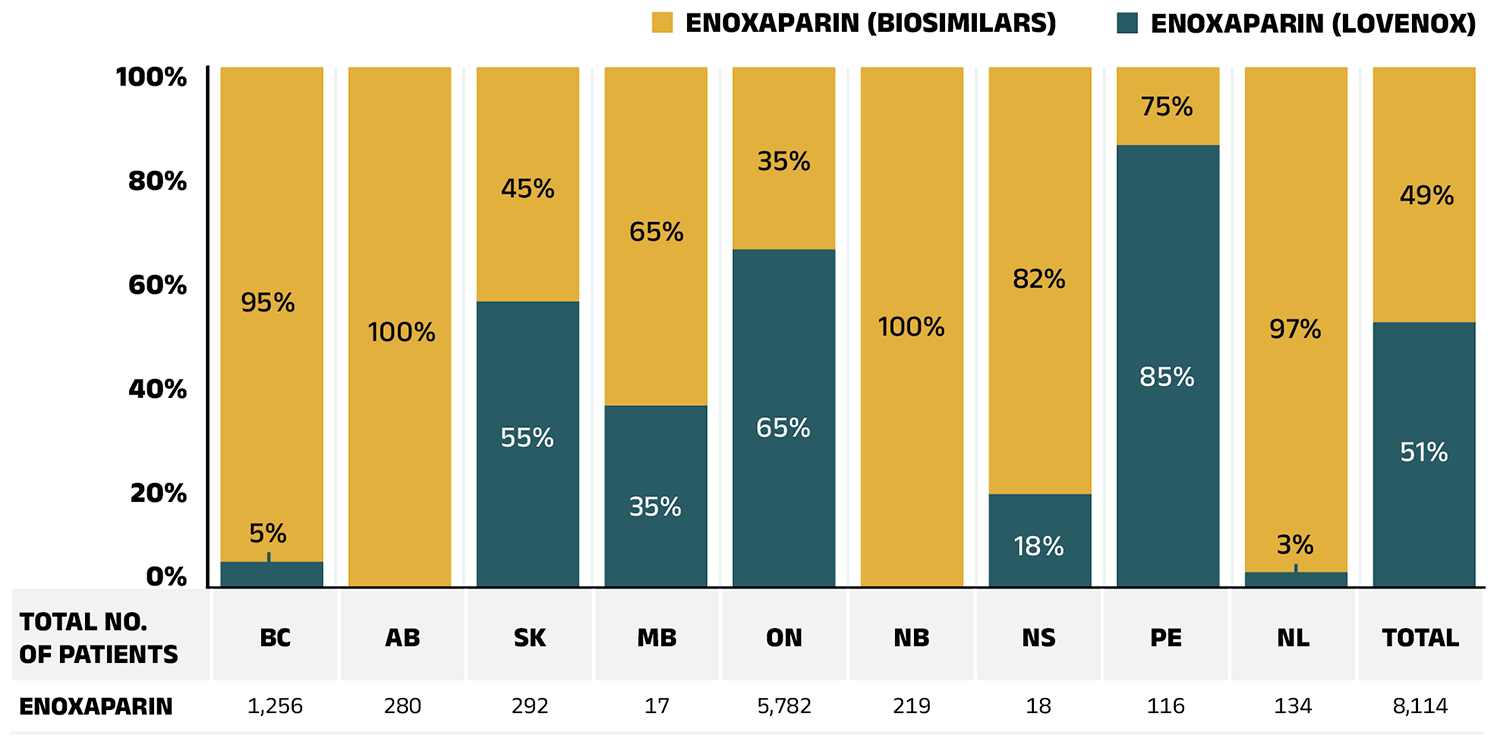
Figure A4 – Text version
| British Columbia | Alberta | Saskatchewan | Manitoba | Ontario | New Brunswick | Nova Scotia | Prince Edward Island | Newfoundland and Labrador | Total | |
|---|---|---|---|---|---|---|---|---|---|---|
| Enoxaparin (Lovenox) | 5% | 0% | 55% | 35% | 65% | 0% | 18% | 85% | 3% | 51% |
| Enoxaparin (biosimilars) | 95% | 100% | 45% | 65% | 35% | 100% | 82% | 15% | 97% | 49% |
| Total number of patients on enoxaparin | 1,256 | 280 | 292 | 17 | 5,782 | 219 | 18 | 116 | 134 | 8,114 |
Note: Results for Yukon are not reported due to data limitations.
Totals may not add to 100% due to rounding.
Data source: National Prescription Drug Utilization Information System Database, Canadian Institute for Health Information.
Appendix B: Biosimilar Switching Initiatives by Canadian Public Payers
Given the high cost of biologics in Canada, biosimilars offer the potential for important savings. Recently, Canadian public payers have announced or undertaken a number of initiatives to increase biosimilar uptake, which are outlined in the table below.
| Province/Territory | Initiative |
|---|---|
| British Columbia* | In May 2019, British Columbia became the first Canadian province to initiate a switch to biosimilar medicines for patients covered under the PharmaCare program. Under the Phase 1 & 2 policy initiatives, patients using Enbrel, Remicade, and Lantus for specific indications are required to switch to the biosimilar. The switching policy expanded to Phase 3 & 4 in 2020 and 2021 to include Rituxan and Humira. PharmaCare has now further expanded the initiatives to include NovoRapid† and Humalog†. |
| Alberta* | Effective January 2021, Alberta announced that all patients taking Enbrel, Remicade, Lantus, Neupogen, Neulasta, Rituxan, and Copaxone for indications ranging from rheumatoid arthritis to diabetes and multiple sclerosis are required to switch to the biosimilar. This policy has since been expanded to include Humira, Lovenox, Humalog, NovoRapid†, and most recently, Stelara†. |
| Saskatchewan* | Effective October 2022, Saskatchewan started to implement mandatory biosimilar switching. The policy affects medications including Humira, Lovenox, Enbrel, Neupogen, Copaxone, Remicade, Rituxan, NovoRapid, Lantus, and Humalog†. The list will be expanded as more biosimilars for reference biologics become available. |
| New Brunswick* | Effective April 2021, New Brunswick only reimburses biosimilar options for approved indications of Humira, Enbrel, Remicade, Lantus, Humalog, Rituxan, Copaxone, and Lovenox. The list has been expanded to include NovoRapid† and Lucentis†. |
| Ontario | Ontario announced a biosimilar switching policy starting on March 31, 2023. This policy affects the following biologics: Copaxone, Enbrel, Humira, Lantus, NovoRapid, Remicade, Rituxan, and Humalog†. This list will be expanded as more biosimilars for originator biologics become available. |
| Quebec | Effective July 2021, the Quebec government announced a non-medical switching policy to require patients covered by the Quebec public drug plan who are treated with biologics drugs to switch to biosimilar versions where available and on an ongoing basis. |
| Nova Scotia* | Effective February 2022, Nova Scotia initiated a non-medical biosimilar switching policy. Medications that require switching to biosimilars include: Humira, Enbrel, Remicade, Lantus, Humalog, NovoRapid, and Rituxan. The policy will apply to other medications on the formulary as new biosimilar medications are approved. |
| Prince Edward Island† | Effective October 2023, the PEI Biosimilar Initiative replaced coverage under PEI Pharmacare for certain biologic drugs with biosimilar drugs, affecting NovoRapid, Lantus, Humalog, Humira, Enbrel, Copaxone, Remicade, and Rituxan. |
| Newfoundland and Labrador† | Effective March 2023, Newfoundland and Labrador announced that beneficiaries using originator biologics Copaxone, Enbrel, Humalog, Humira, Lantus, Lovenox, NovoRapid, Remicade, and Rituxan will transition to a safe, effective and less costly biosimilar version. |
| Northwest Territories | Effective December 2021, the government of the Northwest Territories launched the Biosimilars Initiative, under which individuals on originator biologics must switch to a biosimilar to maintain public coverage. |
| Yukon† | Effective April and October 2023, the Yukon Biosimilar Initiative was launched in two phases, including the originator biologics Lantus, Humira, NovoRapid, Humalog, Enbrel, Copaxone, Rituxan, and Lovenox. |
| Manitoba, NIHB | Biosimilar switching strategies are being planned. |
Note: Biosimilar switching policies are implemented at the decision of individual jurisdictions and payers. Lists of biologic drugs that are switched to biosimilar versions are expanded on an ongoing basis. Therefore, the information provided in this edition’s Appendix B may not represent the latest announcements or current status of such initiatives.
* Biosimilar switching initiatives reflected within the timeframe of this report.
† Additions to this summary table since the last edition of the CompassRx report.