
Meds Entry Watch, 5th Edition
ISSN 2560-6204
Catalogue number: H79-12E-PDF
February 2021
PDF - 4.7 MB
Previous edition
Full list of analytical studies
New Medicines Approved in 2019
New Medicines Approved in 2018
New Medicines Approved in 2017
New Medicines Approved in 2016
Table of Contents
Acknowledgements
This report was prepared by the Patented Medicine Prices Review Board (PMPRB) as part of the National Prescription Drug Utilization Information System (NPDUIS) initiative.
The PMPRB wishes to acknowledge and thank the members of the NPDUIS Advisory Committee for their expert oversight and guidance in the preparation of this report. Please note that the statements, findings, and conclusions do not necessarily reflect those of the members or their organizations.
Appreciation goes to Blake Wladyka for leading this analytical project, as well as to Tanya Potashnik and Jeffrey Menzies for their oversight in the development of the report. The PMPRB also wishes to acknowledge the contributions of the analytical staff Étienne Gaudette and Jun Yu and the editorial staff Sarah Parker, Shirin Paynter, and Laura Fortune.
Disclaimer
NPDUIS operates independently of the regulatory activities of the Board of the PMPRB. The research priorities, data, statements, and opinions expressed or reflected in NPDUIS reports do not represent the position of the PMPRB with respect to any regulatory matter. NPDUIS reports do not contain information that is confidential or privileged under sections 87 and 88 of the Patent Act, and the mention of a medicine in a NPDUIS report is not and should not be understood as an admission or denial that the medicine is subject to filings under sections 80, 81, or 82 of the Patent Act or that its price is or is not excessive under section 85 of the Patent Act.
Although this information is based in part on data provided under license from the IQVIA MIDAS® Database, the statements, findings, conclusions, views, and opinions expressed in this report are exclusively those of the PMPRB and are not attributable to IQVIA.
Contact Information
Patented Medicine Prices Review Board
Standard Life Centre
Box L40
333 Laurier Avenue West Suite 1400
Ottawa, ON K1P 1C1
Tel.: 1-877-861-2350
TTY 613-288-9654
Email: PMPRB.Information-Renseignements.CEPMB@pmprb-cepmb.gc.ca
Executive Summary
This is the fifth edition of the PMPRB’s Meds Entry Watch report, which explores the market entry of new medicines in Canada and other countries. Building on a retrospective analysis of trends since 2015, this report focuses on medicines that received first-time market approval through the US Food and Drug Administration (FDA), the European Medicines Agency (EMA), and/or Health Canada in 2018 and 2019, and analyzes their uptake, pricing, sales, and availability as of the last quarter of 2019 (Q4-2019).
In addition to the international analysis, a Canadian-focused section provides information on medicines that received their first Health Canada approval in 2018, as well as a retrospective review of quarterly approvals over the past five years.
This publication informs decision makers, researchers, and patients of the evolving market dynamics of emerging therapies in Canadian and international pharmaceutical markets.
The IQVIA MIDAS® Database was the primary source for the sales and list prices of new medicines in Canadian and international markets, as well as for the quantity sold.
International markets examined include the Organisation for Economic Co-operation and Development (OECD) members, with a focus on Australia, Belgium, France, Germany, Italy, Japan, the Netherlands, Norway, Spain, Sweden, and the United Kingdom (UK), which will comprise the PMPRB11 comparator countries. Where appropriate, the United States (US) is included to provide additional context.
Key Findings
A) Trends in New Medicine Approvals, 2015 to 2019
Approximately 50 new medicines have been approved in each of the last three years, with orphan and oncology medicines making up a significant portion of new approvals.
- Across Canada, US, and Europe, just over fifty new medicines were approved in both 2017 and 2018, with 47 new approvals in 2019.
- Between 2015 and 2019, the shares of new approvals for orphan and oncology medicines averaged 27% and 48%, respectively, with variations from year to year.
A considerable portion of the new medicines approved internationally between 2015 and 2018 had Canadian sales by the end of 2019.
- New medicines approved between 2015 and 2018 accounted for approximately 12% of brand-name medicine sales in Canada and the PMPRB11 in Q4-2019.
- Just under 40% of these medicines had sales in Canada by Q4-2019, ahead of the OECD median (32%).
- New medicines approved from 2015 to 2018 with Canadian sales accounted for 87% of all new medicine sales in the OECD in Q4-2019, indicating that the higher-selling medicines continue to be among those approved and sold in Canada.
B) 2018 New Medicine Approvals
Fifty-one new medicines were approved in 2018, with a pronounced increase in the number of orphan medicines authorized for market.
- 51 new medicines received market approval through the FDA, the EMA, and/or Health Canada in 2018.
- Over 60% of the 2018 new medicines received an orphan designation from the FDA and/or the EMA, while more than 30% were indicated for the treatment of cancer.
- Over two thirds of the new medicines had high treatment costs: 13 oncology medicines had costs exceeding $5,000 per 28-day cycle and 21 non-oncology medicines had annual costs exceeding $10,000.
Fewer medicines were approved in Canada than in the US and Europe in 2018, although Canada compared favourably to the OECD in terms of the corresponding share of sales.
- 20 of the 51 new medicines first approved in 2018 had market authorization in Canada by Q4-2019, compared to 50 approved by the FDA and 32 by the EMA.
- Of the 20 approved medicines, nine had recorded sales in Canada by the end of 2019, placing Canada ninth in the OECD and in line with the PMPRB11 countries for the number of new medicines with sales.
- Although these nine medicines represent a relatively small portion of the total number of approvals in 2018, they accounted for 75% of total sales for new medicines in the OECD.
Sales for 2018 new medicines were highly concentrated, with a single antiviral medicine accounting for the majority of new medicine revenue in the last quarter of 2019.
- The HIV treatment Biktarvy (bictegravir) was responsible for 52% of OECD new medicine sales in Q4-2019, making up the vast majority of the 53% total share held by the antivirals class.
- Analgesics were the second highest-selling class with three migraine medicines (erenumab, galcanezumab, and fremanezumab) accounting for 15% of 2018 new medicine sales.
- Respiratory disease treatments accounted for one tenth of international new medicine sales, attributable to the new medicine tezacaftor, which is used in cystic fibrosis treatments Symdeko and Trikafta.
- Oncology medicines, comprised of cytostatic hormone therapy and antineoplastics, made up 8% of new medicine sales.
C) 2019 New Medicine Approvals
The rate of new medicine approvals in 2018 was sustained through 2019, bringing a number of new high-cost oncology treatments to the market.
- 47 new medicines received market approval through the FDA, the EMA, and/or Health Canada in 2019. Of these, 16 were approved in Canada by the third quarter of 2020.
- In total, 40% (19) of the new medicines received an orphan designation from the FDA and/or the EMA. Oncology treatments accounted for 23% (11) of the 2019 new medicines, while biologics made up nearly a third (14) of the approvals.
- Based on preliminary results, nine oncology medicines had treatment costs exceeding $5,000 per 28-day cycle.
D) Spotlight on Canada
The number of new medicines that received their first Canadian approval in 2018 was in line with trends observed over the past five years.
- 40 new-to-Canada medicines were approved for market in 2018, of which 22 had reported sales by Q4-2019, accounting for 1.6% of the total Canadian pharmaceutical market.
- Four of the five internationally top-selling new medicines in 2018 received market authorization in Canada in the same year, including Biktarvy (bictegravir), which represented 21% of all Canadian 2018 new medicine sales by Q4-2019.
- An analysis of the rate of new medicine approvals in Canada found a steady annual trend of approximately nine approvals per quarter over the past five years.
Introduction
Meds Entry Watch is an annual PMPRB publication that explores the dynamics of new medicines entering Canadian and international markets, providing information on their availability, sales, and prices.
This report builds on the four previous editions to provide a broad analysis of medicines that have received market approval since 2015, with a special focus on medicines approved in 2018 and 2019. New medicines are identified for each year based on the date of their first market authorization through the US Food and Drug Administration (FDA), the European Medicines Agency (EMA), and/or Health Canada.
The report consists of four main sections: Section A provides an overview of trends from 2015 to 2019; Section B focuses on new medicines that received international market approval in 2018; Section C presents a preliminary analysis of the new medicines approved internationally in 2019; and Section D spotlights Health Canada approvals in 2018.
This publication informs decision makers, researchers, and patients of emerging therapies in Canadian and international pharmaceutical markets.
Methods
This report analyzes new medicines that have received initial market approval through the FDA, the EMA, and/or Health Canada since 2015, with a focus on those approved in 2018 and 2019. A new medicine is selected for analysis if it received first-time market authorization from any of these regulatory bodies during the calendar year, even if it was not yet listed for reimbursement or if there were no recorded sales in the available data. For the purpose of the report, new medicines are identified at the medicinal ingredient level. Using these criteria, 175 new medicines were identified as new approvals between 2015 and 2018, including the 51 analyzed for the 2018 list in Section B, and 47 were identified for the preliminary analysis of 2019 medicines in Section C. The approval of these medicines in Canadian and international markets was assessed as of the end of 2019 or the third quarter of 2020 (Q3-2020), as specified.
The selection of medicines featured in the analysis of the Canadian market in Section D differs from the previous sections. Medicines analyzed in Section D include new and previously marketed medicinal ingredients that received their first Canadian market authorization through Health Canada in 2018. This includes a number of the medicines in the 2018 analysis in Section B, but also encompasses additional medicines that may have received initial approval through the FDA or EMA in previous years and were approved for the Canadian market in 2018.
International markets examined include the Organisation for Economic Co-operation and Development (OECD) members, with a focus on Australia, Belgium, France, Germany, Italy, Japan, the Netherlands, Norway, Spain, Sweden, and the United Kingdom (UK), which will comprise the PMPRB11 comparator countries. Sales data for the United States (US) is also used where sales have not been reported in the PMPRB11.
The IQVIA MIDAS® Database (all rights reserved) is the main data source for the sales and list prices of new medicines in Canadian and international markets, as well as the volume of units sold. MIDAS data reflects the national retail and hospital sectors of each country, including payers in all market segments (public, private, and out-of-pocket). Sales and volume data encompass all versions of a medicine available in a particular country, produced by any manufacturer in any strength and form. For more information on the MIDAS Database and other NPDUIS source materials, see the Resources section of the Analytical Studies page on the PMPRB website.
Canadian prices are based on MIDAS data, if available; otherwise, they are derived from publicly available results of the Common Drug Review (CDR) or pan-Canadian Oncology Drug Review (pCODR) processes published by the Canadian Agency for Drugs and Technologies in Health (CADTH). Treatment costs are calculated using Canadian list prices where possible; if not, the foreign median price is used. Information on dosing regimens is taken from the product monographs published by Health Canada, or if not available, from the FDA or EMA. All medicines were reviewed as of Q3-2020, unless otherwise specified.
Prices and foreign-to-Canadian price ratios are reported for the highest-selling form and strength of each medicine in Canada, or in the PMPRB11 if no Canadian sales were available at the time of the analysis. The foreign-to-Canadian price ratios presented in this report are expressed as an index with the Canadian price set to a value of one and the international median reported relative to this value. For more details on how foreign-to-Canadian price ratios are calculated, see the Resources section of the Analytical Studies page on the PMPRB website.
Prices and sales in foreign currencies are converted into Canadian dollars using the 12-month or 3-month average exchange rate for the year or quarter, respectively.
Limitations
New medicines reported in Sections A, B, and C are selected for analysis based on their date of market approval by the FDA, the EMA, and/or Health Canada. Some of the medicines reported may have earlier approval dates in other countries, such as Australia and Japan, which are governed by other regulatory bodies. Likewise, the medicines included in this analysis do not necessarily represent all of those introduced in 2018 and 2019, as other national regulatory bodies not examined in this report may have approved additional medicines. Nevertheless, as the FDA and EMA represent significant international markets, this is estimated to have little effect on the overall results.
This report reflects the initial market penetration of these new medicines, and their availability and uptake are expected to increase in subsequent years. The availability of a new medicine in a given country at any point in time is influenced by a variety of factors including the manufacturer’s decision to launch, as well as the timing of that decision; the regulatory approval process in place; and the existing market dynamics.
Market approval through the EMA does not necessarily mean that the medicine is available in any given European country. Likewise, medicines approved through the FDA or Health Canada may not necessarily be reimbursed and/or have any recorded sales.
Some medicines with sales may not be reported in the IQVIA MIDAS® Database, and thus, the sales of new medicines in any given country may be slightly under-reported. However, as the effect is expected to be relatively consistent across all markets, this should have only a minimal impact on the overall findings.
Canadian and international sales and prices are based on manufacturer list prices as reported in the MIDAS Database, and do not capture price rebates, managed entry agreements (also known as product listing agreements), or patient access schemes. The methodology used by MIDAS for estimating prices varies by country, depending on data availability, and may include assumed regulated margins and/or markups.
Publicly available prices from the Canadian Agency for Drugs and Technologies in Health (CADTH) are based on the manufacturers’ submitted prices, which may differ upon market entry.
Aggregated international sales and pricing data are skewed towards the United States and, as a result, the ranking of medicines by international sales generally reflects the order of sales in the US.
The assessment of medicine availability in Canada does not consider non-marketed medicines available through programs that authorize the sale of medicines in exceptional circumstances, such as the Special Access Programme in Canada (SAP).
A: Trends in New Medicine Approvals, 2015–2019
This section reports on the number of new medicines approved from 2015 to 2019, and tracks the progress of those approved from 2015 to 2018 through to the end of 2019. Sales and pricing information is reported as of Q4-2019.
A greater number of new medicines have been approved in recent years, including many new specialty treatments. Medicines first approved between 2015 and 2018 accounted for approximately 12% of all brand-name sales by the end of 2019. Canadian sales had been recorded for over a third of these by Q4-2019, placing Canada eighth among the PMPRB11 countries and maintaining its position as tenth in the OECD. Canada ranked among the top countries in the OECD in terms of the share of total new medicine sales, which suggests that the highest-selling medicines were among those approved.
An average of 44 new medicines received first-time market approval through the FDA, the EMA, and/or Health Canada annually between 2015 and 2019 (Figure A1). In 2018, 51 new medicines were approved, of which over 60% (31) received an orphan designation from the FDA and/or EMA. Consistent with 2017 results, approximately one third of 2018 new medicines were indicated to treat cancer.
An additional 47 new medicines were approved in 2019, including a smaller share of orphan medicines (40%) and a slight decline in the proportion of new oncology medicines (23%).
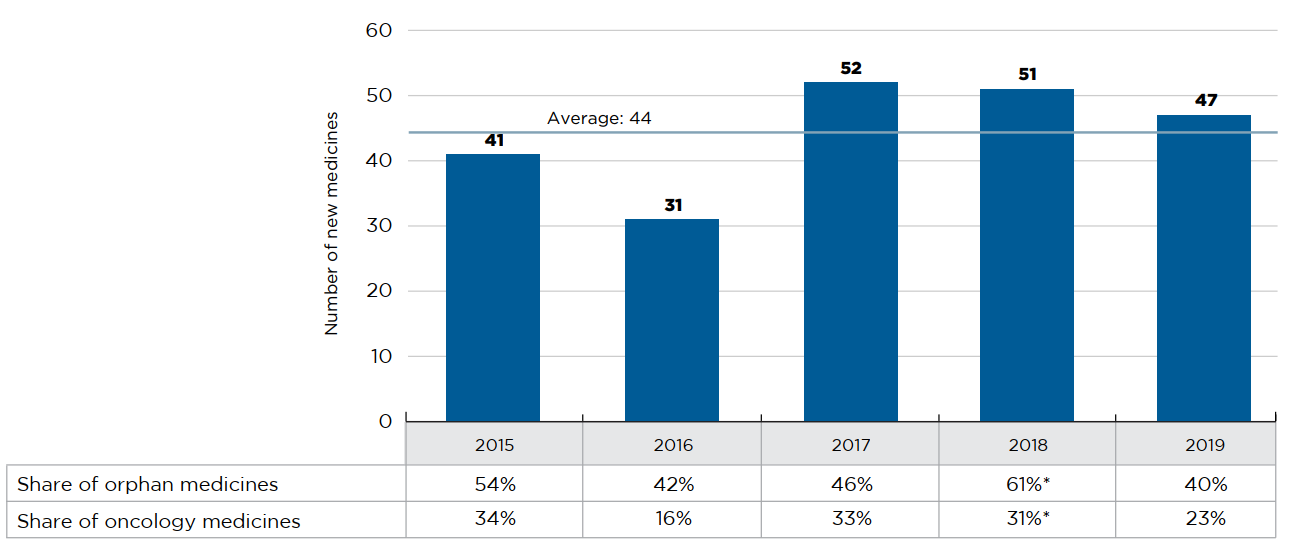
Figure description
This bar graph depicts the number of new medicines approved by the US Food and Drug Administration, the European Medicines Agency, and Health Canada from 2015 to 2019. A table shows the share of orphan and oncology medicines for each annual total. The average number of annual approvals for the period was 44.
| 2015 | 2016 | 2017 | 2018 | 2019 | |
|---|---|---|---|---|---|
| Number of new medicines | 41 | 31 | 52 | 51 | 47 |
| Share of orphan medicines | 54% | 42% | 46% | 61%* | 40% |
| Share of oncology medicines | 34% | 16% | 33% | 31%* | 23% |
* This value has been corrected and as such does not match the value reported in previous editions.
Data source: US Food and Drug Administration, European Medicines Agency, and Health Canada databases.
New medicines have had a moderate year-over-year uptake in sales. By Q4-2019, those launched between 2015 and 2018 accounted for 12.8% of the total brand-name pharmaceutical market in Canada and 11.5% internationally (Figure A2). Medicines that were approved in 2018 represented 0.8% of all pharmaceutical sales in Canada and the PMPRB11.
In any given year, the impact of new medicines on pharmaceutical sales depends on their number, therapeutic relevance, and treatment costs. For instance, in 2018, the three highest-selling new medicines in Canada were velpatasvir, elbavisir, and grazoprevir, all approved in 2016 for the treatment of hepatitis C. Together, these three medicines accounted for 4.6% of brand-name medicine sales in 2018. By Q4-2019, spending on hepatitis C medicines had declined as a share of brand-name spending. As a result, sales of medicines approved in 2016 declined relative to medicines approved in other years, such as daratumumab (an oncology medicine launched in 2015) and semaglutide (a diabetes medicine launched in 2017). For more information on this group of medicines, see Appendix I.
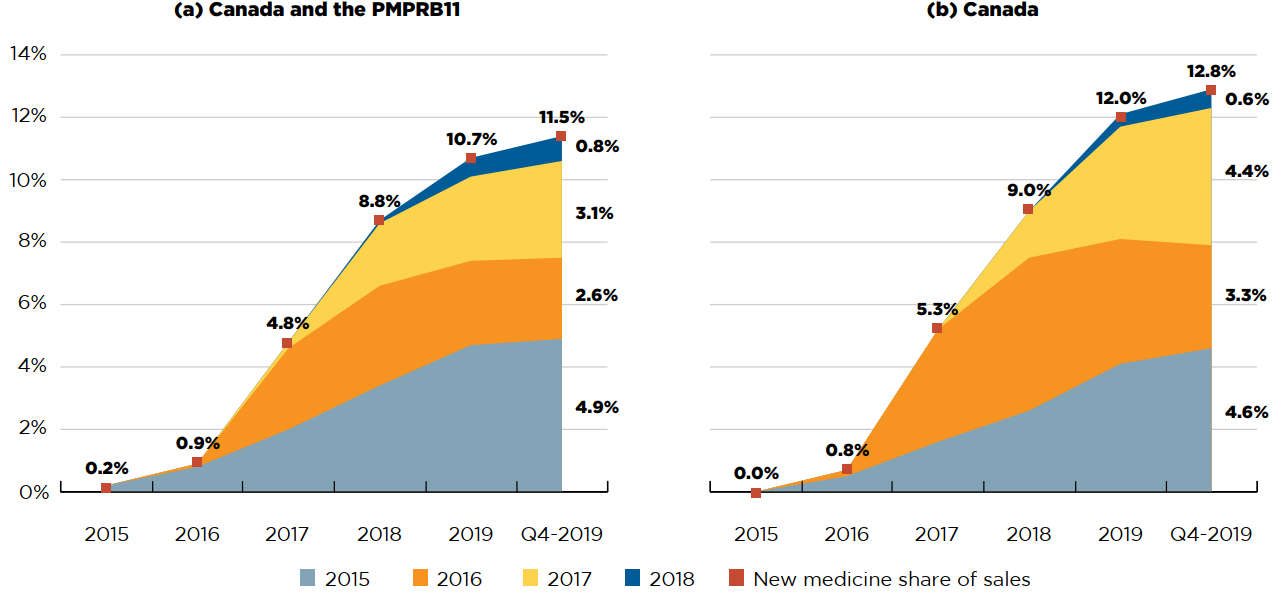
Figure description
This figure consists of two area graphs depicting the new medicine cumulative share of total brand-name medicine sales by year of approval between 2015 and 2018, tracking the percentage of new medicines in yearly sales up to the fourth quarter of 2019. New medicine share of sales for each year are also marked. The first graph is for both Canada and the eleven PMPRB comparator countries and the second is for Canada alone.
(a) Canada and PMPRB11
| Year of approval | 2015 | 2016 | 2017 | 2018 | 2019 | Q4-2019 |
|---|---|---|---|---|---|---|
| 2015 | 0.2% | 0.8% | 2.0% | 3.4% | 4.7% | 4.9% |
| 2016 | 0.0% | 0.1% | 2.6% | 3.2% | 2.7% | 2.6% |
| 2017 | 0.0% | 0.0% | 0.2% | 2.0% | 2.7% | 3.1% |
| 2018 | 0.0% | 0.0% | 0.0% | 0.1% | 0.6% | 0.8% |
| New medicine share of sales | 0.2% | 0.9% | 4.8% | 8.8% | 10.7% | 11.5% |
(b) Canada
| Year of approval | 2015 | 2016 | 2017 | 2018 | 2019 | Q4-2019 |
|---|---|---|---|---|---|---|
| 2015 | 0.0% | 0.5% | 1.6% | 2.6% | 4.1% | 4.6% |
| 2016 | 0.0% | 0.2% | 3.6% | 4.9% | 4.0% | 3.3% |
| 2017 | 0.0% | 0.0% | 0.0% | 1.5% | 3.6% | 4.4% |
| 2018 | 0.0% | 0.0% | 0.0% | 0.0% | 0.4% | 0.6% |
| New medicine share of sales | 0.0% | 0.8% | 5.3% | 9.0% | 12.0% | 12.8% |
* Australia, Belgium, France, Germany, Italy, Japan, Netherlands, Norway, Spain, Sweden, and the United Kingdom.
Data source: IQVIA MIDAS® Database, 2019. All rights reserved.
Of the 175 medicines approved from 2015 to 2018, 66 (38%) had recorded sales in Canada by Q4-2019 (Figure A3). While this proportion was higher than the OECD median of 32%, it ranked below the median of the PMPRB11 countries, many of which have lower average list prices for patented medicines (PMPRB). The new medicines sold in Canada accounted for 87% of the OECD sales for all new medicines analyzed, representing the fifth highest share in the OECD, well above the median of 72%. These findings are similar to those of previous editions of this report and continue to suggest that although fewer new medicines were approved in Canada, the higher-selling new medicines were among those sold.
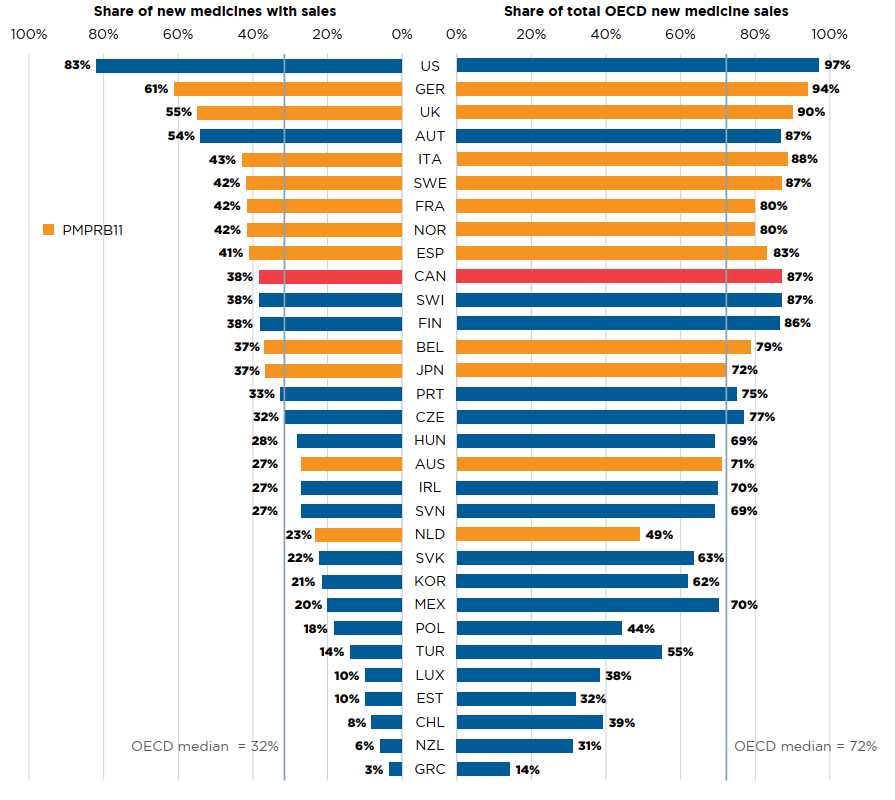
Figure description
This is a split bar graph. For each country in the Organisation for Economic Co-operation and Development, one side of the graph gives the market share of the new medicines launched in Canada and its eleven PMPRB comparator countries from 2015 to 2018. The other side gives the respective share of the Organisation for Economic Co-operation and Development sales in the fourth quarter of 2019. The Organisation for Economic Co-operation and Development median is shown for each side of the graph.
| Country | Share of new medicines with sales | Share of total Organisation for Economic Co-operation and Development new medicine sales |
|---|---|---|
| United States | 83% | 97% |
| Germany | 61% | 94% |
| United Kingdom | 55% | 90% |
| Austria | 54% | 87% |
| Italy | 43% | 88% |
| Sweden | 42% | 87% |
| France | 42% | 80% |
| Norway | 42% | 80% |
| Spain | 41% | 83% |
| Canada | 38% | 87% |
| Switzerland | 38% | 87% |
| Finland | 38% | 86% |
| Belgium | 37% | 79% |
| Japan | 37% | 72% |
| Portugal | 33% | 75% |
| Czech Republic | 32% | 77% |
| Hungary | 28% | 69% |
| Australia | 27% | 71% |
| Ireland | 27% | 70% |
| Slovenia | 27% | 69% |
| Netherlands | 23% | 49% |
| Slovakia | 22% | 63% |
| South Korea | 21% | 62% |
| Mexico | 20% | 70% |
| Poland | 18% | 44% |
| Turkey | 14% | 55% |
| Luxembourg | 10% | 38% |
| Estonia | 10% | 32% |
| Chile | 8% | 39% |
| New Zealand | 6% | 31% |
| Greece | 3% | 14% |
| OECD median | 32% | 72% |
Note: Sales are based on manufacturer list prices and include sales for all OECD countries.
* Australia, Belgium, France, Germany, Italy, Japan, Netherlands, Norway, Spain, Sweden, and the United Kingdom.
Data source: IQVIA MIDAS® Database, 2019. All rights reserved.
B: New Medicine Approvals, 2018
This section reports on new medicines approved in 2018 and tracks their progress through the first two years after approval. Sales and pricing data are provided as of Q4-2019 while assessments, recommendations, and reimbursement decisions are reported as of Q3-2020.
In addition to a relatively high number of total new approvals, 2018 brought a pronounced increase in the number of orphan medicines authorized for market. Sales for 2018 new medicines were highly concentrated, with a single antiviral accounting for the majority of revenues in the last quarter of 2019.
Fifty-one new medicines were approved in Canada, Europe, and the US in 2018. By the end of 2019, 20 of these had been approved in Canada. Both the FDA and the EMA approved more new medicines than Canada at 50 and 32, respectively (Figure B1).
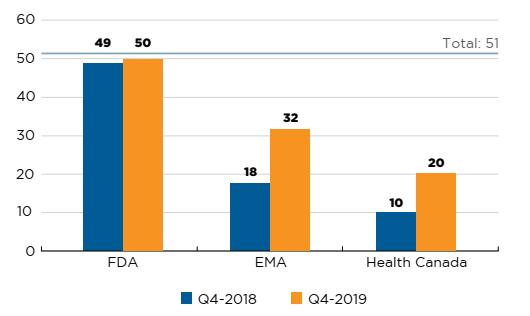
Figure description
This is a bar graph with the number of 2018 new medicines approved by Health Canada, the European Medicines Agency, and the US Food and Drug Administration as of the fourth quarter of 2018 and the fourth quarter of 2019. The total number of new medicines in 2018 was 51.
| US Food and Drug Administration | European Medicines Agency | Health Canada | |
|---|---|---|---|
| Q4-2018 | 49 | 18 | 10 |
| Q4-2019 | 50 | 32 | 20 |
Data source: US Food and Drug Administration (FDA), European Medicines Agency (EMA), and Health Canada databases.
Of the 20 medicines approved in Canada, 9 had sales data available in MIDAS by Q4-2019. This placed Canada ninth in the OECD in terms of the number of new medicines sold and seventh in terms of the corresponding OECD sales of these new medicines, at 75%. The US market, which ranked first among all OECD countries, recorded sales for 45 of the medicines approved in 2018, representing over 99% of OECD sales.
These results reflect initial market penetration, and the availability and uptake in sales for these new medicines are expected to increase in subsequent years.
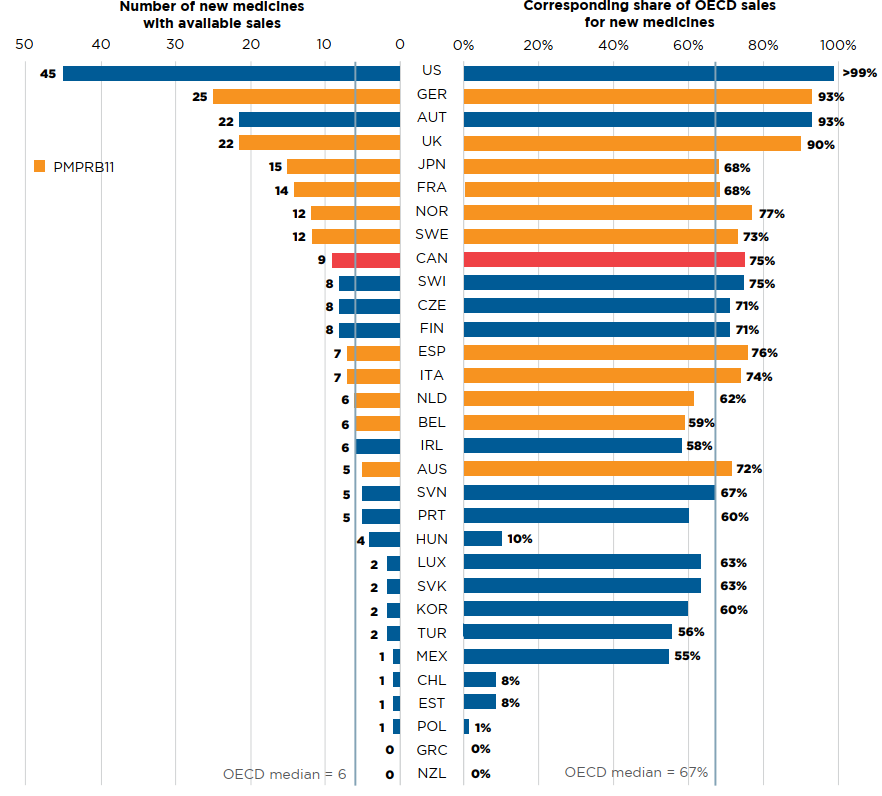
Figure description
This is a split bar graph showing the number of new medicines approved and with available sales as of the fourth quarter of 2019 and the corresponding share of 2019 fourth quarter sales in each of the Organisation for Economic Co-operation and Development countries. A median is given for each side of the graph.
| Country | Number of new medicines with available sales | Corresponding share of total Organisation for Economic Co-operation and Development sales for new medicines |
|---|---|---|
United States |
45 |
>99% |
Germany |
25 |
93% |
Austria |
22 |
93% |
United Kingdom |
22 |
90% |
Japan |
15 |
68% |
France |
14 |
68% |
Norway |
12 |
77% |
Sweden |
12 |
73% |
Canada |
9 |
75% |
Switzerland |
8 |
75% |
Czech Republic |
8 |
71% |
Finland |
8 |
71% |
Spain |
7 |
76% |
Italy |
7 |
74% |
Netherlands |
6 |
62% |
Belgium |
6 |
59% |
Ireland |
6 |
58% |
Australia |
5 |
72% |
Slovenia |
5 |
67% |
Portugal |
5 |
60% |
Hungary |
4 |
10% |
Luxembourg |
2 |
63% |
Slovakia |
2 |
63% |
South Korea |
2 |
60% |
Turkey |
2 |
56% |
Note: Based on medicines that received market approval through the US Food and Drug Administration (FDA), the European Medicines Agency (EMA), and/or Health Canada in 2018 with recorded sales data as of Q4-2019.
Sales are based on manufacturer list prices and include sales for the selected new medicines in all OECD countries.
Data source: IQVIA MIDAS® Database, 2019 (all rights reserved); US Food and Drug Administration, European Medicines Agency, and Health Canada databases.
Table B1 lists the new medicines approved in 2018. For each medicine, the country with the first reported sales is given, along with the availability in Canada, the share of sales in Q4-2019, and the prices and corresponding treatment costs.Footnote 1 Prices are reported for the highest-selling form and strength of each medicine at the time of the analysis.
Antineoplastics and antivirals continued to account for the greatest number of new medicines in 2018, with 14 and 4 medicines approved, respectively. Several other therapeutic areas emerged as top contributors in 2018, including four new blood coagulation system products and three new analgesics, all of which were indicated for the treatment of migraines. In total, the list of 2018 new medicines spans 23 therapeutic classes.
Despite the range of therapeutic areas represented, sales for the 2018 new approvals were highly concentrated. The top three therapeutic classes, representing eight medicines, accounted for over three quarters of all new medicine sales across the OECD by Q4-2019 (Table B1). Antivirals topped the list with 53% of all sales, driven primarily by Biktarvy, an oral HIV medicine that alone accounted for over half of sales by the end of 2019. Analgesics followed with a 14% share of sales held by three medicines indicated for the treatment of migraines, half of which can be attributed to the top treatment in the class, erenumab (Aimovig). Respiratory system medicines were responsible for 10% of new medicine sales, attributed to two cystic fibrosis treatments containing the new medicine tezacaftor—SymdekoFootnote 2 and TrikaftaFootnote 3. Despite having the greatest number of new medicines, the antineoplastics class captured 5% of new medicine sales with no individual medicine capturing more that 1% of sales.
A considerable number of new medicines fell into specialty categories. In total, 61% (31) of the 2018 new medicines received an orphan designation from the FDA and/or the EMA and 31% (16) of new medicines were for the treatment of cancer. Approximately 25% (13) were biologics, which represents a decline over the previous year. As illustrated in Figure B3, there was considerable overlap among these categories: 13 of the new oncology medicines were orphan-designated, of which three were also classified as biologics.
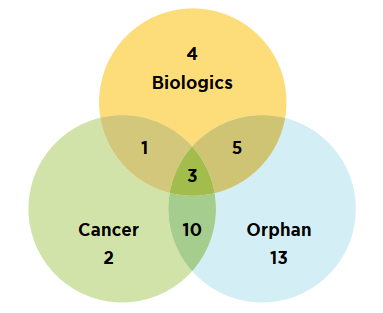
Figure description
This is a Venn diagram illustrating the overlap between orphan, biologic, and oncology treatments among the 2018 new medicines. Of the 51 new approvals, a total of 13 medicines were biologic, 31 had an orphan designation, and 16 were cancer medicines. Of these, five were both biologic and orphan, one was both biologic and oncological, 10 were both orphan and oncological, and three were biologic cancer medicines that also received an orphan designation.
Data source: US Food and Drug Administration, European Medicines Agency, and Health Canada databases.
As reported in Table B1, three new medicines had no recorded sales as of Q4-2019: tecoviramat, moxidectin, and calaspargase. Tecoviramat is an antiviral medicine for smallpox, a virus considered to be eradicated by the WHO in 1979. While sales have not been registered through typical supply chains, the US government purchased the product directly in case of an outbreakFootnote 4 and Canada followed suit shortly after with purchases by the Department of National Defense and a pending tender announcement from the Public Health Agency of Canada.Footnote 5Footnote 6Footnote 7 Moxidectin, a medicine previously used only in veterinary practice, has become indicated for human use in the treatment of onchocerciasis, commonly referred to as “river blindness” in the US. River blindness is predominantly found outside of the OECD in sub-Saharan Africa. While the medicine is novel for human use and presents benefits over current treatments, none of the OECD countries have reported sales as of Q4-2019. The third medicine, calaspargase, is a biologic indicated to treat acute lymphoblastic leukemia in children and young adults.
Table B1 New medicines approved in 2018, availability, share of sales, prices, and treatment costs, ranked by therapeutic class share of sales, Q4-2019
| Rank | Therapeutic class* | Medicine (trade name, form, strength, volume) | Availability | Share of new medicine sales across the OECD | No. of countries with sales‡ | Canadian price§ (CAD) | PMPRB11 price (CAD) | US price | Treatment cost** | ||||||
|---|---|---|---|---|---|---|---|---|---|---|---|---|---|---|---|
| First sale in Canada, US, or PMPRB11† | First sale in Canada | Medicine | Therapeutic class | Min | Median | Max | Treatment cost (CAD) | Annual / Course | |||||||
| 1 | J5-Antivirals for systemic use | Bictegravir (Biktarvy, film-ctd tab, 50 mg + 200 mg + 25 mg) | US | Feb-18 | Oct-18 | 52% | 53% | 13 | 36 | 26 | 40 | 68 | 118 | 14,315 | Annual |
| 2 | Baloxavir marboxil (Xofluza, film-ctd tab, 20 mg)O | JPN | Mar-18 | – | 1% | 2 | – | 23 | 23 | 23 | 93 | 117 | Dose | ||
| 3 | Doravirine (Pifeltro, film-ctd tab, 100 mg) | US | Sept-18 | Nov-18 | 1% | 9 | 17 | 12 | 22 | 26 | 53 | 6,077 | Annual | ||
| 4 | Ibalizumab (Trogarzo, infus. vial/bottle, 150 mg/ml, 1.33 ml)B,O | US | May-18 | – | <1% | 1 | – | – | – | – | 1,328 | 73,064 | Annual | ||
| 5 | N2-Analgesics | Erenumab (Aimovig, prefill autoinj, 70 mg/ml, 1 ml) | US | May-18 | Dec-18 | 7% | 15% | 9 | 545 | 471 | 591 | 783 | 674 | 6,543 | Annual |
| 6 | Galcanezumab (Emgality, prefill autoinj, 120 mg/ml, 1 ml)B | US | Oct-18 | Oct-19 | 5% | 8 | 624 | 466 | 597 | 938 | 693 | 14,977 | Annual | ||
| 7 | Fremanezumab (Ajovy, prefill syrng sc, 150 mg/ml, 1.5 ml)B | US | Sept-18 | – | 2% | 5 | – | – | 634 | 783 | 701 | 7,664 | Annual | ||
| 8 | R7-Other respiratory system products | Tezacaftor (Trikafta‡‡, film-ctd tab, various strengths)O | US | Feb-18 | – | 10% | 10% | 6 | – | – | – | – | 308 | 336,734 | Annual |
| 9 | L1-Antineoplastics | Encorafenib (Braftovi, capsule, 75 mg)C,O | US | Jul-18 | – | 1% | 5% | 9 | – | 42 | 49 | 58 | 77 | 8,275 | 28-day cycle |
| 10 | Lorlatinib (Lorbrena, film-ctd tab, 100 mg)C,O | JPN | Nov-18 | Apr-19 | 1% | 7 | 343 | 220 | 265 | 326 | 654 | 88,958 | 28-day cycle | ||
| 11 | Binimetinib (Mektovi, film-ctd tab, 15 mg)C,O | US | Jul-18 | – | 1% | 9 | – | 22 | 41 | 58 | 72 | 6,974 | 28-day cycle | ||
| 12 | Cemiplimab (Libtayo, infus. vial/bottle, 50 mg/ml, 7 ml)B,C | US | Oct-18 | May-19 | 1% | 6 | 8,497 | 6,940 | 7,100 | 9,023 | 11,004 | 8,200 | 21-day cycle | ||
| 13 | Gilteritinib (Xospata, film-ctd tab, 40 mg)C,O | JPN | Dec-18 | – | 1% | 4 | 325ii | 189 | 242 | 322 | 282 | 7,328 | 28-day cycle | ||
| 14 | Mogamulizumab (Poteligeo, infus. vial/bottle, 4 mg/ml, 5 ml)B,C,O | JPN | May-12 | – | <1% | 3 | – | 1,633 | 1,887 | 2,140 | 3,852 | 32,104 to 16,052 | 28-day cycle | ||
| 15 | Larotrectinib (Vitrakvi, oral liquid, 100 mg/5 ml, 100 ml)C,O | US | Dec-18 | Sept-19 | <1% | 4 | 334 | 392 | 392 | 392 | 888 | 17,967 to 23,956 | 28-day cycle | ||
| 16 | Talazoparib (Talzenna, capsule, 1 mg)C | FRA | Oct-18 | – | <1% | 4 | – | 192 | 220 | 248 | 600 | 6,948 | 28-day cycle | ||
| 17 | Duvelisib (Copiktra, capsule, 25 mg)C,O | US | Oct-18 | – | <1% | 1 | – | – | – | – | 248 | 13,887 | 28-day cycle | ||
| 18 | Tagraxofusp (Elzonris, infus. vial/bottle, 1 mg/ml, 1 ml)C,O | US | Mar-19 | – | <1% | 1 | – | – | – | – | 29,518 | 557,885 | 21-day cycle | ||
| 19 | Glasdegib (Daurismo, film-ctd tab, 100 mg)C,O | US | Dec-18 | – | <1% | 1 | – | – | – | – | 694 | 19,436 | 28-day cycle | ||
| 20 | Dacomitinib (Vizimpro, film-ctd tab, 45 mg)C,O | US | Oct-18 | Apr-19 | <1% | 5 | 117ii | 103 | 127 | 189 | 519 | 3,267 | 28-day cycle | ||
| 21 | Moxetumomab pasudotox (Lumoxiti, infus. dry bottle, 1 mg)B,C,O | US | Nov-18 | – | <1% | 1 | – | – | – | – | 2,531 | 21,259 | 28-day cycle | ||
| 22 | Ivosidenib (Tibsovo, film-ctd tab, 250 mg)C,O | US | Aug-18 | – | <1% | 1 | – | – | – | – | 494 | 27,642 | 28-day cycle | ||
| 23 | B6-All other haematological agents | Lanadelumab (Takhzyro, vial sc, 150 mg/ml, 2 ml)O | US | Sept-18 | – | 3% | 4% | 6 | 20,538i | 18,479 | 19,049 | 20,710 | 25,658 | 533,988 | Annual |
| 24 | Caplacizumab (Cablivi, vial dry, 11 mg)O | SWE | Aug-18 | – | 1% | 7 | 6,200i | – | – | – | 9,290 | 236,840 | Annual | ||
| 25 | Fostamatinib (Tavalisse, film-ctd tab, 100 mg)O | US | Jun-18 | – | <1% | 1 | – | – | – | – | 215 | 12,031 | 28-day cycle | ||
| 26 | L2-Cytostatic hormone therapy | Apalutamide (Erleada, film-ctd tab, 60 mg)C | US | Feb-18 | Jul-18 | 3% | 3% | 7 | 29 | 22 | 36 | 44 | 115 | 3,175 | 28-day cycle |
| 27 | L4-Immunosuppressants | Ravulizumab (Ultomiris, infus. vial/bottle, 10 mg/ml, 30 ml)O | US | Jan-19 | – | 2% | 3% | 3 | – | 6,491 | 6,731 | 6,971 | 7,709 | 62,738 to 76,680 | Loading dose / Maintenance dose |
| 28 | Emapalumab (Gamifant, infus. vial/bottle, 5 mg/ml, 10 ml)B,O | US | Jan-19 | – | 1% | 1 | – | – | – | – | 32,275 | 5,034,964 | Annual | ||
| 29 | D10-Anti-acne preparations | Sarecycline (Seysara, film-ctd tab, 100 mg) | US | Jan-19 | – | 2% | 2% | 1 | – | – | – | – | 35 | 12,663 | Annual |
| 30 | H1-Pituitary and hypothalamic hormones | Elagolix (Orilissa, film-ctd tab, 150 mg) | US | Aug-18 | Oct-18 | 1% | 1% | 2 | 6 | – | – | – | 38 | 1,119 | Annual |
| 31 | M5-Other drugs for disorders of the musculo-skeletal system | Burosumab (Crysvita, vial sc, 30 mg/ml, 1ml)B,O | NLD | Feb-18 | – | 1% | 1% | 7 | – | 8,697 | 13,367 | 14,689 | 11,529 | 454,298 to 584,098 | Annual |
| 32 | D5-Nonsteroidal products for inflammatory skin disorders | Tildrakizumab (Ilumya, prefill syrng sc, 100 mg/ml, 1 ml)B | US | Oct-18 | – | 1% | 1% | 5 | – | 2,671 | 2,671 | 2,671 | 16,583 | 41,685 to 57,762 | Annual |
| 33 | R3-Anti-asthma and COPD products | Revefenacin (Yupelri, lung u-d liq, 175 mcg/dose, 3 ml) | US | Dec-18 | – | 1% | 1% | 1 | – | – | – | – | 40 | 14,642 | Annual |
| 34 | N7-Other CNS drugs | Patisiran (Onpattro, infus. vial/bottle, 2 mg/ml, 5 ml)O | US | Aug-18 | – | 1% | 1% | 6 | 13,022i | 11,028 | 11,942 | 12,467 | 11,149 | 677,145 | Annual |
| 35 | Inotersen (Tegsedi, prefill syrng sc, 189 mg/ml, 1.5 ml)O | FRA | Aug-18 | – | <1% | 2 | 8,077i | 7,887 | 8,351 | 8,816 | – | 420,000 | Annual | ||
| 36 | B2-Blood coagulation system, other products | Damoctocog alfa pegol (Jivi, vial dry ret., 3000 IU)B | US | Sept-18 | – | <1% | 1% | 6 | 516 | 2,923 | 3,582 | 6,477 | 5,283 | 287,540 to 364,129 | Annual |
| 37 | Andexanet alfa (Ondexxya, vial dry, 200 mg) | US | Jun-18 | – | <1% | 3 | – | 3,716 | 4,197 | 4,677 | – | 36,930 | Dose | ||
| 38 | Avatrombopag (Doptelet, film-ctd tab, 20 mg)O | US | Jun-18 | – | <1% | 1 | – | – | – | – | 366 | 3,661 to 5,491 | 5-day cycle | ||
| 39 | Lustrombopag (Mulpleta, film-ctd tab, 3 mg) | JPN | Oct-15 | – | <1% | – | – | 149 | 149 | 149 | 1,467 | 1,043 | Annual | ||
| 40 | V3-All other therapeutic products | Zirconium cyclosilicate (Lokelma, oral u-d powder, 10 g/dose) | SWE | Mar-18 | – | <1% | <1% | 5 | 25i | 16 | 23 | 24 | 26 | 2,283 to 9,131 | Annual |
| 41 | A16-Other alimentary tract and metabolism products | Elapegademase (Revcovi, vial im, 1.6 mg/ml)B,O | US | Nov-18 | – | <1% | <1% | 1 | – | 8,222 | 8,222 | 8,222 | – | 2,493,892 | Annual |
| 42 | Velmanase alfa (Lamzede, infus. dry bottle, 10 mg)O | FRA | Mar-18 | – | <1% | 2 | – | – | 1,336 | 1,558 | – | 486,477 | Annual | ||
| 43 | Pegvaliase (Palynziq, prefill syrng sc, 20 mg/ml, 1 ml)B,O | US | Jul-18 | – | <1% | 2 | – | 585 | 585 | 585 | 567 | 206,911 | Annual | ||
| 44 | J1-Systemic antibacterials | Omadacycline (Nuzyra, film-ctd tab, 150 mg) | US | Feb-19 | – | <1% | <1% | 1 | – | – | – | – | 226 | 19,159 | 14-day cycle |
| 45 | Eravacycline (Xerava, infus. dry bottle, 50 mg) | US | Oct-18 | – | <1% | 1 | – | – | – | – | 64 | 764 to 2,675 | 4- to 14-day treatment | ||
| 46 | G3-Sex hormones and products with similar desired effects, systemic action only | Segesterone acetate (Annovera, vaginal mech. pessary with substance, 10 mcg + 150 mcg) | US | Sept-19 | – | <1% | <1% | 1 | – | – | – | – | 2,507 | 2,507 | Annual |
| 47 | G4-Urologicals | Plazomicin (Zemdri, infus. vial/bottle, 50 mg/ml, 10 ml) | US | Jul-18 | – | <1% | <1% | 1 | – | – | – | – | 411 | 3,700 to 6,475 | 4- to 7- day treatment |
| 48 | P1-Antiprotozoals and anthelmintics | Tafenoquine (Krintafel, film-ctd tab, 150 mg)O | US | Feb-19 | – | <1% | <1% | 1 | – | – | – | – | 12 | 25 | Dose |
Medicines without sales data in MIDAS® as of Q4-2019
| Rank | Therapeutic class* | Medicine (trade name, form, strength, volume) | First approval by FDA, EMA, and/or Health Canada | First approval in Canada | |
|---|---|---|---|---|---|
| 49 | Not assigned as of Q3-2020 | Calaspargase (Asparlas)B,C,O | FDA | Dec-18 | – |
| 50 | P02-Anthelmintics | Moxidectin§§ (Moxidectin)O | FDA | Jun-18 | – |
| 51 | J05-Antivirals for systemic use | Tecovirimat (Tpoxx)O | EMA | Jul-18 | – |
Note: A medicine was considered to be new in 2018 if it received initial market authorization through the US Food and Drug Administration (FDA), the European Medicines Agency (EMA), and/or Health Canada during the calendar year.
Availability and sales information refer to all forms and strengths of the medicine, while pricing and treatment costs are based on the highest-selling form and strength indicated. Sales are based on manufacturer list prices.
Specialty medicines are indicated using the following abbreviations: B: biologic; C: cancer; O: orphan medicine.
* Level 2 of the Anatomical Classification of Pharmaceutical Products, as reported in MIDAS, except for the new medicines without sales data in MIDAS, for which the reporting is based on the Anatomic Therapeutic Chemical (ATC) Classification System maintained by the World Health Organization (WHO).
† Australia, Belgium, France, Germany, Italy, Japan, Netherlands, Norway, Spain, Sweden, and the United Kingdom.
‡ Includes all PMPRB11 countries, as well as the US and Canada.
§ Canadian unit prices were retrieved from IQVIA MIDAS® Database, where available; otherwise, they were taken from:
i CADTH's Canadian Drug Expert Committee Recommendation report.
ii pCODR Expert Review Committee (pERC) Recommendation report.
** Treatment costs were calculated using Canadian list prices if available; otherwise, the foreign median price or available foreign price was used. Information on dosing regimens was taken from the product monograph provided by Health Canada, or the FDA or EMA if unavailable though Health Canada.
‡‡ Trikafta is included in both the 2018 and 2019 lists because it contains both the 2018 new medicine tezacaftor and the 2019 new medicine elexacaftor. Despite being released in 2019, Trikafta was the top-selling product for both of the new medicines by Q4-2019.
§§ Approvals and sales for moxidectin only reflect human use and do not include veterinary indications.
Data source: IQVIA MIDAS® Database, 2019 (all rights reserved); US Food and Drug Administration Novel Drugs 2018; European Medicines Agency Human Medicines Highlights 2018; Health Canada databases.
More than two thirds of the 2018 new medicines were high-cost, with treatment costs over $10,000 per year or $5,000 per 28-day cycle for oncology medicines. Eleven non-oncology and nine oncology medicines were identified as expensive drugs for rare diseases (EDRDs)—orphan-designated therapies exceeding $100,000 in annual treatment costs, or $7,500 per 28-day cycle for oncology. Combined, these 20 EDRDs accounted for 19% of 2018 new medicine sales.
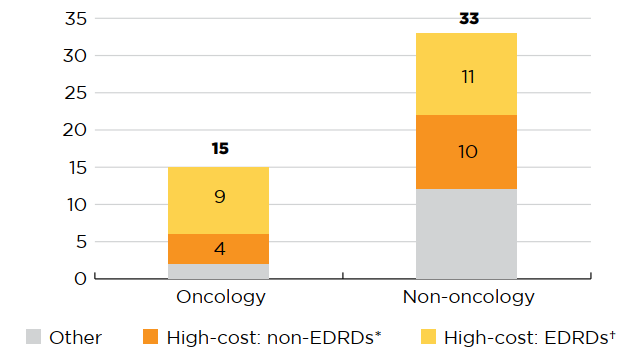
Figure description
This stacked bar graph gives the distribution of the 48 2018 new medicines with available treatment costs by high-cost bracket. The first bar shows the distribution of new oncology medicines, while the second gives the totals for non-oncology medicines. Each bar is broken down into the number of new medicines that are expensive drugs for rare diseases (EDRDs), those that are high-cost but do not qualify as EDRDs, and all other non-high-cost medicines. High-cost medicines exceed $10,000 in annual treatment costs for non-oncology medicines or $5,000 per 28-day cycle for oncology medicines. Expensive drugs for rare diseases are defined as having treatment costs in excess of $100,000 annually for non-oncology or $7,500 per 28-day cycle for oncology medicines, as well as an orphan designation from either the US Food and Drug Administration or the European Medicines Agency.
| Expensive drugs for rare diseases† | High-cost medicines*, other than EDRDs | Other | Total | |
|---|---|---|---|---|
| Oncology medicines | 9 | 4 | 2 | 15 |
| Non-oncology medicines | 11 | 10 | 12 | 33 |
Note: This analysis considers the 48 new medicines approved in 2018 with treatment costs available as of Q3-2020.
* High-cost medicines have treatment costs exceeding $5,000 per 28-day cycle for oncology or $10,000 annually for non-oncology.
† Expensive drugs for rare diseases (EDRDs) have an orphan designation through the FDA or EMA and treatment costs exceeding $7,500 per 28-day cycle for oncology medicines or $100,000 annually for non-oncology.
Data source: IQVIA MIDAS® Database, 2019 (all rights reserved); Canadian Agency for Drugs and Technologies in Health (CADTH) reports.
As of Q3-2020, 24 of the medicines first approved in 2018 had been authorized for market in Canada. Of this group, 15 had been reviewed through CADTH’s Common Drug Review (CDR) or the pan-Canadian Oncology Drug Review (pCODR) processes, which provide drug listing guidance to Canada’s drug programs. Eleven medicines were given a “Reimburse with conditions” recommendation, while four were recommended as “Do not reimburse”. None of the medicines received a recommendation to “Reimburse” without conditions.
The pan-Canadian Pharmaceutical Alliance (pCPA) is a consortium of public drug plans which conducts joint negotiations for brand name and generic drugs in Canada. Of the 24 new medicines approved in Canada, five had completed pCPA negotiations as of Q3-2020 and six others had negotiations underway. Negotiations were not pursued in three cases, two of which were for oncology products, and eight medicines had no record of negotiation. An agreement was not reached in the case of dacomitinib.
A review of private drug plan data found that over half (13) of the 24 new medicines were reimbursed by at least one private drug plan in Canada by Q3-2020. Note that these are preliminary results and the rates of reimbursement for new medicines can be expected to increase in the coming years.
The PMPRB’s Human Drug Advisory Panel (HDAP), which conducts scientific reviews of new patented medicines, found that 75% of the new medicines assessed demonstrated slight or no improvement over their therapeutic comparators.Footnote 8
Table B2 provides an overview of the recommendations and negotiation status for the 24 approved medicines, as well as information on whether these medicines have recorded sales through private drug plans in Canada.
Table B3 provides further details on the pharmacoeconomic assessments conducted by CADTH through the CDR and pCODR processes, including the indications assessed, the recommended condition for reimbursement, the primary evaluation, the range of reported incremental cost-effectiveness ratios (ICER) reported, and the price reduction required for the medicine to achieve an ICER of $50,000 per quality-adjusted life year (QALY). The results suggest that most new medicines reviewed by CADTH were not cost-effective at the submitted price. Accordingly, the majority were recommended to be approved on the condition that their price be reduced; price reductions needed to reach the $50,000/QALY level were estimated in 12 of the 15 available reports, ranging from 22% to 98%. Of the 15 medicines, only erenumab had an ICER range that fell within $50,000/QALY ($39,000 to $153,000).
Table B2 Assessments, recommendations, and reimbursement decisions for 2018 new medicines approved in Canada by Q3-2020
| ATC* | Medicine (trade name)† | Health Canada approval | CADTH recommendation | pCPA negotiation status | Private plans | ||||||
|---|---|---|---|---|---|---|---|---|---|---|---|
| Notice of Compliance | Reimburse | Reimburse with conditions | Do not reimburse | Review in progress | Active | Completed and closed | Concluded without agreement | No negotiations | Covered | ||
| L2 | Apalutamide (Erleada)C | Jul-18 | X | X | X | ||||||
| J5 | Bictegravir (Biktarvy) | Jul-18 | X | X | X | ||||||
| M5 | Burosumab (Crysvita)B,O | Dec-18 | X | X | X | ||||||
| B6 | Caplacizumab (Cablivi)O | Feb-20 | X | ||||||||
| L1 | Cemiplimab (Libtayo)B,C | Apr-19 | X | X | X | ||||||
| L1 | Dacomitinib (Vizimpro)C,O | Feb-19 | X | X | |||||||
| J5 | Doravirine (Pifeltro) | Oct-18 | X | X | X | ||||||
| H1 | Elagolix (Orilissa) | Oct-18 | X | ||||||||
| N2 | Erenumab (Aimovig) | Aug-18 | X | X | X | ||||||
| N2 | Fremanezumab (Ajovy)B | Apr-20 | X | ||||||||
| N2 | Galcanezumab (Emgality)B | Jul-19 | X | ||||||||
| L1 | Gilteritinib (Xospata)C,O | Dec-19 | X | X | |||||||
| L1 | Glasdegib (Daurismo)C,O | Apr-20 | X | ||||||||
| N7 | Inotersen (Tegsedi)O | Oct-18 | X | X | X | ||||||
| B6 | Lanadelumab (Takhzyro)O | Sept-18 | X | X | |||||||
| L1 | Larotrectinib (Vitrakvi)C,O | Jul-19 | X | X | X | ||||||
| L1 | Lorlatinib (Lorbrena)C,O | Feb-19 | X | X | X | ||||||
| N7 | Patisiran (Onpattro)O | Jun-19 | X | X | |||||||
| L1 | Talazoparib (Talzenna)C | Sept-19 | X | ||||||||
| R7 | Tezacaftor, ivacaftor (Symdeko)O | Jun-18 | X | ||||||||
| V3 | Zirconium cyclosilicate (Lokelma) | Jul-19 | X | X | |||||||
| J5 | Baloxavir marboxil (Xofluza)O | Feb-20 | |||||||||
| B2 | Damoctocog alfa pegol (Jivi)B | Oct-18 | |||||||||
| L4 | Ravulizumab (Ultomiris)O | Aug-19 | |||||||||
Note: Non-oncology medicines were assessed through CADTH’s Common Drug Review process, while oncology medicines were assessed through the pan-Canadian Oncology Drug Review (pCODR) process.
* Level 2 of the Anatomical Classification of Pharmaceutical Products, as reported in MIDAS.
† B: biologic; C: cancer; O: orphan medicine.
Data source: IQVIA Private Drug Plan database, 2019; Health Canada Notice of Compliance Database; Canadian Agency for Drugs and Technologies in Health (CADTH) reports; pan-Canadian Pharmaceutical Alliance (pCPA) reports; and IQVIA MIDAS® Database rights reserved).
Table B3 Summary of Common Drug Review and pan-Canadian Oncology Drug Review assessments for 2018 new medicines approved in Canada by Q3-2020
| Medicine (trade name)* | Date of recommendation† | Indication(s) | Conditional on price‡ | Type of evaluation (primary)§ | Incremental cost-effectiveness ratio (ICER) ($ per QALY) | Price reduction range ($50,000 per QALY) |
|---|---|---|---|---|---|---|
| Apalutamide (Erleada)C | Nov-18 | Castrate-resistant prostate cancer | Yes | CUA/CEA | 198,826 | – |
| Apalutamide (Erleada)C | Apr-20 | Metastatic castration-sensitive prostate cancer | Yes | CUA/CEA | Dominated** | 50% to 80% |
| Bictegravir (Biktarvy) | Oct-18 | HIV-1 infection | Yes | CUA | – | – |
| Burosumab (Crysvita)B,O | May-20 | X-linked hypophosphatemia | Yes | CUA | 2,703,146 to 3,523,922 | 93% to 94% |
| Caplacizumab (Cablivi)O | Sept-20 | Acquired thrombotic thrombocytopenic purpura (aTTP) | Do not reimburse | CUA | 237,053 | 75% |
| Cemiplimab (Libtayo)B,C | Jan-20 | Cutaneous squamous cell carcinoma | Yes | CUA/CEA | 166,221 | 40% to 80% |
| Dacomitinib (Vizimpro)C,O | May-19 | Non-small cell lung cancer | Yes | CUA | 103,979 to 188,631 | – |
| Doravirine (Pifeltro) | May-19 | HIV-1 infection | Yes | CUA | 168,387 | >40% |
| Erenumab (Aimovig) | Jul-20 | Migraine | Yes | CUA | 39,640 to 153,635 | 22% to 64% |
| Gilteritinib (Xospata)C,O | May-20 | Acute myeloid leukemia (AML) | Yes | CUA/CEA | 168,451 | 90% |
| Inotersen (Tegsedi)O | Dec-19 | Hereditary transthyretin amyloidosis | Yes | CUA | 1,322,377 | 88% |
| Lanadelumab (Takhzyro)O | Nov-19 | Hereditary angioedema, prevention | Yes | CUA | Dominant** to 6,981,558 | 59% to 84% |
| Larotrectinib (Vitrakvi)C,O | Oct-19 | Neurotrophic tyrosine receptor kinase (NTRK) locally advanced or metastatic solid tumours | Do not reimburse | CUA/CEA | 70,619 to 1,295,244 | >55% |
| Lorlatinib (Lorbrena)C,O | Jan-20 | Non-small cell lung cancer | Do not reimburse | CUA | 237,125 | >75% |
| Patisiran (Onpattro)O | Jul-19 | Polyneuropathy in hereditary transthyretin-mediated amyloidosis | Yes | CUA | 4,818,778 | 98% |
| Zirconium cyclosilicate (Lokelma) | Mar-20 | Hyperkalemia, adults | Do not reimburse | CUA | 106,137 to 187,924 | 85% to 90% |
Note: The type of evaluation and the incremental cost-effectiveness ratio (ICER) are based on the CDR estimate (base case) and the pCODR Economic Guidance Panel (EGP) evaluations. The table reports the low-bound and high-bound range estimated for all comparators and conditions analyzed. Cost-utility analysis (CUA) and cost-effectiveness analysis (CEA) evaluations are provided as a range per quality-adjusted life year (QALY). Additional information can be accessed at https://www.cadth.ca.
* B: biologic; C: cancer; O: orphan medicine.
† Initial or final recommendation issued as of Q3-2020.
‡ Price was explicitly defined as a condition for reimbursement.
§ CUA: cost-utility analysis; CEA: cost-effectiveness analysis;
** Dominated indicates that a high-bound ICER value cannot be calculated as the product is more costly and less effective than comparator products. Dominant refers to a negative low-bound ICER value, which indicates that the product is less costly and more effective than comparators.
Data source: Canadian Agency for Drugs and Technologies in Health (CADTH) reports.
C: New Medicine Approvals, 2019
This section provides a preliminary analysis of the new medicines approved internationally in 2019, including information on approval status as of Q3-2020 and pricing as of Q4-2019.
Slightly fewer medicines were authorized for market in 2019 though the total number of approvals continued to be historically high. The 2019 approvals introduced a number of high-cost medicines, most notably in the oncology market, as well as a smaller number of orphan medicines.
Forty-seven new medicines received first-time market approval through the FDA, the EMA, and/or Health Canada in 2019. As of the third quarter of 2020, Health Canada had approved 16 of these new medicines, trailing the EMA (23) and the FDA (44) (Figure C1).
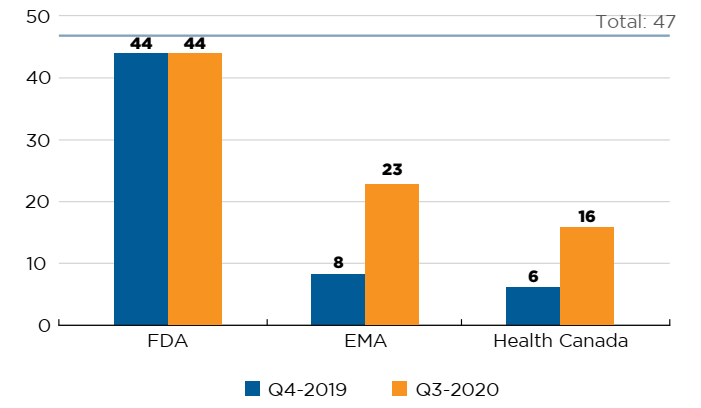
Figure description
This is a bar graph with the number of 2019 new medicines approved by Health Canada, the European Medicines Agency, and the US Food and Drug Administration as of the fourth quarter of 2019 and the third quarter of 2020. The total number of new medicines in 2019 was 47.
| US Food and Drug Administration | European Medicines Agency | Health Canada | |
|---|---|---|---|
| Q4-2019 | 44 | 8 | 6 |
| Q3-2020 | 44 | 23 | 16 |
Note: Based on medicines that received market approval through the US Food and Drug Administration (FDA), the European Medicines Agency (EMA) and/or Health Canada in 2019.
Data source: US Food and Drug Administration, European Medicines Agency, and Health Canada databases.
Table C1 provides a full list of the 47 new medicines approved in 2019 along with their country with first reported sales, availability in Canada, and price and treatment cost where available.Footnote 9 Prices are reported for the highest-selling form and strength of each medicine. Note that this information reflects the early availability and uptake of these medicines in the markets analyzed.
By Q4-2019, 27 new medicines had sales in Canada, the US, and/or the PMPRB11. Over two thirds (20) of these came with treatment costs exceeding $10,000 per year or $5,000 per 28-day course. Notably, the 2019 group of new medicines mirrored the trends observed in 2018, introducing elexecaftor, which is used in combination with tezacaftor and ivacaftor in the cystic fibrosis treatment Trikafta, as well as two analgesics indicated for the treatment of migraines: lasmiditan and ubrogepant.
Table C1 New medicines approved in 2019, availability, prices, and treatment costs, Q4-2019
| Medicine (trade name, form, strength, volume) | Therapeutic class* | Availability | No. of countries with sales§ | Canadian price‡ (CAD) | PMPRB11 price (CAD) | US price (CAD) | Treatment cost** | |||||
|---|---|---|---|---|---|---|---|---|---|---|---|---|
| First sale in Canada, US or PMPRB11 | First sale in Canada | Min | Median | Max | Treatment cost (CAD) | Annual/Course | ||||||
| Alpelisib (Piqray, film-ctd tab, 300 mg)C | L1-Antineoplastics | US | Jun-19 | – | 1 | – | – | – | – | 345 | 126,104 | Annual |
| Brexanolone (Zulresso, infus. vial/bottle, 5 mg/ml, 20 ml) | N6-Psychoanaleptics | US | Jul-19 | – | 1 | – | – | – | – | 8,642 | 27,221 | 60-hour infusion |
| Brolucizumab (Beovu, ophthal. vial, 120 mg/ml, 0.05 ml)B | S1-Ophthalmologicals | US | Oct-19 | – | 1 | 1,418i | – | – | – | 2,284 | 8,508/5,672 | First year/Subsequent years |
| Crizanlizumab (Adakveo, vial, 10 mg/ml, 10 ml)B,O | B6-Other haematological agents | US | Nov-19 | – | 1 | – | – | – | – | 2,943 | 14,347 | Annual |
| Darolutamide (Nubeqa, film-ctd tab, 300 mg)C | L2-Cytostatic hormone therapy | US | Aug-19 | – | 1 | 28i | – | – | – | 112 | 3,175 | 28-day course |
| Elexacaftor (Trikafta‡‡, film-ctd tab, various strengths)O | R7-Other respiratory products | US | Oct-19 | – | 1 | – | – | – | – | 308 | 336,734 | Annual |
| Enfortumab vedotin (Padcev, infus. dry bottle, 20 mg)B,C | L1-Antineoplastics | US | Dec-19 | – | 1 | – | – | – | – | 2,769 | 38,935 | 28-day course |
| Entrectinib (Rozlytrek, capsule, 200 mg)B,C,O | L1-Antineoplastics | US | Aug-19 | – | 2 | 95 | 96 | 96 | 96 | 232 | 254,469 | Annual |
| Erdafitinib (Balversa, film-ctd tab, 4 mg)C | L1-Antineoplastics | US | Apr-19 | – | 1 | – | – | – | – | 459 | 376,652 | Annual |
| Fedratinib (Inrebic, capsule, 100 mg)C,O | L1-Antineoplastics | US | Aug-19 | – | 1 | – | – | – | – | 204 | 297,876 | Annual |
| Istradefylline (Nouriast/Nourianz, film-ctd tab, 20 mg) | N4-Anti-Parkinson drugs | JPN | May-13 | – | 2 | – | 8 | 8 | 8 | 52 | 19,157 | Annual |
| Lefamulin (Xenleta, film-ctd tab, 600 mg) | J1-Systemic antibacterials | US | Sept-19 | – | 1 | – | – | – | – | 171 | 1,709 | 10 days (in lieu of infusion) |
| Luspatercept (Reblozyl, vial dry, 75 mg)B,O | B3-Anti-anaemic preparations | US | Nov-19 | – | 1 | – | – | – | – | 12,556 | 217,633 | Annual |
| Onasemnogene abeparvovec (Zolgensma, infus. vial/bottle)B,G,O | N7-Other central nervous system drugs | US | Jul-19 | – | 1 | – | – | – | – | 93,606 | – | – |
| Pexidartinib (Turalio, capsule, 200 mg)C,O | L1-Antineoplastics | US | Aug-19 | – | 1 | – | – | – | – | 188 | 274,980 | Annual |
| Polatuzumab vedotin (Polivy, infus. dry bottle, 140 mg)B,C,O | L1-Antineoplastics | US | Jun-19 | – | 1 | – | – | – | – | 17,935 | 103,765 | Six 21-day cycles |
| Pretomanid (Pretomanid), tablet, 200 mg)O | J4-Antimycobacterials | US | Dec-19 | – | 1 | – | – | – | – | 20 | 3,647 | 26 weeks |
| Risankizumab (Skyrizi, prefill syrng sc, 90 mg/ml, 0.83 ml)B | D5-Nonsteroidal products for inflammatory skin disorders | US | Apr-19 | May-19 | 8 | 2,523 | 2,251 | 2,400 | 3,611 | – | 14,805 | Annual |
| Romosozumab (Evenity, prefill syrng sc, 90 mg/ml, 1.17 ml)B | M5-Other drugs for disorders of the musculo-skeletal system | JPN | Mar-19 | Aug-19 | 3 | 331 | – | – | – | 1,131 | 7,935 | Annual |
| Selinexor (Xpovio, film-ctd tab)C,O | L1-Antineoplastics | US | Jul-19 | – | 1 | – | – | – | – | 796 | 331,106 | Annual |
| Siponimod (Mayzent, film-ctd tab, 2 mg) | N7-Other central nervous system drugs | US | May-19 | – | 1 | 89i | – | – | – | 308 | 32,622 | Annual (maintenance) |
| Solriamfetol (Sunosi, film-ctd tab, 150 mg)O | N7-Other central nervous system drugs | US | Jun-19 | – | 1 | – | – | – | – | 28 | 10,046 | Annual (at max. dose) |
| Trifarotene (Aklief, cream, 45 g) | D10-Anti-acne preparations | US | Nov-19 | – | 1 | 2 | – | – | – | 15 | NA | Topical use |
| Turoctocog alfa pegol (Esperoct, vial dry ret., 3000 IU)B | B2-Blood coagulation system | GER | Aug-19 | – | 1 | – | 5,262 | 5,262 | 5,262 | – | 516,854 | Annual |
| Upadacitinib (Rinvoq, ret. tablet, 15 mg) | M1-Anti-inflammatory and anti-rheumatic products | US | Aug-19 | – | 1 | 49i | – | – | – | 197 | 17,770 | Annual |
| Voxelotor (Oxbryta, film-ctd tab, 500 mg)O | B6-Other haematological agents | US | Dec-19 | – | 1 | – | – | – | – | 131 | 143,272 | Annual |
| Zanubrutinib (Brukinsa, capsule, 80 mg)C,O | L1-Antineoplastics | US | Dec-19 | – | 1 | – | – | – | – | 122 | 178,637 | Annual |
Medicines without sales data in MIDAS® as of Q4-2019
| Medicine (trade name, form, strength, volume) | Therapeutic class* | First approval by FDA, EMA, and/or Health Canada | First approval in Canada | |
|---|---|---|---|---|
| Air polymer-type A (ExEm Foam) | Not assigned as of Q4-2019 | FDA | Nov-19 | – |
| Betibeglogene autotemcel (Zynteglo)B,O,G | B06-Other haematological agents | EMA | May-19 | – |
| Bremelanotide (Vyleesi) | G2-Other gynaecologicals | FDA | Jun-19 | – |
| Brilliant blue G opthalmic (TissueBlue)O | Not assigned as of Q4-2019 | FDA | Dec-19 | – |
| Cefiderocol (Fetroja) | J01-Antiinfectives and antiseptics for local oral treatment | FDA | Nov-19 | – |
| Cenobamate (Xcopri) | N03-Antiepileptics | FDA | Nov-19 | – |
| Ebola Zaire vaccine (Ervebo)B,O | J07-Vaccines | EMA | Dec-19 | – |
| Fam-trastuzumab deruxtecan (Enhertu)B,C | L01-Antineoplastic agents | FDA | Dec-19 | – |
| Fluorodopa F-18 | V09-Diagnostic radiopharmaceuticals | FDA | Oct-19 | – |
| Givosiran (Givlaari)O | A16-Other alimentary tract and metabolism products | FDA | Nov-19 | – |
| Golodirsen (Vyondys 53)O | M09-Other drugs for disorders of the musculo-skeletal system | FDA | Dec-19 | – |
| Relebactam (Recarbrio) | J01-Antibacterials for systemic use | FDA | Jul-19 | – |
| Lasmiditan (Reyvow) | Not assigned as of Q4-2019 | FDA | Oct-19 | – |
| Lemborexant (Dayvigo) | Not assigned as of Q4-2019 | FDA | Dec-19 | – |
| Lumateperone tosylate (Caplyta) | Not assigned as of Q4-2019 | FDA | Dec-19 | – |
| Sotagliflozin (Zynquista) | A10-Drugs used in diabetes | EMA | Apr-19 | – |
| Tenapanor (Ibsrela) | A06-Drugs for constipation | FDA | Sept-19 | Apr-20§§ |
| Ubrogepant (Ubrely) | N02-Analgesics | FDA | Dec-19 | – |
| Modified Vaccinia Ankara (Jynneos)B | J05-Antivirals for systemic use | FDA | Sept-19 | – |
| Volanesorsen (Waylivra)O | C10-Lipid-regulating/anti-atheroma preparations | FDA | May-19 | – |
Note: A medicine was considered to be new in 2019 if it received market approval through the US Food and Drug Administration (FDA), the European Medicines Agency (EMA), and/or Health Canada during the calendar year.
Availability and sales information refers to all forms and strengths of the medicine while pricing and treatment costs are based on the highest-selling form and strength indicated. Sales are based on manufacturer list prices. Specialty medicines are indicated using the following abbreviations: B: biologic; C: cancer; O: orphan medicine; G: gene therapy.
* Level 2 of the Anatomical Classification of Pharmaceutical Products, as reported in MIDAS, except for the new medicines without sales data in MIDAS, for which the reporting is based on the Anatomic Therapeutic Chemical (ATC) Classification System maintained by the World Health Organization (WHO).
† Australia, Belgium, France, Germany, Italy, Japan, Netherlands, Norway, Spain, Sweden, and the United Kingdom.
‡ Includes all PMPRB11 countries, as well as the US and Canada.
§ Canadian unit prices were retrieved from IQVIA MIDAS® Database, where available; otherwise, they were taken from:
i CADTH's Canadian Drug Expert Committee Recommendation report.
** Treatment costs were calculated using Canadian list prices if available; otherwise, the foreign median price or available foreign price was used. Information on dosing regimens was taken from the product monograph provided by Health Canada, or the FDA or EMA if unavailable though Health Canada. If PMPRB11 prices were not available, the US price was used.
‡‡ Trikafta is included in both the 2018 and 2019 lists because it contains both the 2018 new medicine tezacaftor and the 2019 new medicine elexacaftor. Despite being released in 2019, Trikafta was the top-selling product for each of the new medicines by Q4-2019.
§§ Notice of Compliance issued as of Q3-2020.
Data source: IQVIA MIDAS® Database, 2019 (all rights reserved); US Food and Drug Administration Novel Drugs 2019; European Medicines Agency Human Medicines Highlights 2019; Health Canada Notice of Compliance Database.
Figure C2 illustrates the overlap between the number of new specialty medicines authorized for market in 2019. Orphan-designated medicines continued to represent an important share of the new medicines market in 2019, accounting for 40% (19) of new approvals, down from a 61% share in 2018. Similarly, orphan oncology treatments made up 10% (6) of the total new medicines, a decrease over their 25% share the year before. Approximately 30% (14) of the 2019 new medicines were biologics.
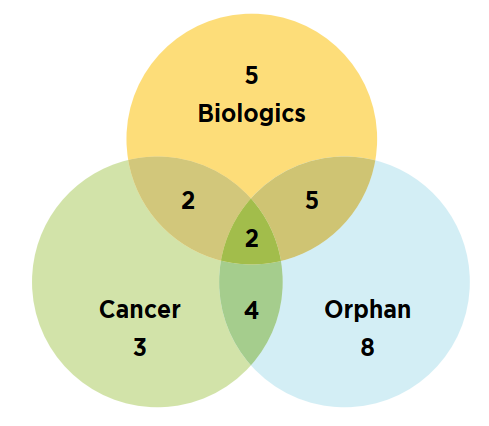
Figure description
This is a Venn diagram illustrating the overlap between orphan, biologic, and oncology treatments among the 2019 new medicines. Of the 47 new approvals, a total of 14 medicines were biologic, 19 had an orphan designation, and 11 were cancer medicines. Of these, five were both biologic and orphan, two were both biologic and oncological, four were both orphan and oncological, and two were biologic cancer medicines that also received an orphan designation.
Data source: IQVIA MIDAS® Database, 2019 (all rights reserved).
D: Spotlight on Canada
While sections B and C report new medicines approved internationally, this section focuses on the medicines that received their first Canadian market authorization in 2018.
The number of new-to-Canada medicines approved in 2018 was in line with recent years and included many of the top-selling new medicines on the international list of approvals from the same year.
Health Canada granted initial market authorization to 40 medicines in 2018, of which 22 had sales by the end of 2019. This volume of approvals was in line with the three previous years, during which time an average of nine new medicines were approved per quarter (Figure D1).
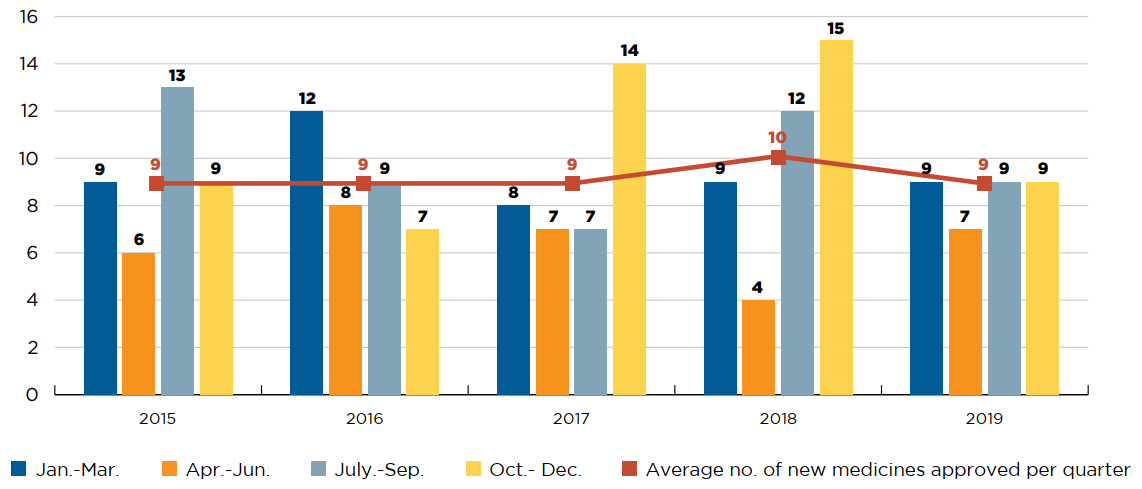
Figure description
This is a bar graph showing the number of new medicines approved quarterly by Health Canada between 2015 and 2019. For each year, the number of new approvals is given for January to March; April to June; July to September; and October to December. A trend line gives the annual average number of new medicines approved per quarter.
| January to March | April to June | April to June | October to December | Average number of new medicines approved per quarter | |
|---|---|---|---|---|---|
| 2015 | 9 | 6 | 13 | 9 | 9 |
| 2016 | 12 | 8 | 9 | 7 | 9 |
| 2017 | 8 | 7 | 7 | 14 | 9 |
| 2018 | 9 | 4 | 12 | 15 | 10 |
| 2019 | 9 | 7 | 9 | 9 | 9 |
Data source: Health Canada Notice of Compliance database (NOC).
Table D1 reports on the availability, sales, and pricing of these 40 new-to-Canada medicines as of Q4-2019. Notably, four of the five highest-selling medicines reported in the list of 2018 new medicines in Table B1 were also reported here, indicating that Canadian approval occurred in the same year as international approval. Overall, new-to-Canada medicines accounted for 1.6% of branded pharmaceutical sales in Canada in 2018. For each medicine, Table D1 also provides foreign-to-Canadian price ratios, which compare the median price of medicines in the PMPRB11 countries and the US price with the Canadian price. The average price of the medicine in Canada is set to a value of one and the corresponding foreign prices are reported relative to this value. The resulting ratios reflect how much more or less Canadians would have paid for a new medicine if they had paid the median international price or the US price.
The median PMPRB11 to Canadian price ratio reported across all new medicines was 0.81, indicating that international prices in Q4-2019 were approximately 19% lower than Canadian prices. In contrast, the median US price ratios show that the US pays about three times more than Canada for the same medicines.Footnote 10
Table D1 Medicines first approved in Canada in 2018, availability, sales, and prices as of Q4-2019
| Medicine (trade name, form, strength, volume) | Therapeutic class* | Availability | Share of Canadian new medicine sales | No. of countries with sales‡ | Price (CAD) | ||||||
|---|---|---|---|---|---|---|---|---|---|---|---|
| First sale in the PMPRB11† | First sale in Canada | First sale in US | Canada | PMPRB11 median | US | Median PMPRB11-to-Canadian price ratio | US-to-Canadian price ratio | ||||
| Apalutamide (Erleada, film-ctd tab, 60 mg)C | L2B2-Cytostatic anti-androgens | Jan-19 | Jul-18 | Feb-18 | 6% | 5 | 29 | 36 | 115 | 1.26 | 3.95 |
| Baricitinib (Olumiant, film-ctd tab, 2 mg)O | M1C0-Specific anti-rheumatic agents | Feb-17 | Sept-18 | Jun-18 | 1% | 10 | 48 | 40 | 86 | 0.85 | 1.80 |
| Benralizumab (Fasenra, prefill syrng sc, 30 mg/ml, 1 ml)B | R3M0-Interleukin inhibitor anti-asthmatics | Jan-18 | Mar-18 | Dec-17 | 13% | 10 | 3,746 | 3,115 | 5,934 | 0.83 | 1.58 |
| Bictegravir (Biktarvy, film-ctd tab, 50 mg + 200 mg + 25 mg) | J5C9-HIV antivirals, other | Jun-18 | Aug-18 | Feb-18 | 21% | 11 | 36 | 40 | 118 | 1.10 | 3.24 |
| Brigatinib (Alunbrig, film-ctd tab, 180 mg)C,O | L1H3-Protein kinase inhibitor (PKI) antineoplastics, ALK | Jun-18 | Dec-18 | May-17 | <1% | 4 | 330 | 242 | 590 | 0.73 | 1.79 |
| Brodalumab (Siliq, prefill syrng sc, 140 mg/ml, 1.5 ml)B | D5B0-Systemic antipsoriasis products | Sept-16 | Jul-18 | Aug-17 | 1% | 6 | 622 | 791 | 2,118 | 1.23 | 3.40 |
| Burosumab (Crysvita, vial sc, 30 mg/ml, 1 ml)B,O | M5X0-All other musculoskeletal products | Feb-18 | – | May-18 | <1% | 5 | – | 13,367 | 11,529 | – | – |
| Cabozantinib (Cometriq, film-ctd tab, 40 mg)C,O | L1H9-Protein kinase inhibitor (PKI) antineoplastics, other | Mar-14 | Oct-18 | May-16 | 2% | 9 | 439 | 280 | 629 | 0.64 | 1.43 |
| Calcifediol (Rayaldee, ret. capsule, 30 mcg) | H4F0-Antiparathyroid products | Sept-78 | – | Dec-16 | <1% | 0 | – | – | 45 | – | – |
| Cerliponase alfa (Brineura, other infus., 30 mg/ml, 5 ml)B,O | N7X0-All other CNS drugs | May-17 | – | Jun-17 | <1% | 1 | – | 25,710 | 30,513 | – | – |
| Crisaborole (Eucrisa, ointment, 2%, 60 g) | D5X0-Other nonsteroidal products for inflammatory skin disorders | – | Nov-18 | Feb-17 | 1% | 1 | 2 | 2 | 13 | 0.79 | 5.51 |
| Dalbavancin (Dalvance, infus. dry bottle, 500 mg) | J1X1-Glycopeptide antibacterials | Feb-15 | – | Jul-14 | <1% | 0 | – | – | 1,348 | – | – |
| Damoctocog alfa pegol (Jivi, vial dry ret., 3000 IU)B | B2D1-Factor VIII, including substitutes | Mar-19 | – | Sept-18 | <1% | 5 | – | 4,193 | 6,974i | – | – |
| Dinutuximab (Unituxin, infus. vial/bottle, 3.5 mg/ml)B,C,O | L1G9-Monoclonal antibody antineoplastics, other | Nov-16 | – | Jul-15 | <1% | 0 | – | – | 14,074 | – | – |
| Doravirine (Pifeltro, film-ctd tab, 100 mg) | J5C3-Non-nucleoside reverse transcriptase inhibitors | Nov-18 | Nov-18 | Sept-18 | <1% | 7 | 17 | 22 | 53 | 1.30 | 3.21 |
| Edaravone (Radicava, infus. bag, 300 mcg/ml, 100 ml)O | N7X0-All other CNS drugs | Jun-01 | – | Aug-17 | <1% | 0 | – | – | 681 | – | – |
| Elagolix (Orilissa, film-ctd tab, 150 mg) | H1C3-Antigonadotrophin-releasing hormones | – | Oct-18 | Aug-18 | 1% | 0 | 6 | – | 38 | – | 6.15 |
| Emicizumab (Hemlibra, vial sc, 150 mg/ml, 0.7 ml)B,O | B2D1-Factor VIII, including substitutes | Feb-18 | – | Dec-17 | <1% | 9 | – | 11,838 | 11,769 | – | – |
| Erenumab (Aimovig, prefill autoinj., 70 mg/ml, 1 ml) | N2C9-All other anti-migraine preparations | Jul-18 | Dec-18 | May-18 | 4% | 5 | 545 | 591 | 674 | 1.08 | 1.24 |
| Ertugliflozin (Steglatro, film-ctd tab, 15 mg) | A10P1-SGLT2 inhibitor antidiabetics, plain | Mar-18 | May-18 | Jan-18 | <1% | 6 | 3 | 2 | 11 | 0.61 | 4.31 |
| Flibanserin (Addyi, film-ctd tab, 100 mg) | G2X9-Other gynaecologicals | – | Feb-19 | Oct-15 | <1% | 0 | 8 | – | 17 | – | 2.08 |
| Follitropin delta (Rekovelle, cartridges, 33.3 mcg/ml, 2.16 ml)B | G3G0-Gonadotrophins, including other ovulation stimulants | Feb-17 | Sept-18 | – | <1% | 5 | 1,085 | 718 | – | 0.66 | – |
| Hemin (Panhematin, infus. dry bottle, 350 mg)B | B6C0-Other haematological agents | Nov-90 | – | Nov-83 | <1% | 0 | – | – | 9,057 | – | – |
| Inotersen (Tegsedi, prefill syrng sc, 189 mg/ml, 1.5 ml)O | N7X0-All other CNS drugs | Aug-18 | – | – | <1% | 2 | – | 8,351 | – | – | – |
| Inotuzumab ozogamicin (Besponsa, infus. dry bottle, 900 mcg)B,C,O | L1G9-Monoclonal antibody antineoplastics, other | Apr-17 | May-18 | Aug-17 | 1% | 0 | 14,119 | – | – | – | – |
| Iron ferric (Monoferric, vial IV, 100 mg/ml, 10 ml) | B3A1-Plain iron | – | Jan-19 | – | 1% | 1 | 444i | – | – | – | – |
| Isavuconazole (Cresemba, capsule, 100 mg)O | J2A0-Systemic agents for fungal infections | Oct-15 | Jul-19 | Apr-15 | <1% | 8 | 77 | 66 | – | 0.85 | – |
| Lanadelumab (Takhzyro, vial sc, 150 mg/ml, 2 ml)O | B6D0-Hereditary angioedema products | Oct-18 | – | Sept-18 | <1% | 5 | – | 19,049 | 25,658 | – | – |
| Latanoprostene bunod (Vyzulta, eye drops, 0.02%, 5 ml) | S1E2-Miotics and antiglaucoma preparations, topical | – | May-19 | Dec-17 | <1% | 0 | <1 | – | 5 | – | 17.41 |
| Patiromer calcium (Veltassa, oral u-d powder, 8.4 g/dose) | V3G1-Hyperkalaemia products | Jul-17 | – | Dec-15 | <1 | 6 | – | 12 | 35 | – | – |
| Pralatrexate (Folotyn, vial IV, 20 mg/ml, 2 ml)C,O | L1B0-Antimetabolites | Aug-17 | – | Jan-10 | <1% | 0 | – | – | 8,923 | – | – |
| Ribociclib (Kisqali, film-ctd tab, 200 mg)C | L1H5-Protein kinase inhibitor (PKI) antineoplastics, CDK 4/6 | Apr-17 | Apr-18 | Mar-17 | 3% | 8 | 82 | 72 | 243 | 0.87 | 2.95 |
| Semaglutide (Ozempic, prefill pens, 1.34 mg/ml, 3 ml) | A10S0-GLP-1 agonist antidiabetics | Feb-18 | Feb-18 | Jan-18 | 40% | 8 | 199 | 125 | – | 0.63 | – |
| Sucroferric oxyhydroxide (Velphoro, chew tab, 500 mg) | V3G2-Hyperphosphataemia products | Aug-14 | – | Mar-14 | <1% | 10 | – | 2 | 14 | – | – |
| Suvorexant (Belsomra, film-ctd tab, 15 mg) | N5B1-Non-barbiturates, plain | Nov-14 | – | Jan-15 | <1% | 1 | – | 1 | 14 | – | – |
| Telotristat etiprate (Xermelo, film-ctd tab, 250 mg)O | A7X0-Intestinal disorder products, other | Sept-17 | Dec-18 | Mar-17 | <1% | 8 | 88 | 18 | 83 | 0.21 | 0.95 |
| Tezacaftor (Symdeko, film-ctd tab, 150 mg + 100 mg)O | R7X0-All other respiratory system products | Dec-18 | – | Feb-18 | <1% | 5 | – | 331 | 418 | – | – |
| Tipiracil (Lonsurf, film-ctd tab, 8.19 mg + 20 mg)C | L1B0-Antimetabolites | May-14 | Mar-18 | Oct-15 | 2% | 8 | 83 | 49 | 246 | 0.59 | 2.97 |
| Tisagenlecleucel (Kymriah, infus. bags)B,C,O,G | L1X5-CAR T-cell therapy antineoplastics | Jul-18 | – | – | <1% | 5 | – | 401,958 | – | – | – |
Medicines without sales data in MIDAS® as of Q4-2019
| Medicine (trade name, form, strength, volume) | Therapeutic class* | First approval by Health Canada | First sale in Canada |
|---|---|---|---|
| Anthrax antigen filtrate (Biothrax)B | J6BB19-Anthrax immunoglobulin | Dec-18 | - |
Note: Specialty medicines are indicated using the following abbreviations: B: biologic; C: cancer; O: orphan medicine.
* Level 4 of the Anatomical Classification of Pharmaceutical Products, as reported in MIDAS; if unavailable in MIDAS, the reporting is based on the Anatomical Therapeutic Chemical (ATC) Classification System maintained by the World Health Organization (WHO).
† Australia, Belgium, France, Germany, Italy, Japan, Netherlands, Norway, Spain, Sweden and the United Kingdom.
‡ Includes all PMPRB11 countries, as well as the US and Canada.
§ Canadian unit prices were retrieved from IQVIA MIDAS® Database, where available; otherwise, they were taken from:
i CADTH's Canadian Drug Expert Committee Recommendation report.
Data source: IQVIA MIDAS® Database, 2019, all rights reserved; Health Canada Notice of Compliance Database.
References
European Medicines Agency. 2019. Human Medicines Highlights 2018. Available: https://www.ema.europa.eu/en/news/human-medicines-highlights-2018
European Medicines Agency. 2020. Human Medicines Highlights 2019. Available: https://www.ema.europa.eu/en/news/human-medicines-highlights-2019
Food and Drug Administration. 2019. Novel Drugs 2018. Silver Spring, Maryland: US FDA, Center for Drug Evaluation and Research. Available: https://www.fda.gov/drugs/new-drugs-fda-cders-new-molecular-entities-and-new-therapeutic-biological-products/novel-drug-approvals-2018
Food and Drug Administration. 2020. Novel Drugs 2019. Silver Spring, Maryland: US FDA, Center for Drug Evaluation and Research. Available: https://www.fda.gov/drugs/new-drugs-fda-cders-new-molecular-entities-and-new-therapeutic-biological-products/novel-drug-approvals-2019
Health Canada. 2019. Drug and medical device highlights 2018: Helping you maintain and improve your health. Ottawa: Health Canada. Available: https://www.canada.ca/en/health-canada/services/publications/drugs-health-products/drug-medical-device-highlights-2018.html
Health Canada. 2020. Drug and medical device highlights 2019: Helping you maintain and improve your health. Ottawa: Health Canada. Available: https://www.canada.ca/en/health-canada/services/publications/drugs-health-products/drug-medical-device-highlights-2019.html
PMPRB. 2020. Annual Report, 2018. Ottawa: Patented Medicine Prices Review Board. Available: https://www.canada.ca/en/patented-medicine-prices-review/services/reports-studies/annual-report-2018.html
Appendix I
Share of brand-name medicine sales for select medicines in Canada, 2018 and Q4-2019
| Medicine | Year of approval | 2018 | Q4-2019 | ||
|---|---|---|---|---|---|
| Rank of sales among new medicines* | Share of brand-name sales | Rank of sales among new medicines* | Share of brand-name sales | ||
| Velpatasvir | 2016 | 1 | 3.3% | 1 | 1.8% |
| Elbasvir | 2016 | 2 | 0.7% | 20 | 0.2% |
| Grazoprevir | 2016 | 3 | 0.7% | 21 | 0.2% |
| Semaglutide | 2017 | 17 | 0.1% | 5 | 0.7% |
| Daratumumab | 2015 | 21 | 0.1% | 2 | 1.0% |
* New medicines were determined based on the date of first-time market approval by the US Food and Drug Administration, the European Medicines Agency, and/or Health Canada.
Data source: IQVIA MIDAS® Database, 2019. All rights reserved.