
Adult National Immunization Coverage Survey (aNICS): 2023 results
On this page
Key highlights
- Among adults 18 years of age and older, immunization coverage for routine vaccines ranged from 87% for measles to 18% for HPV vaccines. Mpox immunization coverage was only 6%, however, it is not routinely recommended for the adult general population, so coverage is expected to be low. Variations also existed by age group, sex assigned at birth, jurisdiction, presence of chronic condition, presence of disability, and among health care workers.
- To date, none of Canada's national vaccination coverage goals have been reached for adults.
- Vaccination coverage goals have not been achieved for receipt of 1 dose of pneumococcal vaccine among adults 65 years and older (55% versus a goal of 80%). This result aligns with the 2020 to 21 Seasonal Influenza (flu) Vaccination Coverage Survey (SIVCS).
- Vaccination coverage goals have also not been achieved for influenza vaccination among adults 65 years of age and older (70.2% versus a goal of 80%) and among adults aged 18 to 64 with chronic health conditions (46.8% versus a goal of 80%). These results align with the 2022 to 23 SIVCS.
- The Public Health Agency of Canada (PHAC) also reports on hepatitis B (86.6%) and influenza (56.5%) immunization coverage among health care workers (HCW) to track vaccination coverage goals (90% for Hep B and 80% for influenza).
- Outbreaks of highly contagious diseases such as measles and polio have been reported in several countries in 2023. In Canada, 87% of adults have received at least one dose of measles vaccine and 84% have received at least one dose of polio vaccine. Outbreaks of invasive meningococcal disease, a serious bacterial infection, have also been reported in several countries in 2023. 61% of adults living in Canada have received at least one dose of a meningococcal vaccine.
- Isolated outbreaks for these vaccine preventable diseases have been reported in several countries in 2023, however through robust surveillance to detect cases in addition to high rates of immunization coverage, Canada has prevented widespread outbreaks.
- There are no vaccination coverage targets for these vaccines among adults as these vaccines are typically given during childhood. To ensure children are protected through routine vaccination, a high vaccination coverage goal of 95% was established for children by 2 and 7 years of age. This high coverage also helps develop herd immunity that protects Canadians in general, including adults at risk of these VPDs.
- Human papillomavirus (HPV) is the most common sexually transmitted infection and the leading cause for cervical cancer among other types of cancers. Overall HPV immunization coverage among adults aged 18 years and older was 17.7%; females reported higher vaccine coverage compared to males (22.5% versus 12%), younger individuals reported higher vaccine coverage (62.9% among 18 to 26 year olds, compared to 12.5% among adults aged 27 years and older).
- Sociodemographic variations:
- Immunization coverage for hepatitis B, varicella, HPV, pneumococcal, shingles, polio, and meningococcal vaccines was higher among adults living in urban settings. Tetanus immunization coverage was higher among adults living in rural settings, while no major differences were reported for pertussis, measles, and meningococcal vaccines.
- Immunization coverage varies by ethnicity and was highest among Latinos/Latinas for hepatitis B, tetanus, varicella, mpox, and meningococcal vaccines; Black individuals for pertussis vaccine; East/Southeast Asian individuals for HPV vaccine; Indigenous populations for measles vaccine; South Asian individuals for polio vaccine; and White individuals for shingles and pneumococcal vaccines.
- COVID-19 immunization coverage: 94.5% of adults received at least 1 dose of an approved COVID-19 vaccine. There was no notable variation by sex and age, except for higher coverage among adults ages 65 to 79 (97.1%). Health care workers were also more likely to have received at least 1 dose (97.1%). Among adults who had not received any doses of a COVID-19 vaccine, 16.3% indicated they are likely to get vaccinated in the future, while among those with 1 or 2 doses, 26.3% indicated a likelihood of getting additional doses in the future.
- Influenza immunization coverage: 44.4% of adults received the influenza vaccine during the 2022 to 23 influenza season. Females were more likely than males to be vaccinated, and older adults (65+) were more likely to be vaccinated than younger adults (under 50). The COVID-19 pandemic did not impact influenza vaccination behaviour for 73.9% of adults.
- Knowledge, attitudes, and beliefs on routine vaccines:
- Health care providers (HCP) (70.7%) and PHAC (58.1%) were the most trusted sources of information on immunization.
- In general, 18% of adults were hesitant or reluctant to get vaccinated, while 6.5% of unvaccinated adults refused 1 or more vaccines. The most commonly cited reason for hesitancy/reluctance was concerns about the safety of vaccination and/or side effects (45.0%), while feeling vaccination is unnecessary was the most cited reason for vaccine refusal (49%).
- Among non-immunised individuals, intentions to receive routine vaccines if recommended by a health care provider ranged between 45% for measles and 75% for shingles.
- The majority of adults agreed that vaccines are safe (89%), effective (90%), getting vaccinated can also protect people with a weaker immune system (88.7%), and that public health guidance recommends vaccination even for diseases that are not common anymore (78.6%).
- Travel vaccines: PHAC is also reporting on vaccines received prior to travelling abroad for the most recent trip in the past 5 years. The most commonly received vaccines were COVID-19 vaccine (81.4%), followed by hepatitis A vaccine (16.7%), yellow fever vaccine (7.7%), cholera and traveller's diarrhea vaccine (7.6%), and Typhoid vaccine (6.2%).
Introduction
The adult National Immunization Coverage Survey (aNICS) is a national survey conducted by the Public Health Agency of Canada to measure routine immunization coverage among adults in Canada. The survey is given to the general population of adults 18 years of age and older, across all 10 provinces and 3 territories. In Canada, numerous vaccines are recommended for adults, and especially for populations at risk, such as immunocompromised individuals.
The availability of publicly funded vaccines for healthy adults varies across jurisdictions; tetanus, diphtheria and pertussis vaccine is offered as either 1 booster dose for adult lifetime or as a dose every 10 years in some jurisdictions; tetanus and diphtheria toxoid vaccine is offered every 10 years in most jurisdictions, 1 dose of pneumococcal polysaccharide vaccine is publicly funded in all jurisdictions for individuals 65 years and older (50 years and older in NU), 2 doses of herpes Zoster are offered for seniors in select jurisdictions (age varies), while HPV vaccines are publicly funded in some jurisdictions where eligibility is dependant on age group and risk factors.
The aNICS was first implemented by PHAC in 2001 and was then administered every 2 years between 2006 and 2016 when it was discontinued. A small subset of its questions was merged into the annual Seasonal Influenza (Flu) Vaccination Coverage Survey (SIVCS) between 2018 and 2021. PHAC relaunched the aNICS in 2023.
The 2023 aNICS provides key information about routine vaccine coverage as well as seasonal influenza (flu) and COVID-19 vaccination among Canadian adults. The routine vaccines assessed include:
- hepatitis B
- tetanus
- pertussis (whooping cough)
- varicella (chicken pox)
- human papillomavirus (HPV)
- shingles
- pneumococcal (pneumonia)
- mpox
- polio
- measles
- meningococcal vaccines
In addition, the aNICS assess respondents' reasons for receiving vaccines, knowledge, attitudes and beliefs (KAB) with regards to vaccines, respondent intentions to vaccinate, reasons for not receiving vaccines, hesitancy/refusal and barriers to vaccination, and select demographic information. For the first time, the 2023 aNICS collected information on immunization coverage among travellers. Information on vaccine coverage among adults with chronic health conditions are also presented.
Detailed results tables and the methodological report are published on the Library and Archives Canada website. The following summary presents survey findings from the 2023 aNICS where data collection started on April 4, 2023 and ended on July 26, 2023. All differences noted are significant at the 95% confidence interval.
Results
Routine immunization coverage
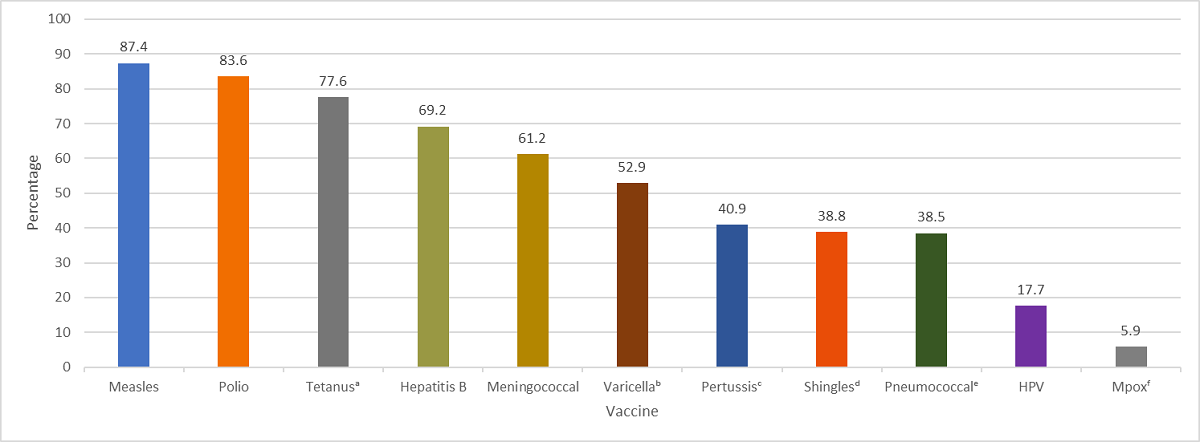
The 2023 adult National Immunization Coverage Survey (aNICS) asked respondents if they have ever been vaccinated for 11 routine vaccines, though number of doses received was not available. Results indicated that among adults 18 years of age and older, routine immunization coverage varied significantly by vaccine-preventable disease (VPD): immunization coverage was highest for measles vaccine (87.4%)Footnote 1, followed by polio vaccine (83.6%), tetanus vaccine provided in the last 10 years (77.6%), hepatitis B vaccine (69.2%), meningococcal vaccine (61.2%), pertussis or whooping cough vaccineFootnote 2 received as an adult (40.9%), pneumococcal vaccineFootnote 3 received as an adult (38.5%), and human papillomavirus (HPV) vaccine (17.7%). Monkeypox (mpox) immunization coverage as an adult was only 5.9%, however, it is not routinely recommended for the adult general population, so coverage is expected to be low.
About 52.9% of adults younger than 50 years received the varicella (chickenpox) vaccineFootnote 4 while 85.9% of unvaccinated individuals reported having contracted varicella. 38.8% of adults aged 50 years and older received at least 1 dose of the herpes zoster (shingles) vaccine (Figure 1).
Overall, immunization coverage reported from the aNICS is higher compared to what has been reported from the 2020 to 21 Seasonal Influenza (flu) Vaccination Coverage Survey against tetanus (77.6% versus 67%), shingles (38.8% versus 27%) and pertussis (40.9% versus 34%). Direct statistical comparison cannot be made due to methodological differences between the 2 surveys.
- a Tetanus vaccine received in the last 10 years
- b Among adults younger than 50 years of age
- c For adults, the pertussis booster is given in combination with tetanus and diphtheria (Tdap) in Canada. Pertussis vaccination refers to a pertussis-containing vaccine received in adulthood
- d Among adults aged 50 years and older
- e Among adults aged 18 to 64 years with at least 1 chronic health condition and all adults aged 65 and older (50 and older in Nunavut), or all respondents who were current smokers at the time of the survey
- f Respondents were asked if the vaccine was given as an adult
Figure 1: Text description
| Vaccine | Estimate |
|---|---|
| Measles | 87.4% |
| Polio | 83.6% |
| TetanusFootnote a | 77.6% |
| Hepatitis B | 69.2% |
| Meningococcal | 61.2% |
| VaricellaFootnote b | 52.9% |
| PertussisFootnote c | 40.9% |
| ShinglesFootnote d | 38.8% |
| PneumococcalFootnote e | 38.5%↑ |
| HPV | 17.7% |
| MpoxFootnote f | 5.9% |
|
|
Vaccination coverage goals: The vaccination coverage goals for adult vaccinations includes a target of 80% vaccination coverage (1 dose) of a pneumococcal vaccine among adults 65 years of age and older, and 90% coverage (1 dose) of hepatitis B vaccine among healthcare professionals, both by 2025.
- Among adults aged 65 and older, 54.7% had received the pneumococcal vaccine as an adult. This result aligns with previously reported immunization coverage estimates from the 2020 to 21 Seasonal Influenza Vaccination Coverage Survey (55%).
- Among health care workers, 86.6% had received the hepatitis B vaccine.
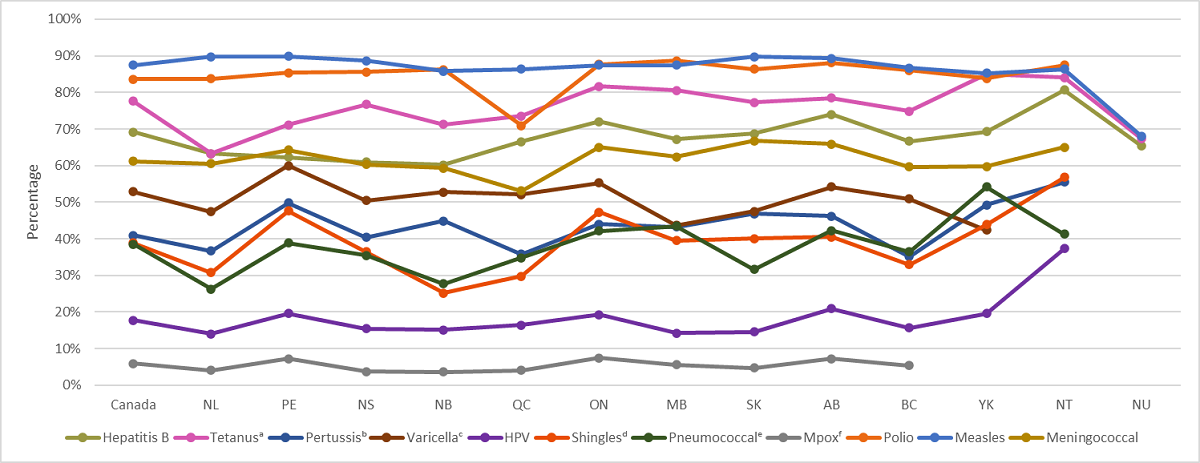
Provincial and territorial coverage estimates varied significantly for each routine vaccine. The Northwest Territories had the highest coverage for multiple vaccines, including hepatitis B vaccine, pertussis vaccine received as an adult, HPV vaccine, and shingles vaccine. Prince Edward Island had the highest coverage for varicella vaccine and measles vaccine. Yukon had the highest coverage for pneumococcal vaccine received as an adult and tetanus vaccine provided in the last 10 years. Ontario, Alberta, and PEI had the highest coverage for mpox vaccine received as an adult. Manitoba had the highest coverage for polio vaccine. Newfoundland and Labrador, Nova Scotia, New Brunswick, Quebec, and British Columbia had lower coverage for most routine vaccinations than the national average. Most vaccination coverage estimates did not vary between provinces by more than 20%, with the exception of shingles vaccine, which varied by 32% between the Northwest Territories and New Brunswick, and pneumococcal vaccine received as an adult, which varied by 28% between Yukon and Newfoundland and Labrador (Figure 2).
- a Tetanus vaccine received in the last 10 years
- b For adults, the pertussis booster is given in combination with tetanus and diphtheria (Tdap) in Canada. Pertussis vaccination refers to a pertussis-containing vaccine received in adulthood
- c Among adults younger than 50 years of age
- d Among adults aged 50 years and older
- e Among adults aged 18 to 64 years with at least 1 chronic health condition and all adults aged 65 and older (50 and older in Nunavut), or all respondents who were current smokers at the time of the survey
- f Respondents were asked if the vaccine was given as an adult
Figure 2: Text description
| Vaccine | Canada | NL | PE | NS | NB | QC | ON | MB | SK | AB | BC | YK | NT | NU |
|---|---|---|---|---|---|---|---|---|---|---|---|---|---|---|
| Hepatitis B | 69.2% | 63.3% | 62.3% | 61.0% | 60.2% | 66.5% | 72.0% | 67.2% | 68.7% | 74.0% | 66.6% | 69.3% | 80.7% | 65.3% |
| TetanusFootnote a | 77.6% | 63.3% | 71.1% | 76.7% | 71.3% | 73.5%↑ | 81.6% | 80.6% | 77.3% | 78.5%↑ | 74.9% | 85.0% | 84.1% | 67.3% |
| PertussisFootnote b | 40.9% | 36.7% | 49.8% | 40.4% | 44.9% | 35.8% | 44.0% | 43.2% | 46.8% | 46.2% | 35.1% | 49.3% | 55.5% | # |
| VaricellaFootnote c | 52.9% | 47.4% | 60.0% | 50.5%↑ | 52.7% | 52.1% | 55.3% | 43.7% | 47.5%↑ | 54.2% | 50.9% | 42.4% | # | # |
| HPV | 17.7% | 14.0% | 19.6% | 15.4% | 15.1% | 16.4% | 19.3% | 14.2% | 14.6% | 20.9% | 15.7% | 19.6% | 37.3% | # |
| ShinglesFootnote d | 38.8% | 30.8% | 47.6% | 36.4% | 25.2% | 29.8% | 47.3% | 39.5%↓ | 40.1% | 40.5% | 32.9% | 43.9% | 56.8% | # |
| PneumococcalFootnote e | 38.5%↑ | 26.3% | 38.8% | 35.5%↓ | 27.7% | 34.8% | 42.1% | 43.5% | 31.6% | 42.3% | 36.5%↓ | 54.2% | 41.3% | # |
| MpoxFootnote f | 5.9% | 4.0% | 7.2% | 3.7% | 3.6% | 4.0% | 7.4% | 5.6% | 4.7% | 7.2% | 5.4% | # | # | # |
| Polio | 83.6% | 83.7% | 85.4% | 85.6% | 86.3% | 70.9% | 87.7% | 88.7% | 86.4% | 88.1% | 86.0% | 83.8% | 87.5% | # |
| Measles | 87.4% | 89.7% | 89.9% | 88.7% | 85.8% | 86.4% | 87.4% | 87.4% | 89.8% | 89.3% | 86.7% | 85.3% | 86.4% | 68.0% |
| Meningococcal | 61.2% | 60.5%↓ | 64.2% | 60.3% | 59.3% | 53.1% | 65.0% | 62.4% | 66.8% | 65.9% | 59.6% | 59.8% | 65.0% | # |
|
||||||||||||||
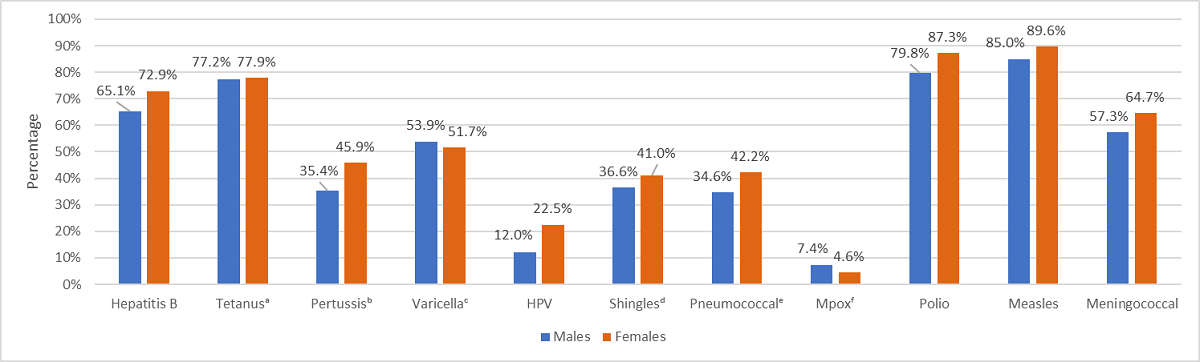
Coverage estimates by sex were different for most routine vaccines. Females were more likely than males to have been vaccinated for most routine vaccines, with the exception of mpox vaccine, which males were more likely to have received than females. There was no notable difference between males and females for coverage of tetanus vaccine received in the last 10 years or varicella vaccine (Figure 3).
Of note, coverage for HPV vaccineFootnote 5 was notably higher among females than males (22.5% versus 12.0%). Females aged 18 to 26 were more likely to have received the HPV vaccine than males of the same age (77.3% versus 46.9%), and the same finding applied to females and males aged 27 to 64 (20.9% versus 10.0%, respectively).
- Note: 132 respondents chose not to provide their sex and were omitted from this analysis
- a Tetanus vaccine received in the last 10 years
- b For adults, the pertussis booster is given in combination with tetanus and diphtheria (Tdap) in Canada. Pertussis vaccination refers to a pertussis-containing vaccine received in adulthood
- c Among adults younger than 50 years of age
- d Among adults aged 50 years and older
- e Among adults aged 18 to 64 years with at least 1 chronic health condition and all adults aged 65 and older (50 and older in Nunavut), or all respondents who were current smokers at the time of the survey
- f Respondents were asked if the vaccine was given as an adult
Figure 3: Text description
| Vaccine | Males | Females |
|---|---|---|
| Hepatitis B | 65.1% | 72.9% |
| TetanusFootnote a | 77.2% | 77.9% |
| PertussisFootnote b | 35.4% | 45.9% |
| VaricellaFootnote c | 53.9% | 51.7% |
| HPV | 12.0% | 22.5%↑ |
| ShinglesFootnote d | 36.6% | 41.0% |
| PneumococcalFootnote e | 34.6% | 42.2% |
| MpoxFootnote f | 7.4% | 4.6% |
| Polio | 79.8% | 87.3% |
| Measles | 85.0% | 89.6% |
| Meningococcal | 57.3% | 64.7% |
|
||
Routine immunization coverage estimates by age group
Immunization coverage was generally higher among younger age groups (ages 18 to 26 and 27 to 49 years) for the majority of vaccines. Young adults aged 18 to 26 years were more likely to have received hepatitis BFootnote 6 (84.3%), varicella (70.7%), and HPV (62.9%) as well as tetanus vaccine received in the last 10 years (80.3%) and mpox vaccine received as an adult (11.9%). Adults aged 27 to 49 years were more likely to have received measles (90.6%), and meningococcalFootnote 7 (78.8%) vaccines, as well as pertussis vaccines received as an adult (50.8%).
Polio immunization coverage was highest among adults aged 65 to 79 years (89%) while adults aged 80+ had higher coverage for pneumococcal and Shingles vaccines (62.8% and 58.7%, respectively).
Of note, coverage for HPV vaccine was higher among young adults aged 18 to 26 years (62.9%) than adults aged 27 years and older (12.5%).
Routine immunization coverage estimates by sociodemographic characteristics
Various sociodemographic characteristics were analyzed. Of note, in comparing people who live in urban and rural environmentsFootnote 8, immunization coverage for hepatitis B, Varicella, HPV, pneumococcal, shingles, polio, and meningococcal vaccines was higher among adults living in urban settings. Tetanus immunization coverage was higher among adults living in rural settings. However, there was no notable difference in coverage between urban and rural adults for pertussis, measles, and meningococcal vaccines (Table 1).
Adults who identify as living with a disabilityFootnote 9 were more likely to have received the HPV vaccine than the adult general population (21.6% versus 17.7%), as well as pneumococcal (43.7% versus 38.5%) and mpox (7.5% versus 5.9%) vaccines received as an adult. There was no notable difference in vaccine coverage for other routine vaccines between adults living with a disability from the adult general population (Table 1).
Some variation in immunization coverage was noted for adults of differing ethnicities. Immunization coverage varies by ethnicity and was highest among Latinos/Latinas for hepatitis B, tetanus, varicella, Mpox, and meningococcal vaccines; Black individuals for pertussis vaccine; East/Southeast Asians for HPV vaccine; Indigenous populations for measles vaccine; South Asians for polio vaccine; and White individuals for shingles and pneumococcal vaccines (Table 1).
| Vaccine | Canada | Urban | Rural | People living with a disability | Black | East/ Southeast Asian |
Indigenous | Latino/ Latina |
Middle Eastern and North African | South Asian | White |
|---|---|---|---|---|---|---|---|---|---|---|---|
| Hepatitis B | 69.2% | 70.8% | 63.4% | 66.8% | 71.7% | 76.7% | 66.9% | 77.0% | 74.8% | 75.7% | 68.6% |
| TetanusFootnote a | 77.6% | 77.0% | 80.4% | 79.1% | 76.7% | 68.1% | 78.8% | 80.3% | 70.7% | 76.5%↓ | 79.4% |
| PertussisFootnote b | 40.9% | 41.1% | 39.8% | 42.9% | 47.1% | 43.2% | 42.4% | 38.6% | 41.9% | 35.4% | 41.2% |
| VaricellaFootnote c | 52.9% | 53.0% | 50.6% | 55.1% | 65.1% | 65.9% | 56.7% | 71.7% | 70.5%↑ | 65.8% | 45.4% |
| HPV | 17.7% | 18.8% | 12.8% | 21.6% | 27.3% | 30.5%↓ | 21.0% | 22.8% | 21.4% | 22.8% | 15.9% |
| ShinglesFootnote d | 38.8% | 39.6% | 37.0% | 36.2% | 26.6% | 35.4% | 22.4% | 27.9% | 31.6% | 26.5% | 40.9% |
| PneumococcalFootnote e | 38.5%↑ | 39.1% | 36.6% | 43.7% | 30.7% | 30.0% | 35.7% | 37.4% | 26.3% | 32.1% | 40.5%↓ |
| MpoxFootnote f | 5.9% | 6.2% | 4.6% | 7.5%↓ | 13.2% | 12.7% | 7.0% | 16.3% | 9.0% | 12.9% | 4.3% |
| Polio | 83.6% | 84.4% | 82.3% | 84.1% | 80.3% | 74.1% | 81.4% | 87.3% | 68.0% | 91.0% | 85.8% |
| Measles | 87.4% | 87.7% | 87.0% | 88.0% | 85.4% | 83.0% | 90.6% | 85.1% | 78.0% | 80.9% | 89.2% |
| Meningococcal | 61.2% | 62.3% | 57.1% | 63.5%↑ | 67.1% | 60.5%↑ | 68.6% | 74.2% | 62.4% | 61.0% | 61.5%↓ |
|
|||||||||||
People with chronic health conditionsFootnote 10 were more likely than people without chronic health conditions to have received shingles among those aged 50 years and older (42.5% versus 36.8%) and polio (85.8% versus 82.9%) vaccines, as well as tetanus vaccine received in the last 10 years (79.2% versus 77.0%), and pertussis (42.4% versus 40.3%) and pneumococcal (40.3% versus 35.8%) vaccines received as an adult.
However, people with chronic health conditions were less likely to have received hepatitis B (65.7% versus 70.8%), varicella among those younger than 50 years of age (50.3% versus 53.6%), HPV (14.0% versus 19.4%), and meningococcal (57.8% versus 62.8%) vaccines, as well as mpox vaccine received as an adult (4.6% versus 6.5%). There was no difference in immunization coverage against measles (87.4% versus 87.4%).
The National Advisory Committee on Immunization (NACI) recommends that adults (18 to less than 65 years) with chronic health conditions should receive at least 1 dose of the pneumococcal vaccine. Of note, adults between the ages of 18 and 64 (inclusive) with chronic health conditions were less likely than the people without chronic health conditions to have received the pneumococcal vaccine as an adult (29.3% versus 35.8%). This is slightly higher than the proportion who had received the pneumococcal vaccine as an adult reported in the SIVCS for 2020 to 21 (26.2%).
Health care workersFootnote 11 were more likely than non-health care workers to have been received vaccines for hepatitis B (86.6% versus 67.0%), tetanus in the last 10 years (86.7% versus 76.5%), pertussis as an adult (63.4% versus 37.9%), HPV (29.7% versus 16.2%), mpox as an adult (8.5% versus 5.6%), polio (90.0% versus 83.1%), measles (94.8% versus 86.6%) and meningococcal (70.3% versus 60.2%). However, they were less likely to be vaccinated for shingles among people aged 50 and older (32.2% versus 39.5%). There was no notable difference in immunization coverage against varicella or pneumococcal.
Intention to vaccinate for routine vaccines
Among those who had not been vaccinated for 1 or more routine vaccines, more than half of adults said they would likely get vaccinated if recommended by their health care provider for hepatitis B (67.5%), tetanus (74.2%), pertussis (64.6%), varicella (54.5%), HPV (57.2%), shingles (75.1%), pneumococcal (71.5%), mpox (59.5%), polio (55.9%), and meningococcal (63.8%). For measles, just under half of adults who had not been vaccinated said they would be likely to get vaccinated (45.1%) (Table 2).
| Likelihood to vaccinate | Hepatitis B | TetanusFootnote a | PertussisFootnote b | VaricellaFootnote c | HPV | ShinglesFootnote d | PneumococcalFootnote e | MpoxFootnote f | Polio | Measles | Meningococcal |
|---|---|---|---|---|---|---|---|---|---|---|---|
Very |
38.2% | 46.8% | 36.7% | 34.8% | 34.0% | 46.0% | 42.9% | 34.3% | 29.7% | 17.4% | 35.6% |
| Somewhat likely | 29.3% | 27.4% | 27.9% | 19.7% | 23.2% | 29.1% | 28.6% | 25.3% | 26.2% | 27.7% | 28.2% |
| Somewhat unlikely | 10.9% | 8.3% | 13.6% | 15.2% | 15.4% | 10.6% | 11.5%↑ | 15.1% | 15.0% | 25.6% | 13.6% |
| Very unlikely | 9.0% | 6.2% | 10.4% | 20.8% | 16.5%↑ | 8.4% | 9.4% | 14.3% | 11.9% | 14.3% | 10.5%↑ |
| Don't know | 12.6% | 11.3% | 11.4% | 9.5%↓ | 10.9% | 5.8% | 7.7% | 11.0% | 17.2% | 15.0% | 12.0% |
|
|||||||||||
Reasons for routine immunization and obstacles to immunization
Reasons for vaccination: The most commonly cited reasons that adults aged 18 and older cited for getting vaccinated included to protect themselves and/or their household (61.5%), based on health care provider recommendations (54.5%), and based on public health recommendations (53.7%).
Most adults did not report any obstacles to vaccination (74.3%), however among those who did report obstacles, the most commonly-reported reasons were the cost of the vaccine (38.9%), difficulty booking time off work or school to get vaccinated (38.2%) and not knowing where to get vaccinated (24.4%).
Routine immunization hesitancy/reluctance and refusalFootnote 12
Respondents were asked if they had ever been hesitant or reluctant to get vaccinated as adults excluding influenza and COVID-19 vaccines and 18.4% indicated that at some point in the past they had been. There were no major differences between males and females (18.7% versus 17.9%). Similarly, there were no major differences amongst respondents aged 18 to 26, 27 to 49 and 50 to 64 and the overall population (18.3%, 19.6% and 20.3%, respectively, versus 18.4%), while respondents aged 65 to 79 and 80 years and older were less likely to express reluctance or hesitance (13.4% and 11.9%, respectively, versus 18.4%). No major differences were seen between respondents with chronic health conditions and health care workers (16.7% and 16.3%, respectively, versus 18.4%) compared to the overall population.
The most commonly cited reasons for hesitancy or reluctance were expressing concern about the safety of vaccination and/or side effects (45.0%), expressing concern that not enough research has been done (34.3%), expressing concern about the effectiveness of vaccination (26.1%), and not thinking it was necessary (25.4%).
Among adults aged 18 and older who had not received 1 or more routine vaccines, 6.5% refused 1 or more vaccines. There was no major difference between females and males with regards to refusal (6.5% versus 6.4%). Similarly, amongst different age groups; respondents aged 18 to 26 (6.0%), 27 to 49 (6.9%), 50 to 64 (7.1%), 65 to 79 (4.7%), and 80 years and older (7.3%) there were no major differences in refusal to the adult general population (6.5%). Respondents with chronic health conditions and health care workers were no different from the adult general population (6.3% and 6.2%, respectively, versus 6.5%) with regards to vaccine refusal.
Among those who refused 1 or more vaccines, the most commonly cited reasons for refusal were not thinking the vaccine was necessary (49.4%), not thinking the vaccine was safe and expressing concern about side effects (40.5%), expressing a lack of trust in the government and/or pharmaceutical companies (30.6%), and not thinking the vaccine is effective (21.7%).
Sources of information and knowledge, attitudes and beliefs about routine immunization
Respondents were asked about their most trusted sources of information about vaccines, and health care providers (70.7%), the Public Health Agency of Canada (58.1%), international sources, such as the WHO (39.4%), scientific publications and journals (36.3%), and local public health units (35.5%) were the most commonly reported trusted sources.
The aNICS 2023 also sought to assess knowledge, attitudes and beliefs (KAB) with regards to immunization. Overall, adults were more likely to agree that, in general, vaccines are safe (89%) and effective (90%). A majority (78.6%) agreed that public health guidance recommends vaccination even for diseases that are not common anymore, and a majority (88.7%) agreed that getting vaccinated can also protect people with a weaker immune system. Conversely, most disagreed (65.5%) with the idea that alternative medicine is a good substitute for vaccination, and most (82.7%) disagreed with the idea that it is not necessary to get vaccinated if everybody else is vaccinated (Table 3).
| Knowledge, attitudes and beliefs regarding vaccines | In general, vaccines are safe | In general, vaccines are effective | Public health guidance recommends vaccination even for diseases that are not common anymore | Alternative medicine is a good substitute for vaccination | It is not necessary to get vaccinated if everybody else is vaccinated | Getting vaccinated can also protect people with a weaker immune system |
|---|---|---|---|---|---|---|
| Strongly agree | 55.2% | 52.1% | 44.1% | 7.5%↓ | 5.3% | 63.5%↑ |
| Somewhat agree | 33.8% | 37.9% | 34.5%↑ | 19.2% | 9.2% | 25.2% |
| Somewhat disagree | 5.5%↓ | 5.1% | 10.0% | 24.8% | 25.1% | 4.5%↓ |
| Strongly disagree | 3.5%↓ | 2.8% | 4.7% | 40.7% | 57.6% | 3.8% |
| Don't know | 2.0% | 2.1% | 6.7% | 7.9% | 2.8% | 3.0% |
|
||||||
Influenza immunization coverage
Overall, 44.4% of adults aged 18 and older received the influenza vaccine during the 2022 to 23 influenza season, that is, between September 1, 2022 and March 31, 2023. Females were more likely than males to have received the influenza vaccine (48.0% versus 40.7%). As compared to the adult general population coverage for influenza vaccination, adults aged 18 to 26 and 27 to 49 were less likely to have been vaccinated during the 2022 to 23 flu season (28.8% and 34.6%, respectively, versus 44.4%), while adults aged 65 to 79, and 80 years and older were more likely to have been vaccinated (69.7%, and 76.9%, respectively, versus 44.4%). People with chronic health conditions and health care workers were also more likely to have received the influenza vaccine than the adult general population (55.3% and 56.5%, respectively, versus 44.4%) (Figure 4).

Figure 4: Text description
| Vaccine | Overall | Males | Females | Ages 18 to 26 | Ages 27 to 49 | Ages 50 to 64 | Ages 65 to 79 | Ages 80+ | People with chronic health conditions | Health care workers |
|---|---|---|---|---|---|---|---|---|---|---|
| Influenza | 44.4% | 40.7% | 48.0% | 28.8% | 34.6% | 45.6% | 69.7% | 76.9% | 55.3% | 56.5%↑ |
|
||||||||||
Provincial and territorial estimates for influenza vaccine coverage during the 2022 to 23 influenza season varied across jurisdictions (Figure 5).
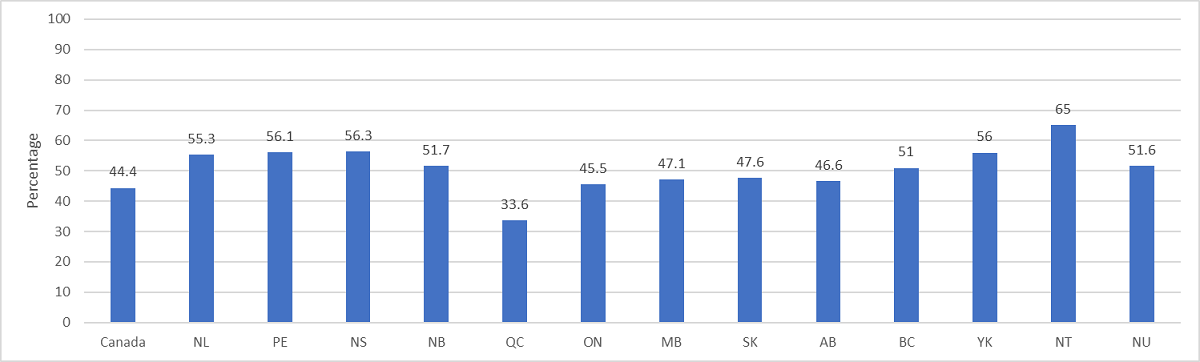
Figure 5: Text description
| Vaccine | Canada | NL | PE | NS | NB | QC | ON | MB | SK | AB | BC | YK | NT | NU |
|---|---|---|---|---|---|---|---|---|---|---|---|---|---|---|
| Influenza | 44.4% | 55.3% | 56.1% | 56.3% | 51.7% | 33.6% | 45.5%↑ | 47.1% | 47.6% | 46.6% | 51.0% | 56.0% | 65.0% | 51.6% |
|
||||||||||||||
Prior to the COVID-19 pandemic, 27.0% of adults aged 18 and older received the influenza vaccine every influenza season, while 15.6% received the vaccine most influenza seasons, 22.9% received the vaccine during some influenza seasons, and 34.5% never received the influenza vaccine.
Vaccine coverage goals: The vaccination coverage goals for adult vaccinations includes a target of 80% vaccination coverage of an influenza vaccine among adults 65 years of age and older, among adults aged 18 to 64 with chronic health conditions, and among healthcare professionals, all by 2025. None of these targets have been achieved.
- Among adults aged 65 and older, 70.2% received the influenza vaccine during the 2022 to 23 influenza season. This is similar to previously reported immunization coverage estimates from the 2022 to 23 Seasonal Influenza Vaccination Coverage Survey (74%).
- Among adults aged 18 to 64 with chronic health conditions, 46.8% received the influenza vaccine during the 2022 to 23 influenza season. This is similar previously reported immunization coverage estimates from the 2022 to 23 Seasonal Influenza Vaccination Coverage Survey (43%).
- Among health care workers, 56.5% received the influenza vaccine during the 2022 to 23 influenza season.
Influenza immunization hesitancy/reluctance and refusal
Overall, 19.7% of adults aged 18 and older reported being hesitant or reluctant to receive the influenza vaccine during the 2022 to 2023 influenza season, that is, between September 1, 2022 and March 31, 2023. There was no notable difference between males and females for hesitancy/reluctance (18.7% versus 20.6%). Compared to the adult general population, adults aged 27 to 49 and 50 to 64 were no more likely to be hesitant or reluctant (21.1% and 21.9%, respectively, versus 19.7%), while adults aged 18 to 26, 65 to 79, and 80 years and older were less likely to be hesitant or reluctant (15.4%, 16.2%, and 16.4%, respectively, versus 19.7%). People with chronic health conditions and health care workers were no different to the adult general population (18.3% and 19.7%, respectively, versus 19.7%).
The most commonly cited reasons for hesitancy or reluctance were concerns about the effectiveness of the influenza vaccine (35.5%), feeling they were not at risk for getting influenza or at risk for severe infection (28.5%), concerns about the safety of the influenza vaccine and/or side effects (26.5%), and having a previous bad experience with vaccines (20.2%).
Among adults aged 18 and older who did not receive the influenza vaccine during the 2022 to 23 influenza season, 43.7% indicated that they refused to receive the vaccine. Females were more likely than males to have refused the influenza vaccine (47.3% versus 40.3%). Compared to the adult general population, adults aged 18 to 26 were less likely to have refused the influenza vaccine (27.5% versus 43.7%), while no major difference was seen for adults aged 18 to 26 (42.4%). Adults ages 50 to 64, 65 to 79 and 80 years and older were more likely to have refused the influenza vaccine (48.0%, 58.7%, and 61.8%, respectively, versus 43.7%). People with chronic health conditions and health care workers were also more likely to have refused the influenza vaccine during the most recent flu season than the adult general population (49.0% and 48.4%, respectively, versus 43.7%).
The most commonly cited reasons for refusal of the influenza vaccine were the same as the concerns among adults who were reluctant or hesitant but with slightly different order: feeling they were not at risk for getting influenza or at risk for severe infection (37.6%), concerns about the effectiveness of the influenza vaccine (33.1%), concerns about the safety of the influenza vaccine and/or side effects (23.2%), and having a previous bad experience with vaccines (18.3%).
Impact of the COVID-19 pandemic on influenza immunization and intention to vaccinate
During the 2022 to 23 influenza season, the COVID-19 pandemic did not influence the decision of the majority of respondents to receive the influenza vaccine (73.9%). However, 18.0% of adults indicated that the COVID-19 pandemic motivated them to receive the influenza vaccine, while 8.1% indicated that it made them not want to get the influenza vaccine.
Considering intention to vaccinate during the 2023 to 24 influenza season, that is, from September 1, 2023 to March 31, 2024, 41.9% of adults indicated that they would be very likely to receive the influenza vaccine, 17.0% indicated that they would be somewhat likely, 12.9% indicated that they would be somewhat unlikely, and 24.9% indicated that they would be very unlikely to receive the influenza vaccine. There was significant variation between the sexes, by age groups and amongst people with chronic health conditions and health care workers (Table 4).
| Likelihood to vaccinate | Overall | Males | Females | Ages 18 to 26 | Ages 27 to 49 | Ages 50 to 64 | Ages 65 to 79 | Ages 80+ | People with chronic health conditions | Health care workers |
|---|---|---|---|---|---|---|---|---|---|---|
| Very likely |
41.9% | 37.9% | 45.9% | 25.5%↓ | 32.0% | 43.8% | 66.8% | 76.8% | 53.5%↓ | 54.5%↑ |
| Somewhat likely | 17.0% | 18.5%↑ | 16.0% | 25.1% | 29.8% | 15.6% | 11.3% | 3.7% | 14.6% | 16.9% |
| Somewhat unlikely | 12.9% | 13.7% | 12.1% | 15.9% | 15.1% | 13.0% | 6.9% | 3.8% | 9.8% | 8.6% |
| Very unlikely | 24.9% | 26.4% | 23.3% | 26.9% | 19.3% | 25.1% | 13.7% | 14.9% | 19.9% | 18.4% |
| Don't know | 3.2% | 3.5%↓ | 2.7% | 6.7% | 3.8% | 2.4% | 1.2% | # | 2.2% | 1.4% |
|
||||||||||
Knowledge, attitudes and beliefs about influenza immunization
Respondents were asked to indicate their agreement or disagreement with 4 statements regarding the influenza vaccine. Overall, adults were more likely to agree (83.8%) that in general, the influenza vaccine is safe. Similarly, adults were more likely to agree (71.9%) that the benefits from the influenza vaccine are greater than the risk of its side effects. Conversely, fewer adults (28.8%) agreed that in general, the influenza vaccine is not effective, and fewer adults (25.5%) agreed that you can get influenza from the influenza vaccine (Table 5).
| Knowledge, attitudes and beliefs regarding influenza vaccine | In general, the flu shot is safe | In general, the flu shot is not effective | You can get the flu from the flu shot | The benefits from the flu shot are greater than the risk of its side effects |
|---|---|---|---|---|
| Strongly agree | 54.8% | 7.1% | 6.9% | 43.6% |
| Somewhat agree | 29.0% | 21.7% | 18.6% | 10.4% |
| Somewhat disagree | 5.7% | 32.0% | 19.5%↑ | 28.3% |
| Strongly disagree | 3.6% | 29.8% | 41.2% | 6.1% |
| Don't know | 6.9% | 9.4% | 13.8% | 11.5%↑ |
|
||||
COVID-19 immunization coverage
Overall, 94.5% of adults have received at least 1 dose of an approved COVID-19 vaccine. The vaccines that were authorized for use among adults at time of data collection in Canada include AstraZeneca's Vaxzevria, Moderna's Spikevax, Pfizer-BioNTech's Comirnaty, Johnson & Johnson's Janssen, Novavax's Nuvaxovid, and Medicago Covifenz. This is similar to what was observed from the 2022 to 23 Seasonal Influenza Vaccine Coverage Survey (92%). No major differences were seen between males and females (93.8% versus 95.3%). Similarly, compared to the adult general population, no major differences were observed for adults ages 18 to 26, 27 to 49, 50 to 64, and 80 years and older (92.8%, 92.8%, 95.7%, and 95.4%, respectively, versus 94.5%), while adults aged 65 to 79 years were more likely to have received at least 1 dose of an approved COVID-19 vaccine (97.1% versus 94.5%). People with chronic health conditions were also no different from the adult general population (95.1% versus 94.5%), while health care workers were more likely to have received at least 1 dose (97.1% versus 94.5%) (Figure 6).
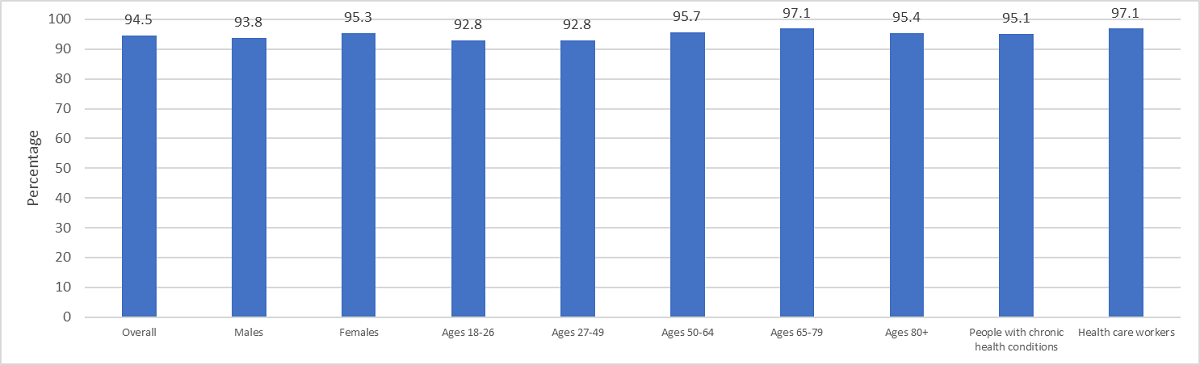
Figure 6: Text description
| Vaccine | Overall | Males | Females | Ages 18 to 26 | Ages 27 to 49 | Ages 50 to 64 | Ages 65 to 79 | Ages 80+ | People with chronic health conditions | Health care workers |
|---|---|---|---|---|---|---|---|---|---|---|
| COVID-19 (at least one dose) | 94.5%↑ | 93.8% | 95.3% | 92.8% | 92.8% | 95.7% | 97.1% | 95.4% | 95.1% | 97.1% |
|
||||||||||
Provincial and territorial immunization coverage for receiving at least 1 dose of an approved COVID-19 vaccine ranged from 96.9% in Newfoundland and Labrador to 91.4% in Saskatchewan. Estimates for the Northwest Territories and Nunavut were not available due to small sample size (Figure 7).
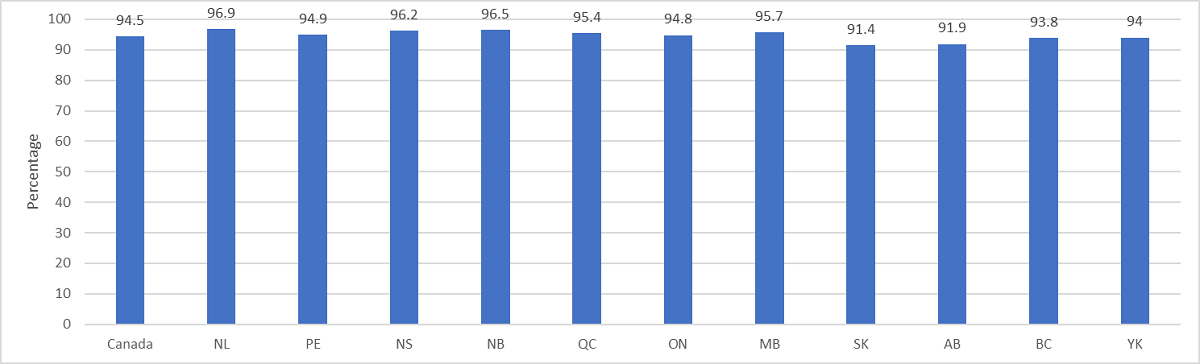
Figure 7: Text description
| Vaccine | Canada | NL | PE | NS | NB | QC | ON | MB | SK | AB | BC | YK | NT | NU |
|---|---|---|---|---|---|---|---|---|---|---|---|---|---|---|
| COVID-19 (at least 1 dose) | 94.5%↑ | 96.9% | 94.9% | 96.2% | 96.5%↑ | 95.4% | 94.8% | 95.7% | 91.4% | 91.9% | 93.8% | 94.0% | # | # |
|
||||||||||||||
Among those who had received at least 1 dose of an approved COVID-19 vaccine, the majority (72.7%) had received 3 or more doses. About one quarter (26.1%) had received 2 doses, and a small minority (1.2%) had received only 1 dose. The number of doses received varies across provinces (Tables 6 and 7).
| Number of doses | Overall | Males | Females | Ages 18 to 26 | Ages 27 to 49 | Ages 50 to 64 | Ages 65 to 79 | Ages 80+ | People with chronic health conditions | Health care workers |
|---|---|---|---|---|---|---|---|---|---|---|
| 1 dose | 1.2% | 1.3% | 1.1% | 2.5% | 1.7% | 0.7% | 0.4% | # | 0.7% | 0.4% |
| 2 doses | 26.1% | 28.2% | 24.1% | 45.6% | 35.1% | 19.5%↑ | 8.9% | 5.5%↑ | 19.1% | 22.8% |
| 3 doses | 36.4% | 36.5%↑ | 36.4% | 37.8% | 40.3% | 40.7% | 23.5%↓ | 12.0% | 33.7% | 41.1% |
| 4 or more doses | 36.3% | 33.9% | 28.4% | 14.1% | 22.8% | 39.2% | 67.2% | 80.9% | 46.5%↑ | 35.7% |
|
||||||||||
| Number of doses | Canada | NL | PE | NS | NB | QC | ON | MB | SK | AB | BC | YK | NT | NU |
|---|---|---|---|---|---|---|---|---|---|---|---|---|---|---|
| 1 dose | 1.2% | # | # | 1.7% | # | 1.5%↑ | 0.9% | 1.1% | 2.0% | 1.7% | 1.1% | # | # | # |
| 2 doses | 26.1% | 28.2% | 28.2% | 24.2% | 27.6% | 24.6% | 24.6% | 26.9% | 27.2% | 36.1% | 24.5%↑ | 23.8% | 25.9% | 30.1% |
| 3 doses | 36.4% | 40.3% | 38.7% | 40.6% | 34.7% | 36.0% | 36.0% | 39.3% | 34.2% | 35.5%↓ | 34.3% | 26.9% | 35.1% | 23.4% |
| 4 or more doses | 36.3% | 30.3% | 31.9% | 33.5%↑ | 36.5%↑ | 37.9% | 37.2% | 32.7% | 36.6% | 26.7% | 40.1% | 48.0% | 36.5%↓ | 46.5%↑ |
|
||||||||||||||
Reasons for COVID-19 immunization
Respondents were asked for their reasons for getting vaccinated against COVID-19. The primary reasons given were to protect themselves and/or household members against COVID-19 infection (72.9%), to prevent the spread of COVID-19 in their community (60.6%), based on public health recommendations (58.4%), to help restore a more normal life, such as lifting public health measures, participating in extra-curricular activities, travel, etc. (56.4%), and because the COVID-19 vaccine was recommended by a health care professional (36.1%). Estimates varied by sex and age group (Table 8).
| Reasons for receiving COVID-19 vaccine | Overall | Males | Females | Ages 18 to 26 | Ages 27 to 49 | Ages 50 to 64 | Ages 65 to 79 | Ages 80+ | People with chronic health conditions | Health care workers |
|---|---|---|---|---|---|---|---|---|---|---|
| To protect myself and/or household members against COVID-19 infection | 72.9% | 69.0% | 76.3% | 71.7% | 71.2% | 72.7% | 76.8% | 75.6% | 76.1% | 74.5%↓ |
| Based on public health recommendations | 58.4% | 56.8% | 60.0% | 53.1% | 56.9% | 58.5%↑ | 64.3% | 57.5%↑ | 61.1% | 59.5%↓ |
| To prevent the spread of COVID-19 in my community | 60.6% | 56.8% | 64.1% | 59.2% | 60.2% | 60.5%↓ | 62.9% | 54.1% | 62.2% | 64.3% |
| The COVID-19 vaccine was recommended by a health care professional | 36.1% | 35.4% | 36.8% | 33.8% | 34.8% | 35.3% | 40.5%↓ | 44.7% | 42.0% | 39.9% |
| To help restore a more normal life | 56.4% | 55.0% | 57.6% | 62.9% | 60.6% | 53.6% | 49.8% | 41.7% | 54.9% | 53.3% |
| It was mandatory/forced/etc. | 7.4% | 8.4% | 6.6% | 12.8% | 9.4% | 6.4% | 2.5% | # | 6.6% | 12.8% |
| Other reasons | 1.7% | 1.9% | 1.5%↑ | 1.9% | 1.7% | 2.0% | 1.4% | # | 1.9% | 1.6% |
|
||||||||||
COVID-19 immunization hesitancy/reluctance and refusal
Overall, 29.4% of adults aged 18 and older were hesitant or reluctant to get vaccinated against COVID-19. Females were more likely than males to have been hesitant or reluctant (30.5% versus 28.0%). Compared with the adult general population, adults ages 18 to 26 and 27 to 49 were more likely to have been hesitant or reluctant (32.8% and 36.5%, respectively, versus 29.4%), while adults ages 65 to 79, and 80 years and older were less likely to have been hesitant or reluctant (16.3%, and 12.9%, respectively, versus 29.4%). Adults ages 50 to 64 were no more likely to be hesitant or reluctant than the adult general population (27.9% versus 29.4%). People with chronic health conditions were less likely to have been hesitant or reluctant than the adult general population (26.0% versus 29.4%), while health care workers were more likely to have been hesitant or reluctant (31.9% versus 29.4%).
The most commonly cited reasons for hesitancy or reluctance were concerns about the safety of COVID-19 vaccines and/or side effects (63.5%), concerns that not enough research on the vaccine has been done (62.4%), concerns about the effectiveness of COVID-19 vaccines (45.7%), and lack of trust in the government (36.6%).
Among adults who had not received any doses of an approved COVID-19 vaccine, 81.5% indicated that they refused to get vaccinated. Males and females did not differ in reporting refusal (81.7% versus 81.1%). Compared to the adult general population, adults aged 18 to 26 were less likely to have refused to get vaccinated (66.5% versus 81.5%), while adults aged 50 to 64 were more likely to have refused (87.2% versus 81.5%). Adults ages 27 to 49 and 65 to 79 did not differ from the adult general population (83.1% and 80.2%, respectively, versus 81.5%). Adults aged 80 years and older could not be assessed due to small sample size. People with chronic health conditions were more likely to have refused to get vaccinated (85.8% versus 81.5%), while health care workers did not differ from the adult general population (81.3% versus 81.5%).
The most commonly cited reasons for refusal to get vaccinated against COVID-19 were concerns about the safety of COVID-19 vaccines and/or side effects (70.6%), concerns that not enough research on the vaccine has been done (68.7%), lack of trust in the government (62.1%), concerns about the effectiveness of COVID-19 vaccines (59.5%), thinking they are not at risk of getting COVID-19 or at risk of severe effects from infection (33.1%), and already having had a COVID-19 infection (30.9%).
Obstacles to COVID-19 immunization and intention to vaccinate
Among adults who had not received any doses of an approved COVID-19 vaccine, 85.1% did not encounter any obstacles to getting vaccinated. The most commonly cited obstacles that were reported were concerns over misinformation, fear of side effects, or being against vaccination (5.5%), difficulties booking time off work/school for a vaccine appointment (3.8%), and other reasons (4.0%).
Regarding intentions to get vaccinated or receive additional doses, 16.3% of adults who had not received any doses of an approved COVID-19 vaccine indicated that they are likely to get vaccinated in the future, while 73.2% indicated that they were unlikely to do so. Among adults who had received 1 or 2 doses of an approved COVID-19 vaccine, 26.3% indicated that they were likely to receive an additional dose in the future, while 70.7% indicated that they were unlikely to do so. Intentions to get vaccinated or receive additional doses varied slightly by sex and age group (Tables 9 and 10).
| Likelihood to vaccinate | Overall | Males | Females | Ages 18 to 26 | Ages 27 to 49 | Ages 50 to 64 | Ages 65 to 79 | People with chronic health conditions | Health care workers |
|---|---|---|---|---|---|---|---|---|---|
| Very likely | 8.9% | 8.2% | 10.5%↑ | 10.1% | 8.6% | 7.5%↑ | 11.5%↑ | 11.9% | 14.8% |
| Somewhat likely | 7.4% | 6.1% | 8.3% | 10.0% | 6.0% | 9.1% | 6.4% | 7.3% | # |
| Somewhat unlikely | 7.5%↓ | 6.9% | 8.4% | 7.4% | 7.5%↓ | 9.4% | # | 3.2% | 10.7% |
| Very unlikely | 65.7% | 66.9% | 65.5%↑ | 50.5%↓ | 67.6% | 69.4% | 72.2% | 72.8% | 61.4% |
| Don't know | 10.6% | 11.8% | 7.2% | 22.0% | 10.4% | 4.6% | # | 4.8% | # |
|
|||||||||
| Likelihood to receive additional dose | Overall | Males | Females | Ages 18 to 26 | Ages 27 to 49 | Ages 50 to 64 | Ages 65 to 79 | People with chronic health conditions | Health care workers |
|---|---|---|---|---|---|---|---|---|---|
| Very likely | 10.1% | 10.0% | 10.1% | 10.7% | 9.8% | 9.7% | 10.7% | 11.5%↑ | 11.2% |
| Somewhat likely | 16.2% | 15.8% | 16.4% | 17.8% | 15.4% | 16.3% | 17.4% | 16.3% | 16.9% |
| Somewhat unlikely | 20.8% | 20.4% | 21.3% | 24.4% | 21.7% | 17.3% | 15.5%↓ | 18.5%↓ | 21.5%↑ |
| Very unlikely | 49.9% | 50.9% | 49.0% | 42.8% | 50.5%↓ | 53.6% | 53.5%↓ | 51.0% | 46.3% |
| Don't know | 3.1% | 3.0% | 3.2% | 4.3% | 2.6% | 3.0% | 3.0% | 2.6% | 4.1% |
|
|||||||||
Knowledge, attitudes and beliefs about COVID-19 immunization
Respondents were asked to indicate their agreement or disagreement with 7 statements regarding COVID-19 vaccines. Overall, adults were more likely to agree that COVID-19 vaccines are safe (78.4%), that COVID-19 vaccines are effective (76.8%), that additional COVID-19 vaccine doses are important to continue to protect from the virus (64.6%), and that vaccination is a safer way to build immunity against COVID-19 than getting infected (73.3%).
Likewise, 68.3% agreed with recommendations to be vaccinated against COVID-19 even after infection; 83.2% agreed that public health measures are important to prevent and/or reduce the spread of COVID-19; and 86.2% agreed that they have access to enough trustworthy information about COVID-19 vaccines to make an informed decision (Table 11).
| Knowledge, attitudes and beliefs regarding COVID-19 vaccines | In general, COVID-19 vaccines are safe | In general, COVID-19 vaccines are effective | Additional COVID-19 vaccine doses are important to continue to protect from the virus | Vaccination is a safer way to build immunity against COVID-19 than getting infected | It is recommended to be vaccinated against COVID-19 even after infection | Public health measures are important to prevent and/or reduce the spread of COVID-19 | I have access to enough trustworthy information about COVID-19 vaccines to make an informed decision |
|---|---|---|---|---|---|---|---|
| Strongly agree | 46.5%↓ | 43.0% | 34.9% | 46.0% | 40.7% | 55.7% | 57.9% |
| Somewhat agree | 31.9% | 33.8% | 29.7% | 27.3% | 27.6% | 27.5%↑ | 28.3% |
| Somewhat disagree | 7.5%↑ | 8.6% | 13.7% | 9.0% | 9.8% | 6.4% | 6.4% |
| Strongly disagree | 7.9% | 9.0% | 12.9% | 9.9% | 10.3% | 7.2% | 4.0% |
| Don't know | 6.1% | 5.6% | 8.8% | 7.8% | 11.5%↑ | 3.2% | 3.4% |
|
|||||||
Travel vaccines
PHAC collected information on travel immunization history among adults living in Canada for the most recent trip in the past 5 yearsFootnote 13. Between 2018 and 2023, 66.0% of adults travelled outside of Canada. Countries or regions visited during the most recent travel included the USA (37.3%) followed by the Caribbean/Central America (19.3%), Mexico (10%), and Western/Northern Europe (8.7%), among others.
About 20.5% of travellers got vaccinated for the purpose of their most recent travel. Most travellers received a COVID-19 vaccine (81.4%), followed by hepatitis A vaccine (16.7%), yellow fever vaccine (7.7%), cholera and traveller's diarrhea vaccine (7.6%), and Typhoid vaccine (6.2%). Two percent (2%) of travellers received the rabies and meningococcal vaccines (each) and 1% received the Japanese encephalitis vaccine and the Bacille Calmette-Guérin (BCG) vaccine (each) (Table 12).
| Vaccine | Estimate |
|---|---|
| COVID-19 vaccine | 81.4% |
| Hepatitis A vaccine | 16.7% |
| Yellow fever vaccine | 7.7% |
| Cholera and traveller's diarrhea vaccine | 7.6% |
| Typhoid vaccine | 6.2% |
| Other vaccine(s) | 3.1% |
| Rabies vaccine | 2.1% |
| Meningococcoal vaccine | 1.9% |
| Japanese encephalitis vaccine | 0.9% |
| Bacille Calmette-Guérin (BCG) vaccine | 0.5%↑ |
|
|
Respondents were also asked about their intent to seek advice about travel vaccination from their health care provider or a travel clinic before their next trip outside Canada or the US, where 50.6% of the adult general population indicated they will.
Summary
Routine immunization
The findings from the 2023 aNICS reveal significant differences in vaccine coverage for routine vaccinations recommended for adults in Canada. While coverage for vaccines that are administered during childhood are higher (for example, polio, 83.6%, and measles, 87.4%), immunization coverage levels drop noticeably for other vaccines. Tetanus vaccine coverage was also fairly high (77.6%) for doses received in the last 10 years, and hepatitis B vaccine coverage was similar (69.2%). Some immunization coverage estimates were below 50%, including pertussis vaccine received as an adult (40.9%), HPV vaccine (17.7%), shingles vaccine for adults aged 50 and older (38.8%), pneumococcal vaccine received as an adult (38.5%), and mpox vaccine received as an adult (5.9%). It should be noted that HPV vaccine coverage among adults aged 18 to 26 was 62.9%, indicating significant age variation in immunization coverage for HPV. It should also be noted that mpox vaccine was first approved in November 2020 and availability is limited to selected eligible at-risk populations. Varicella vaccine coverage was 52.9%, though it should be noted that among those who had not been vaccinated against varicella, 85.9% had previously contracted varicella either as a child or as an adult. Although direct comparison is not possible due to methodological differences, immunization coverage reported from the aNICS is higher compared to what has been reported from the 2020 to 2021 Seasonal Influenza (flu) Vaccination Coverage Survey against tetanus (77.6% versus 67%), shingles (38.8% versus 27%) and pertussis (40.9% versus 34%).
Provincial and territorial immunization coverage estimates varied across the country. For most routine vaccines, estimates did not vary by more than 20% between provinces/territories, except for the shingles vaccine, which varied by 32% between the Northwest Territories and New Brunswick, and pneumococcal vaccine received as an adult, which varied by 28% between Yukon and Newfoundland and Labrador.
In analyzing sociodemographic measures, it was observed that immunization coverage was generally higher in females than in males, with the exception of mpox vaccine. Further, immunization coverage was generally higher among adults ages 18 to 26 and 27 to 49 years than in older adults, particularly regarding HPV immunization. This does not include vaccines recommended for specific age ranges such as shingles and varicella. It should be noted that among adults aged 65 and older, 54.7% had received the pneumococcal vaccine, which is below the 80% coverage goal to be achieved be 2025. There was some variation observed in immunization coverage by ethnic/racial groups and by residing in an urban versus rural environment.
People with chronic health conditions were more likely than people without chronic health conditions to have received tetanus, pertussis, shingles, pneumococcal and polio vaccines, and less likely to have received hepatitis B, varicella, HPV, mpox and meningococcal vaccines.
Health care workers were more likely to have received hepatitis B, tetanus, pertussis, HPV, mpox, polio, measles and meningococcal vaccines. Importantly, hepatitis B vaccine coverage among health care workers was 86.6%, which means Canada is close to achieving the national immunization goal of 90% coverage by 2025. However, health care workers were less likely to have received a shingles vaccine.
Among those who had not been vaccinated, more than half of adults indicated that they would be likely to get vaccinated for each routine vaccine if recommended by a health care provider, with the exception of measles vaccine (45.1%).
The most common reasons for getting vaccinated include protecting oneself or one's household, because of health care provider recommendations, and/or because of public health recommendations. About one quarter of respondents report facing obstacles to getting vaccinated, including the cost of a vaccine, difficulty booking time off, and/or not knowing where to go to get vaccinated.
Vaccine hesitancy or reluctance and vaccine refusal have been identified as a public health concern. Overall, 18.4% of adults indicated that they had been hesitant or reluctant to get vaccinated at some point. The most common reasons for hesitancy or reluctance include concerns about the safety of a vaccine or its side effects, concern that not enough research has been done, concern about the effectiveness of a vaccine, and/or considering it unnecessary. Further, 6.5% of those who had not received 1 or more routine vaccines said they had refused at least 1 or more vaccines. Similarly to hesitancy or reluctance, most common reasons for refusal were thinking the vaccine was unnecessary, thinking the vaccine was unsafe and expressing concern about side effects, a lack of trust in the government and/or pharmaceutical companies, and thinking the vaccine is ineffective.
Adults living in Canada indicated that their most trusted sources of information on vaccines were health care providers (70.7%) and the Public Health Agency of Canada (58.1%). Further, a large majority agreed that in general, vaccines are safe (89.0%) and effective (90.0%), that public health guidance recommends vaccination even for diseases that are not common anymore (78.6%), and that getting vaccinated can also protect people with a weaker immune system (88.7%).
Influenza immunization
During the 2022 to 23 influenza season, 44.4% of adults received the influenza vaccine. Older adults were more likely to have received the influenza vaccine than younger adults – 69.7% for adults aged 65 to 79 and 76.9% for adults aged 80 years and older, versus 28.8% for adults aged 18 to 26 and 34.6% for adults aged 27 to 49. People with chronic health conditions (55.3%) (similar to what has been reported from the SIVCS 2022 to 23) and health care workers (56.5%) were also more likely to be vaccinated.
Similar to routine immunization, hesitancy/reluctance and refusal to receive the influenza vaccine were assessed. Overall, 19.7% of adults were hesitant or reluctant to receive the influenza vaccine, and the most common reasons were concerns about the effectiveness of the vaccine, feeling they were not at risk for getting influenza or at risk for severe infection, concerns about the safety of the influenza vaccine and/or side effects, and having a previous bad experience with vaccines. Among those who hadn't received the influenza vaccine during the 2022 to 23 influenza season, 43.7% refused to receive the vaccine, and the most common reasons given for refusal were the same as for hesitancy/reluctance.
Most adults (73.9%) indicated that they were not influenced by the COVID-19 pandemic to get the influenza vaccine, while 18.0% indicated that the COVID-19 pandemic motivated them to get vaccinated. Regarding the 2023 to 24 influenza season, 58.9% of adults indicated that they would be likely to get the influenza vaccine.
COVID-19 immunization
Overall, 94.5% of adults received at least 1 dose of an approved COVID-19 vaccine. This is similar to what was reported in the 2022 to 23 Seasonal Influenza Vaccination Coverage Survey. There were no notable differences observed between males and females (93.8% versus 95.3%), nor were there notable differences when comparing different age groups to the adult general population, with the exception of adults ages 65 to 79 (97.1%). COVID-19 immunization coverage among people with chronic health conditions (95.1%) were comparable to the general population, while health care workers were more likely to have received at least 1 COVID-19 vaccine dose (97.1%).
Provincial COVID-19 immunization coverage estimates ranged from 96.9% in Newfoundland and Labrador to 91.4% in Saskatchewan.
Most (72.7%) of those who had received 1 dose of an approved COVID-19 vaccine had received 3 or more doses.
The most common reasons given for receiving a COVID-19 vaccine were to protect oneself and/or one's household against COVID-19 infection, to prevent the spread of COVID-19 in the community, because of public health recommendations, to help restore a more normal life (for example, lifting public health measures, participating in extra-curricular activities, travel, etc.), and because the COVID-19 vaccine was recommended by a health care professional.
Overall, 29.4% of adults were hesitant or reluctant to receive a COVID-19 vaccine, which is notably higher than the estimates for routine or influenza immunization. The most common reasons for hesitance or reluctance were concerns about the safety of COVID-19 vaccines and/or side effects, concerns that not enough research on the vaccine has been done, concerns about the effectiveness of COVID-19 vaccines, and lack of trust in the government. A similarly higher estimate for refusal was noted for COVID-19 vaccines as compared to routine and influenza vaccines, where, among those who had not receive any doses of an approved COVID-19 vaccine, 81.5% indicated they had refused to get vaccinated. The most common reasons for refusal were the same as for hesitancy/reluctance, as well as thinking they are not at risk of getting COVID-19 or at risk of severe effects from infection, and already having had a COVID-19 infection.
Among those who had not received any doses of an approved COVID-19 vaccine, 16.3% indicated that they are likely to get vaccinated in the future, while among those who had received 1 or 2 doses, 26.3% indicated that they are likely to get vaccinated in the future.
Travel immunization
For the first time in 2023, the aNICS collected information on travel immunization. Respondents we asked about travel in the previous 5 years, that is, from 2018 to 2023. Overall, 66.0% of adults had travelled outside of Canada in that time. The most recently visited destinations were the USA (37.3%), the Caribbean/Central America (19.3%), Mexico (10%), and Western/Northern Europe (8.7%).
Of those who travelled in the past 5 years, 20.5% received at least 1 vaccine for the purposes of their most recent travel. The most common vaccine received was a COVID-19 vaccine (81.4%), followed by hepatitis A vaccine (16.7%), yellow fever vaccine (7.7%), cholera and traveller's diarrhea vaccine (7.6%), and typhoid vaccine (6.2%).
Overall, 50.6% of respondents indicated that they would seek advice about travel vaccination before their next travel.
Considerations and limitations
In order to avoid potential biased participation, the aNICS was presented as a public health survey by Advanis. This was done in order to avoid informing potential respondents of the content of the survey and influence uptake or refusal to participate based on individual views on vaccines. The recruitment methodology involved random-digit dialling (RDD) respondents to solicit participation. Respondents were then invited to complete the survey online, though the option to complete a computer-assisted telephone interview (CATI) was also available. This meant that respondents without access to a cell phone or landline would not be in the pool of potential recruits, although the number of adults living in Canada without a cell phone or landline is under 1%. Further, recruitment excluded people living in institutions (such as prisons or long-term care facilities).
Among respondents, 132 did not indicate their sex and were excluded from results presented by sex but included in the remaining analyses. Recording age and province or territory of residence were requirements for participation. Efforts were made to over-sample young adults ages 18 to 26, as past experience has shown that this demographic is difficult to solicit for participation in population health surveys. The target of 1,595 adults in this age range was not achieved, however the total number of respondents in this age range (918) was able to provide reliable estimates for most measures. The age range with the fewest respondents was those 80 years and older. The target sample size for this population was 686, while 221 were recruited to the survey. This resulted in a significant number of suppressed estimates for this age range.
Further, sampling in the territories is challenging due to the infrastructure and population size constraints. Each territory's targeted sample size was 150 respondents. While the desired sample for the Yukon was exceeded (195), those for the Northwest Territories (101) and particularly for Nunavut (39) fell below the desired target. This has also resulted in a significant number of suppressed estimates for these territories.
Due to the previous cycle of the aNICS occurring in 2016, comparisons with this cycle were not made. Differences in methodology and the significant time that has passed made comparisons impractical. Where comparisons are made with the Seasonal Influenza Vaccination Coverage Survey, they are to be interpreted with caution due to differences in methodology between the 2 surveys.
For more information about the adult National Immunization Coverage Survey (aNICS), please contact us at anics-encva@phac-aspc.gc.ca.
Related links
National Advisory Committee on Immunization (NACI): Statements and publications
Vaccination Coverage Goals and Vaccine Preventable Disease Reduction Targets by 2025
Provincial and territorial routine vaccination programs for healthy, previously immunized adults
An adult's guide to vaccination
End Notes
- Endnote 1
-
Measles-containing vaccine is recommended for susceptible adults born in or after 1970. In Canada, adults born before 1970 are generally presumed to have acquired natural immunity to measles; however, some of these individuals may be susceptible. Health care workers, travellers to destinations outside of Canada, and military personnel should receive MMR vaccine, regardless of year of birth. The aNICS collected measles immunization coverage for all respondents regardless of age. Some results may be underestimated.
- Endnote 2
-
For adults, the pertussis booster is given in combination with tetanus and diphtheria (Tdap) in Canada. Pertussis vaccination refers to a pertussis-containing vaccine in received in adulthood.
- Endnote 3
-
Pneumococcal immunization coverage asked of respondents who had at least one chronic health condition, or all respondents aged 50 and older in Nunavut, or all respondents aged 65 and older, or all respondents who where current smokers at the time of the survey.
- Endnote 4
-
Varicella: Implementation of one dose varicella immunization programs in Canada across PTs occurred between 2000 and 2007.
- Endnote 5
-
Human papillomavirus (HPV) vaccine was publicly funded for girls in all provinces and territories (PTs) in 2010 (started from 2007) and gender-neutral HPV vaccination programs were implemented for both girls & boys in 2018-19, with the vaccine being offered starting in Grades 4 to 7, depending on the PT. Some PTs also offer catch-up vaccination for older adolescents and young adults. Eligibility for adults varies by risk factors and age across PTs. It is expected that immunization coverage will be higher among younger adults (especially females) as they are more likely to have been eligible for publicly funded school programs in Canada.
- Endnote 6
-
Hepatitis B vaccine was publicly available to infants in Canada across PTs between 1982 and 1986. School programs were introduced between 1994 and 1998. It is expected that immunization coverage will be higher among younger adults as they are more likely to have been eligible for publicly funded programs in Canada.
- Endnote 7
-
Meningococcal vaccine: Implementation of the publicly funded infant program using meningococcal C conjugate (C) occurred between 2002 and 2009. Implementation of school program using meningococcal C conjugate (C) or meningococcal ACYW (Q) occurred between 2002 and 2011 across PTs. Currently all school programs use the quadrivalent vaccine It is expected that immunization coverage will be higher among younger adults as they are more likely to have been eligible for publicly funded programs in Canada. The aNICS did not collect information on the type of meningococcal vaccine.
- Endnote 8
-
An urban area is a city, town, or village with a population of 1000 people or more, while a rural area is any other area of lower population.
- Endnote 9
-
A person with a disability is a person who has a long-term or recurring impairment (such as vision, hearing, mobility, flexibility, dexterity, pain, learning, developmental, memory or mental health-related) which limits their daily activities inside or outside the home (such as at school, work, or in the community in general).
- Endnote 10
-
A person with a chronic health condition is anyone suffering from any of the following conditions: sickle cell anemia, thalassemia major, or bleeding disorders; neurologic conditions or neurodevelopmental disorders (such as stroke, cerebral palsy, dementia, Parkinson's disease, multiple sclerosis, chronic CSF leak, autism and others); asthma or other chronic lung disease (such as chronic obstructive pulmonary diseases (COPD), cystic fibrosis and others); chronic kidney, heart, or liver disease; diabetes or other endocrine and metabolic disorders (such as thyroid disorders, morbid obesity (BMI 40+) and others); autoimmune conditions (such as systemic lupus erythematosus (SLE), rheumatoid arthritis, Crohn's disease and others); immune suppression (such as chemotherapy, radiation, steroid use, organ transplant, congenital immunodeficiency, HIV/AIDS, stem cell transplant and others); cancer; or someone with a cochlear implant.
- Endnote 11
-
A health care worker is anyone who is a health care provider (such as physician, nurse, occupational/physical therapist), or an employee/staff who works, studies, or volunteers in hospitals, long-term care, nursing home, and group home or community settings.
- Endnote 12
-
In this case, vaccine hesitancy refers to a delay in acceptance or refusal of vaccines despite availability. Vaccine refusal refers to the conscious decision to not take a vaccine.
- Endnote 13
-
The timing of the survey coincides with pandemic travel restrictions, likely influencing results.