
Seasonal Influenza Vaccination Coverage in Canada, 2023-2024
Download in PDF format
(755 KB, 43 pages)
Organization: Public Health Agency of Canada
Date published: 2024-12-03
Cat.: H14-315/2025E-PDF
ISBN: 2817-8483
Pub.: 240696
On this page
- About
- Key findings
- Introduction
- Methodology
- Results
- Discussion
- Strengths and limitations
- Conclusion
- References
About
This report summarizes the results from the 2023-2024 Seasonal Influenza Vaccination Coverage Survey. The survey is conducted annually to collect information on influenza vaccine uptake among adults in Canada. Respondents aged 18 years and older were questioned about their influenza vaccination, as well as their reasons for vaccination and non-vaccination. Additionally, their knowledge, attitudes, and beliefs (KAB) regarding the influenza vaccine and vaccination in general were assessed, and selected demographic information was collected. This year, we have expanded our scope by introducing a new section focusing on the recently approved Respiratory syncytial virus (RSV) vaccine. This addition aims to assess public awareness about the disease and intent regarding the RSV vaccine. The COVID-19 vaccination section was retained to continue tracking COVID-19 vaccine uptake and attitudes toward flu and COVID-19 vaccines co-administration. Data collection took place between January 3 and March 5, 2024.
Key findings
- Influenza vaccination coverage in 2023-2024 (42%) was similar to the previous season (43%).
- While vaccination coverage among seniors (73%) is closer to the coverage goal of 80%, only 44% of the adults aged 18-64 years with chronic medical conditions received the flu shot in Canada.
- The most common reason for getting the flu shot was to prevent infection (23%), whereas the most common reason for not getting the flu shot was the perception that the vaccine was not needed (31%).
- Most adults vaccinated for flu (71%) had received a COVID-19 vaccine at the same time as the flu shot.
- In total, 89% of adults had received at least 1 dose of a COVID-19 vaccine since the beginning of vaccination, while more than one-third (39%) received 1 dose during the 2023-2024 campaign.
- The most common reason for not receiving a COVID-19 vaccine in the 2023-2024 campaign was concerns about the safety or side effects of having so many COVID-19 vaccines (19%).
- Less than a third of adults (30%) would definitely receive a RSV vaccine when it becomes available.
- Despite most people agreeing that the flu shot is safe (87%), 43% of adults mistakenly believed that they could get the flu from the flu vaccine.
Introduction
Influenza, or the flu, a common and highly contagious respiratory illness, impacts thousands of Canadians annually, leading to severe health outcomes for many.Footnote 1,Footnote 2,Footnote 3 The constantly mutating nature of flu viruses leads to a broad range of illness severity, from mild to severe.Footnote 1 The most effective strategy to prevent flu infection and its complications is annual vaccination, which is updated each year to match the strains predicted to be in circulation. Due to waning immunity, yearly vaccination is essential even if the virus strains have not changed.Footnote 1,Footnote 2 For the 2023–2024 influenza season, getting the influenza vaccine is especially crucial not only to reduce illness and deaths associated with influenza but also to alleviate the burden on the healthcare system during the respiratory virus season, particularly with the ongoing presence of COVID-19 and Respiratory Syncytial Virus (RSV). The optimal time to receive the influenza vaccine in Canada is between October and December, before the virus begins spreading in the community.Footnote 2,Footnote 4
The National Advisory Committee on Immunization (NACI) recommends that all individuals aged 6 months and older get the annual seasonal influenza vaccine, especially for populations at increased risk for influenza-related complications or hospitalization including:
- all children 6 to 59 months of age
- individuals with certain chronic medical conditions
- individuals who are pregnant
- adults 65 years and older
- residents of long-term care homes and other congregate living settings
- Indigenous peoples.Footnote 4
Tracking vaccination coverage is vital for monitoring Canada's progress toward its 2025 vaccination coverage targets and identifying populations that are under-vaccinated. Identifying these groups can help refine and enhance vaccination promotion efforts to boost vaccine uptake. The national goals for seasonal influenza vaccination (one dose per season) include:
- Achieving 80% vaccination coverage among adults 65 years of age and older;
- Achieving 80% vaccination coverage among adults 18-64 years of age with CMC.Footnote 5
This report not only measures influenza vaccination coverage in adults but also explores knowledge, attitudes, and beliefs (KAB) about the flu vaccine and vaccines in general, including reasons for non-vaccination. Understanding these perceptions is important for developing strategies to promote vaccination and improve uptake among Canadians.
This year, we have expanded the scope by adding a section on the recently approved RSV vaccine. This new section aims to assess public awareness of RSV and intentions regarding the RSV vaccine. RSV infection is a major cause of lower respiratory tract illness, particularly among infants, young children and older adults. In Canada, RSV causes yearly outbreaks of respiratory tract disease, typically starting in late fall and continuing through to early spring.Footnote 6 The NACI recommends that adults aged 60 years and older who reside in nursing homes or other chronic care facilities, as well as all adults aged 75 years and older, particularly those at increased risk of severe RSV disease, receive one dose of the RSV vaccine.Footnote 7 Additionally, they recommend building towards a universal RSV immunization program for all infants.Footnote 8
In addition, with the continuous circulation of COVID-19, the COVID-19 vaccination related section from previous years' survey remains to continue monitoring COVID-19 vaccine uptake and attitudes toward co-administration with the flu vaccine for future vaccination campaigns planning. NACI continues to recommend COVID-19 vaccination for individuals aged 5 years and older who have not yet been immunized. Starting in Fall 2023, individuals who have previously been vaccinated against COVID-19 were recommended to receive a dose of the new COVID-19 vaccine formulation if at least 6 months have passed since their last vaccine dose or known SARS-CoV-2 infection. Vaccination is particularly important for those at increased risk of COVID-19 infection or severe disease, including:
- adults 65 years of age or older
- residents of long-term care homes and other congregate living settings
- individuals with underlying medical conditions that place them at higher risk of severe COVID-19
- individuals who are pregnant
- Indigenous people
- members of racialized and other equity-deserving communities
- people who provide essential community servicesFootnote 9
NACI has noted no significant safety concerns with the concurrent administration of COVID-19 and influenza vaccines, although some studies have observed higher reactogenicity and a reduced immunologic response with concurrent administration of certain vaccines. NACI continues to monitor the safety of administering COVID-19 vaccines alongside other vaccines, including the seasonal influenza vaccine.Footnote 9
Methodology
Survey sampling
The survey was conducted by Léger Marketing using a stratified regional sampling approach. Survey respondents from each province and territory were selected through random digit dialing of landlines and known cellphone-only household numbers. A comprehensive description of the quantitative methodology can be found elsewhere.Footnote 10
Sample weights were calculated by Léger Marketing based on age, gender, region, language (mother tongue), education level, and whether the respondent lives in a cellphone-only household.
Data collection
Data collection took place between January 3 and March 5, 2024, and interviews were conducted in English and French. A computer-assisted telephone interviewing (CATI) system was used to conduct the interviews. A total of 5,364 adults were surveyed regarding their influenza vaccination status, reasons for vaccination or non-vaccination, KAB regarding flu vaccine and vaccination in general, their COVID-19 vaccination status, RSV vaccination intent, and select demographic information. Respondents who were unsure of their vaccination status for a specific vaccine were excluded from subsequent analyses related to that vaccine.
Statistical analysis
Influenza vaccination coverage was estimated by calculating the weighted proportion of survey respondents who reported receiving the influenza vaccine in the 2023–2024 season, among those who provided a definitive response (i.e., responded "yes" or "no" to the influenza vaccination status question). Simple weighted proportions and 95% confidence intervals were calculated for categorical variables. Chi-squared tests with a p-value <0.05 were used to determine significant differences in vaccination coverage between genders within each age group.
The precision of estimates was assessed using the coefficient of variation. Estimates with a coefficient of variation ranging from 16% to 33%, or greater than 33% were associated with higher sampling error and should be interpreted with caution. Estimates based on a count less than 10 were considered unreliable and not reported.
Results
The overall response rate calculated using the Marketing Research Intelligence Association's standard calculation method for the response rate of a telephone survey was 10%.Footnote 6
All the proportions (%) reported hereafter are weighted, whereas the sample sizes (n) are unweighted.
Seasonal influenza vaccine
Influenza vaccination coverage
During the 2023-2024 flu season, 42% of adults aged 18 years and older received the influenza vaccine. Vaccination coverage was notably higher among females (45%) compared to males (39%, p = 0.0018). Among adults aged 18-64 years with chronic medical conditions (CMC), only 44% were vaccinated, which is significantly below the national target of 80% for those at higher risk of severe influenza-related complications or hospitalization. Seniors aged 65 and older had a much higher vaccination rate at 73%, approaching the target coverage goal. The lowest vaccination coverage was observed in adults aged 18-64 without CMC, with only 28% receiving the flu vaccine. Additionally, a significant gender difference in vaccination coverage was noted within this group. (Table 1.1).
| Age group (years) | All | Male | Female | p | |||
|---|---|---|---|---|---|---|---|
| n | Vaccination coverage, % (95% CI) |
n | Vaccination coverage, % (95% CI) |
n | Vaccination coverage, % (95% CI) |
||
| All adults ≥18 | 5344Table 1.1 Footnote c | 42.2 (40.5-44.0) | 2357 | 38.6 (36.1-41.1) | 2942 | 45.2 (42.7-47.7) | 0.0018Table 1.1 Footnote d |
| 18-64 | 3272 | 32.8 (30.8-34.9) | 1534 | 29.0 (26.2-31.8) | 1699 | 35.7 (32.7-38.8) | 0.0014Table 1.1 Footnote d |
| 18-64 with CMC | 987 | 44.1 (40.1-48.1) | 407 | 46.0 (39.8-52.1) | 562 | 42.4 (37.1-47.8) | 0.393 |
| 18-64 without CMC | 2264 | 28.5 (26.1-30.8) | 1119 | 23.8 (20.8-26.9) | 1124 | 32.6 (28.9-36.3) | 0.0003Table 1.1 Footnote d |
| ≥65 | 2072 | 72.7 (70.3-75.1) | 823 | 71.4 (67.6-75.3) | 1243 | 73.7 (70.6-76.7) | 0.3672 |
Definitions: n: Number of respondents (unweighted). CI: Confidence interval. p: p-value CMC: Chronic medical conditions including asthma, lung diseases, heart conditions, cancer, diabetes, liver or kidney diseases, immune disorder, spleen problems, anemia, obesity, and blood disorders. |
|||||||
Overall, influenza vaccination coverage in 2023-2024 (42%) was similar to the previous season (43%). A temporary decline in coverage was observed during the 2021-2022 season (39%) compared to the pre-pandemic season of 2019-2020 (42%). However, by the 2022-2023 and 2023-2024 seasons, vaccination coverage had returned to pre-pandemic levels.Footnote 11,Footnote 12,Footnote 13,Footnote 14
For high-risk groups, vaccination coverage for adults aged 18-64 with CMC and seniors aged 65 and older remained steady over the past seasons. As seen in previous survey cycles, the highest vaccination coverage was among seniors aged 65 and older (73%), followed by those aged 18-64 with CMC (44%), and the lowest among those aged 18-64 without CMC (28%) (Figure 1.1).
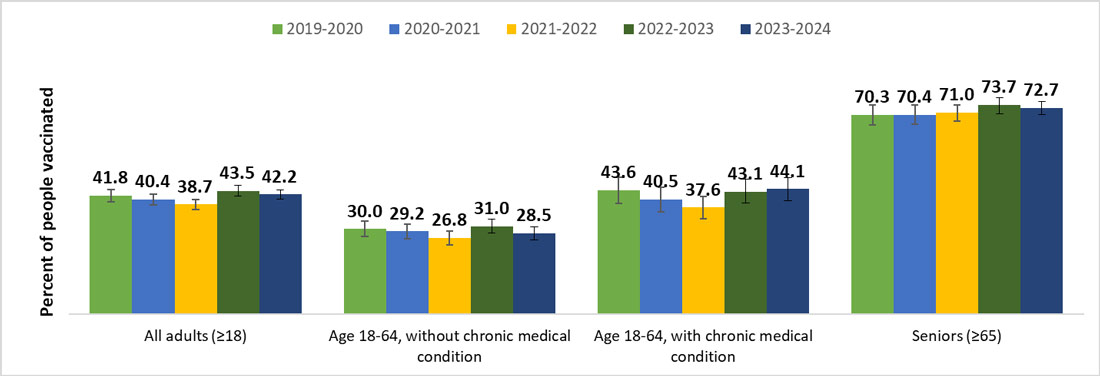
Figure 1.1 - Text equivalent
| Flu season | All adults (18 years and older) | People aged 18-64 without chronic medical conditions | People aged 18-64 with chronic medical conditions | Seniors (65 years and older) |
|---|---|---|---|---|
| 2019-2020 | 41.8 | 30.0 | 43.6 | 70.3 |
| 2020-2021 | 40.4 | 29.2 | 40.5 | 70.4 |
| 2021-2022 | 38.7 | 26.8 | 37.6 | 71.0 |
| 2022-2023 | 43.5 | 31.0 | 43.1 | 73.7 |
| 2023-2024 | 42.2 | 28.5 | 44.1 | 72.7 |
This year, with an increased sample size, vaccination coverage estimates by province and territory were available. Among all adults, regional influenza coverage varied widely, ranging from 25% in Nunavut to 58% in the Northwest Territories. Due to the small sample sizes in the territories, they were combined for stratified analysis by age group. For adults aged 18-64 without CMC, coverage ranged from 18% in Quebec to 38% in British Columbia. Similarly, for adults aged 18-64 with CMC, Quebec had the lowest coverage (36%), while British Columbia had the highest (52%). Among seniors aged 65 and older, coverage ranged from 67% in Saskatchewan and New Brunswick to 82% in British Columbia. (Table 1.2).
| Provinces and territories | All adults (18 years and older) | 18-64 years without CMC | 18-64 years with CMC | 65 years and older | ||||
|---|---|---|---|---|---|---|---|---|
| n | % (95% CI) | n | % (95% CI) | n | % (95% CI) | n | % (95% CI) | |
| Canada | 5344 | 42.2 (40.5-44.0) | 2264 | 28.5 (26.1-30.8) | 987 | 44.1 (40.1-48.1) | 2072 | 72.7 (70.3-75.1) |
| British Columbia | 525 | 50.1 (45.0-55.2) | 248 | 37.9 (31.2-44.6) | 82 | 52.0 (39.4-64.5) | 194 | 81.9 (76.1-87.7) |
| Alberta | 513 | 40.9 (36.1-45.7) | 219 | 26.9 (20.5-33.3) | 111 | 46.9 (36.5-57.2) | 182 | 68.5 (61.3-75.7) |
| Saskatchewan | 379 | 41.3 (35.6-47.0) | 160 | 31.2 (23.3-39.1) | 68 | 38.6 (26.0-51.1)Table 1.2 Footnote c | 148 | 66.8 (58.7-75.0) |
| Manitoba | 333 | 46.3 (40.1-52.5) | 134 | 33.4 (24.4-42.4) | 69 | 50.5 (37.6-63.4) | 128 | 70.8 (62.4-79.2) |
| Ontario | 1410 | 44.2 (41.2-47.2) | 565 | 29.9 (25.7-34.1) | 246 | 44.3 (37.5-51.1) | 593 | 73.5 (69.6-77.4) |
| Quebec | 730 | 33.3 (29.4-37.3) | 307 | 18.3 (13.5-23.1) | 134 | 36.2 (26.8-45.6) | 286 | 68.6 (62.7-74.6) |
| Newfoundland and Labrador | 324 | 45.9 (39.7-52.1) | 142 | 31.9 (23.5-40.4) | 64 | 56.6 (43.0-70.3) | 117 | 68.3 (59.4-77.2) |
| New Brunswick | 309 | 43.8 (37.3-50.4) | 128 | 35.7 (26.1-45.2) | 71 | 41.9 (29.0-54.7) | 110 | 66.6 (56.7-76.5) |
| Prince Edward Island | 297 | 46.1 (39.5-52.6) | 129 | 33.9 (25.0-42.8) | 52 | 41.1 (26.6-55.7)Table 1.2 Footnote c | 115 | 80.7 (73.2-88.3) |
| Nova Scotia | 326 | 47.3 (40.9-53.7) | 141 | 32.4 (23.9-40.9) | 55 | 48.8 (34.1-63.4) | 128 | 79.8 (72.5-87.2) |
| All territories | 198 | 42.8 (34.4-51.1) | 91 | 30.9 (20.2-41.7)Table 1.2 Footnote c | 35 | 45.9 (26.7-65.1)Table 1.2 Footnote c | 71 | 73.8 (61.4-86.3) |
| Northwest Territories | 81 | 58.0 (44.9-71.1) | N/A | N/A | N/A | N/A | N/A | N/A |
| Yukon | 86 | 40.5 (28.8-52.2) | N/A | N/A | N/A | N/A | N/A | N/A |
| Nunavut | 31 | 25.3 (9.2-41.3)Table 1.2 Footnote c | N/A | N/A | N/A | N/A | N/A | N/A |
Definitions: n: Number of respondents (unweighted). N/A: Not available. CI: Confidence interval. CMC: Chronic medical conditions including asthma, lung diseases, heart conditions, cancer, diabetes, liver or kidney diseases, immune disorder, spleen problems, anemia, obesity, and blood disorders. |
||||||||
Month and place of vaccination
Among respondents who recalled the month they received their influenza vaccination (n=2,807), the majority were vaccinated in October (40%) or November (37%) 2023 (Table 2.1). Generally, optimal protection is achieved two weeks after vaccination.Footnote 2 Therefore, it is best to be vaccinated before the influenza season starts, allowing time for antibody development against the influenza viruses before they begin circulating in the community. September and October are typically ideal months for flu vaccination.Footnote 2,Footnote 4 However, vaccination is still recommended through November and beyond, as flu activity commonly peaks in February and can continue into May.Footnote 2
| Month and year | Proportion vaccinated in this month, % (95% CI) |
|---|---|
| September 2023 | 7.4 (5.9-8.8) |
| October 2023 | 39.6 (37.2-42.1) |
| November 2023 | 36.9 (34.4-39.4) |
| December 2023 | 13.1 (11.1-15.0) |
| January 2024 | 2.9 (2.1-3.8) |
Definitions: CI: Confidence interval. Note: A total of 2,807 respondents were vaccinated, and 2,654 of them (94.5%) recalled the month of influenza vaccination. |
|
Consistent with previous seasons, the most frequently reported place of vaccination among adults was pharmacies (57%). Additionally, 15% of adults received their vaccination at their doctor's office, and 8% at a vaccination center. The number of people getting vaccinated in pharmacies has increased in recent seasons.Footnote 7,Footnote 8,Footnote 9,Footnote 10 This trend can be attributed to the growing number of jurisdictions that permit pharmacists to administer the influenza vaccine.Footnote 15,Footnote 16 It is important to note that respondents were asked about the place of vaccination, not the professional who vaccinated them. Therefore, some individuals vaccinated "in a pharmacy" may have actually been vaccinated by a nurse within the pharmacy premises. (Table 2.2).
| Place of vaccination | Proportion vaccinated by place, % (95% CI) |
|---|---|
| Pharmacy | 57.4 (54.9-59.9) |
| Doctor's office | 15.2 (13.4-17.1) |
| Vaccination centre | 7.5 (6.3-8.7) |
| Workplace | 5.0 (3.7-6.2) |
| Temporary vaccine clinic | 4.6 (3.6-5.7) |
| CLSC/Community health centre | 3.3 (2.3-4.3) |
| Hospital | 2.8 (1.8-3.8)Table 2.2 Footnote a |
| Retirement residence | 1.2 (0.7-1.7)Table 2.2 Footnote a |
| Other | 3.0 (2.2-3.8) |
Definitions: CI: Confidence interval. Note: A total of 2,807 respondents were vaccinated, and 2,801 of them (99.8%) recalled their place of influenza vaccination. |
|
Reasons for vaccination
Among adults aged 18 years and older who provided a reason for receiving the vaccine (n=2,800), the majority (55%) were vaccinated to prevent infection or avoid getting sick. Additionally, 28% received the vaccine yearly without specific reasons, and 19% wanted to prevent the spread of flu in general. For adults aged 18-64 years with chronic medical conditions (CMC), 26% stated their higher risk due to their health condition as a reason for vaccination. Among seniors aged 65 years and older, one of the most commonly reported reasons for receiving the influenza vaccine was the increased risk due to age (29%). These results suggest that nearly one-third of vaccinated individuals have adopted annual influenza vaccination as a preventive health practice, likely recognizing their heightened risk for influenza-related complications.Footnote 17 (Table 3.1).
| Reason | % (95% CI) |
|---|---|
| All adults ≥18 years (n=2,807) | |
| 1. To prevent infection/don't want to get sick | 54.8 (52.3-57.3) |
| 2. Receive it yearly (no specific reason) | 28.1 (26.0-30.3) |
| 3. To prevent the spread of flu in general | 19.3 (17.3-21.3) |
| 18-64 years without CMC (n=776) | |
| 1. To prevent infection/don't want to get sick | 55.2 (50.5-60.0) |
| 2. Receive it yearly (no specific reason) | 21.3 (17.5-25.1) |
| 3. To prevent the spread of flu in general | 20.6 (16.8-24.4) |
| 18-64 years with CMC (n=490) | |
| 1. To prevent infection/don't want to get sick | 53.2 (47.4-59.0) |
| 2. At risk because of health condition | 26.1 (21.0-31.2) |
| 3. Receive it yearly (no specific reason) | 23.2 (18.7-27.7) |
| ≥65 years (n=1,534) | |
| 1. To prevent infection/don't want to get sick | 55.0 (52.0-58.1) |
| 2. Receive it yearly (no specific reason) | 37.0 (34.1-40.0) |
| 3. At risk because of age | 28.8 (26.0-31.7) |
Definitions: n: Number of respondents (unweighted). CI: Confidence interval. CMC: Chronic medical conditions including asthma, lung diseases, heart conditions, cancer, diabetes, liver or kidney diseases, immune disorder, spleen problems, anemia, obesity, and blood disorders. Note: A total of 2,807 respondents were vaccinated, and 2,800 of them (99.8%) provided reasons for vaccination. Respondents could provide more than one reason. |
|
Reasons for non-vaccination
Among unvaccinated individuals (n=2,537) who provided their main reason for not getting the vaccine this year (n=2,506), the most common response was that they did not feel the flu vaccine was necessary (36%). This was followed by not getting around to it due to being too busy or lacking time (25%), and concerns about the safety of the flu vaccine or its side effects (10%). The main reasons for non-vaccination did not vary significantly between those aged 18-64 without CMC and adults aged 65 and older. Among those aged 18-64 with CMC, one of the most common reasons for not getting vaccinated was due to health conditions such as allergies or sickness (12%). (Table 4.1).
In addition, among adults who stated they did not need the flu vaccine (n=699) as the main reason for non-vaccination, they were asked why they felt this way. The most common reasons included feeling healthy or never getting the flu (37%), trusting in their own immune system (28%), and not being exposed to the virus often, such as through teleworking or reduced contacts (15%).
| Reason | % (95% CI) |
|---|---|
| All adults ≥18 years (n=2,537) | |
| 1. I did not need flu vaccine | 30.9 (28.5-33.4) |
| 2. I did not get around to it (e.g. too busy, lack of time) | 23.8 (21.6-26.1) |
| 3. I have concerns about the safety of the flu vaccine, and/or its side effects | 10.7 (9.1-12.3) |
| 18-64 years without CMC (n=1,488) | |
| 1. I did not need flu vaccine | 36.4 (33.1-39.6) |
| 2. I did not get around to it (e.g. too busy, lack of time) | 24.9 (22.0-27.8) |
| 3. I have concerns about the safety of the flu vaccine, and/or its side effects | 9.9 (7.8-11.9) |
| 18-64 years with CMC (n=497) | |
| 1. I did not get around to it (e.g. too busy, lack of time) | 26.7 (21.6-31.8) |
| 2. I did not need flu vaccine | 16.1 (12.1-20.2) |
| 3. Because of my health condition (e.g. allergies, sickness) | 12.1 (8.3-16.0)Table 4.1 Footnote b |
| ≥65 years (n=293) | |
| 1. I did not need flu vaccine | 24.8 (20.2-29.4) |
| 2. I did not get around to it (e.g. too busy, lack of time) | 16.1 (12.3-19.9) |
| 3. I have concerns about the safety of the flu vaccine, and/or its side effects | 13.5 (9.9-17.1) |
Definitions: n: Number of respondents (unweighted). CI: Confidence interval. CMC: Chronic medical conditions including asthma, lung diseases, heart conditions, cancer, diabetes, liver or kidney diseases, immune disorder, spleen problems, anemia, obesity, and blood disorders. Note: A total of 2,537 respondents were unvaccinated, and 2,506 of them (98.8%) provided reasons for non-vaccination. Respondents could only select one reason. |
|
Barriers to get the influenza vaccine
Overall, only 15% of adults reported encountering difficulties in scheduling an appointment to receive the flu vaccine this year, similar to the previous season (15%).Footnote 10 The most common difficulties included limited appointment availability (e.g., no flu vaccine available, hard to book an appointment) (4%), the flu vaccine not being offered at the same time or location as the COVID-19 vaccination (4%), and the vaccine not being available at a convenient or nearby location (4%). Another common barrier was difficulty navigating online appointment platforms, which affected 3% of the adults. (Table 5.1).
| Response | % (95% CI) |
|---|---|
| Limited appointment availability (e.g. no flu vaccine available, difficult to book an appointment) | 4.1 (3.1-5.1) |
| I could not receive it at the same time or location as my COVID-19 vaccination | 4.0 (3.0-4.9) |
| The vaccine was not offered at my usual/convenient/close location | 3.6 (2.7-4.5) |
| Difficulty in navigating online appointment platform | 3.0 (2.1-3.8) |
| Difficulty in booking time off work or school for a vaccine appointment | 0.7 (0.3-1.0)Table 5.1 Footnote a |
| Other reasons | 2.3 (1.5-3.0)Table 5.1 Footnote a |
| I didn't encounter any difficulties in scheduling an appointment | 84.8 (83.0-86.6) |
Definitions: CI: Confidence interval. Note: A total of 2,807 respondents were vaccinated, and 2,733 of them (97.4%) provided a valid answer to the question. |
|
Impact of the healthcare providers on getting the influenza vaccine
Overall, 84% of adults reported having a regular family doctor, general practitioner, nurse, or pharmacist in 2023-2024 (n=4,587). Among them, 72% had visited their healthcare providers (HCP) at least once since September 1, 2023, around the beginning of the flu season. Overall, 42% of adults stated that their HCP had recommended they get the flu vaccine, a proportion similar to the previous season (44%).Footnote 10 This recommendation rate was higher among younger adults with CMC (46%) and seniors (56%) compared to younger adults without CMC (30%). (Table 6.1).
| Age group | % (95% CI) |
|---|---|
| All adults ≥18 years | 41.5 (39.3-43.8) |
| 18-64 years without CMC | 29.9 (26.4-33.3) |
| 18-64 years with CMC | 45.8 (41.0-50.6) |
| 65 years and older | 55.8 (52.7-58.8) |
Definitions: CI: Confidence interval. CMC: Chronic medical conditions including asthma, lung diseases, heart conditions, cancer, diabetes, liver or kidney diseases, immune disorder, spleen problems, anemia, obesity, and blood disorders Note: A total of 3,464 respondents who have visited their healthcare providers (HCP) since September 1, 2023, and 3,403 of them (98.2%) provided valid answers to the question. |
|
Flu vaccination coverage was significantly higher among individuals who received a recommendation to get the flu vaccine (70%) compared to those who did not (37%). The proportion of those who received a recommendation and got vaccinated was higher among seniors (88%) compared to younger adults with CMC (62%) and without CMC (56%). Significant differences in coverage between individuals who received a recommendation from their HCP and those who did not were observed in each age group. (Table 6.2).
| Age group | Proportions of adults vaccinated, % (95% CI) | |
|---|---|---|
| HCP recommended the flu vaccine during the last visit | HCP did not recommend the flu vaccine during the last visit | |
| All adults ≥18 years (n=2,101) | 70.0 (66.7-73.2) | 36.6 (33.7-39.4) |
| 18-64 years without CMC (n=848) | 56.0 (49.3-62.7) | 24.6 (20.9-28.4) |
| 18-64 years with CMC (n=414) | 61.8 (54.8-68.8) | 39.2 (33.0-45.4) |
| 65 years and older (n=828) | 87.5 (84.9-90.2) | 62.9 (58.4-67.4) |
Definitions: CI: Confidence interval. CMC: Chronic medical conditions including asthma, lung diseases, heart conditions, cancer, diabetes, liver or kidney diseases, immune disorder, spleen problems, anemia, obesity, and blood disorders |
||
Likelihood of getting the flu vaccine next year
This year, all respondents were asked on their likelihood of getting the flu vaccine next year, after September 2024. Overall, 39% of adults stated they would definitely receive the flu vaccine next year. This proportion was higher among adults aged 65 years and older (67%) and younger adults with CMC (42%), compared to those without CMC (26%). (Table 7.1).
| Response | All adults (18 years and older) | 18-64 years without CMC | 18-64 years with CMC | 65 years and older | ||||
|---|---|---|---|---|---|---|---|---|
| n | % (95% CI) | n | % (95% CI) | n | % (95% CI) | n | % (95% CI) | |
| Definitely will | 2597 | 39.1 (37.4-40.8) | 709 | 26.0 (23.7-28.3) | 479 | 42.2 (38.3-46.2) | 1403 | 66.7 (64.2-69.3) |
| Probably will | 1132 | 23.6 (22.0-25.3) | 597 | 26.3 (23.8-28.8) | 230 | 26.3 (22.5-30.1) | 299 | 15.1 (13.2-17.1) |
| Probably will not | 672 | 17.0 (15.4-18.5) | 429 | 23.3 (20.8-25.8) | 111 | 11.9 (9.2-14.6) | 128 | 6.9 (5.5-8.3) |
| Definitely will not | 913 | 20.3 (18.8-21.9) | 519 | 24.4 (22.1-26.7) | 164 | 19.5 (16.2-22.8) | 224 | 11.3 (9.6-13.0) |
Definitions: n: Number of respondents (unweighted). CI: Confidence interval. CMC: Chronic medical conditions including asthma, lung diseases, heart conditions, cancer, diabetes, liver or kidney diseases, immune disorder, spleen problems, anemia, obesity, and blood disorders. |
||||||||
COVID-19 vaccines
COVID-19 vaccination coverage
Alongside the seasonal influenza vaccination, the survey also collected information on COVID-19 vaccination for the 2023-2024 Fall vaccination campaign. During the data collection period (January 3 to March 5, 2024), the majority of adults in Canada reported having received at least one dose of a COVID-19 vaccine (89%) since the start of COVID-19 vaccination efforts. Specifically, 39% of adults received a COVID-19 vaccine during the 2023-2024 Fall campaign. The proportion of individuals vaccinated during this campaign was higher among adults aged 65 years and older compared to younger adults with CMC (39%) and those without CMC (26%). (Table 8.1).
| COVID-19 Vaccination | All adults ≥18 (n=5,364) % (95% CI) | 18-64 years without CMC (n=2,254) % (95% CI) | 18-64 years with CMC (n=989) % (95% CI) | 65 years and older (n=2,038) % (95% CI) |
|---|---|---|---|---|
| Received one dose since September 1, 2023 | 38.6 (36.9-40.3) | 26.3 (24.0-28.6) | 39.3 (35.4-43.2) | 66.5 (63.9-69.0) |
| Received one dose before September 1, 2023 | 50.1 (48.2-51.9) | 59.4 (56.7-62.1) | 51.2 (47.1-55.3) | 27.7 (25.2-30.1) |
| Never received a COVID-19 vaccine | 11.3 (10.1-12.6) | 14.4 (12.3-16.4) | 9.5 (7.1-11.9) | 5.9 (4.6-7.1) |
Definitions: CI: Confidence interval. CMC: Chronic medical conditions including asthma, lung diseases, heart conditions, cancer, diabetes, liver or kidney diseases, immune disorder, spleen problems, anemia, obesity, and blood disorders. Note: A total of 5,307 respondents provided a valid answer to this question. |
||||
Moreover, those who received at least one dose of the COVID-19 vaccine since the beginning of the vaccination campaign (n=4,829) were asked about their likelihood of keeping their COVID-19 doses up to date (e.g., continuing to receive them as recommended by public health authorities). In total, 44% of adults indicated they were very likely to continue vaccinating against COVID-19 if recommended by public health authorities. About one-fifth (20%) were very unlikely to keep their COVID-19 doses up to date. The proportion of those very likely to keep their COVID-19 vaccines up to date was significantly higher among adults aged 65 years and older (72%), whereas less than one-third of younger adults without CMC expressed the same likelihood. (Table 8.2).
| Response | All adults ≥18 (n=4,829) % (95% CI) | 18-64 years without CMC (n=1,958) % (95% CI) | 18-64 years with CMC (n=903) % (95% CI) | 65 years and older (n=1,904) % (95% CI) |
|---|---|---|---|---|
| Very unlikely | 19.9 (18.3-21.6) | 25.5 (22.9-28.1) | 18.1 (14.8-21.5) | 9.6 (8.0-11.2) |
| Somewhat unlikely | 14.8 (13.3-16.3) | 19.8 (17.3-22.3) | 12.1 (9.3-14.9) | 6.5 (5.0-7.9) |
| Somewhat likely | 20.9 (19.2-22.6) | 24.5 (21.9-27.1) | 22.4 (18.6-26.2) | 12.1 (10.2-14.0) |
| Very likely | 44.4 (42.5-46.3) | 30.2 (27.6-32.8) | 47.4 (43.2-51.7) | 71.9 (69.4-74.4) |
Definitions: CI: Confidence interval. CMC: Chronic medical conditions including asthma, lung diseases, heart conditions, cancer, diabetes, liver or kidney diseases, immune disorder, spleen problems, anemia, obesity, and blood disorders. Note: A total of 4,829 of respondents received at least one dose of COVID-19 vaccine, and 4,783 of them (99.0%) provided a valid answer to this question. |
||||
Reasons for vaccination
Among respondents who were vaccinated during the 2023-2024 Fall vaccination campaign and those who indicated they were very or somewhat likely to keep their COVID-19 doses up to date (n=3,662), the most commonly cited reasons for receiving a COVID-19 vaccine were to protect themselves personally from COVID-19 (41%), to protect family members from COVID-19 (18%), and to prevent the spread of COVID-19 in the community (16%). Other reasons included workplace requirements (4%) and recommendations from a healthcare professional (4%). (Table 9.1).
| Reason | % (95% CI) |
|---|---|
| 1. To protect myself personally from COVID-19 | 40.6 (38.5-42.8) |
| 2. To protect my family members from COVID-19 | 18.4 (16.7-20.1) |
| 3. To prevent the spread of COVID-19 in my community | 16.3 (14.5-18.1) |
| 4. It is required at my workplace | 4.1 (3.0-5.1) |
| 5. It was recommended by a health care professional | 3.5 (2.8-4.2) |
Definitions: CI: Confidence interval. Note: A total of 3,662 respondents were vaccinated since September 1, 2023 or stated very or somewhat likely to keep their COVID-19 doses up to date, and 3,618 of them (98.9%) provided a valid answer to this question. |
|
Reasons for non-vaccination
Among respondents who did not receive a COVID-19 vaccine during the 2023-2024 Fall vaccination campaign and those who indicated they were very or somewhat unlikely to keep their COVID-19 doses up to date (n=1,355), the most commonly cited reasons for not receiving a COVID-19 vaccine were concerns about the safety and/or side effects of receiving multiple COVID-19 vaccines (19%), the perception of being well protected with the doses previously received (16%), and the belief in natural immunity (11%). Other reasons included the perception that COVID-19 infection is not serious enough to warrant another dose (10%) and the belief that COVID-19 vaccines are not effective in protecting against the virus (9%). (Table 10.1).
| Reason | % (95% CI) |
|---|---|
| 1. I have concerns about the safety and/or side effects of having so many COVID-19 vaccines | 19.0 (16.2-21.8) |
| 2. I am well protected with the doses received previously | 15.7 (13.0-18.4) |
| 3. I already had COVID-19 and believe I am adequately protected by natural immunity | 11.1 (8.9-13.3) |
| 4. I don't think COVID-19 infection is serious enough anymore to need a booster dose | 9.6 (7.3-11.9) |
| 5. I think COVID-19 vaccines are not effective in protecting me from the virus | 9.1 (7.2-11.0) |
Definitions: CI: Confidence interval. Note: A total of 1,355 respondents were not vaccinated since September 1, 2023 or stated very or somewhat unlikely to keep their COVID-19 doses up to date, and 1,325 of them (97.8%) provided a valid answer to this question. |
|
Influenza and COVID-19 vaccines co-administration
In 2023-2024 season, among those vaccinated against both flu and COVID-19 (n=2,131), the majority (71%) received both vaccines during the same visit, with no significant differences observed across different age groups. (Table 11.1).
| Age group | % (95% CI) |
|---|---|
| All adults ≥18 years | 71.3 (68.7-73.8) |
| 18-64 years without CMC | 75.4 (70.3-80.6) |
| 18-64 years with CMC | 71.9 (66.0-77.8) |
| 65 years and older | 68.1 (64.9-71.3) |
Definitions: CI: Confidence interval. CMC: Chronic medical conditions including asthma, lung diseases, heart conditions, cancer, diabetes, liver or kidney diseases, immune disorder, spleen problems, anemia, obesity, and blood disorders Note: A total of 2,131 respondents were vaccinated against flu and COVID-19, and 2,120 of them (99.5%) provided valid answers to this question. |
|
The most important reason for receiving both vaccines at the same visit was to save time (47%). Additionally, 20% of individuals were vaccinated for both because a healthcare professional recommended it, and 11% were offered the other vaccine during their visit for vaccination. (Table 11.2).
| Reason | % (95% CI) |
|---|---|
| 1. To save time | 47.5 (44.1-50.9) |
| 2. It was recommended by a health care professional | 19.9 (17.4-22.5) |
| 3. The other vaccine was offered during my visit | 11.4 (9.4-13.3) |
Definitions: CI: Confidence interval. Note: A total of 1,517 respondents received the flu and COVID-19 vaccines at the same visit, and 1,511 of them (99.6%) provided a valid answer to this question. |
|
The most commonly cited reason for not receiving both vaccines together was that the option was not offered or they were unable to book an appointment for both at the same visit (43%). Other reasons included concerns that receiving both vaccines at the same visit could cause more adverse reactions or side effects (15%) or overload the immune system (6%). (Table 11.3).
| Reason | % (95% CI) |
|---|---|
| 1. I was not offered the option/not able to book an appointment to receive both at the same visit | 43.1 (37.8-48.3) |
| 2. Receiving both vaccines might cause a higher number of adverse reactions/side effects | 15.0 (11.1-18.9) |
| 3. Two vaccines at the same time can overload my immune system | 6.3 (3.8-8.9)Table 11.3 Footnote a |
Definitions: CI: Confidence interval. Note: A total of 603 respondents did not receive the flu and COVID-19 vaccines at the same visit, and 594 of them (98.5%) provided a valid answer to this question. |
|
RSV vaccine
RSV awareness
This year, we expanded our scope to include a new section on the recently approved Respiratory syncytial virus (RSV) vaccine. This addition aims to assess public awareness of the disease and intent regarding the RSV vaccine. Overall, 40% of adults had not heard of RSV. Only 28% knew about RSV and the symptoms it causes, while 33% had heard of it but did not know the exact symptoms. Awareness of RSV was lower among younger adults with CMC (38%) and without CMC (44%), compared to adults aged 65 years and older (33%). (Table 12.1).
| Response | All adults ≥18 (n=5,364) % (95% CI) | 18-64 years without CMC (n=2,254) % (95% CI) | 18-64 years with CMC (n=989) % (95% CI) | 65 years and older (n=2,038) % (95% CI) |
|---|---|---|---|---|
| I know the RSV and what symptoms it causes | 27.6 (25.9-29.2) | 26.3 (24.0-28.6) | 28.3 (24.8-31.7) | 28.9 (26.6-31.3) |
| I heard about RSV but do not know what symptoms it causes | 32.7 (31.0-34.4) | 29.8 (27.4-32.3) | 33.7 (29.8-37.6) | 38.4 (35.8-41.0) |
| I have not heard of it | 39.8 (37.9-41.6) | 43.5 (40.8-46.3) | 38.0 (34.0-42.1) | 32.7 (30.1-35.2) |
Definitions: CI: Confidence interval. CMC: Chronic medical conditions including asthma, lung diseases, heart conditions, cancer, diabetes, liver or kidney diseases, immune disorder, spleen problems, anemia, obesity, and blood disorders. |
||||
RSV vaccination intent
All adults were asked about their intent to receive a RSV vaccine if it were recommended by public health authorities and offered free of charge. For those unfamiliar with RSV, a brief description of the disease was provided during the telephone interview. In total, less than a third of adults (30%) stated they would definitely receive a RSV vaccine if recommended and free. The intent was lower among younger adults without CMC (20%) compared to those with CMC (36%) and adults aged 65 years and older (49%). (Table 13.1).
| Response | All adults ≥18 (n=4,829) % (95% CI) | 18-64 years without CMC (n=1,958) % (95% CI) | 18-64 years with CMC (n=903) % (95% CI) | 65 years and older (n=1,904) % (95% CI) |
|---|---|---|---|---|
| Definitely would | 30.1 (28.5-31.8) | 19.9 (17.8-22.1) | 35.8 (31.9-39.7) | 48.8 (46.1-51.5) |
| Probably would | 37.2 (35.3-39.0) | 38.7 (35.9-41.4) | 39.3 (35.2-43.3) | 31.7 (29.2-34.2) |
| Probably would not | 19.2 (17.7-20.8) | 24.4 (22.0-26.9) | 14.6 (11.6-17.6) | 11.4 (9.7-13.2) |
| Definitely would not | 13.5 (12.2-14.8) | 17.0 (14.9-19.0) | 10.3 (7.8-12.9) | 8.0 (6.6-9.5) |
Definitions: CI: Confidence interval. CMC: Chronic medical conditions including asthma, lung diseases, heart conditions, cancer, diabetes, liver or kidney diseases, immune disorder, spleen problems, anemia, obesity, and blood disorders. |
||||
Additionally, those who selected "probably would not" or "definitely would not" receive a RSV vaccine (n=1,436) were asked for their main reason. The most common reason was confidence in their immune system (28%), followed by concerns about the safety and side effects of the RSV vaccine (15%) and lack of knowledge about RSV infection (12%). (Table 13.2).
| Reason | % (95% CI) |
|---|---|
| 1. I believe in my immune system capacity | 27.8 (24.6-30.9) |
| 2. I have concerns about the safety of the RSV vaccine, and/or its side effects | 15.0 (12.5-17.6) |
| 3. I don't know what RSV is | 12.2 (10.0-14.4) |
Definitions: CI: Confidence interval. Note: A total of 1,436 respondents stated probably or definitely would not receive a RSV vaccine, and 1,416 of them (98.6%) provided a valid answer to this question. |
|
Intent for co-administration of flu, COVID-19 and RSV vaccines
Individuals were asked about their intent to receive flu, COVID-19, and RSV vaccines at the same visit if offered the option. Overall, less than a quarter (24%) stated they would definitely receive all three vaccines at the same visit. The proportion was higher among younger adults with CMC (29%) and adults aged 65 years and older (31%) compared to those without CMC (19%). (Table 14.1).
| Response | All adults ≥18 (n=5,364) % (95% CI) | 18-64 years without CMC (n=2,225) % (95% CI) | 18-64 years with CMC (n=975) % (95% CI) | 65 years and older (n=1,975) % (95% CI) |
|---|---|---|---|---|
| Definitely would | 24.1 (22.5-25.6) | 19.3 (17.2-21.4) | 28.9 (25.2-32.7) | 31.0 (28.5-33.5) |
| Probably would | 27.0 (25.3-28.6) | 25.1 (22.7-27.5) | 30.6 (26.8-34.3) | 28.3 (25.8-30.7) |
| Probably would not | 21.9 (20.3-23.5) | 24.3 (21.9-26.8) | 17.0 (14.0-20.0) | 20.0 (17.9-22.2) |
| Definitely would not | 27.1 (25.4-28.8) | 31.3 (28.7-33.9) | 23.5 (19.9-27.0) | 20.7 (18.5-22.9) |
Definitions: CI: Confidence interval. CMC: Chronic medical conditions including asthma, lung diseases, heart conditions, cancer, diabetes, liver or kidney diseases, immune disorder, spleen problems, anemia, obesity, and blood disorders. |
||||
Among those who indicated they probably or definitely would not receive all three vaccines at the same visit (n=2,383), the main reasons included concerns about the increased number of adverse reactions or side effects (35%), fear of overloading the immune system (20%), and only wanting or needing one or two of the three vaccines (15%). (Table 14.2).
| Reason | % (95% CI) |
|---|---|
| 1. Receiving three vaccines might cause a higher number of adverse reactions/side effects | 35.2 (32.6-37.9) |
| 2. Three vaccines at the same time can overload my immune system | 20.2 (18.0-22.5) |
| 3. I only want or need one or two of the three vaccines | 15.4 (13.4-17.5) |
Definitions: CI: Confidence interval. Note: A total of 2,383 respondents stated probably or definitely would not receive flu, COVID-19 and RSV vaccines at the same visit, and 2,332 of them (97.9%) provided a valid answer to this question. |
|
Knowledge, attitudes and beliefs regarding vaccination
The majority of adults (90%) considered vaccines important for their health, and 92% believed they were sufficiently informed to make educated decisions about vaccinations. Additionally, 87% viewed the flu vaccine as safe, and 91% understood the rationale for its annual recommendation. (Table 15.1).
| Statements | n | Strongly or somewhat agreed % (95% CI) |
|---|---|---|
| In general, I consider vaccines to be important for my health. | 5,333 | 90.3 (89.2-91.3) |
| I know enough about vaccines to make an informed decision about getting vaccinated. | 5,325 | 91.7 (90.6-92.9) |
| The flu vaccine is safe. | 5,173 | 87.4 (86.1-88.7) |
| I understand why the flu vaccine is recommended annually. | 5,294 | 90.9 (89.7-92.0) |
| The opinion of my family doctor, general practitioner or nurse practitioner is an important part of my decision when it comes to getting the flu vaccine. | 5,206 | 70.8 (69.0-72.5) |
| The flu vaccine is ineffective to protect me against getting the flu. | 5,160 | 33.7 (31.9-35.5) |
| Sometimes, I can get the flu from the flu vaccine. | 4,999 | 42.6 (40.7-44.6) |
| It's better to get natural immunity (protection) from getting sick with the flu rather than getting vaccinated. | 5,156 | 40.2 (38.3-42.1) |
| It's better to get natural immunity (protection) from getting sick with the COVID-19 rather than getting vaccinated. | 5,205 | 35.7 (33.9-37.6) |
| It is safe to get the flu vaccine and a COVID-19 vaccine at the same time. | 4,788 | 70.5 (68.6-72.3) |
| The flu vaccine or a COVID-19 vaccine could be less effective if getting them at the same time. | 4,184 | 22.9 (21.0-24.8) |
Definitions: n: Number of respondents (unweighted). CI: Confidence interval. |
||
Furthermore, 71% of adults strongly or somewhat agreed that the opinion of their family doctor, general practitioner, or nurse practitioner significantly influenced their decision to get the flu vaccine. This reflects a high level of public trust in healthcare professionals and suggests that guidance from healthcare providers and the frequency of interactions with the healthcare system may play a crucial role in increasing influenza vaccine uptake.
However, 34% of adults felt that the flu vaccine does not adequately protect them from contracting the flu. Although most individuals acknowledged the safety of the flu vaccine, a significant proportion (43%) mistakenly believed that the vaccine could cause the flu—an unfounded concern, as flu vaccines are made with inactivated viruses incapable of causing illness.Footnote 2
Moreover, 40% of adults believed it was better to acquire natural immunity by contracting the flu rather than getting vaccinated. In reality, while natural exposure to viruses or bacteria can generate a strong immune response, vaccines are designed to provide protection with a controlled and safe level of exposure, minimizing the risk of severe symptoms or complications. Vaccination offers a safer alternative to risking illness for immunity, especially considering that flu infections can lead to serious complications, hospitalization, or even death, even in otherwise healthy individuals.Footnote 18
Regarding COVID-19 vaccines, 36% thought it was preferable to gain natural immunity by contracting the virus rather than through vaccination. Both previous COVID-19 infection and vaccination can confer immunity and protect against severe outcomes. However, similar to the flu vaccine, COVID-19 vaccination provides a more robust and consistent level of immunity than infection alone.Footnote 19
Despite 71% of adults agreeing that it is safe to receive both the flu and COVID-19 vaccines simultaneously, nearly a quarter (23%) believed that receiving the vaccines together could reduce their effectiveness.
Sources of information on vaccination
This year, the survey included questions on sources of information about vaccination to identify where adults commonly seek updates on vaccination-related topics. Overall, the most frequently reported sources of information were family physicians (67%), Health Canada or the Public Health Agency of Canada (51%), and other healthcare professionals such as nurses or pharmacists (50%). The least commonly reported source was alternative health practitioners (e.g., chiropractors, naturopaths, osteopaths, homeopaths) at 13%. (Table 16.1).
| Sources of information on vaccination | % (95% CI) |
|---|---|
| Your own family physician | 66.7 (64.9-68.4) |
| Health Canada, Public Health Agency of Canada | 50.9 (49.0-52.7) |
| Other health professional (e.g. nurse, pharmacist) | 49.8 (47.9-51.6) |
| Provincial/territorial/regional Health Authority | 38.7 (36.9-40.5) |
| Health scientists and researchers | 33.2 (31.5-35.0) |
| World Health Organization (WHO) | 32.6 (30.8-34.3) |
| Info-Santé or Telehealth telephone lines, 811 | 25.3 (23.7-26.9) |
| Other people's experiences or knowledge | 22.0 (20.5-23.6) |
| Your family, friends or colleagues | 21.9 (20.4-23.4) |
| Alternative health practitioner (chiropractor, naturopath, osteopath, homeopath, etc.) | 13.1 (11.8-14.4) |
| Another source | 9.3 (8.3-10.4) |
Definitions: CI: Confidence interval. Note: Respondents could provide more than one source of information. |
|
Understanding whether adults choose to get vaccinated against influenza based on these information sources is crucial for developing effective communication strategies to promote influenza vaccination. Flu vaccination coverage in 2023-2024 was higher among adults who sought vaccination-related information from their provincial, territorial, or regional health authorities (51%). Among those who consulted Health Canada or the Public Health Agency of Canada, other health professionals, or Telehealth services, 47% received the influenza vaccine. In contrast, a lower coverage rate of 33% was observed among those who sought information from alternative health practitioners. (Table 16.2).
| Sources of information on vaccination | Proportion of people vaccinated against flu % (95% CI) |
|---|---|
| Provincial/territorial/regional Health Authority | 50.9 (48.0-53.8) |
| Health Canada, Public Health Agency of Canada | 47.4 (44.8-50.0) |
| Other health professional (e.g. nurse, pharmacist) | 47.0 (44.4-49.5) |
| Telehealth telephone lines or Info-Santé, 811 | 46.7 (43.0-50.4) |
| World Health Organization (WHO) | 45.6 (42.3-48.8) |
| Health scientists and researchers | 43.8 (40.7-46.9) |
| Your own family physician | 43.8 (41.7-46.0) |
| Your family, friends or colleagues | 43.7 (39.9-47.4) |
| Other people's experiences or knowledge | 36.3 (32.6-40.0) |
| Alternative health practitioner (e.g. chiropractor, naturopath, osteopath, homeopath) | 32.7 (28.0-37.4) |
Definitions: CI: Confidence interval. |
|
Additionally, all adults were surveyed on which of these sources they trusted most for reliable information about vaccination. The majority placed their trust in information provided by their family physician (48%), followed by Health Canada or the Public Health Agency of Canada (20%), and other healthcare professionals (10%). (Table 16.3).
| Most trusted source of information on vaccination | % (95% CI) |
|---|---|
| Your own family physician | 48.2 (46.3-50.1) |
| Health Canada, Public Health Agency of Canada | 19.5 (18.0-21.1) |
| Other health professional (e.g. nurse, pharmacist) | 9.9 (8.8-11.0) |
| World Health Organization (WHO) | 5.7 (4.7-6.6) |
| Health scientists and researchers | 5.3 (4.5-6.2) |
| Provincial/territorial/regional Health Authority | 4.3 (3.6-5.0) |
| Other people's experiences or knowledge | 2.7 (2.0-3.3) |
| Your family, friends or colleagues | 2.1 (1.5-2.6) |
| Alternative health practitioner (chiropractor, naturopath, osteopath, homeopath, etc.) | 1.4 (0.9-1.8) |
| Info-Santé or Telehealth telephone lines, 811 | 1.0 (0.7-1.4)Table 16.3 Footnote a |
Definitions: CI: Confidence interval. |
|
Vaccine fatigue
As vaccine fatigue has become an increasing concern for public health officials, this year's survey included questions to measure respondents' feelings of being tired of hearing about vaccination or of having to get vaccinated. Overall, 41% of adults reported not feeling fatigued at all, while 17% experienced a low level of fatigue, 22% moderate fatigue, 8% high fatigue, and 11% very high fatigue. The proportion of those experiencing very high fatigue was notably lower among adults aged 65 years and older (6%) compared to younger adults with CMC (11%) and those without CMC (14%). (Table 17.1).
| Response | All adults ≥18 (n=5,364) % (95% CI) | 18-64 years without CMC (n=2,244) % (95% CI) | 18-64 years with CMC (n=986) % (95% CI) | 65 years and older (n=2,034) % (95% CI) |
|---|---|---|---|---|
| Very high fatigue | 11.2 (10.0-12.5) | 13.7 (11.7-15.6) | 10.7 (8.0-13.3) | 5.6 (4.4-6.9) |
| High fatigue | 8.4 (7.3-9.4) | 8.8 (7.2-10.4) | 8.4 (6.2-10.6) | 7.4 (6.0-8.9) |
| Moderate fatigue | 22.3 (20.7-23.9) | 25.1 (22.6-27.6) | 21.1 (17.8-24.3) | 16.9 (14.9-18.9) |
| Low fatigue | 17.4 (16.0-18.8) | 17.9 (15.8-20.0) | 18.6 (15.3-21.9) | 15.6 (13.6-17.5) |
| I am not fatigued at all | 40.7 (38.9-42.5) | 34.5 (31.9-37.1) | 41.3 (37.3-45.3) | 54.5 (51.8-57.1) |
Definitions: CI: Confidence interval. CMC: Chronic medical conditions including asthma, lung diseases, heart conditions, cancer, diabetes, liver or kidney diseases, immune disorder, spleen problems, anemia, obesity, and blood disorders. |
||||
When examining influenza vaccination coverage by levels of vaccine fatigue, a clear trend emerged: higher levels of vaccine fatigue corresponded to lower vaccination coverage. Coverage was highest among those who reported no fatigue at all (58%), while it dropped significantly to just 11% among those who reported very high fatigue. This suggests that vaccine fatigue plays a significant role in influencing influenza vaccination uptake. (Table 17.2).
| Level of vaccine fatigue | Proportion of people vaccinated against flu % (95% CI) |
|---|---|
| Very high fatigue | 11.4 (8.2-14.6) |
| High fatigue | 26.0 (20.6-31.5) |
| Moderate fatigue | 30.4 (26.9-33.9) |
| Low fatigue | 48.7 (44.2-53.2) |
| I am not fatigued at all | 57.8 (55.0-60.6) |
Definitions: CI: Confidence interval. |
|
Discussion
The 2023-2024 flu season presented diverse outcomes for influenza vaccination coverage among Canadian adults. With an overall coverage rate of 42% among those aged 18 years and older, the coverage remains consistent with the previous season. This stability in coverage reflects a return to pre-pandemic levels observed during the 2019-2020 season after a temporary decline during the 2021-2022 season. However, vaccination coverage among high-risk groups remains a significant concern. Although seniors aged 65 and older achieved a relatively high coverage rate of 73%, approaching the national coverage goal of 80%, adults aged 18-64 with chronic medical conditions (CMC) continue to lag, with only 44% coverage. This is particularly troubling given the elevated risk of severe influenza-related complications in this population. Individuals unaware that they are considered at high risk of influenza-related complications may contribute to low coverage.Footnote 20 The lowest vaccination coverage was observed in adults aged 18-64 without CMC, with only 28% receiving the flu vaccine. This demographic consistently shows low uptake, indicating a need for targeted interventions to increase coverage.
Additionally, the increasing trend of pharmacy-based vaccinations reflects broader accessibility and convenience, which may contribute to higher overall coverage.Footnote 21 However, the variation in coverage among different age groups suggests that convenience alone is not sufficient to drive uptake in all populations.
The role of healthcare providers in influencing vaccination decisions cannot be overstated. The data indicate a significant increase in vaccination rates among individuals who received a recommendation from their healthcare provider, with coverage reaching 70% compared to 37% among those who did not receive a recommendation. This underscores the critical role of healthcare professionals in promoting vaccination, particularly among high-risk groups such as seniors and adults with CMC. The consistent trust placed in healthcare providers as a source of reliable vaccination information further highlights the need for continued engagement and communication from these professionals to improve coverage.
Vaccine fatigue has emerged as a significant factor influencing influenza vaccination uptake. The survey results reveal a clear association between higher levels of vaccine fatigue and lower vaccination coverage. This trend is particularly concerning given the ongoing efforts to maintain high vaccination rates in the face of the COVID-19 pandemic and other public health challenges. Addressing vaccine fatigue through tailored communication strategies and by reinforcing the benefits of vaccination, particularly for high-risk groups, will be essential in sustaining and improving vaccination coverage in the coming seasons.
Since September 2023, 39% of adults have received a COVID-19 vaccine as part of the fall vaccination campaign. Coverage was notably higher among seniors compared to younger adults with and without CMC. When compared to data from the Canadian COVID-19 Vaccination Coverage Surveillance System (CCVCSS), which is considered the most reliable source for COVID-19 vaccination data, reported a lower coverage of 19% among adults aged 18 years and older by February 24, 2024. The discrepancy between the survey and CCVCSS data may be partially due to different data cut-off dates, as the survey's data collection ended in March 5, 2024. Additionally, selection and information bias could play a role: selection bias occurs when survey participants are not fully representative of the entire population (e.g., individuals more likely to get vaccinated may also be more likely to participate), while information bias can arise from inaccuracies in how vaccination status is reported, leading to an overestimation of vaccination coverage in the survey compared to CCVCSS data.
While severe disease from COVID-19 is less frequent in healthy young adults than in older adults or those with chronic conditions, severe and long-lasting symptoms do still occur in younger populations.Footnote 22 Thus, it remains critical for younger adults to maintain up-to-date COVID-19 vaccination. Concerns about the safety and effectiveness of the COVID-19 vaccines were key reasons for non-vaccination, making it essential to address these concerns through public health messaging to ensure continued adherence to vaccination recommendations and emphasize the benefits of ongoing COVID-19 protection.
Awareness of the Respiratory Syncytial Virus (RSV) among adults was relatively low, with 40% unfamiliar with the virus. Despite this, intent to receive the RSV vaccine was notably higher among seniors and those with CMC, while younger adults without CMC showed less interest. Concerns about vaccine safety and side effects were common reasons for hesitancy, similar to other vaccines. The findings underscore the need for targeted public education and clear communication on the safety of co-administering RSV, flu, and COVID-19 vaccines.
The survey's exploration of knowledge, attitudes, and beliefs regarding vaccination also sheds light on potential barriers to vaccination. Misconceptions about the flu vaccine, such as the belief that it can cause the flu or that natural immunity is preferable, persist among a significant proportion of adults. These misconceptions, coupled with the influence of vaccine fatigue, highlight the need for continued public health education and outreach to dispel myths and emphasize the safety and efficacy of vaccines.
Moreover, this year's survey identified family physicians (67%), Health Canada or the Public Health Agency of Canada (51%), and other healthcare professionals (50%) as the most trusted sources of vaccination information. In contrast, alternative health practitioners were the least consulted source (13%). Adults who sought information from provincial or regional health authorities had higher influenza vaccination coverage (51%) compared to those who consulted alternative sources (33%). Trust in family physicians and health authorities underscores their critical role in promoting vaccine uptake and guiding public health communications.
Strengths and limitations
The major strength of this survey was the timely reporting of seasonal influenza vaccination coverage across Canada. The timeliness of this survey allows Canada to meet its international reporting obligations and help identify priorities for future vaccination program planning. Additionally, the Seasonal Influenza Vaccination Coverage Survey is flexible in allowing question modules to be added or removed on an annual basis in light of changing priorities.
Limitations of this survey included the relatively low response rate of 10%. This response rate can increase the potential for non-response bias, as survey respondents may differ from those who chose not to complete the survey.
Additionally, survey respondents were interviewed within 6 months of the beginning of the seasonal influenza vaccination campaign, which could mitigate recall bias. In addition, it appears in some studies that self-reported influenza vaccination status is a valid measure of vaccine uptake when medical records or registry data are not available.Footnote 23
Conclusion
The 2023-2024 seasonal influenza vaccination coverage survey revealed that 42% of adults in Canada received the influenza vaccine, consistent with the previous season and pre-pandemic levels, with higher coverage among females and seniors. Continued efforts are essential to improve vaccination coverage, especially among high-risk groups where coverage remains below the national target. The survey also highlighted a growing trend toward pharmacy-based vaccinations, which has improved accessibility but does not address all barriers to uptake. Additionally, healthcare provider recommendations and levels of vaccine fatigue significantly impact flu vaccination coverage, underscoring the need for targeted communication strategies. Awareness of RSV was generally low, though intent to vaccinate was higher among older adults and those with chronic medical conditions. Trusted sources of information, such as family physicians and health authorities, play a crucial role in public health communications. Addressing vaccine fatigue, enhancing public education, and improving accessibility are critical steps to increase vaccination coverage and ensure better health outcomes for all populations.