
Archived - HIV in Canada, 2017

 Download this article as a PDF
Published by: The Public Health Agency of Canada
Issue: Volume 44-12: Adult immunization
Date published: December 6, 2018
ISSN: 1481-8531
Submit a manuscript
About CCDR
Browse
Volume 44-12, December 6, 2018: Adult immunization
Surveillance
HIV in Canada—Surveillance Report, 2017
N Haddad1, JS Li1, S Totten1, M McGuire1*
Affiliations
1 Centre for Communicable Diseases and Infection Control, Public Health Agency of Canada, Ottawa, ON
Correspondence
Suggested citation
Haddad N, Li JS, Totten S, McGuire M. HIV in Canada–Surveillance Report, 2017. Can Commun Dis Rep 2018;44(12): 348-56. https://doi.org/10.14745/ccdr.v44i12a03
Keywords: HIV, surveillance, gay, bisexual and other men who have sex with men, people who inject drugs, perinatal HIV, heterosexual contact, Indigenous
Abstract
Background: Human immunodeficiency virus (HIV) is a global public health issue with an estimated 1.8 million people newly infected in 2017.
Objective: To provide a descriptive overview of reported cases of HIV in Canada by geographic location, sex, age group, exposure category and race/ethnicity, from 1985–2017, with a focus on the most recent data.
Methods: The Public Health Agency of Canada (PHAC) monitors HIV through the national HIV/AIDS Surveillance System, which is a passive, case-based system that collates non-nominal data voluntarily submitted and validated by all Canadian provinces and territories. Additional data sources presented here include data on immigration-related medical screening for HIV by Immigration, Refugees and Citizenship Canada and data on infants perinatally-exposed to HIV submitted by the Canadian Perinatal HIV Surveillance Program. Data were collated, tables and figures were prepared and descriptive statistics were applied by PHAC and validated by each province and territory.
Results: A total of 2,402 new HIV diagnoses were reported in 2017 in Canada; an increase of 3% compared with 2016 and an increase of 17.1% since 2014. The national diagnosis rate increased slightly, from 6.4 per 100,000 population in 2016 to 6.5 per 100,000 population in 2017. In 2017, while Ontario continued to account for the highest number (n=935) and proportion (38.9%) of reported HIV cases, Saskatchewan reported the highest provincial diagnosis rate (15.5 per 100,000 population). In 2017, the diagnostic rate for males at 9.9 per 100,000 population was higher than for females at 3.2 per 100,000 population. As in 2016, the 30–39 year age group had the highest HIV diagnosis rate at 14.8 per 100,000 population. The “gay, bisexual and other men who have sex with men” exposure category continued to represent almost half (46.4%) of all reported HIV cases in adults. In 2017, the absolute number of HIV-positive migrants entering Canada increased to a total number of 835 migrants. One mother-to-child HIV transmission was confirmed in a mother who did not receive any perinatal antiretroviral therapy and two transmissions were confirmed in mothers who did receive perinatal antiretroviral therapy.
Conclusion: Similar to the annual changes that have been reported since 2014, the number and rate of reported HIV cases in Canada in 2017 increased slightly compared with 2016. Additional data and analysis are needed to determine the extent to which these findings reflect an increase in HIV transmission, an increase in HIV testing, changes in reporting practices and an increase in the number of HIV-positive people migrating to Canada.
Introduction
Human immunodeficiency virus (HIV) is an important contributor to the global burden of disease and continues to be a major public health issue. In 2010, HIV was the leading cause of disability-adjusted life-years worldwide for people in the 30–44 year age group, and the fifth leading cause for all ages Footnote 1. The Joint United Nations Programme on HIV/AIDS (UNAIDS) Footnote 2 estimated that there were 36.9 million people living with HIV at the end of 2017 globally and as of June 2017, 21.7 million people were receiving antiretroviral therapy (ART) Footnote 2Footnote 3. In the absence of a cure for HIV infection, ART has been effective in controlling the infection and minimizing transmission, thus ensuring that people living with HIV, including pregnant women and key populations at risk, can lead healthy and productive lives.
The objective of this report is to provide a descriptive overview of the epidemiology of all reported diagnoses of HIV in Canada, up to the end of 2017, by province/territory, sex, age group, exposure category and race/ethnicity. Data on immigration medical screening results for HIV, as well as the number of infants perinatally exposed to HIV and the proportion of these infants receiving ART, are also presented.
Methods
Data sources
The data presented in this HIV surveillance report come from three different sources: the national HIV/AIDS Surveillance System (HASS) maintained by the Public Health Agency of Canada (PHAC); immigration medical screening for HIV by Immigration, Refugees and Citizenship Canada (IRCC); and the Canadian Perinatal HIV Surveillance Program (CPHSP).
HIV/AIDS Surveillance System
The HASS is a passive, case-based surveillance system that collates non-nominal data on persons diagnosed with HIV infection. Details on HASS’s methods, including data collection processes, data management, data quality control, analysis, and the classification and categorization of population subgroups have previously been described in detail Footnote 4. Data, including but not limited to age, sex, race/ethnicity and risks associated with the transmission of HIV (exposure categories), are voluntarily submitted to PHAC from provincial and territorial public health authorities. Of note: Quebec does not submit exposure category or race/ethnicity information for HIV cases to PHAC; for Ontario, no race/ethnicity data were available for reported HIV cases before 2009; and race/ethnicity data for British Columbia were not submitted for the current reporting year and all historic ethnicity data have been removed at the province’s request, pending a review of reporting practices of these data at the provincial level.
Cases reported to PHAC must meet the national case definition Footnote 5. Provinces and territories provide data through the National Case Reporting Form Footnote 4 or through a secure electronic dataset transmission. All raw data (paper forms and electronic datasets) are retained in compliance with the Directive for the collection, use and dissemination of information relating to public health (PHAC, 2013, unpublished document). Data quality assessment, such as the detection of duplicate entries, is handled by the provinces and territories prior to submission to PHAC. The data presented in this surveillance report represent HIV cases diagnosed on or before December 31, 2017 that were submitted by provincial and territorial surveillance programs to PHAC up to July 19, 2018.
In this surveillance report, the term “cases” or “reported cases” refers to individuals diagnosed by a province or territory in a given year. Since surveillance data describe only diagnosed cases of HIV, statistical modelling and additional sources of information are used to produce estimates that describe the overall HIV epidemic in Canada, including people with diagnosed and undiagnosed HIV infection Footnote 6. The term “adult” is used throughout the report when examining specific variables such as exposure category. For the purposes of this report, an “adult” is anyone aged 15 years or older.
Immigration medical screening for HIV
All foreign nationals applying for permanent residence and some applying for temporary residence must undergo an Immigration Medical Examination (IME) administered by the IRCC, either in Canada or overseas. The IRCC conducts mandatory routine HIV screening on all applicants 15 years of age and older, as well as on those under the age of 15 years who have certain risk factors Footnote 7. The IRCC provides PHAC with non-nominal data collected during the IME on migrants who tested positive for HIV, either in Canada or abroad, and subsequently entered Canada. The term migrant is being used broadly and includes the following: immigrants (permanents residents of Canada); refugees; refugee claimants or convention refugees; and temporary residents (visitors, students or foreign workers). The data presented here includes the year of testing (for those tested in Canada) or the year the migrant entered Canada (for those tested overseas). The IME data presented here were obtained from two IRCC sources: the HIV database updated to March 2018 (for all applicants screened in Canada or overseas who tested positive for HIV); and the Health Branch Post-Arrival Health Public Health Liaison Unit Provincial Notifications — Overseas Notifications database updated to July 2018. IRCC data were submitted to PHAC in March 2018.
Of note, the results of IME testing done in Canada are available to provinces/territories where the testing is done, and IRCC also shares relevant data with the province/territory of destination for IME testing done outside of Canada. These data are subsequently incorporated, to varying degrees, into the provincial/territorial routine HIV case-based surveillance systems, with some jurisdictions reporting these HIV-positive migrant cases as a new diagnosis and others excluding them.
Canadian Perinatal HIV Surveillance Program
National data on the HIV status of infants exposed perinatally to HIV infection are collected through the CPHSP, an initiative of the Canadian Paediatric AIDS Research Group. The CPHSP is a sentinel-based active surveillance system that collects data on two groups of children: infants born to HIV-positive women in Canada; and HIV-infected children receiving care at any participating site (whether born in Canada or abroad). Data on the HIV status of these infants and on the infant’s history of perinatal ART exposure (i.e., the infant’s mother was receiving ART during pregnancy) were obtained through a national, non-nominal, confidential survey of infants known to participating pediatricians in tertiary care centres and specialists in HIV clinics across Canada. Additional information on CPHSP methodology has been described previously Footnote 4. Surveillance data for 2017, including data updates for previous years, were submitted to PHAC in March 2018.
Analysis
Microsoft Excel 2010 (Redmond, Washington, United States [US]) and SAS Enterprise Guide v5.1 (Cary, North Carolina, US) software were used for data cleaning and analysis. Standardized data recoding procedures were applied to all submitted provincial and territorial datasets to create a national dataset for analysis. No statistical procedures were used for comparative analysis, nor were any statistical techniques applied to account for missing data since analyses are limited to cross-tabulations. Instead, missing data are presented in an independent row in each table (where feasible). The proportions presented in the text exclude records with missing values (unless otherwise noted). It is worth noting that different HIV reporting requirements and practices exist across the country Footnote 8 and that the completeness of some epidemiological information varies between provinces and territories. The population data source used to calculate rates was the 2017 Annual Demographic Statistics, issued by Statistics Canada Footnote 9.
With the exception of cases where data suppression was requested by the province or territory, data in tables with small cell sizes (n≤5) were not suppressed, since disclosure is not deemed to pose any risk of identifying individual cases. These procedures are in line with PHAC’s Directive for the collection, use and dissemination of information relating to public health (PHAC, 2013, unpublished document). The data were verified by the provinces and territories to ensure accuracy. Key findings are summarized in this manuscript. Supplementary tables are listed in the Appendix and are available upon request.
Results
Overall trends
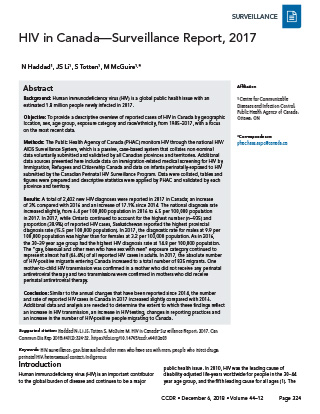
In 2017, a total of 2,402 new HIV cases were reported in Canada, an increase of 3% compared with 2016 and an increase of 17.1% since 2014. The national diagnosis rate also increased from 5.8 per 100,000 population in 2014 to 6.5 per 100,000 population in 2017, but changed little from 2016 to 2017 (6.4 versus 6.5 per 100,000 population) (Figure 1).
Figure 1: Number of reported cases, including national, male and female diagnostic rates, by year of test—Canada, 1996–2017
Text description: Figure 1
Figure 1: Number of reported cases, including national, male and female diagnostic rates, by year of test—Canada, 1996–2017
This figure includes a bar graph and three broken line graphs, which represent the number of HIV cases reported in Canada, by test year, from 1996 to 2017.
| Male (number HIV cases of reported) |
Male (rate per 100,000 population) |
Female (number of reported HIV cases) |
Female (rate per 100,000 population) |
|---|---|---|---|
| 2080 | 14.2 | 559 | 3.7 |
| 1881 | 12.7 | 490 | 3.2 |
| 1724 | 11.6 | 483 | 3.2 |
| 1619 | 10.8 | 528 | 3.4 |
| 1553 | 10.2 | 487 | 3.1 |
| 1623 | 10.6 | 551 | 3.5 |
| 1810 | 11.7 | 610 | 3.9 |
| 1809 | 11.5 | 616 | 3.9 |
| 1828 | 11.6 | 652 | 4.0 |
| 1811 | 11.3 | 627 | 3.9 |
| 1800 | 11.1 | 689 | 4.2 |
| 1792 | 11.0 | 598 | 3.6 |
| 1921 | 11.7 | 669 | 4.0 |
| 1749 | 10.5 | 607 | 3.6 |
| 1759 | 10.4 | 526 | 3.1 |
| 1722 | 10.1 | 534 | 3.1 |
| 1584 | 9.2 | 483 | 2.8 |
| 1603 | 9.2 | 445 | 2.5 |
| 1547 | 8.8 | 496 | 2.8 |
| 1588 | 8.9 | 502 | 2.8 |
| 1778 | 9.9 | 543 | 3.0 |
| 1800 | 9.9 | 595 | 3.2 |
Overall, there was a decrease in the annual diagnosis rate between 1996 and 2000, followed by an increase in 2001 and a plateau until 2008. A slight decrease of the national rate followed until 2014. Since then, a slight increase has been observed (Figure 1). Figure 1 also shows generally comparable trends for males and females. In 2017, the diagnostic rate for males (at 9.9 per 100,000 population) was higher than for females (at 3.2 per 100,000 population). The same trend was observed for all historical data since 1996.
Geographic distribution
The geographic distribution of reported HIV cases in 2017 was comparable to that of 2016. In 2017, Ontario continued to account for the highest number and proportion of reported HIV cases (n=935, 38.9%), followed by Quebec (n=670, 27.9%), Alberta (n=282, 11.7%) and British Columbia (n=187, 7.8%).
The provincial and territorial diagnostic rates varied across the country. In 2017, Saskatchewan accounted for 7.5% of total reported new HIV cases, yet that province had the highest diagnosis rate at 15.5 per 100,000 population. Following a decrease in the rates in 2013 (11.8 per 100,000 population) and 2014 (10.8 per 100,000 population) the rates in Saskatchewan have since been increasing and are more comparable to historic years (2008 to 2012).
In 2017, Quebec accounted for 27.9% of total reported new HIV cases and had the second highest diagnosis rate of HIV at 8.0 per 100,000 population. Manitoba, Alberta and Ontario each had the third highest rate at 6.6 per 100,000 population.
Age group and sex distribution
Data on age groups were available for nearly 100% of reported HIV cases for 2017 (n=2,397). The 30–39 year old age group continued to represent the highest number of new HIV cases (31.2%), a finding that has been observed since the beginning of the reporting period. In 2017, the 50 years and older age group represented the second highest proportion of new HIV cases at 22.9%, followed closely by the 40–49 year old age group at 22.4%.
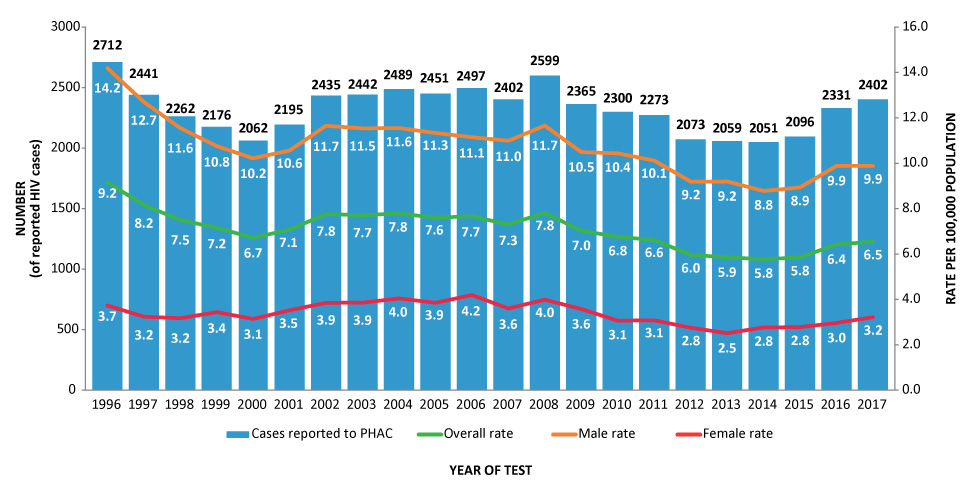
Figure 2 shows the trends in the diagnostic rates for each age group, between 2013 and 2017. In 2017, the 30–39 year old age group had the highest rate of reported HIV cases (14.8 per 100,000 population), followed by the 40–49 year old age group (11.3 per 100,000 population); in addition, rates in these age groups have been increasing since 2015 (Figure 2). Although there was an overall increase in the rates for the 15–19 year old age group and the 50 years and older age group since 2014, the rates decreased in 2017 (2.0 per 100,000 population and 3.9 per 100,000 population, respectively). Children (<15 years of age) had the lowest average rate over the five-year range.
Figure 2: HIV diagnosis rate, by age group and year of test—Canada, 2013–2017
Text description: Figure 2
Figure 2: HIV diagnosis rate, by age group and year of test—Canada, 2013–2017
This figure is a broken line chart overlaying the HIV diagnosis rates (by 100,000 population) by age group and year of testing in Canada from 2013 to 2017.
| Age groups | Year of test | ||||
|---|---|---|---|---|---|
| 2013 (rate) |
2014 (rate) |
2015 (rate) |
2016 (rate) |
2017 (rate) |
|
| Children under 15 years | 0.4 | 0.2 | 0.2 | 0.2 | 0.3 |
| 15 to 19 years | 1.7 | 1.7 | 1.9 | 2.3 | 2.0 |
| 20 to 29 years | 9.4 | 8.9 | 10.5 | 10.6 | 10.0 |
| 30 to 39 years | 12.6 | 13.3 | 11.7 | 13.5 | 14.8 |
| 40 to 49 years | 10.4 | 9.6 | 9.4 | 10.6 | 11.3 |
| 50 years and above | 3.4 | 3.4 | 3.8 | 4.1 | 3.9 |
Data on sex were available for nearly 100% of reported HIV cases in 2017 (n=2,395). Since the beginning of HIV surveillance, males have accounted for a larger percentage of diagnosed HIV cases among adults (≥15 years). In 2017, 75.2% of reported HIV cases were male and 24.8% were female.
Rates for reported HIV cases by sex for 2017 indicate that the 30–39 year age group had the highest rate for both males (21.3 per 100,000 population) and females (8.2 per 100,000 population). Similarly in both sexes, the 40–49 year age group had the second highest rate for males (16.2 per 100,000 population) and females (6.3 per 100,000 population).
Exposure category distribution
In 2017, information on exposure category was available for 60.2% of reported HIV cases (n=1,446). The gay, bisexual and other men who have sex with men (gbMSM) exposure category continued to represent the largest number and proportion of all reported adult cases with known exposure category (46.4%) (Table 1). The second most frequently reported exposure category was heterosexual contact at 28.7%. The latter exposure category includes three exposure profiles: HIV infected individuals born in a country where HIV is endemic (11.5%); heterosexual contact with a person at risk (7.2%); and heterosexual contact with no identifiable risk (10.0%). People who inject drugs (PWID) exposure category accounted for 16.3% of all reported HIV cases in adults (Table 1).
| Exposure category | Sex | |||||
|---|---|---|---|---|---|---|
| Male | Female | TotalTable 1 footnote b | ||||
| n | % | n | % | n | % | |
| gbMSM | 667 | 60.9 | 0 | 0 | 667 | 46.4 |
| gbMSM/PWID | 40 | 3.6 | 0 | 0 | 40 | 2.8 |
| PWID | 139 | 12.7 | 94 | 27.6 | 234 | 16.3 |
| Heterosexual contact | ||||||
|
61 | 5.6 | 105 | 30.9 | 166 | 11.5 |
|
54 | 4.9 | 49 | 14.4 | 104 | 7.2 |
|
90 | 8.2 | 54 | 15.9 | 144 | 10.0 |
| OtherTable 1 footnote c | 45 | 4.1 | 38 | 11.2 | 83 | 5.8 |
| Subtotal | 1,096 | 100.0 | 340 | 100.0 | 1,438 | 100.0 |
| No identified risk | 75 | 4.2 | 19 | 3.2 | 94 | 4.0 |
| Exposure category unknown or not reported ("missing")Table 1 footnote d | 616 | 34.5 | 228 | 38.8 | 847 | 35.6 |
| Total | 1,787 | n/a | 587 | n/a | 2,379 | n/a |
As in 2016 Footnote 10, the distribution of HIV cases among adult males and females varied by exposure category. In 2017, the gbMSM exposure category continued to account for the greatest proportion of reported HIV cases among adult males (60.9%), while among adult females, history of heterosexual contact, origin from an HIV-endemic country (30.9%) and PWID (27.6%) exposure categories accounted for the greatest proportion of reported HIV cases (Table 1).
Race/ethnicity distribution
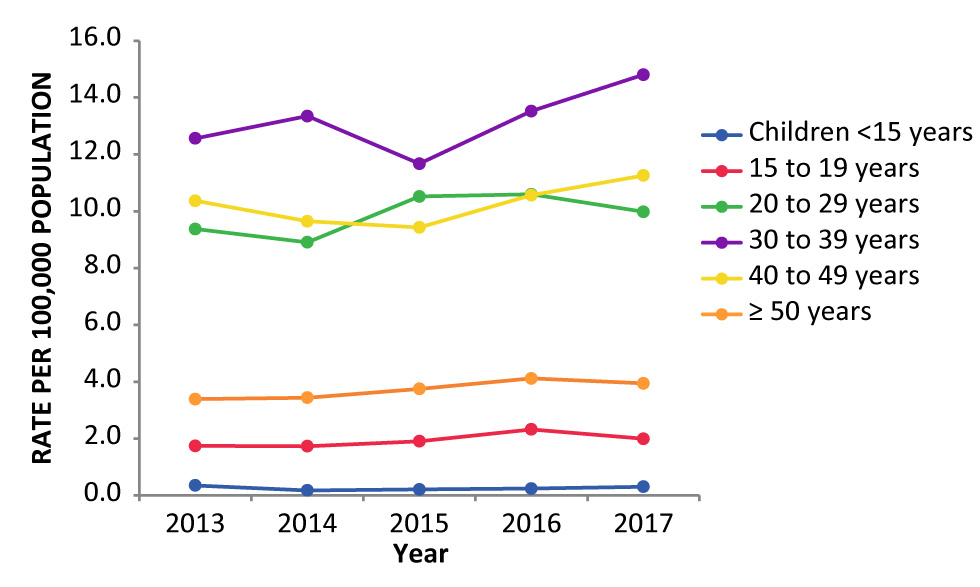
In 2017, information on race/ethnicity was available for 49.3% of reported HIV cases (n=1,184). Since 1999, the Caucasian race/ethnicity category has accounted for the largest proportion of new HIV cases in Canada for all ages and sexes (43.1% of cases where ethnicity/race was reported). In 2017, of the reported HIV cases with a known race/ethnicity, 34.5% were reported as Caucasian, 25.3% were reported as Black and 20.1% were reported as Indigenous. The Indigenous race/ethnicity category was further subdivided into the following subgroups: First Nations (17.4%); Métis (2.3%); Inuit (0.2%); and Indigenous unspecified (0.3%) (Figure 3).
Figure 3: Proportion of reported HIV cases (n=1,184) by race/ethnicity and Indigenous subgroups—Canada, 2017Figure 3 footnote aFigure 3 footnote b
Text description: Figure 3
Figure 3: Proportion of reported HIV cases (all ages; n=1,184) by race/ethnicity and Indigenous subgroups—Canada, 2017
This figure is a pie chart illustrating the proportion of reported HIV cases (n = 1,184) by race or ethnicity and Aboriginal subgroups in Canada in 2017
| Race or ethnicity | % |
|---|---|
| Indigenous | 20.1 |
| BlackFigure 3 footnote d | 25.3 |
| Latin AmericanFigure 3 footnote c | 6.3 |
| Caucasians | 34.5 |
| OtherFigure 3 footnote e | 13.9 |
The Aboriginal category in the table above is divided into subgroups as follows:
| Indigenous | % |
|---|---|
| First Nations | 17.4 |
| Metis | 2.3 |
| Inuits | 0.2 |
| Indigenous, unspecified | 0,3 |
As in 2016, variations were observed in the race/ethnicity distribution by sex. In 2017, in males, the Caucasian race/ethnicity accounted for 41.7% of reported HIV cases with available race/ethnicity data. The Black and Indigenous race/ethnicities accounted for 17.9% and 16.3%, respectively. In comparison, in females, the Black race/ethnicity accounted for 46.3% of reported HIV cases, followed by the Indigenous race/ethnicity at 30.9% and Caucasian at 14.1% (Table 2).
| Race/ethnicity | Sex/year of test | |||||||||||
|---|---|---|---|---|---|---|---|---|---|---|---|---|
| 2016 | 2017 | |||||||||||
| Male | Female | TotalTable 2 footnote c | Male | Female | TotalTotalTable 2 footnote c | |||||||
| n | % | n | % | n | % | n | % | n | % | n | % | |
| Indigenous, total | 128 | 15.4 | 113 | 35.6 | 243 | 21.1 | 142 | 16.3 | 96 | 30.9 | 238 | 20.1 |
|
114 | 13.7 | 102 | 32.2 | 218 | 19.0 | 122 | 14.0 | 84 | 27.0 | 206 | 17.4 |
|
11 | 1.3 | 7 | 2.2 | 18 | 1.6 | 16 | 1.8 | 11 | 3.5 | 27 | 2.3 |
|
2 | 0.2 | 1 | 0.3 | 3 | 0.3 | 2 | 0.2 | 0 | 0.0 | 2 | 0.2 |
|
1 | 0.1 | 3 | 0.9 | 4 | 0.3 | 2 | 0.2 | 1 | 0.3 | 3 | 0.3 |
| South Asian/West Asian/ArabTable 2 footnote d | 39 | 4.7 | 7 | 2.2 | 46 | 4.0 | 45 | 5.2 | 6 | 1.9 | 51 | 4.3 |
| AsianTable 2 footnote e | 63 | 7.6 | 4 | 1.3 | 67 | 5.8 | 76 | 8.7 | 10 | 3.2 | 86 | 7.3 |
| BlackTable 2 footnote f | 137 | 16.5 | 116 | 36.6 | 253 | 22.0 | 156 | 17.9 | 144 | 46.3 | 300 | 25.3 |
| Latin AmericanTable 2 footnote g | 51 | 6.1 | 3 | 0.9 | 54 | 4.7 | 70 | 8.0 | 4 | 1.3 | 74 | 6.3 |
| Caucasian | 396 | 47.7 | 67 | 21.1 | 463 | 40.3 | 364 | 41.7 | 44 | 14.1 | 408 | 34.5 |
| Other | 16 | 1.9 | 7 | 2.2 | 23 | 2.0 | 20 | 2.3 | 7 | 2.3 | 27 | 2.3 |
| Subtotal | 830 | 100.0 | 317 | 100.0 | 1,149 | 100.0 | 873 | 100.0 | 311 | 100.0 | 1,184 | 100.0 |
| Race/ethnicity not reported ("missing")Table 2 footnote h | 948 | 53.3 | 226 | 41.6 | 1,182 | 50.7 | 927 | 51.5 | 284 | 47.7 | 1,218 | 50.7 |
| Total | 1,778 | n/a | 543 | n/a | 2,331 | n/a | 1,800 | n/a | 595 | n/a | 2,402 | n/a |
Race/ethnicity and exposure category distribution
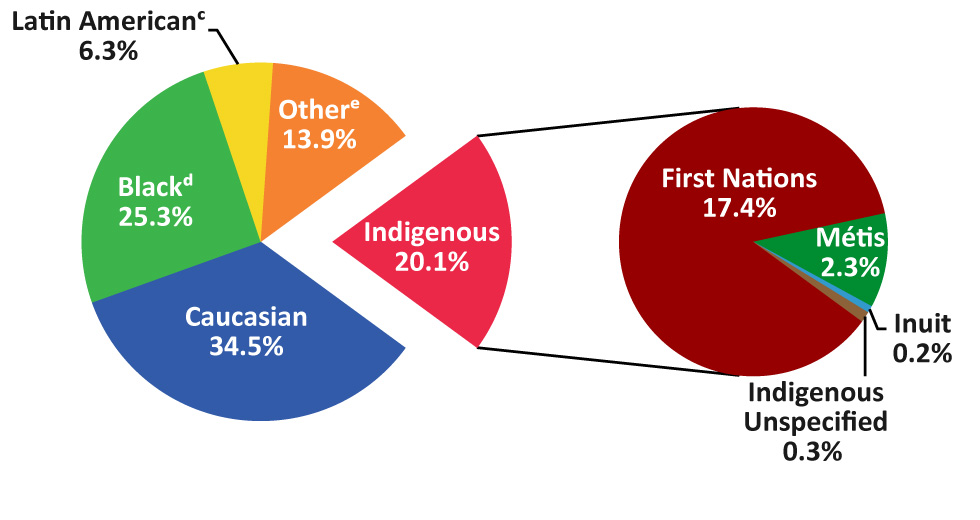
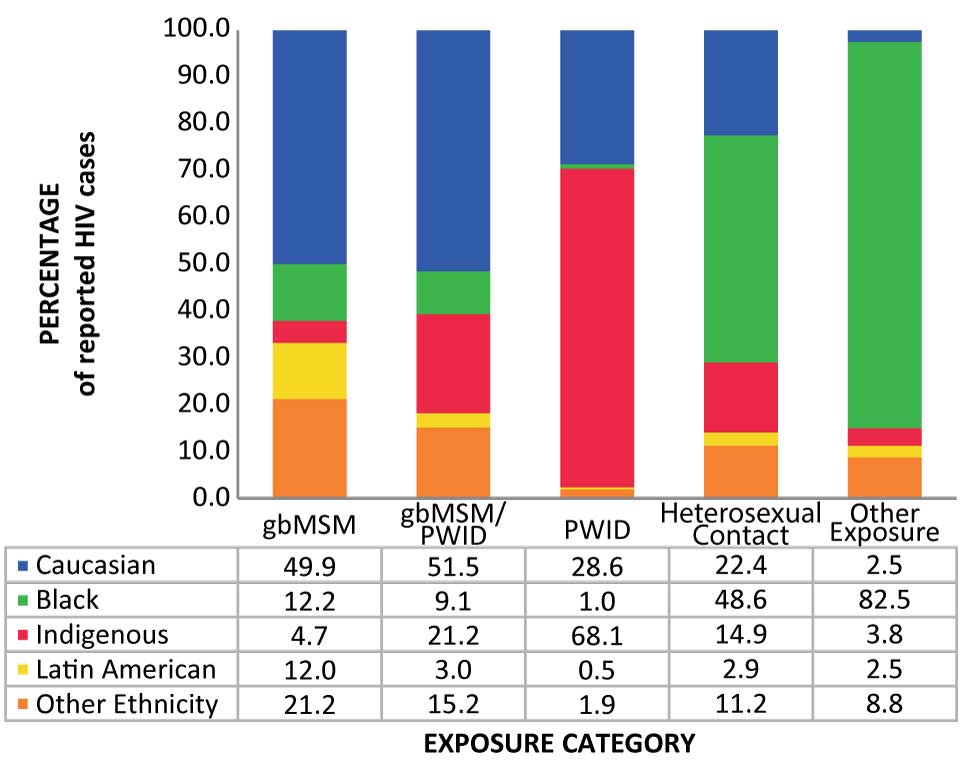
In 2017, information on both race/ethnicity and exposure category was available for 49.2% of reported cases. Among 2017 gbMSM cases, the majority were reported as Caucasian (49.9%). The majority of cases attributed to PWID were reported as Indigenous (68.1%). The Black race/ethnicity accounted for 48.6% of cases attributed to heterosexual contact (Figure 4).
Figure 4: Proportion of reported HIV cases (all ages) by exposure category and race/ethnicity—Canada, 2017Figure 4 footnote aFigure 4 footnote bFigure 4 footnote cFigure 4 footnote dFigure 4 footnote eFigure 4 footnote f
Text description: Figure 4
Figure 4: Proportion of reported HIV cases (all ages) by exposure category and race/ethnicity—Canada, 2017
This figure is a bar graph showing the proportion of reported HIV cases (for all ages) by exposure category and race / ethnicity in Canada in 2017
| Gay, bisexual and gbMSM (%) |
Gay, bisexual and gbMSM /PWID (%) |
PWID (%) |
Contact heterosexuel (%) |
Other exposureFigure 4 footnote f (%) |
|
|---|---|---|---|---|---|
| Caucasians | 49.9 | 51.5 | 28.6 | 22.4 | 2.5 |
| BlackFigure 4 footnote d | 12.2 | 9.1 | 1.0 | 48.6 | 82.5 |
| Indigenous | 4.7 | 21.2 | 68.1 | 14.9 | 3.8 |
| Latin AmericanFigure 4 footnote c | 12.0 | 3.0 | 0.5 | 2.9 | 2.5 |
| Other ethnicityFigure 4 footnote e | 21.2 | 15.2 | 1.9 | 11.2 | 8.8 |
Immigration medical screening for HIV
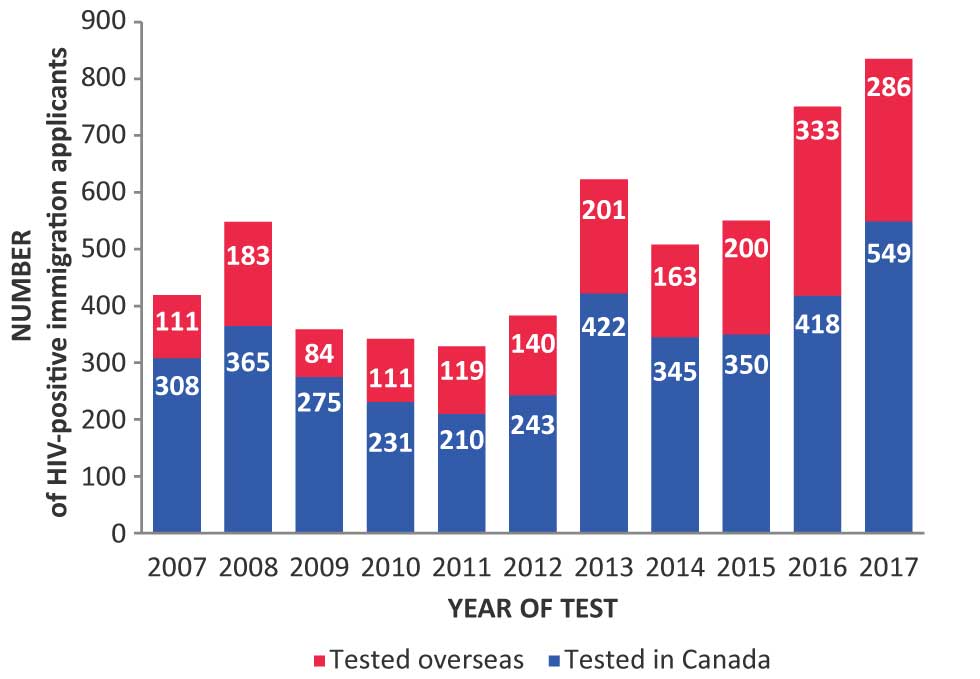
Data from IRCC indicate that over the last five years, the HIV diagnosis rate among migrants to Canada relative to the total number of IMEs undertaken in the same calendar year has remained relatively stable at 0.14% (2013–2017); however, Canada has seen an overall increase in the volume of immigration over the years and the absolute number of migrants entering Canada who tested positive for HIV on an IME has increased over the last three years. In 2017, there were 835 migrants identified who tested positive for HIV compared with 751 in 2016, and 550 in 2015. Among these 835 migrants in 2017, 549 underwent an IME in Canada and 286 underwent an IME overseas (Figure 5).
Figure 5: Number of HIV-positive migrants by testing location and year of test, 2007–2017Figure 5 footnote a
Text description: Figure 5
Figure 5: Number of HIV-positive migrants by testing location and year of test, 2007–2017
This figure is a bar graph showing the number of migrants diagnosed with HIV by location (in Canada or abroad) and year of testing (2007 to 2017).
| Year | Migrants tested in Canada | Migrants tested overseas |
|---|---|---|
| 2007 | 308 | 111 |
| 2008 | 365 | 183 |
| 2009 | 275 | 84 |
| 2010 | 231 | 111 |
| 2011 | 210 | 119 |
| 2012 | 243 | 140 |
| 2013 | 422 | 201 |
| 2014 | 345 | 163 |
| 2015 | 350 | 200 |
| 2016 | 418 | 333 |
| 2017 | 549 | 286 |
Canadian Perinatal HIV Surveillance System
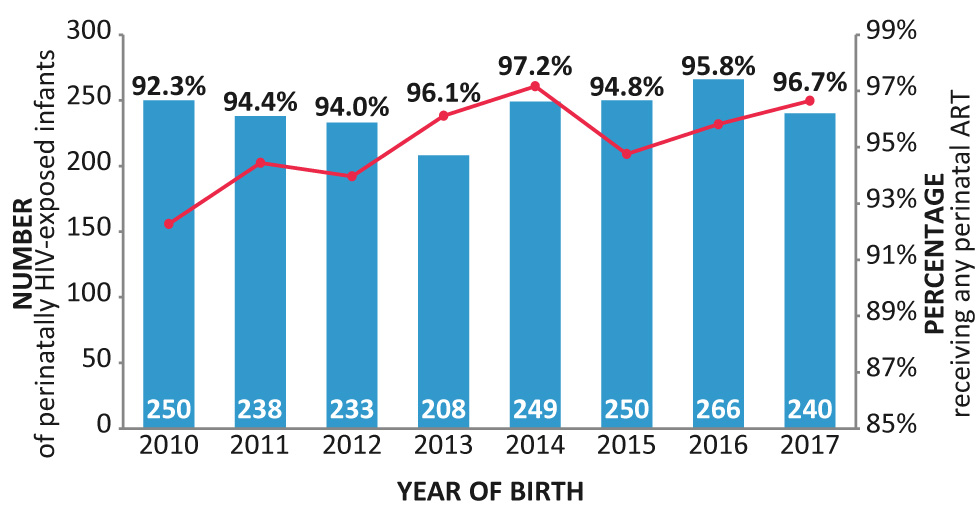
There were 240 infants perinatally-exposed to HIV in 2017. In total, three HIV transmissions were confirmed—one in an infant whose mother did not receive any perinatal ART prophylaxis and two in infants whose mothers did receive perinatal ART prophylaxis. The percentage of HIV-positive mothers receiving ART decreased slightly in 2015 but increased in the subsequent two years, reaching 96.7% in 2017 (Figure 6).
Figure 6: Number of perinatally HIV-exposed infants and proportion of perinatally HIV-exposed infants whose mothers were receiving perinatal antiretroviral therapy by year of birth—Canada, 2010–2017
Text description: Figure 6
Figure 6: Number of perinatally HIV-exposed infants and proportion of perinatally HIV-exposed infants whose mothers were receiving perinatal antiretroviral therapy by year of birth—Canada, 2010–2017
This figure is the combination of a bar graph and a linear graph illustrating the number of HIV-exposed infants during the perinatal period while the mother was receiving perinatal antiretroviral therapy in Canada from 2010 to 2017.
| Year of birth | Number of perinatally HIV-exposed infants | Percentage of mothers receiving antiretroviral therapy |
|---|---|---|
| 2010 | 250 | 92.3 |
| 2011 | 238 | 94.4 |
| 2012 | 233 | 94.0 |
| 2013 | 208 | 96.1 |
| 2014 | 249 | 97.2 |
| 2015 | 250 | 94.8 |
| 2016 | 266 | 95.8 |
| 2017 | 240 | 96.7 |
Heterosexual contact continued to be the most frequently reported maternal exposure category in 2017 (69.5%), followed by PWID (23.6%). Between 1984 — 2017, 50.0% of perinatally HIV-exposed infants were from the Black race/ethnicity, while 23.3% were reported as Caucasian and 18.1% as Indigenous. The maternal region of birth for the majority of infants was North America (42.3%), followed by Africa (38.6%). The highest proportions of perinatally HIV-exposed infants were reported in Ontario (34.4%) and Quebec (25.3%).
Discussion
In 2017, a total of 2,402 newly diagnosed cases of HIV were reported to PHAC, which corresponded to a 3% increase since 2016 and a 17.1% increase since 2014; however, the national diagnosis rate of 6.5 per 100,000 population changed very little from the rate of 6.4 per 100,000 in 2016.
The highest proportions of cases among males diagnosed with HIV were Caucasian and attributed to the gbMSM exposure category, while among females the cases were more likely to be Black and attributed to heterosexual exposure. Although Caucasians accounted for the majority of reported diagnoses in 2017, both Indigenous and Black people were disproportionately represented, each making up less than 5% of the Canadian population but each accounting for more than 20% of new diagnoses (Table 2) Footnote 11Footnote 12.
Nationally, gbMSM remained the most frequently reported exposure category in 2017 and accounted for 46.4% of all reported HIV cases in adults with known exposure category, the second highest being heterosexual contact at 28.7%. There are many drivers that may contribute to the HIV epidemic in gbMSM such as therapeutic optimism since the introduction of effective ART, the dynamics of sexual networks, the high transmission efficiency of receptive anal intercourse and stigma limiting access to services Footnote 13Footnote 14Footnote 15.
Substantial progress has been made with respect to risk reduction of perinatal HIV transmission in Canada. This has been attributed to universal access to antenatal care, routine HIV screening of pregnant women and provision of treatment to those who test positive Footnote 16. In 2017, one HIV transmission was confirmed in an infant whose mother was not receiving any perinatal ART and two transmissions were confirmed in infants whose mothers were receiving perinatal ART.
Based on these surveillance data alone, it is not known why there has been an increase in the number of new HIV diagnoses in Canada between 2014 and 2017. A number of explanations are possible including an increase in HIV transmission (i.e., increased HIV incidence), an increase in HIV testing, changes in reporting practices and an increase in the number of HIV positive people migrating to Canada. The most recent estimates of HIV incidence in Canada provide some indication of a small increase in incidence between 2014 and 2016; however, it remains unclear if this represents a true increase in the underlying number of new infections because of the wide plausible ranges around these estimates Footnote 6. An increase in the number of people coming forward for HIV testing is another possibility. In recent years, multiple provinces have cited an increase in overall testing rates Footnote 17Footnote 18Footnote 19. Changes in reporting practices may also, in part, account for some of the increase; for example, in 2016, the reported increase in the province in Quebec can, in part, be explained by a partial shift to nominal testing from non-nominal testing as not all non-nominal cases were historically captured in national reporting. Finally, the observed increase may also, in part, reflect an increase in the number of HIV-positive people migrating to Canada (who are either testing positive for HIV for the first the time in Canada or who are re-testing in Canada) and who are subsequently being counted in Canada as a new diagnosis. Data from IRCC indicate that while the proportion of HIV-positive diagnoses among all IME applicants has been stable in recent years, the overall number of people migrating to Canada has increased and, thus, the number of HIV-positive migrants to Canada has also increased. In Ontario, for example, an increase in the number of new HIV diagnoses between 2016 and 2017 has, to some extent, been attributed to “out-of-province” diagnoses, defined as individuals who were initially diagnosed outside of Ontario (including people diagnosed outside of Canada) and then moved to Ontario where they were re-tested and counted as a new diagnosis in Ontario Footnote 20.
Strengths and limitations
The main strength of this report is that it is the primary source of national data on newly diagnosed cases of HIV in Canada in 2017.
While details regarding the limitations of the HASS have been described elsewhere Footnote 4Footnote 10, several key limitations should be highlighted. HASS is a passive case-based surveillance system that collates data submitted annually on a voluntary basis to PHAC from all provincial and territorial public health authorities, as opposed to active case solicitation. As a result, it is difficult to ascertain the degree of coverage of the system. There are additional uncertainties due to reporting delays, the potential for including duplicate cases due to the non-nominal nature of HIV reporting in some jurisdictions, and the lack of a standardized approach to handling HIV cases previously diagnosed outside of Canada or outside of the province/territory with some jurisdictions counting them as new cases and others excluding them. In addition, there is incomplete exposure category and ethnicity information from several provinces: incomplete exposure category and ethnicity information (Ontario); no ethnicity information (British Columbia); and no exposure category or ethnicity information (Quebec). Thus, the exposure category and ethnicity data presented in this report are not nationally representative.
Finally, it is important to recognize that the data in this report are considered provisional and, as it continues to be updated annually, it may be subject to change in future HIV surveillance reports. If there are discrepancies between the data summarized in this report and provincial and territorial reports, the most recent provincial and territorial report should be used because updated national data may still be pending.
Conclusion
Similar to annual changes that have been reported since 2014, the number and rate of reported HIV cases in Canada in 2017 increased slightly compared with 2016. Additional data and analysis are needed to determine why the numbers are increasing. PHAC will continue to work with its national partners to collect, analyze and disseminate HIV surveillance data to help clarify and explain these increases and to monitor progress toward reducing the burden of HIV infection in Canada.
Authors’ statement
NH — Conceptualization, writing, original draft, final draft, review, editing, validation, visualization
SL — Conceptualization, validation, visualization, review, editing
ST — Review, editing, supervision
MM — Review, editing, final draft.
Conflict of interest
None.
Contributors
The Public Health Agency of Canada would like to acknowledge the following individuals from the provincial and territorial HIV/AIDS programs for their contribution and participation:
Sumana Fathima, Alberta Health
Rosa Maheden, Alberta Health
Mariam Osman, Alberta Health
Clinical Prevention Service, Surveillance and Epidemiology, BC Centre for Disease Control
Carla Loeppky, Manitoba Health
Rita RaaFat Gad, New Brunswick Department of Health
Shelley Landsburg, New Brunswick Department of Health
Patricia Samms New Brunswick Department of Health
Sophie Wertz, New Brunswick Department of Health
Beth Halfyard, Health and Community Services, Population Health Branch, Newfoundland and Labrador
Heather Hannah, Department of Health and Social Services, Northwest Territories
Bev Billard, Nova Scotia Department of Health and Wellness
Sarah Fleming, Nova Scotia Department of Health and Wellness
Andrea Schertzer, Nunavut Department of Health
Sean Waites, Nunavut Department of Health
Abigail Kroch, Ontario Treatment Network
Juan Liu, Public Health Ontario
Alex Marchand-Austin, Public Health Ontario
Dr. Michelle Murti, Public Health Ontario
Andrea Saunders, Public Health Ontario
Michael Whelan, Public Health Ontario
Dr. Shamara Baidoobonso, Prince Edward Island Department of Health and Wellness
Stacey Burns, Prince Edward Island Department of Health and Wellness
Constance Cheverie, Prince Edward Island Department of Health and Wellness
Raphaël Bitera, Direction des risques biologiques et de la santé au travail, Institut national de santé publique du Québec
Micheline Fauvel, Laboratoire de santé publique du Québec, Institut national de santé publique du Québec
Maureen Hastie, Laboratoire de santé publique du Québec, Institut national de santé publique du Québec
Raymond Parent, Direction des risques biologiques et de la santé au travail, Institut national de santé publique du Québec
Bouchra Serhir, Laboratoire de santé publique du Québec, Institut national de santé publique du Québec
Diane Sylvain, Laboratoire de santé publique du Québec, Institut national de santé publique du Québec
Helen Bangura, Saskatchewan Ministry of Health
John Manalo, Saskatchewan Ministry of Health
Rachelle Wallace, Yukon Communicable Disease Control
Sabrina Plitt, Public Health Agency of Canada (Alberta)
Elsie Wong, Public Health Agency of Canada (British Columbia)
Jillian Waruk, Public Health Agency of Canada (Manitoba)
Ashleigh Sullivan, Public Health Agency of Canada (Ontario)
Tara Schellenberg, Public Health Agency of Canada (Saskatchewan)
Funding
This work was supported by the Public Health Agency of Canada as part of its core mandate.
Appendix: List of supplementary tables
These tables are available upon request at: phac.hass.aspc@canada.ca:
- Table S1
- HIV diagnosis rate (per 100,000 population) by province/territory and year of diagnosis (all ages)
- Table S2
- Number of HIV cases (all ages) by province/territory, sex and year of diagnosis—Canada, 1985–2017
- Table S3
- Number of HIV cases by age group and province/territory—Canada, 2016–2017
- Table S4
- Cumulative number of HIV cases among adults (≥15 years old) and children (<15 years old) by sex—Canada, 1985-2017
- Table S5
- Number of HIV cases among adults (≥15 years old) by year of diagnosis and sex—Canada, 1985-2017
- Table S6
- Number of HIV cases by age group, sex and year of diagnosis—Canada, 1985–2017
- Table S7
- Number and percentage distribution of HIV cases among adults (≥15 years old) by exposure category and year of diagnosis—Canada, 1985–2017
- Table S8
- Number and percentage distribution of HIV cases among adult males (≥15 years old) by exposure category and year of diagnosis—Canada, 1985–2017
- Table S9
- Number and percentage distribution of HIV cases among adult females (≥15 years old) by exposure category and year of diagnosis—Canada, 1985–2017
- Table S10
- Number and percentage distribution of HIV cases among adults (≥15 years old) by exposure category and age group—Canada, 2016–2017
- Table S11
- Number of HIV cases by exposure category and province/territory—Canada, 2016–2017
- Table S12
- Number and percentage distribution of HIV cases (all ages) by year of diagnosis and race/ethnicity— Canada, 1999–2017
- Table S13
- Number and percentage distribution of HIV cases among males (all ages) by year of diagnosis and race/ethnicity—Canada, 1999–2017
- Table S14
- Number and percentage distribution of HIV cases among females (all ages) by year of diagnosis and race/ethnicity—Canada, 1999–2017
- Table S15
- Number of HIV cases (all ages) by exposure category and race/ethnicity—Canada, 1999–2017
- Table S16
- Number and percentage distribution of migrants to Canada diagnosed with HIV as a result of an Immigration Medical Exam by year—2002–2017
- Table S17
- Number and percentage distribution of migrants to Canada diagnosed with HIV as a result of an Immigration Medical Exam by sex, age group and province—2002–2017
- Table S18
- Number of perinatally HIV-exposed infants by year of birth, current status and use of antiretroviral therapy for prophylaxis—Canada, 1984–2017
- Table S19
- Number of perinatally HIV-exposed infants by maternal exposure category and year of infant birth—Canada, 1984–2017
- Table S20
- Number of perinatally HIV-exposed infants by ethnic status and infection status—Canada, 1984–2017
- Table S21
- Number of perinatally HIV-exposed infants by maternal country of birth and infection status—Canada, 1984–2017
- Table S22
- Number of perinatally HIV-exposed infants by geographic region and status at last report—Canada, 1984–2017
- Table S23
- International statistics on reported HIV cases—Canada, 2016
- Table S24
- Rates of HIV cases by age group, sex and year of diagnosis—Canada, 2013–2017