
Archived - HIV screening and testing intervals in HIV-negative individuals

 Download this article as a PDF
Published by: The Public Health Agency of Canada
Issue: Volume 44-12: Adult immunization
Date published: December 6, 2018
ISSN: 1481-8531
Submit a manuscript
About CCDR
Browse
Volume 44-12, December 6, 2018: Adult immunization
Systematic review
Evidence for optimal HIV screening and testing intervals in HIV-negative individuals from various risk groups: A systematic review
K Timmerman1*, M Weekes2, G Traversy2, P Prabakhar3, T Austin1, S Ha1, B Anwar1
Affiliations
1 Centre for Communicable Diseases and Infection Control, Public Health Agency of Canada, Ottawa, ON
2 Centre for Chronic Disease Prevention and Health Equity, Public Health Agency of Canada, Ottawa, ON
3 Dalla Lana School of Public Health, University of Toronto, Toronto, ON
Correspondence
Suggested citation
Timmerman K, Weekes M, Traversy G, Prabakhar P, Austin T, Ha S, Anwar B. Evidence for optimal HIV screening and testing intervals in HIV-negative individuals from various risk groups: A systematic review. Can Commun Dis Rep 2018;44(12):337-47. https://doi.org/10.14745/ccdr.v44i12a05
Keywords: HIV screening, HIV testing intervals, men who have sex with men, sex workers, high risk populations
Abstract
Background: Human immunodeficiency virus (HIV) testing plays a crucial role in Canada’s HIV prevention and treatment efforts and is the first step to achieving the Joint United Nations Programme on HIV/AIDS (UNAIDS) 90-90-90 targets; however, how often Canadians, including populations at increased risk of HIV exposure, should be tested is unclear. We conducted a systematic literature review to determine the optimal HIV screening and testing intervals.
Objective: To examine the current evidence on HIV testing intervals in HIV-negative individuals from various risk groups and to assess the potential harms and patients’ values and preferences associated with different testing frequencies.
Methods: We searched MEDLINE/PubMed, Scopus, Embase, the Cochrane Library, PsychINFO and EconLit for studies on different frequencies of HIV testing published between January 2000 and September 2016. An additional search was conducted for grey literature published between January 2000 and October 2016. Data extraction included study characteristics, participants, exposure, outcomes and economic variables. The quality of the studies was assessed and results summarized.
Results: Of the 2,702 articles identified from the searches, 27 met the inclusion criteria for review. This included assessments of HIV testing intervals among the general population, men who have sex with men, people who use injection drugs and sex workers. Optimal testing intervals across risk groups ranged from one-time testing to every three months. Data from modelling studies may not be representative of the Canadian context. Few studies identified potential harms of increased screening, specifically an increase in both false positive and false negative results. There were only two studies that addressed patient values and preferences concerning HIV screening, which suggested that the majority of participants were amenable to routine screening through their primary care provider.
Conclusion: There was insufficient evidence to support optimal HIV screening and testing intervals for different populations. Context-specific factors, such as budget allocation, human resources, local epidemiology, socioeconomic factors and risk behaviours, along with clinical judgement, inform whom and how often to screen, suggesting the need for research specific to Canada. Research on patient preferences as well as the benefits and harms of more frequent screening are also indicated.
Introduction
Human immunodeficiency virus (HIV) screening is essential to HIV prevention and treatment efforts, as early detection allows people living with HIV to access appropriate care and treatment that can help improve their health and prevent onward transmission Footnote 1Footnote 2Footnote 3. For this reason, the Joint United Nations Programme on HIV/AIDS (UNAIDS) 90-90-90 global strategy ambitiously aims to have 90% of all people living with HIV diagnosed and 90% of those diagnosed consistently receiving antiretroviral therapy by 2020, with 90% of those receiving treatment achieving viral suppression Footnote 4. Canada has committed to achieving these targets.
In 2016, an estimated 14% of the 63,110 Canadians living with HIV were unaware of their infection Footnote 5. HIV infection is concentrated in specific sub-groups, such as men who have sex with men (MSM), persons who inject drugs (PWID) and Indigenous populations (accounting for 49.3%, 15.3% and 9.1% of people living with HIV in 2014, respectively) Footnote 6Footnote 7Footnote 8. The 2012 Public Health Agency of Canada’s HIV Screening and Testing Guide suggests that individuals involved in high risk practices should be screened for HIV infection at least annually Footnote 1. At the time of publication of this guide, insufficient evidence was available to provide recommendations on the optimal testing frequency for specific risk populations.
Evidence-informed guidance on testing frequencies for populations with distinct risk profiles may optimize and promote testing among healthcare providers; however, only one systematic review has been conducted on HIV screening and testing intervals specifically among MSM Footnote 9 and none has been published on other populations. To inform potential revisions to the HIV Screening and Testing Guide, we decided to conduct a systematic review to assess evidence for different HIV screening and testing intervals among various populations. Patient harms, values and preferences were also examined to understand whether increased HIV screening intervals would be feasible and acceptable in at risk populations.
The objectives of the systematic review were to examine and synthesize the current evidence on different HIV testing intervals in HIV-negative individuals from various risk groups, and, if possible, to include information on potential harms and patient values and preferences regarding screening intervals.
Methods
The systematic review was conducted in accordance with the Preferred Reporting Items for Systematic Review and Meta-Analyses (PRISMA) statement Footnote 10. It follows a peer-reviewed a priori protocol registered with the International Prospective Register of Systematic Reviews (PROSPERO; registration number CRD42016046575) and published in the Canada Communicable Disease Report Footnote 11Footnote 12. Some amendments to the protocol were made following publication (primarily related to quality assessment) and are reflected in the revised PROSPERO entry.
Search strategy
A comprehensive search strategy was developed with the assistance of a Health Canada research librarian and peer-reviewed by an external research librarian prior to execution. The full search strategy is available in the previously published protocol Footnote 12.
We searched the MEDLINE/PubMed, Scopus, Embase, Cochrane Library, PsycINFO and EconLit databases, as well as Open Grey, ClinicalTrials.gov and relevant sources from the CADTH Grey Matters checklist Footnote 13. Searches were conducted for quantitative and qualitative studies published in English and French between January 2000 and September 2016. A search for grey literature for reports published between January 2000 and October 2016. Studies were eligible for inclusion if they investigated the frequency of HIV screening and testing among persons of unknown or previously-confirmed negative serostatus. Case studies, narrative summaries and commentaries were excluded. There were no restrictions on the country of study.
Study selection, data collection and quality assessment
Two reviewers (MW and PB) independently performed title/abstract and full-text screening using standardized, piloted forms on the systematic review software, DistillerSR (Evidence Partners Incorporated, Ottawa, ON). Disagreements were resolved by a third reviewer (KT or GT).
Data extraction was carried out by one reviewer (PB) and quality assessments were completed by two reviewers (MW and PB). Data extraction was verified by two reviewers (TA and SH) and disagreements were resolved by a third reviewer (KT). Data extraction included the following: study characteristics (e.g., study design, setting); type of participants (e.g., risk group); exposure (e.g., testing intervals being compared, type of HIV test used); outcomes (e.g., number of new HIV diagnoses, average CD4 cell count and/or viral load at diagnosis, number of new HIV diagnoses, and change in number/percent of individuals with undiagnosed HIV infection); and economic variables (e.g., time horizon, currency) as appropriate. The quality of the descriptive studies was assessed using the Public Health Agency of Canada’s Infection Prevention and Control Guidelines: Critical Appraisal Tool Kit Footnote 14Footnote 15. The quality of the economic modelling studies was assessed using a unique checklist that combined key items from the British Medical Journal checklist for economic evaluations and the Eddy checklist on mathematical models Footnote 16Footnote 17. These quality appraisal tools were selected in light of the systematic review findings and were judged appropriate for the types of studies identified Footnote 13. Although we intended to use the GRADE methodology to rate the certainty of evidence, the majority of the studies included in this review were modelling studies so it was not feasible to apply GRADE. In addition, the wide range of assumptions and inputs in the modelling studies lead to heterogeneity of findings, so meta-analysis was also not possible. For these reasons, we summarized the conclusions of the studies regarding the optimal testing frequency. For details on the protocol amendment, refer to the PROSPERO record Footnote 11. As a priori, we qualitatively summarized outcomes on patient harms, values and preferences to represent the descriptive nature of the data.
Results
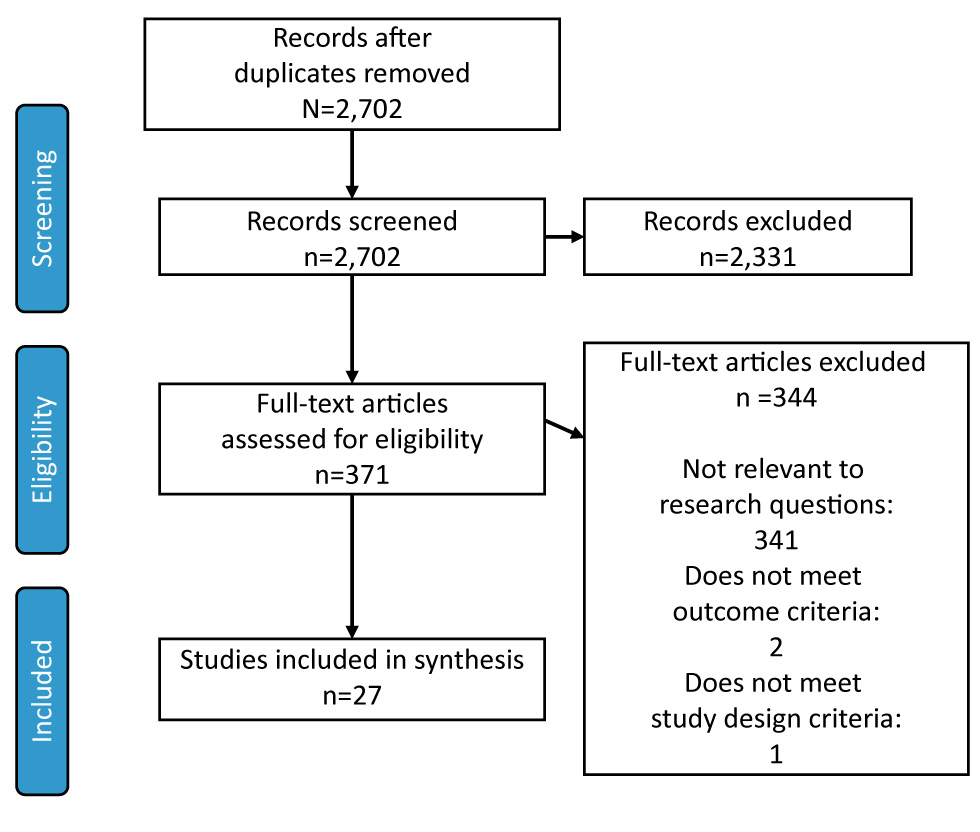
The literature search initially identified 2,702 articles (after the removal of duplicates), of which 27 met the systematic review inclusion criteria (Figure 1). A total of 344 studies were excluded after full-text review; mostly because they did not concern the topic of the systematic review (n=341). Two additional studies did not meet the outcome criteria and one study did not meet the study design criteria.
Figure 1: PRISMA flow chart
Text description: Figure 1
Figure 1: PRISMA flow chart
Figure 1 depicts a flowchart showing the selection of the records used for the systematic review. The image begins with the screening portion: The first two boxes begin with the total number of records after the duplicate studies were removed and screened (N=2,702). The box directly to the right shows the number of records which were excluded (N=2,331). The eligibility process then begins, indicating the number of full-text articles assessed for eligibility (n=371). The box to the right of the eligibility assessment presents the number full-text articles excluded (n=344), as well as a breakdown of the 344 excluded articles. 341 articles were excluded due to being “not relevant to the research questions”. Two articles were excluded due to “does not meet outcome criteria”. One article was excluded due to “does not meet study design criteria”. The final box of the flowchart is labeled “Included”, and show the final number of studies included in the synthesis (n=27).
The majority of the evidence came from 20 modelling studies Footnote 18Footnote 19Footnote 20Footnote 21Footnote 22Footnote 23Footnote 24Footnote 25Footnote 26Footnote 27Footnote 28Footnote 29Footnote 30Footnote 31Footnote 32Footnote 33Footnote 34Footnote 35Footnote 36Footnote 37. There was one descriptive study Footnote 38; three non-economic modelling studies Footnote 39Footnote 40Footnote 41; one cohort study Footnote 42; one cross-sectional study Footnote 43; and one mixed-methods study (descriptive and modelling) Footnote 44. The included studies were conducted in various countries, including 14 in the United States (US), three in Australia and two in the United Kingdom (UK). Third and fourth generation enzyme-linked immunosorbent assays (ELISA) were the most commonly-used tests in the studies.
Optimal HIV testing frequency by population group
General population
Thirteen studies, all of which were cost-effectiveness models, addressed optimal testing frequencies in the general population considered at low risk for HIV, with incidence ranging from 0.0084% to 4% per year Footnote 20Footnote 23Footnote 24Footnote 26Footnote 27Footnote 20Footnote 29Footnote 30Footnote 32Footnote 33Footnote 34Footnote 36Footnote 37. Recommended testing frequencies ranged from a one-time test to annual testing, with the largest proportion (n=5) advocating for a one-time test Footnote 23Footnote 24Footnote 30Footnote 36Footnote 37.
Sanders et al. proposed an economic model set in the US Footnote 30. They concluded that routine screening would be cost-effective if the prevalence of undiagnosed HIV infection were as low as 0.05%. Similarly, Long et al. reported that one-time screening of low risk populations coupled with annual screening of high risk populations would result in a low incremental cost-effectiveness ratio (ICER) and 2,555 HIV infections averted over 10 years Footnote 24. They concluded that one-time screening was the optimal testing frequency for a population with an HIV prevalence of 0.033% rather than the status quo of targeted risk-based testing Footnote 24. Special consideration was placed on the other variables that affect screening effectiveness, such as reduction in risk behaviors, with authors stating that the ICERs and HIV infections averted were contingent upon concurrent reduction of overall risk behaviors by 25%, even amongst low risk populations.
Nine studies were considered to be of high quality Footnote 23Footnote 24Footnote 26Footnote 27Footnote 28Footnote 29Footnote 30Footnote 32Footnote 37, with thorough backgrounds and rationales, robust methods and data collection procedures, and strong justifications for the analysis plans. In addition, one study was deemed moderate/high quality Footnote 25, two studies were considered moderate quality Footnote 23Footnote 34 and one was low/moderate quality Footnote 20. Of the studies that were assessed as low/moderate quality, some variables (e.g., discount rates) were not reported and some studies did not provide justification for the selection of variables.
Men who have sex with men
The search identified 14 studies that addressed the optimal HIV screening interval among MSM. Eight studies were economic modelling studies Footnote 19Footnote 20Footnote 22Footnote 23Footnote 24Footnote 25Footnote 32Footnote 37 and five were modelling studies without economic inputs Footnote 38Footnote 40Footnote 41Footnote 42Footnote 44. Recommended testing frequencies ranged from one-time only, to annually and to once every three months.
In the economic modelling studies from France and the UK Footnote 23Footnote 37, screening one-time and/or annually was found to be cost-effective. Among MSM in France (incidence: 0.99%/person-year), one-time screening was the most cost-effective strategy compared with risk-based screening; annual screening was also considered cost-effective in this population with a lower ICER Footnote 37.
Among the modelling studies on MSM, the majority (n=8) were assessed as high quality Footnote 19Footnote 22Footnote 24Footnote 26Footnote 32Footnote 36Footnote 37Footnote 44. Three studies were rated as moderate quality Footnote 23Footnote 40Footnote 41 and one was low/moderate quality Footnote 20. Modelling studies that scored low/moderate quality did not provide strong rationales for the background and analysis. The study by Baker et al. reported the only descriptive study and it received only a moderate score due to the lack of generalizability to the target population, data collection sources and methods used, analysis plan and strength of study design Footnote 38.
People who inject drugs
Nine economic modelling studies Footnote 18Footnote 19Footnote 22Footnote 23Footnote 24Footnote 25Footnote 32Footnote 36Footnote 37 investigated the cost-effectiveness of HIV testing intervals among PWID. The majority of studies (n=6) stated that annual screening of PWID (usually coupled with less frequent screening of the general population) was economically justifiable Footnote 22Footnote 23Footnote 24Footnote 32Footnote 36Footnote 37. Of note, Yazdanpanah et al. found that one-time, every three years, every five years and annual screenings of PWID were comparably cost-effective screening strategies in France (incidence: 0.17%/person-year) Footnote 36Footnote 37; however, three US studies recommended semi-annual testing versus annual testing Footnote 18Footnote 19Footnote 25.
Among the studies with PWID, seven studies were rated as high quality Footnote 18Footnote 19Footnote 22Footnote 24Footnote 32Footnote 36Footnote 37. In addition, one study was rated as moderate/high quality Footnote 25 and one as moderate quality Footnote 23; these two studies scored moderate quality due to the strength of the rationale and lack of clarity around the data collection methods.
Sex workers
Four of the included studies discussed the optimal frequency of HIV testing among sex workers operating in various settings Footnote 21Footnote 22Footnote 32Footnote 35. Kaplan and Satten Footnote 21 explored HIV screening intervals among legal commercial sex workers using mathematical modelling and found the optimal screening frequency is every month when the annual cost of infection is $360,000. Another study assessed HIV testing intervals among sex workers in jurisdictions where sex work was legal Footnote 35. The cost-effectiveness analysis of HIV testing intervals of legal commercial sex workers in Victoria, Australia (incidence rate of 0.1% HIV cases per person-year) concluded that implementing the current approach (testing once every three months) costs over $4,000,000 AUD for every HIV infection averted Footnote 35 and for HIV testing to be cost-effective among these Australian sex workers, there should be at least 42 weeks between HIV tests. Moreover, Wilson et al. found that decreasing the frequency of testing to once a year did not greatly impact the likelihood of transmission, as the expected number of HIV cases remained less than one Footnote 35. Studies set in China Footnote 22 and India Footnote 32 also concluded that annual testing would be the most cost-effective testing interval for sex workers.
These four studies varied in quality: two were assessed as high quality Footnote 22Footnote 32, one as moderate quality Footnote 35 and one as low quality Footnote 21. The two studies that received moderate and low ratings scored low in multiple domains (e.g., data collection, analysis and results) due to lack of details around price adjustments or currency conversions and clarity around justification of variables used.
Table 1 summarizes the economic modelling studies on optimal HIV testing and their quality scores.
| First author, year (ref) |
Population | Model input parameters; HIV prevalence/ incidence | Testing frequencies considered | Optimal HIV screening frequency (conclusion) |
|---|---|---|---|---|
| HIGH QUALITY | ||||
| Cipriano, 2012 Footnote 18 | PWID | Prevalence: Overall: 0.47% PWID: 6.5% |
Ab test with or without confirmatory RNA testing:
|
Using Ab test and confirmatory RNA screening, testing once upon entry to ORT program and every six months among those in the ORT program was most cost-effective |
| Gray, 2013 Footnote 44 | MSM | N/A | Testing frequencies:
|
Increasing HIV testing frequency results in a 13.8% reduction in HIV infections (or 208.7 infections averted) over 10 years if the 55–75% of men who test at least annually start testing every three months |
| Hutchinson, 2016 Footnote 19 |
MSM, PWID | Prevalence: MSM: 1.27% PWID: 0.62% |
Ag/Ab or rapid test:
|
Testing every three or six months using either an Ag/Ab or rapid test is cost-effective for MSM. Testing greater than annually using an Ag/Ab test is cost-effective for PWID |
| Li, 2012 Footnote 22 | MSM, PWID, sex workers, clients of sex workers, low-risk women | Prevalence: Male PWID: 9.3% Female PWID: 9.3% MSM: 5% Female sex workers: 0.6% Clients of female sex workers: 0.4% Low-risk men: 0.025% Low-risk women: 0.025% |
Ab testing/confirmatory western blot:
|
Low-risk groups: one-time screening High-risk groups: annually |
| Long, 2010 Footnote 24 |
MSM, PWID, general population | Prevalence: MSM:12.6% MSM/PWID:18.8% Male PWID: 12.9% Female PWID: 17.3% Low-risk men: 0.10% Low-risk women: 0.22% |
ELISA and confirmatory western blot:
|
One-time HIV screening of low-risk individuals coupled with annual screening of high-risk individuals |
| Lucas, 2013 Footnote 26 |
General population | Incidence: Low-risk: 0.01%/year Medium-risk: 0.1%/year High-risk: 1%/year |
Ab tests over varied HIV screening intervals (from 0–8 years) | Low risk groups: Every 2.4 years;, Moderate-risk groups: every nine months; High risk groups: every three months |
| Martin, 2010 Footnote 27 |
General population | Incidence: 0.09%/year | ELISA or rapid test:
|
Testing every 10 years is more cost-effective than an expanded HIV screening program (testing every five years) |
| Paltiel, 2005 Footnote 29 |
General population, high-risk | Incidence: High-risk: 1.20%/year CDC threshold population: 0.12%/year General population: 0.01%/year |
Testing intervals:
|
Screening every 3–5 years is cost-effective among “all but the lowest-risk populations” |
| Paltiel, 2006 Footnote 28 |
General population | Incidence: Baseline population: 1.0%/year US general population: 0.10%/year Low-risk population: 0.0084%/year |
Rapid test:
|
One-time screening is the most cost-effective in all settings where the HIV prevalence was <0.20% |
| Sanders, 2005 Footnote 30 | General population | Incidence: 0.03%/year | ELISA and confirmatory western blot:
|
One-time screening is the most cost-effective strategy in a population with a 1% prevalence of unidentified HIV infections. Screening every five years may be more appropriate in settings with high infection incidences |
| Soorapanth, 2006 Footnote 31 |
Infants | Prevalence among pregnant women: 29.5% Incidence during pregnancy: 2.3%/year |
Rapid test:
|
The minimum time interval between the initial and repeat screens should be from three to 18 weeks, depending on prophylactic and treatment regimens, for HIV rescreening to be cost saving |
| Venkatesh, 2013 Footnote 32 | MSM, PWID, general population, migrants from HIV + country, sex workers |
National population: Prevalence: 0.29% Incidence: 0.032%/year High prevalence districts: Prevalence: 0.8% Incidence: 0.088%/year High-risk groups: Prevalence: 5.0% Incidence: 0.552%/year |
Testing intervals:
|
Screening the national population every five years and people in high-risk groups and high prevalence districts annually is cost-effective |
| Walensky, 2011 Footnote 33 | General population | Prevalence: 16.9% Incidence: 1.3%/year |
Rapid test:
|
Annual testing is the most cost-effective strategy |
| Yazdanpanah, 2010 Footnote 37 |
MSM, PWID, general population | Incidence: General population: 0.01%/year PWID: 0.17%/year French Guyana: 0.35%/year MSM: 0.99%/year Heterosexual population: 0.01%/year |
ELISA:
|
One-time screening is recommended in addition to risk-based screening; however, more frequent screening in higher-risk subpopulations is justified |
| Yazdanpanah, 2013 Footnote 36 | MSM, PWID, general population | Incidence: National population: 0.03%/year PWID: 1.08%/year MSM: 0.43%/year |
Rapid test:
|
One-time screening is recommended in addition to risk-based screening; however, more frequent screening in higher-risk subpopulations is justified |
| MODERATE QUALITY | ||||
| Baker, 2013 Footnote 38 | MSM | N/A | Testing intervals:
|
Screening high risk groups every three months is associated with an increase in the potential for earlier HIV diagnoses |
| Brown, 2008 Footnote 39 |
Infants | N/A | Comparing assays at three, six, nine, and 12 months of age to the current practice of assays at birth, at 4–8 weeks, 15–18 months of age | Testing one month after weaning or 12 months of age (whichever comes first), identified 81% of those infected during the late postnatal period (after 4–8 weeks) through breastfeeding HIV-1 diagnostic testing should be performed at 4–8 weeks of age to capture early HIV-1 transmission, AND at the first of one month after weaning or 12 months of age to capture late postnatal transmission |
| Delaney, 2015 Footnote 40 | MSM | N/A | Testing intervals:
|
Current practice (testing “almost annually”) is sufficient |
| Katz, 2014 Footnote 41 |
MSM | N/A | Home-based testing
|
Home-based testing resulted in increased HIV testing and HIV prevalence |
| Long, 2011 Footnote 25 | MSM, PWID, low-risk | Prevalence: Male PWID: 12.9% MSM: 12.6% MSM/PWID: 18.8% Male other: 0.10% Female PWID: 17.3% Female other: 0.22% |
Ag/Ab or Ab test (alone or with pooled NAAT):
|
Testing every six months using the Ag/Ab test is more cost-effective than annual pooled NAAT screening |
| Long, 2014 Footnote 23 |
MSM, PWID, general population, migrants from HIV + country | Prevalence: Men from endemic countries: 2.5% Women from endemic countries: 5.0% PWID: 1.2% MSM: 5.0% Male other: 0.033% Female other: 0.033% |
Testing intervals:
|
High-risk groups: annual testing Low-risk groups: one-time |
| Waters, 2011 Footnote 34 | General population | Incidence: 0.8, 1.3, or 4.0%/year | Testing intervals:
|
“Accounting for secondary infections averted, the most cost-effective testing frequency was every 7.5 years for 0.8% incidence, every 5 years for 1.3% incidence, and every two years for 4.0% incidence” |
| Wilkinson, 2015 Footnote 42 | Sex workers | Incidence: 0.1%/year | ELISA over varied HIV screening intervals (from 0–55 weeks)
|
“At an assumed willingness to pay of $50 000 AUS per QALY gained, HIV testing should not be conducted less than approximately every 40 weeks […]” |
| Wilson, 2010 Footnote 35 |
Sex workers | Incidence: 0.1%/year | ELISA over varied HIV screening intervals (from 0–55 weeks)
|
“At an assumed willingness to pay of $50 000 AUS per QALY gained, HIV testing should not be conducted less than approximately every 40 weeks […]” |
| LOWER QUALITY | ||||
| Hutchinson, 2010 Footnote 20 | General population, MSM, high risk | Prevalence:1.0-1.8% Incidence: 0.01-0.21%/year |
Ab or rapid test with NAAT:
|
“NAAT screening was cost-effective in targeted to settings with very high HIV incidence, such as the community clinic, where it remained cost-effective compared with retesting for HIV antibody as often as every three months” |
| Kaplan, 2000 Footnote 21 |
Sex workers, active duty soldiers | Incidence: Sex workers: 0.004/year Soldiers: 0.0003/year |
ELISA over varied HIV screening intervals (from 0–4 months) | Sex workers: every month when the annual cost of infection is $360,000. Soldiers: every 1.4 years when the annual cost of infection is $8,570 |
Potential harms, patient values and preferences
Two studies identified the potential harms associated with HIV screening intervals Footnote 23Footnote 24. Both studies found that the implementation of more frequent screening (within the general population, MSM, PWID and migrants from HIV-endemic country population groups) resulted in an increase in the number of false positive and negative results. However, it was reported that the number of false positive/negative results decreased as fewer people remain undiagnosed Footnote 23Footnote 24. No studies reported on the other outcomes of interest for harms (e.g., psychosocial harms, stigmatization, etc.). One study was assessed as high quality Footnote 24 and the other was assessed as moderate quality Footnote 23 due to a lack of specificity and reporting of the rationale data collection and method of analysis.
Two studies examined patients’ values and preferences associated with HIV testing intervals Footnote 43Footnote 44. In an Australian study, the authors surveyed self-identified MSM living in New South Wales and found that 25% were “very likely” to accept more frequent (i.e., every three months) HIV testing Footnote 44. The setting of the second study was in American primary care clinics in underserved and low-income neighbourhoods. The authors reported that 86% of African American and Latino respondents value HIV testing on a regular basis, with 77% of respondents expressing interest in annual or semi-annual testing and 80% of respondents indicating a preference to have the HIV test performed by their primary care provider rather than an HIV-specific counsellor. One was assessed as moderate quality Footnote 44 and the other assessed with a lower quality Footnote 43 due to concerns about the data collection methods.
Table 2 summarizes the findings from descriptive studies of optimal HIV testing frequency and related findings.
| First author, year | Population | Objective | Potential harms, patient values and preferences | Rating |
|---|---|---|---|---|
| Gray, 2013 Footnote 44 | MSM | Assess whether increases in HIV testing would be acceptable to gay men in New South Wales and model the potential impact of increases in testing coverage and/or frequency | Increasing HIV testing would be acceptable if testing was more convenient. Only 25% of men surveyed were ‘very likely’ to increase their level of HIV testing |
High |
| Long, 2010 Footnote 24 | MSM, PWID, general population | To evaluate the effects of expanded ART, HIV screening, or interventions to reduce risk behavior | Annual screening in high risk populations and one-time screening in the general population will result in false-positive and false-negative diagnoses. These will decrease over 20 years | High |
| Long, 2014 Footnote 23 | MSM, PWID, general population, migrants from HIV endemic countries | Estimate the effectiveness and cost-effectiveness of HIV testing in the United Kingdom | False-positives and false-negatives would occur with annual high-risk screening and one-time low risk screening. Over time, the occurrences will decrease | Mod |
| Simmons, 2005 Footnote 43 | General population (African Americans and Latinos) | Determine the attitudes of patients who attend urban primary-care clinics towards HIV testing | 77% of study participants said that they wanted to be tested annually or semi-annually for HIV. Participants also indicated their desire to be tested for HIV routinely by their primary care provider, as opposed to an HIV counsellor |
Low |
Discussion
This systematic review of 27 studies found there was insufficient high quality evidence and a lack of consistency in the findings to identify an optimal HIV testing interval for specific risk populations. Optimal screening and testing frequencies ranged widely from once in a lifetime for the general population to every three months for high-risk populations, depending on the type of study and the population studied. There were only two studies addressing potential harms that identified the risk of false positives or negatives. In addition, there were limited data on patients’ values and preferences, although it appeared in high risk groups that more frequent testing would be acceptable.
The results of our systematic review are consistent with those of a recent review conducted by the Centers for Disease Control and Prevention (CDC) on HIV screening for gay, bisexual and other MSM. The CDC concluded that the evidence, programmatic experiences and expert opinions did not warrant changing the recommendations for HIV testing in MSM from once per year to more frequent intervals.
Strengths and limitations
This is the first review to assess HIV screening and testing intervals in risk populations other than MSM and to summarize potential harms and patient preferences. Other strengths of this study include the comprehensiveness of the review, the robustness of the search strategy and the systematic nature of the analysis.
There are some limitations to consider. Although this study included 20 modelling studies, they were difficult to interpret for a Canadian population. Although some of the studies had an overall high quality and modelling studies may be useful for supporting the development of clinical guidelines in the absence of experimental evidence Footnote 45, the modelling studies examined included numerous assumptions that were not directly applicable to Canada. In addition, there was an absence of studies for other high-risk groups, such as Indigenous and incarcerated populations Footnote 6Footnote 7Footnote 8 and very little data on patients’ values and preferences. In all the studies, it was difficult to control for context-specific factors such as budget allocation, human resources, local epidemiology and socioeconomic factors.
Conclusion
Determining the optimal screening intervals for HIV in different risk populations is challenging due to the paucity of applicable, consistent, high quality evidence. In light of the inconsistency of findings and the limitations of modelling studies, population-based experimental studies could be done for different risk populations and Canadian-specific modelling studies may be helpful.
Authors’ statement
KT – Conceptualisation, methodology, investigation, writing – review and editing, supervision, project administration
MW – Investigation, writing – original draft, writing – review and editing, visualisation
GT – Conceptualisation, methodology, investigation, writing – review and editing
PP – Investigation, writing – original draft, writing – review and editing, visualisation
TA - Conceptualisation, methodology, investigation, writing – reviewing and editing
SH – Conceptualisation, methodology, writing – review and editing
BA – Investigation, writing – review and editing
Conflict of interest
None.
Acknowledgements
We would like to thank our contributors – Jessica Yau, Kelsey Young, Cornelia Tang, and Dina Salama – as well as Jun Wu and Margaret Gale-Rowe for their constructive review and feedback on the draft manuscript. We would also like to thank the research librarians, Connie Barrowclough and Katherine Merucci, who helped design and carry out our systematic search, and Margaret Sampson for peer-reviewing the search strategy.
Funding
The authors declare no competing interests. The research was supported by the Public Health Agency of Canada.