
Archived - Chlamydia 2010–2015

 Download this article as a PDF
 Published by: The Public Health Agency of Canada
Issue: Volume 44-2: Sexually transmitted infections
Date published: February 1, 2018
ISSN: 1481-8531
Submit a manuscript
About CCDR
Browse
Volume 44-2, February 1, 2018 Sexually transmitted infections
Surveillance
Chlamydia in Canada, 2010–2015
Y Choudhri1, J Miller1, J Sandhu1, A Leon1, J Aho1*
Affiliations
1 Centre for Emergency Preparedness and Response, Public Health Agency of Canada, Ottawa, ON
Correspondence
Suggested citation
Choudhri Y, Miller J, Sandhu J, Leon A, Aho J. Chlamydia in Canada, 2010–2015. Can Commun Dis Rep. 2018;44(2):49-54. https://doi.org/10.14745/ccdr.v44i02a03
Abstract
Background: Chlamydia is the most commonly reported notifiable sexually transmitted infection in Canada. Rates have been steadily increasing since 1997.
Objective: To summarize trends in chlamydia rates for the period 2010–2015 in Canada.
Methods: Laboratory-confirmed cases of chlamydia were reported to the Public Health Agency of Canada by all the Canadian provinces and territories. The overall national rate was computed, as were rates per sex, age group and province/territory.
Results: In 2015, a total of 116,499 cases of chlamydia were reported in Canada, corresponding to a rate of 325 cases per 100,000 population. Females accounted for the majority (two-thirds) of chlamydia infections from 2010 to 2015. However, rates among males rose faster during this time period. Youth and young adults aged 15–29 years had the highest rates in 2015. While increased rates were observed over time for most age groups, adults aged 40 years and older had the greatest increase (51%) between 2010 and 2015. Chlamydia rates increased in most provinces during this period, with the highest rates being reported by the Northwest Territories and Nunavut in 2015.
Conclusion: Between 2010 and 2015, chlamydia rates increased by 16.7% and were highest among females and young adults. Although a number of factors may account for this rising trend, the possibility of a true increase in incidence cannot be ruled out. Ongoing monitoring of chlamydia and research into the reasons for the observed changes will help guide sexually transmitted infection (STI) prevention and control activities.
Introduction
Chlamydia, caused by the bacterium Chlamydia trachomatis, is the most commonly reported sexually transmitted infection (STI) in Canada. In 2012, there were an estimated 131 million new cases of chlamydia globally, making it one of the most common STIsFootnote 1. If left untreated, chlamydia can lead to reactive arthritis in both sexes, as well as infertility, pelvic inflammatory disease, chronic pelvic pain and ectopic pregnancy in females and epididymo-orchitis in malesFootnote 2. Mother-to-child transmission can occur at birth, resulting in pneumonia or conjunctivitis in newbornsFootnote 2. In addition, chlamydia increases the infectiousness of and susceptibility to HIV by increasing the number of HIV target cells in the genital tract and amplifying HIV shedding (an infected cell releases viral particles, which in turn can infect new cells)Footnote 3Footnote 4.
The number of cases of chlamydia has risen steadily since 1997 in most jurisdictionsFootnote 2Footnote 5. Aside from the use of more sensitive detection methods, this increase in the number of reported cases may be due to a real increase in incidence due to active transmissionFootnote 2. In fact, many infected individuals are unaware of their status because of the asymptomatic nature of chlamydia. This can leave infections undiagnosed and untreated, helping to spread chlamydia among sexually active individuals. According to the 2009–2011 Canadian Health Measures Survey, the overall prevalence of chlamydial infection in the urine of Canadians aged 14–59 years was 0.7%Footnote 6. However, none of the respondents who tested positive for chlamydia reported being diagnosed with an STI.
The prevalence of chlamydia can be much higher in certain populations. A prevalence of chlamydia of 11.6% was reported in an Indigenous community in NunavutFootnote 7 whereas it was 8.6% among urban Canadian street youthFootnote 8. Traditional approaches such as case-by-case partner notification seem to have produced mixed results in this largely asymptomatic disease, failing to curb the incidence of the infection.
The objective of this article is to summarize observed trends in chlamydia rates across Canada in the period 2010–2015.
Methods
Data sources
Chlamydia has been nationally notifiable since 1991. Provincial and territorial health authorities provide non-nominal data on laboratory-confirmed cases to the Public Health Agency of Canada (PHAC) through the Canadian Notifiable Disease Surveillance System (CNDSS)Footnote 9. Confirmed case definitions include lymphogranuloma venereum serovars, and are shown in the AppendixFootnote 10.
Variables submitted along with the diagnosis include age at time of diagnosis, year of diagnosis, province/territory of diagnosis and sex. The received data are validated in collaboration with the corresponding province or territory. Data from January 1, 2010 to December 31, 2015 were available from all provinces and territories and were extracted from the CNDSS in July 2017.
Data analysis
Descriptive analysis was performed using Microsoft Excel. National annual rates of reported cases were computed using the number of cases from the CNDSS as numerators, and Statistics Canada yearly population estimates as denominators. Age group, sex and province/territory-specific rates were also calculated. For all years, rates were given per 100,000 population. No statistical procedures were used for comparative analyses. Small numbers are more susceptible to change so corresponding rates should be interpreted with caution. Previous reports may present different rates for some years due to reporting delays and data updating from provinces and territories.
Results
Between 2010 and 2015, the number of reported chlamydia cases increased steadily, from 94,719 to 116,499. The corresponding overall rate in 2015 was 325.0 cases per 100,000 population, an increase of 16.7% from 2010.
Sex and age
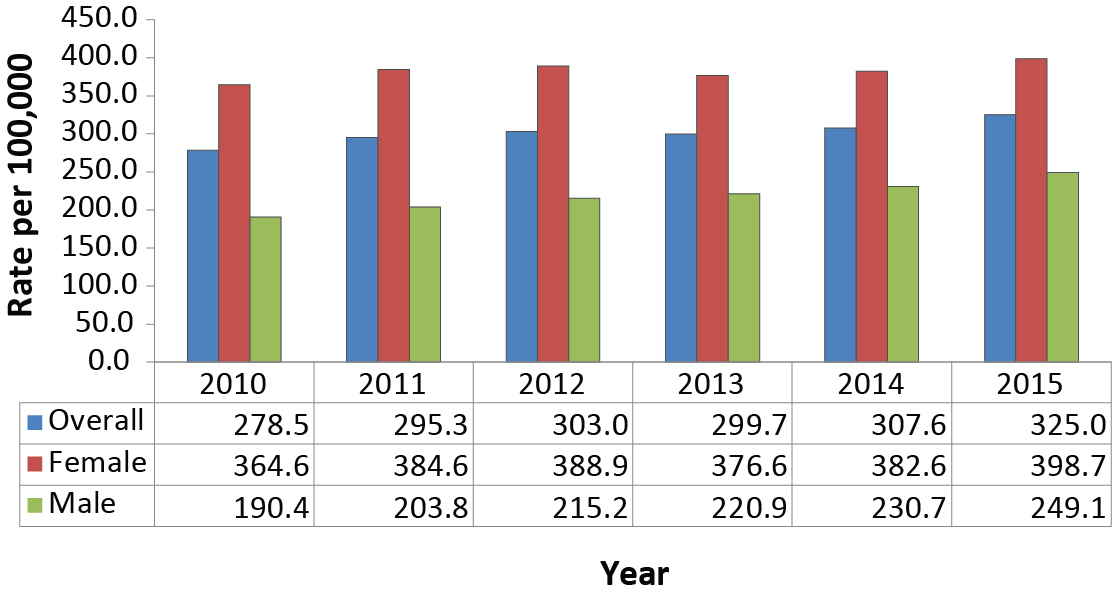
Although the rate among females was consistently higher than the rate among males during the surveillance period, the rate among males rose at a faster pace. From 2010 to 2015, the rate of chlamydia infection among males increased 30.8% (from 190.4 to 249.1 cases per 100,000) and 9.3% among females (from 364.6 to 398.6 per 100,000) (Figure 1).
Figure 1: Overall Figure 1 footnote a and sex-specific rates of reported laboratory-confirmed chlamydia cases, 2010–2015, Canada
Text description: Figure 1
Figure 1: Overall Figure 1 footnote a and sex-specific rates of reported laboratory-confirmed chlamydia cases, 2010–2015, Canada
| Year | 2010 | 2011 | 2012 | 2013 | 2014 | 2015 |
|---|---|---|---|---|---|---|
| Overall | 278.5 | 295.3 | 303.0 | 299.7 | 307.6 | 325.0 |
| Female | 364.6 | 384.6 | 388.9 | 376.6 | 382.6 | 398.7 |
| Male | 190.4 | 203.8 | 215.2 | 220.9 | 230.7 | 249.1 |
From 2010 to 2015, the only decrease in the reported rate of chlamydia was among children aged 10 years or younger, from 1.01 to 0.77 per 100,000 (−23.7%). In contrast, adults 60 years and older had the highest increase in rates, at 51.9% (from 4.2 to 6.3 cases per 100,000) and those aged 40–59 years and 30–39 years were the next highest, at 51.0% and 40.9% (from 49.0 to 74.0 cases per 100,000 and from 263.6 to 371.3 cases per 100,000, respectively). Although the increases in rates were greatest in the oldest cohorts, those aged 60 plus years had one of lowest absolute infection rates (6.3 per 100,000) in 2015.
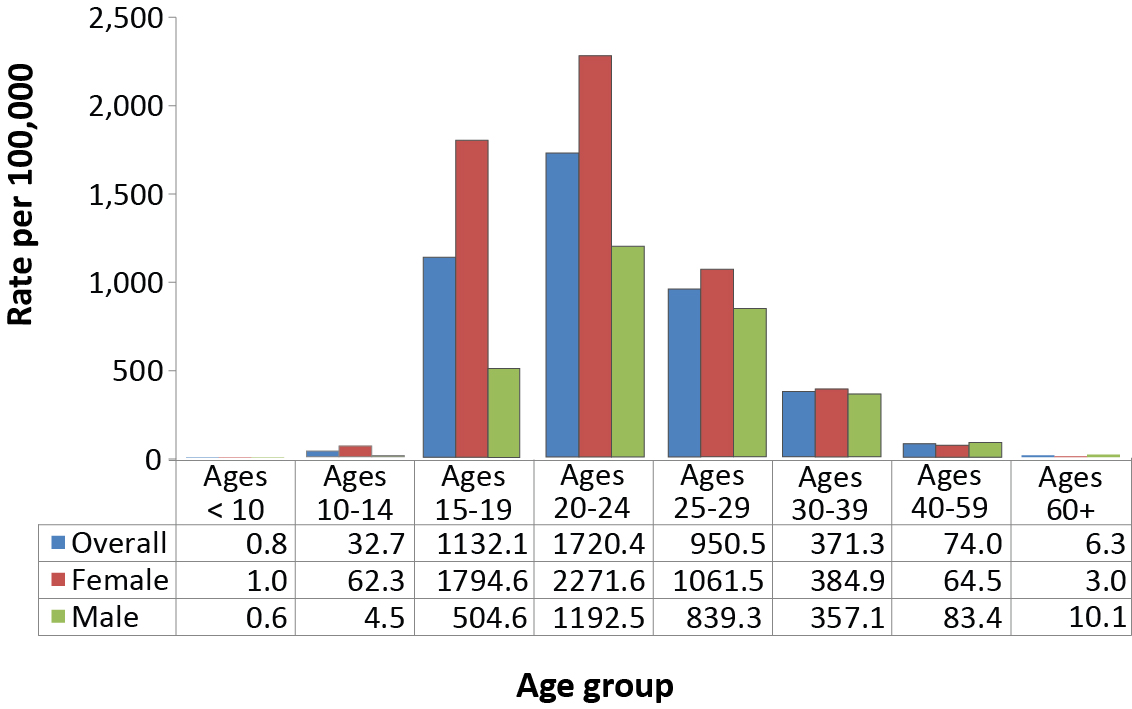
In 2015, the 20–24 year age cohort had the highest chlamydia infection rate at 1,720.4 per 100,000; both men and women showed a peak in this age group (Figure 2). The next highest rate was in the 15–19 and 25–29 year age cohorts (1,132.1 per 100,000 and 950.5 per 100,000, respectively). Youth and young adults aged 15–24 years represented 56.8% of all reported chlamydia cases in 2015 although they accounted for only 12.6% of the overall population.
Men and women aged 20 years and older showed increasing infection rates over time for all age groups, and the relative increases were higher for men (data not shown). Among adolescents aged 10–14 years in the period from 2010 to 2015, there was a 20.7% decrease in chlamydia rates among boys and a 9.6% increase among girls. The trend was reversed for the 15–19 year age group, with rates decreasing by 0.5% for girls between 2010 and 2015 and increasing by 19.5% among boys.
Figure 2: Rates of reported laboratory-confirmed chlamydia by sex and by age group, 2015, Canada
Text description: Figure 2
Figure 2: Rates of reported laboratory-confirmed chlamydia by sex and by age group, 2015, Canada
| Age group | < 10 | 10-14 | 15-19 | 20-24 | 25-29 | 30-39 | 40-59 | ≥60 |
|---|---|---|---|---|---|---|---|---|
| Overall | 0.8 | 32.7 | 1132.1 | 1720.4 | 950.5 | 371.3 | 74.0 | 6.3 |
| Female | 1.0 | 62.3 | 1794.6 | 2271.6 | 1061.5 | 384.9 | 64.5 | 3.0 |
| Male | 0.6 | 4.5 | 504.6 | 1192.5 | 839.3 | 357.1 | 83.4 | 10.1 |
Geographic distribution
The majority of provinces and territories showed an increase in the number of chlamydia cases and rates over the 2010 to 2015 period (Table 1). However, the two jurisdictions with the highest rates (Northwest Territories and Nunavut) both showed slightly decreasing trends over this period.
| Province or territory | Laboratory-confirmed cases by year of diagnosis (rate per 100,000) | |||||
|---|---|---|---|---|---|---|
| 2010 | 2011 | 2012 | 2013 | 2014 | 2015 | |
| Alberta | 13,112 (351.3) |
14,142 (373.1) |
15,704 (404.7) |
16,081 (402.4) |
16,622 (404.6) |
17,548 (419.8) |
| British Columbia | 11,874 (265.9) |
11,765 (261.5) |
12,416 (273.1) |
12,244 (266.8) |
13,452 (289.6) |
14,379 (306.4) |
| Manitoba | 6,370 (521.7) |
6,722 (544.8) |
6,589 (527.0) |
6,420 (507.3) |
6,294 (491.4) |
6,539 (504.6) |
| New Brunswick | 1,875 (249.0) |
1,931 (255.6) |
1,932 (255.3) |
1,770 (234.2) |
1,746 (231.3) |
1,891 (250.7) |
| Newfoundland and Labrador | 644 (123.4) |
689 (131.2) |
864 (164.1) |
801 (151.9) |
871 (164.9) |
963 (182.2) |
| Northwest Territories | 909 (2,100.4) |
825 (1,896.5) |
956 (2,193.0) |
870 (1,986.9) |
826 (1,882.0) |
886 (2,002.5) |
| Nova Scotia | 2,236 (237.3) |
2,464 (260.9) |
2,613 (276.5) |
2,464 (261.1) |
2,628 (278.6) |
2,835 (300.5) |
| Nunavut | 1,396 (4,185.5) |
1,320 (3,860.1) |
1,356 (3,907.0) |
1,475 (4,166.6) |
1,284 (3,564.4) |
1,385 (3,791.2) |
| Ontario | 33,478 (254.9) |
36,418 (274.6) |
36,558 (272.5) |
34,683 (255.9) |
35,985 (263.0) |
39,024 (282.8) |
| Prince Edward Island | 213 (150.3) |
220 (152.7) |
257 (177.1) |
242 (166.7) |
254 (174.2) |
227 (154.7) |
| Quebec | 17,324 (218.5) |
19,147 (239.1) |
20,159 (249.3) |
22,287 (273.3) |
23,340 (284.1) |
24,448 (296.0) |
| Saskatchewan | 5,059 (481.2) |
5,554 (520.8) |
5,721 (526.8) |
5,771 (522.3) |
5,807 (517.9) |
6,091 (538.0) |
| Yukon | 229 (661.9) |
209 (590.4) |
176 (488.1) |
239 (658.1) |
210 (569.5) |
283 (756.8) |
| Canada | 94,719 (278.5) |
101,406 (295.3) |
105,301 (303.0) |
105,347 (299.7) |
109,319 (307.6) |
116,499 (325.0) |
Discussion
From 2010 to 2015, rates of reported cases of chlamydia increased across Canada, a picture similar to that in the United States of America (USA)Footnote 11. Several factors may help to explain these increasing rates. In addition to a possible true increase in incidence, the popularity of a highly sensitive diagnostic tool (nucleic acid amplification testing or NAAT) as well as more effective screening and case-finding may have led to increased diagnoses of chlamydiaFootnote 12Footnote 13Footnote 14. Quebec, which had one of the highest rate increases, has indicated that their increasing rates are partly due to increased testing in the province and increased use of NAATFootnote 15.
From 2010 to 2015, females had consistently higher rates of reported chlamydia than did men, and rates are continuing to rise. Chlamydia rates are also higher among females than among males in the USA, England and AustraliaFootnote 11Footnote 16Footnote 17. Several studies have indicated that females may be more biologically susceptible to chlamydia than malesFootnote 18Footnote 19. Furthermore, they are also more likely to seek health careFootnote 19Footnote 20. Infections in females are frequently asymptomatic, and untreated infections can lead to serious complications and morbidity such as pelvic inflammation, ectopic pregnancies and infertilityFootnote 21Footnote 22. This may explain why chlamydia screening programs and physician practices have traditionally targeted femalesFootnote 23. A higher rate of ascertainment could partly explain the higher rates of chlamydia infection among females.
Although absolute rates were lower among males than among females, rates among men were also increasing and at a rate much higher than that of females. This increase may also be partly due to the increased uptake of sensitive testing since males are considered a hidden reservoir of chlamydiaFootnote 2Footnote 24. Also, the increased use of NAAT to detect extra-genital infections (especially rectal infections among men who have sex with men) and increased availability of urine-based NAAT tests may explain the observed rise in chlamydia rates among menFootnote 15.
Adolescents and young adults aged 15–29 years continue to have high rates of infection, a situation observed in several high-income countries. For example, in the USA, lack of access to health care services, insufficient screening, confidentiality concerns around disclosing risky behaviours and having multiple sexual partners have been reported as the constellation of factors that put youth at risk of STIsFootnote 25. Suboptimal risk awareness and poor knowledge of risk-reduction behaviours may also explain these levels of STI riskFootnote 26.
An increasing trend in rates has also been observed among older cohorts. Recently, Canadian demographics have shifted towards an older population. Although absolute rates are low among those aged 60 years and over, chlamydia rates increased notably in this age group over time. This is likely due to a combination of factors, including increases in risky sexual behaviour, psychosocial changes such as the loss of a spouse, evolving societal norms and natural physiological changes, such as decreased vaginal lubrication, which can cause the mucosal tissue to be more fragile and more susceptible to infectionFootnote 27Footnote 28.
Strengths and limitations
This surveillance report presents national data on chlamydia based on cases reported by all provinces and territories in Canada; it describes rates over a six-year period.
Some limitations of these data should be noted. Data presented in this report likely underestimate the true incidence rate of chlamydia from 2010–2015 as many infections are asymptomatic, undiagnosed or unreported. Reporting might vary and common barriers include lack of knowledge about which diseases to report, time required for notification, and perceived severity of the disease to be reportedFootnote 29Footnote 30. However, as comprehensive incidence and prevalence studies are rare, the reported case rates provide valuable information on disease trends and on minimum incidence rates.
Chlamydia reinfections are common and more than one infection may have occurred and been reported for a given individual, so the true number of people infected may be lower than the number of cases reported. In addition, information on risk factors is unavailable in the CNDSS, limiting our ability to identify factors associated with higher chlamydia rates.
The absence of statistical analysis in this surveillance report is also a limitation. As rates were not age-standardized, changes in rates over the past three decades might be due partly to changes in the age structure of provinces and territories and in Canada in general.
Finally, screening, testing and reporting practices can differ significantly between provinces and territories and might have changed over time, resulting in an uneven ability to capture all cases across jurisdictions. Therefore, direct comparisons between provinces and territories should be made with caution.
Conclusion
Chlamydia rates increased by 16.7% between 2010 and 2015, and females consistently have higher rates than males. Although a number of factors may account for these trends, the possibility of a true increase in incidence cannot be ruled out. Ongoing monitoring of chlamydia, evaluation of traditional approaches and interventions and research into the reasons for the observed changes will help guide chlamydia prevention and control activities.
Authors' statement
YC – Conceptualization, methodology, writing – original draft
JM – Software, data collection and curation, validation, formal analysis, visualization, writing – review and editing
JS – Writing – original draft, visualization
AL – Validation, formal analysis, visualization, writing – review and editing
JA – Conceptualization, writing – original draft
Conflict of interest
None.
Contributors
Chris Archibald – Supervision, writing – review and editing, resources, project administration
Jennifer Siushansian – Writing – review and editing
Acknowledgements
It would not have been possible to publish this report without the continuous and greatly appreciated contribution of all provinces and territories to STI national surveillance.
Funding
This work was supported by the Public Health Agency of Canada.
Appendix: Case definition of confirmed case of chlamydia
Laboratory evidence of infection in genitourinary or extra–genital infections
- Detection of Chlamydia trachomatis by culture
OR - Detection of C. trachomatis nucleic acid
OR - Detection of C. trachomatis antigen
Laboratory evidence of perinatal infection
Detection and confirmation of C. trachomatis in nasopharyngeal or other respiratory tract specimens from an infant in whom pneumonia developed in the first six months of life or in conjunctival specimens from an infant who developed conjunctivitis in the first month of life:
- Detection of C. trachomatis by culture
OR - Detection of C. trachomatis nucleic acid
OR - Detection of C. trachomatis antigen