
Archived - Infectious syphilis cases reported in Canada 2009–2018

 Download this article as a PDF
Published by: The Public Health Agency of Canada
Issue: Volume 45–11: Sexually transmitted infections among MSM
Date published: November 7, 2019
ISSN: 1481-8531
Submit a manuscript
About CCDR
Browse
Volume 45–11, November 7, 2019: Sexually transmitted infections among MSM
Infographic
Infectious syphilis in Canada, 2018
Text description: Infographic
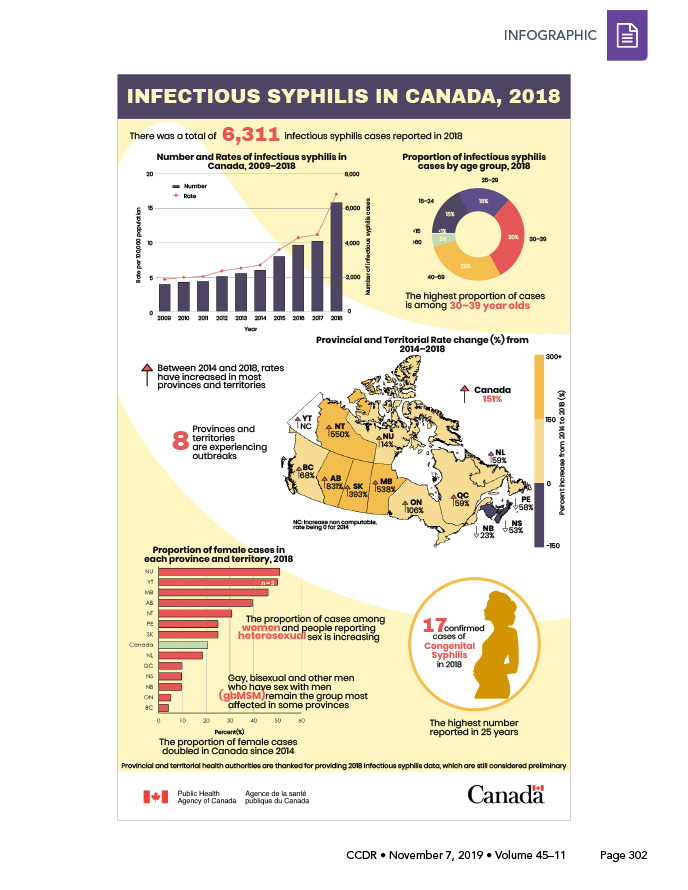
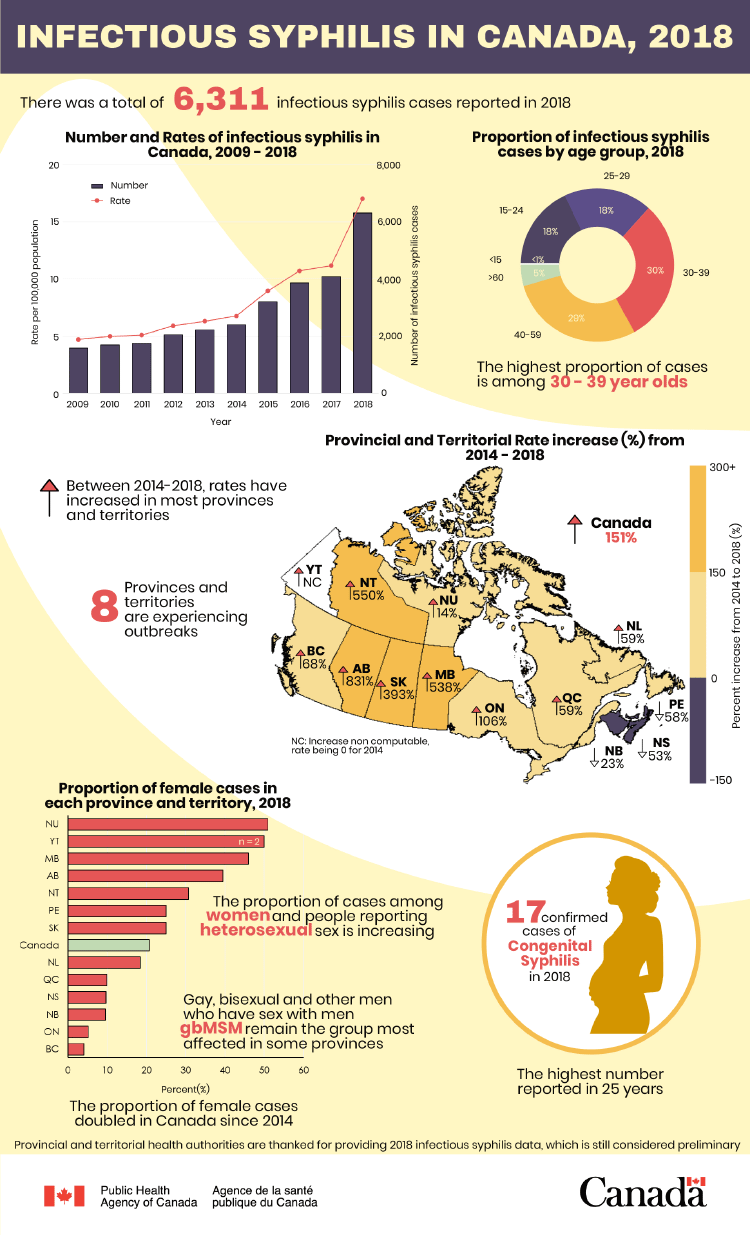
Infographic: Infectious syphilis in Canada, 2018
A total of 6,311 infectious syphilis cases were reported in Canada in 2018.
Number and rate of infectious syphilis in Canada, 2009–2018
- The number of infectious syphilis cases increased from 1,584 in 2009 to 6,311 in 2018
- This corresponds to an increase in rate of infectious syphilis from 4.7 to 17.0 per 100,000 population from 2009 to 2018
Proportion of infectious syphilis cases by age group, 2018
- The proportion of infectious syphilis cases varied by age group: <1% of all cases for those younger than 15, 18% of all cases among 15–24 year olds, 19% among 25–29 year olds, 30% among 30–39 year olds, 29% among 40–59 year olds and 5% among those aged over 60
- The highest proportion of cases is among 30–39 year olds
Provincial and territorial rate increases (%) from 2014–2018
- Between 2014 and 2018, rates of infectious syphilis increased in most provinces and territories
- Eight provinces and territories are experiencing outbreaks
- Increases in rates of infectious syphilis above the Canadian average of 151% were reported by Alberta (831%), Northwest Territories (550%), Manitoba (538%) and Saskatchewan (393%)
- Increases in rates of infectious syphilis below the Canadian average were reported by Ontario (106%), British Columbia (68%), Newfoundland and Labrador (59%), Quebec (59%), and Nunavut (14%)
- Three provinces reported a rate decrease since 2014: Prince Edward Island (−58%), Nova Scotia (−53%) and New Brunswick (−23%)
- The rate of infectious syphilis increased in Yukon Territory since 2014 but as the rate for 2014 was zero, the relative increase from 2014 to 2018 was not computable
Proportion of female cases in each province and territory, 2018
- A proportion of female cases above the Canadian average of 20.7% was reported in Nunavut (51%), Yukon Territory (50%)Footnote *, Manitoba (46%), Alberta (39%), Northwest Territories (31%), Prince Edward Island (25%) and Saskatchewan (25%)
- A proportion of female cases below the Canadian average of 20.7% was reported in Newfoundland and Labrador (18%), Quebec (10%), Nova Scotia (10%), New Brunswick (9%), Ontario (5%) and British Columbia (4%)
- The proportion of cases among women and people reporting heterosexual sex is increasing
- Gay, bisexual and other men who have sex with men (gbMSM) remain the group most affected in some provinces
Congenital syphilis
The number of congenital syphilis cases is also on the rise.
- 17 confirmed cases of congenital syphilis were reported in 2018. This is the highest number reported in 25 years
Our thanks to provincial and territorial health authorities for providing the 2018 infectious syphilis data, which are still considered preliminary.
Appendix A: Data tables corresponding with infectious syphilis figures
| Year | Rate per 100,000 population | Infectious cases |
|---|---|---|
| 2009 | 4.7 | 1,584 |
| 2010 | 5.0 | 1,696 |
| 2011 | 5.1 | 1,749 |
| 2012 | 5.9 | 2,053 |
| 2013 | 6.3 | 2,215 |
| 2014 | 6.8 | 2,399 |
| 2015 | 9.0 | 3,199 |
| 2016 | 10.7 | 3,870 |
| 2017 | 11.2 | 4,083 |
| 2018 | 17.0 | 6,311 |
| Age group, years | % |
|---|---|
| <15 | 0.2 |
| 15–24 | 17.8 |
| 25–29 | 18.5 |
| 30–39 | 30.3 |
| 40–59 | 28.6 |
| 60+ | 4.6 |
| Province/territory | % |
|---|---|
| Nunavut | 51.0 |
| Yukon Territory | 50.0 |
| Manitoba | 46.0 |
| Alberta | 39.4 |
| Northwest Territories | 30.8 |
| Prince Edward Island | 25.0 |
| Saskatchewan | 25.0 |
| Canada | 20.7 |
| Newfoundland and Labrador | 18.4 |
| Quebec | 9.8 |
| Nova Scotia | 9.7 |
| New Brunswick | 9.5 |
| Ontario | 5.1 |
| British Columbia | 4.1 |
