
HIV Surveillance Report 2019

 Download this article as a PDF
Published by: The Public Health Agency of Canada
Issue: Volume 47-01: Foodborne and Animal Contact Disease Outbreaks
Date published: January 2021
ISSN: 1481-8531
Submit a manuscript
About CCDR
Browse
Volume 47-01, January 2021: Foodborne and Animal Contact Disease Outbreaks
Surveillance
HIV in Canada—surveillance report, 2019
Nisrine Haddad1, Ashley Weeks1, Anita Robert1, Stephanie Totten1
Affiliation
1 Centre for Communicable Diseases and Infection Control, Public Health Agency of Canada, Ottawa, ON
Correspondence
Suggested citation
Haddad N, Weeks A, Robert A, Totten S. HIV in Canada—surveillance report, 2019. Can Commun Dis Rep 2021;47(1):77–86. https://doi.org/10.14745/ccdr.v47i01a11
Keywords: HIV, surveillance, gay, bisexual and other men who have sex with men, heterosexual contact, people who inject drugs, perinatal HIV, Canada
Abstract
Background: Human immunodeficiency virus (HIV) is a global public health issue. HIV has been nationally notifiable in Canada since 1985. The Public Health Agency of Canada (PHAC) monitors trends in new HIV diagnoses.
Objectives: The objective of this surveillance report is to provide an overview of the epidemiology of reported HIV cases in 2019 in Canada. The report highlights 10-year trends (2010–2019). Data on HIV diagnosed through Immigration Medical Exams (IME) and trends in perinatal transmission of HIV are also presented.
Methods: PHAC monitors HIV through the HIV/AIDS Surveillance System, a passive, case-based system that collates non-nominal data submitted voluntarily by all Canadian provinces and territories. Descriptive analyses were conducted on national data. IME data were obtained from Immigration, Refugees and Citizenship Canada (IRCC), and data on HIV-exposed pregnancies were obtained through the Canadian Perinatal HIV Surveillance Program.
Results: In 2019, a total of 2,122 HIV diagnoses were reported in Canada (5.6 per 100,000 population). Saskatchewan reported the highest provincial diagnosis rate at 16.9 per 100,000 population. The 30 to 39-year age group had the highest HIV diagnosis rate at 12.7 per 100,000 population. While the rates for both males and females fluctuated in the past decade, since 2010 the rates among males decreased overall, while the rate among females increased slightly. As in previous years, the diagnosis rate for males in 2019 was higher than that for females (7.9 versus 3.4 per 100,000 population, respectively). The highest proportion of all reported adult cases with known exposure were gay, bisexual and other men who have sex with men (gbMSM, 39.7%), followed by cases attributed to heterosexual contact (28.3%) and among people who inject drugs (PWID, 21.5%). The number of migrants who tested positive for HIV during an IME conducted in Canada was 626. The one documented perinatal HIV transmission related to a mother who had not received antepartum or intrapartum antiretroviral therapy prophylaxis.
Conclusion: The number and rate of reported HIV cases in Canada has remained relatively stable over the last decade, with minor year-to-year variations. As in previous years, the gbMSM and PWID populations represent a high proportion of HIV diagnoses, although a sizable number of cases were attributed to heterosexual contact. It is important to routinely monitor trends in HIV in light of pan-Canadian commitments to reduce the health impact of sexually transmitted and blood-borne infections by 2030.
Introduction
Human immunodeficiency virus (HIV) has a serious economic and social impact globally; an estimated 1.7 million people worldwide were newly infected with HIV in 2019Footnote 1 . In Canada, recent estimates indicate that approximately 62,050 people were living with HIV at the end of 2018. Of the people living with HIV, 87% were diagnosed; 85% of those diagnosed were on treatment, and 94% of the people receiving treatment had an undetectable viral load Footnote 2.
More recent advances in HIV care, including preexposure prophylaxis (PrEP) with antiretroviral therapy (ART), and the availability of self-testing have the potential to greatly affect HIV incidence in Canada. Despite these advances people living with HIV experience significant challenges such as barriers to effective care, health issues across the lifespan related to HIV infection or its treatment, as well as stigma and discriminationFootnote 3.
As part of a global movement to eliminate sexually transmitted and blood-borne infections (STBBI) as a health concern by 2030, the Public Health Agency of Canada (PHAC) published Reducing the health impact of sexually transmitted and blood-borne infections in Canada by 2030: A pan-Canadian STBBI framework for action Footnote 4 . This framework and its associated Government of Canada action plan Footnote 5 demonstrate a commitment to reducing the burden of STBBI in Canada through the core pillars of prevention, testing, initiation of care and treatment, and ongoing care and support. Furthermore, the framework delineates the importance of a common approach to addressing key populations disproportionately affected by HIV Footnote 4 Footnote 5. The framework also emphasizes the importance of early HIV diagnosis and reporting to monitor trends in newly diagnosed infections to inform and evaluate prevention and care programs Footnote 6 Footnote 7 Footnote 8 Footnote 9. Monitoring trends in HIV is important in understanding the burden of HIV in Canada and for monitoring Canada's progress in meeting the goals of the STBBI framework. In 2018, the national diagnosis rate was 6.2 per 100,000 population with a total of 2,296 HIV diagnoses Footnote 10. There were six perinatal transmissions, with four of these attributed to mothers who did not receive any ART. A total of 696 migrants tested positive for HIV through Immigration Medical Exams (IMEs) conducted in Canada Footnote 10.
The objectives of this surveillance report are to provide updates on the epidemiology of reported HIV cases in Canada from 2010 to the end of 2019, by geographic location, age group, sex and exposure category. In addition, updated information on immigration medical screening results for HIV and on the number of infants perinatally exposed and infected with HIV are presented.
Methods
Data sources
This HIV surveillance report uses data from three different sources: the national HIV/AIDS Surveillance System (HASS) maintained by PHAC; immigration medical screening for HIV by Immigration, Refugees and Citizenship Canada (IRCC); and the Canadian Perinatal HIV Surveillance Program (CPHSP). Details on each data source are outlined below.
HIV/AIDS Surveillance System
HASS is a passive, case-based surveillance system that collates non-nominal data on people diagnosed with HIV infection who meet the national case definition Footnote 11. PHAC receives information on data elements including but not limited to age, sex, race/ethnicity and risks associated with the transmission of HIV (exposure categories). These data are voluntarily submitted to PHAC by provincial and territorial public health authorities.
Data on exposure category and race/ethnicity are submitted with varying degrees of completeness across the country. Exposure category data were reported by all jurisdictions except for Québec; by province and territory, completeness of data ranged from 68.6% to 100% in 2019 (57.1% overall). Race/ethnicity data were submitted by all jurisdictions except Québec and British Columbia; for those who did report race/ethnicity data, the completion rate ranged from 22% to 100% (41.5% overall). Newfoundland and Labrador, Yukon and Nunavut submitted race/ethnicity information for all reported cases. Northwest Territories did not have any diagnosed cases of HIV in 2019. In 2019, Saskatchewan submitted only two race/ethnicity subcategories, Indigenous and non-Indigenous. New Brunswick submitted only one subcategory for race/ethnicity category, whether a case was First Nations, and did not provide information on any other race/ethnicity category.
Data in each province and territory are obtained through provincial HIV surveillance systems, which may include both public health and laboratory reporting. Each province or territory provides data to PHAC either through the National Case Report Form Footnote 12 or through a secure electronic dataset transmission. All raw data (paper forms and electronic datasets) are retained in compliance with the Directive for the Collection, Use and Dissemination of Information relating to Public Health (PHAC, 2013, unpublished document). Data quality assessment, such as the detection of duplicate entries, is handled by the provinces and territories prior to submission to PHAC.
The data in this surveillance report represent newly reported HIV cases diagnosed on or before December 31, 2019, that were submitted by provincial and territorial surveillance programs to PHAC up to September 18th, 2020, and validated as of October 8, 2020. Additional details on HASS methods can be found elsewhere Footnote 12.
Alberta and British Columbia resubmitted revised historical data since 2016 and 2017, respectively. This year, Ontario resubmitted updated historical data since 1985.
Immigration medical screening for HIV
All foreign nationals applying for permanent residence and some applying for temporary residence in Canada must undergo an IME administered by third-party panel physicians on behalf of IRCC, either in Canada or overseas. All applicants aged 15 years and older are screened for HIV during the IME. IRCC provides PHAC with non-nominal data collected during the IME on migrants who tested positive for HIV. The term "migrant" is used broadly and includes the following: immigrants (permanent residents in the economic and family classes); refugees (resettled refugees, protected persons and asylum claimants); and temporary residents (visitors, international students, temporary foreign workers and temporary resident permit holders). The IME data presented here were obtained from IRCC's Global Case Management System, which contains the IME information for all applicants screened in Canada or overseas who tested positive for HIV. Aggregate data were provided to PHAC in July 2020. Data on individuals tested in Canada were obtained from IMEs conducted in 2019. Data concerning individuals tested overseas were obtained from individuals with an HIV diagnosis on their IME who landed in Canada in 2019.
IRCC shares nominal data from overseas IME test results with participating provinces and territories for all clients who have been diagnosed with HIV and have a valid Canadian residential address on file that indicates their current province/territory of residence. This supports the continuity of care for clients with HIV. These data are incorporated into the provincial/territorial routine HIV case-based surveillance systems to varying degrees, with some jurisdictions reporting these HIV-positive migrant cases as a new diagnosis and others excluding them from provincial/territorial reporting to PHAC.
Canadian Perinatal HIV Surveillance Program
National data on the HIV status of infants exposed perinatally to HIV infection are collected through the CPHSP, an initiative of the Canadian Paediatric AIDS Research Group. The CPHSP is a sentinel-based active surveillance system that collects data on two groups of children: infants born to HIV-positive women and HIV-infected children receiving care at any participating site (whether born in Canada or abroad). Additional information on CPHSP methods are provided elsewhere Footnote 10 Footnote 12. Surveillance data for 2019, including data updates for previous years, were submitted to PHAC in March 2020.
Analysis
We used all HIV case data reported to HASS to complete descriptive analyses for overall trends, geographic location, sex, age and exposure category. Analyses were restricted to cases for which data were available (i.e. not missing). Counts and proportions were calculated from IRCC data. The CPHSP provided aggregated data tables, and selected results are presented in this report.
Microsoft Excel 2016 (Redmond, Washington, United States) and SAS Enterprise Guide v7.1 (Cary, North Carolina, United States) software were used for data cleaning and analysis. Standardized data recoding procedures were applied to all submitted provincial and territorial datasets to create a national dataset for analysis. In this report, the term "adult" is defined as anyone aged 15 years or older. The surveillance data presented in this report were validated by all provinces and territories to ensure accuracy.
No statistical procedures were used for comparative analysis, nor were any statistical techniques applied to account for missing data since analyses were limited to cross-tabulations due to the descriptive nature of the analysis. The population data source used to calculate rates was the Annual Demographic Statistics, issued by Statistics Canada in July 2019 Footnote 13.
Supplementary tables are listed in the Appendix and are available upon request.
Results
Overall trends
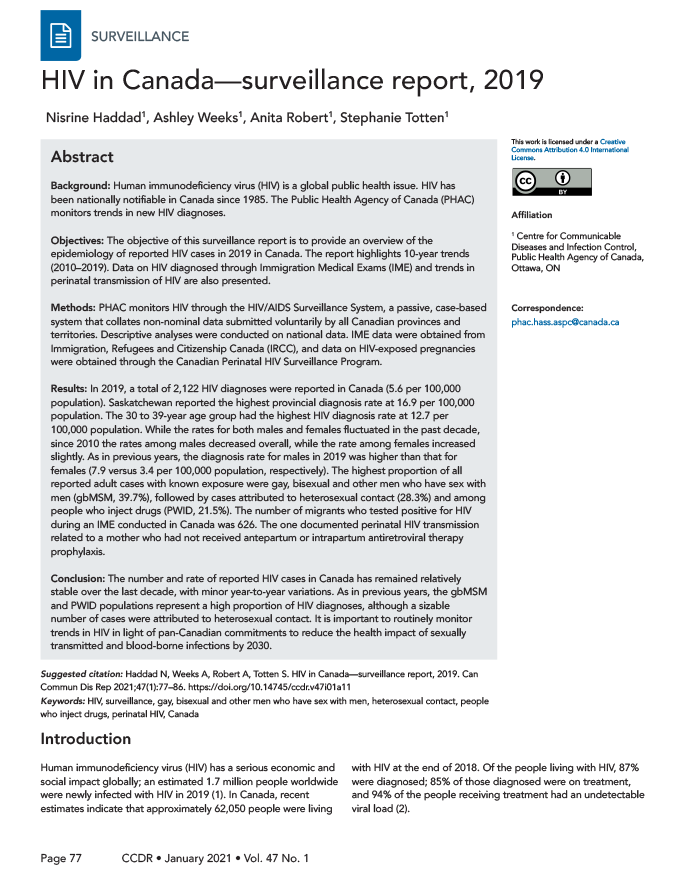
A cumulative total of 88,357 HIV diagnoses have been reported to PHAC since HIV reporting began in Canada in 1985. In 2019, a total of 2,122 HIV diagnoses were reported. The national diagnosis rate was 5.6 per 100,000 population. This rate has slightly decreased since 2010 when it was 6.3 per 100,000 population (Figure 1).
Figure 1: Number of reported cases of HIV and diagnosis rates overall, by sex and year, Canada, 2010–2019Figure 1 footnote aFigure 1 footnote b
Text description: Figure 1
Figure 1: Number of reported cases of HIV and diagnosis rates overall, by sex and year, Canada, 2010–2019Figure 1 footnote aFigure 1 footnote b
| Year | Overall cases reported to PHAC | Overall rate per 100,000 | Rates for males per 100,000 | Rates for females per 100,000 |
|---|---|---|---|---|
| 2010 | 2,150 | 6.3 | 9.7 | 2.9 |
| 2011 | 2,121 | 6.2 | 9.5 | 2.9 |
| 2012 | 1,919 | 5.5 | 8.6 | 2.5 |
| 2013 | 1,928 | 5.5 | 8.6 | 2.4 |
| 2014 | 1,916 | 5.4 | 8.2 | 2.6 |
| 2015 | 1,942 | 5.4 | 8.3 | 2.6 |
| 2016 | 2,159 | 6 | 9.2 | 2.8 |
| 2017 | 2,150 | 5.9 | 9 | 2.8 |
| 2018 | 2,296 | 6.2 | 8.9 | 3.5 |
| 2019 | 2,122 | 5.6 | 7.9 | 3.4 |
In 2019, the diagnosis rate for males was 7.9 per 100,000 population and for females was 3.4 per 100,000 population. While the rates for both males and females fluctuated in the past decade, the rates in the male population decreased slightly since 2016 (from 9.2 to 7.9 per 100,000 population) and increased slightly in females since 2015 (from 2.6 to 3.4 per 100,000 population) (Figure 1).
Geographic distribution
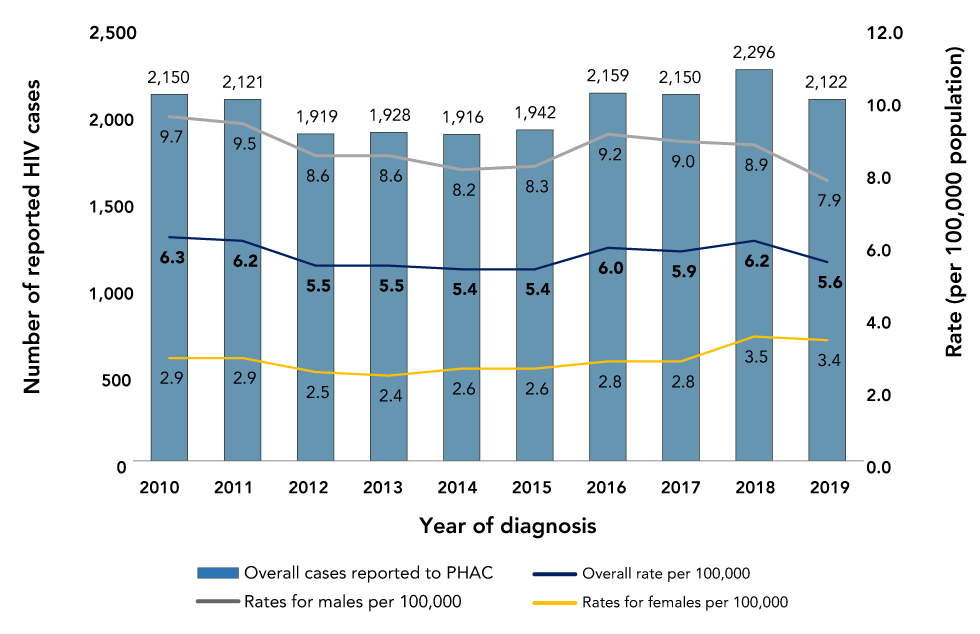
In 2019, Saskatchewan had the highest provincial/territorial diagnosis rate at 16.9 per 100,000 population. Manitoba had the second highest provincial/territorial diagnosis rate at 8.8 per 100,000 population, followed by Québec, Alberta, Ontario and British Columbia at 7.4, 5.8, 4.7 and 3.5 per 100,000 population, respectively (Figure 2).
Figure 2: HIV diagnosis rate (per 100,000 population), by province and territory, Canada, 2019Figure 2 footnote aFigure 2 footnote b
Text description: Figure 2
Figure 2: HIV diagnosis rate (per 100,000 population), by province and territory, Canada, 2019Figure 2 footnote aFigure 2 footnote b
Figure 2 is a map of Canada that identifies the provincial, territorial, and national HIV diagnosis rates across the country in 2019. The colours denote the HIV diagnosis rate: light green denotes an HIV diagnosis rate between 0.1 and 3.0 per 100,000 population; turquoise denotes an HIV diagnosis rate between 3.1 and 6.0 per 100,000 population; blue denotes an HIV diagnosis rate of 6.1 to 9.0 per 100,000 population; dark blue denotes an HIV diagnosis rate of greater than or equal to 9.1 per 100,000 population.
| Year | HIV diagnosis rate (per 100,000 population) | |||||||
|---|---|---|---|---|---|---|---|---|
| Territories (light green) |
British Columbia (turquoise) |
Alberta (turquoise) |
Saskatchewan (dark blue) |
Manitoba (blue) |
Ontario (turquoise) |
Québec (blue) |
Atlantic (light green) |
|
| 2019 | 1.7 | 3.5 | 5.8 | 16.9 | 8.8 | 4.7 | 7.4 | 3.0 |
Age and sex distribution
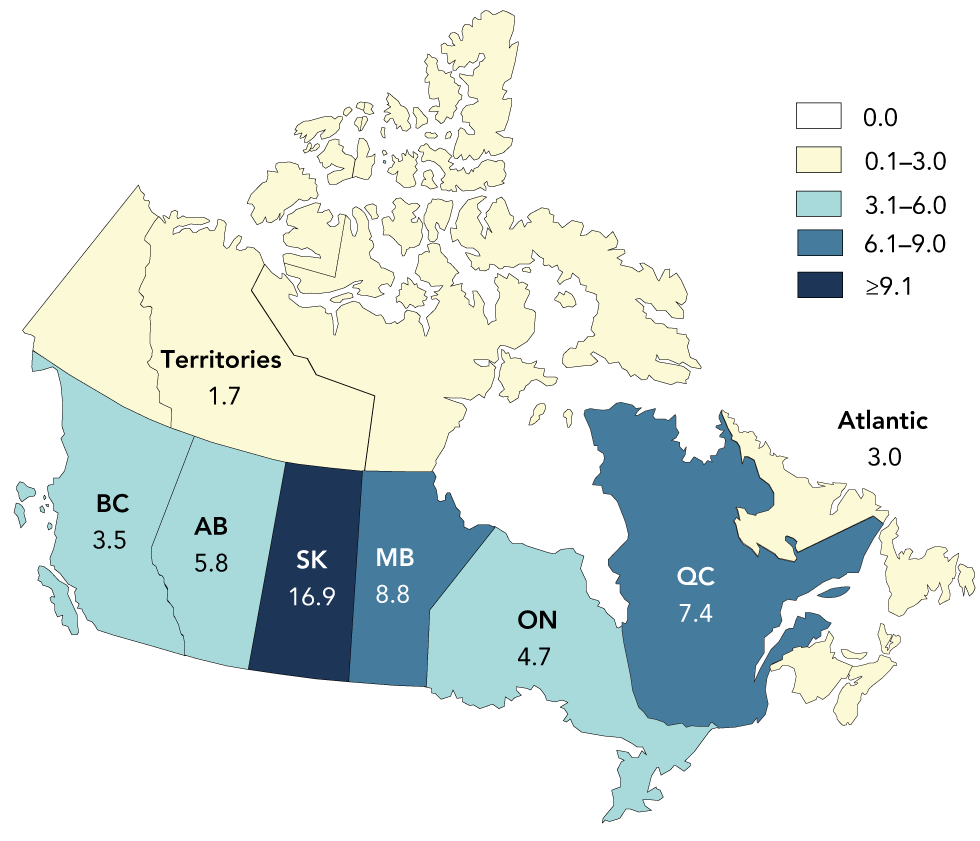
In 2019, data on age groups were available for almost 100% (n=2,120) of all reported HIV diagnoses. The diagnosis rate by age group has remained stable since 2010 for those aged younger than 19 years and those aged 50 years and older. The diagnosis rate has fluctuated slightly over the past 10 years for those in the 20 to 29, 30 to 39 and 40 to 49-year age groups. The 30 to 39-year age group had the highest diagnosis rate throughout the 10-year period; in 2019, the rate was 12.7 per 100,000 population, an overall decrease from 14.3 per 100,000 population in 2010. The 20 to 29-year age group had the second highest rate at 10.1 per 100,000 population in 2019, followed by the 40 to 49-year age group at 9.1 per 100,000 population. In 2019, diagnostic rates of those aged 50 years and older were 3.2 per 100,000 population and of those aged 15 to 19 years were 1.6 per 100,000 population; children less than 15 years old had the lowest diagnostic rate of 0.2 per 100,000 population (Figure 3).
Figure 3: HIV diagnosis rate, all ages, by age group and year, Canada, 2010–2019 Figure 3 footnote aFigure 2 footnote bFigure 3 footnote c
Text description: Figure 3
Figure 3: HIV diagnosis rate, all ages, by age group and year, Canada, 2010–2019Figure 3 footnote aFigure 2 footnote bFigure 3 footnote c
| Age group | Years | |||||||||
|---|---|---|---|---|---|---|---|---|---|---|
| 2010 | 2011 | 2012 | 2013 | 2014 | 2015 | 2016 | 2017 | 2018 | 2019 | |
| Children <15 years | 0.2 | 0.2 | 0.2 | 0.3 | 0.2 | 0.2 | 0.2 | 0.3 | 0.4 | 0.2 |
| 15–19 years | 1.3 | 2 | 1.5 | 1.8 | 1.7 | 1.6 | 2.1 | 1.9 | 1.9 | 1.6 |
| 20–29 years | 10.6 | 10.2 | 9.4 | 9.1 | 8.5 | 10.2 | 10.4 | 10.1 | 10.6 | 10.1 |
| 30–39 years | 14.3 | 14 | 12.1 | 11.8 | 12.7 | 10.9 | 12.8 | 13.5 | 13.7 | 12.7 |
| 40–49 years | 10.8 | 10.2 | 10.4 | 9.6 | 9.1 | 8.7 | 9.7 | 9.7 | 10.4 | 9.1 |
| ≥50 years | 3.3 | 3.4 | 2.7 | 3.1 | 3.1 | 3.5 | 3.7 | 3.3 | 3.6 | 3.2 |
In 2019, data on sex were available for almost 100% of all reported HIV diagnoses (n=2,118). Males accounted for 69.8% of the diagnoses where sex was known, while females accounted for 30.2%.
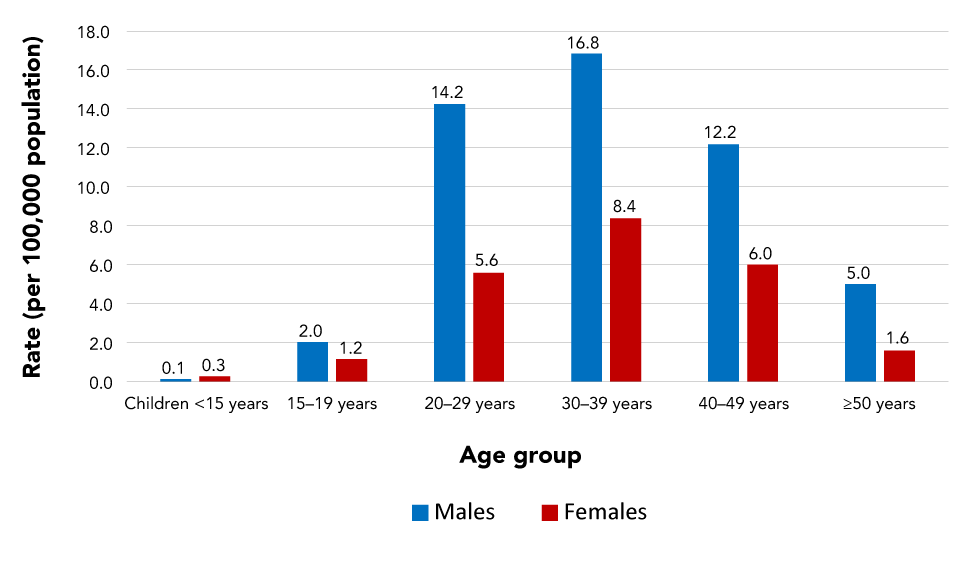
As in previous years, males aged 30 to 39 years old had the highest diagnosis rates in 2019, at 16.8 per 100,000 population; this age group also had the highest rates among females, at 8.4 per 100,000 population. Among both sexes, the bulk of HIV diagnoses occurred in those aged 20 to 49 years old. In all age groups, except for those younger than 19 years old, rates among males were at least twice as high as among their female counterparts (Figure 4).
Figure 4: HIV diagnosis rate, all ages, by sex and age group, Canada, 2019Figure 4 footnote a Figure 4 footnote b Figure 4 footnote c
Text description: Figure 4
Figure 4: HIV diagnosis rate, all ages, by sex and age group, Canada, 2019Figure 4 footnote a Figure 4 footnote b Figure 4 footnote c
| Age group | Males | Females |
|---|---|---|
| Children <15 years | 0.1 | 0.3 |
| 15–19 years | 2.0 | 1.2 |
| 20–29 years | 14.2 | 5.6 |
| 30–39 years | 16.8 | 8.4 |
| 40–49 years | 12.2 | 6.0 |
| ≥50 years | 5.0 | 1.6 |
Race/ethnicity
Race/ethnicity information was known for 880 cases (41.5%) in 2019. Of cases with known race/ethnicity, 30.7% were reported as White, 25.5% as Black and 24.7% as Indigenous (First Nations, Inuit, Métis or Indigenous not otherwise specified). The distribution of race/ethnicity categories varied by sex; among males, the highest proportion was reported as White (38.5%), while females were mainly reported as Black, at 42.1%, and Indigenous, at 40% (Table 1).
| Race/ethnicity | HIV cases | TotalTable 1 footnote c | ||||
|---|---|---|---|---|---|---|
| Male | Female | |||||
| n | % | n | % | n | % | |
| Indigenous | 104 | 17.4 | 112 | 40.0 | 217 | 24.7 |
First Nations |
45 | 7.5 | 46 | 16.4 | 92 | 10.5 |
Métis |
4 | 0.7 | 0 | 0.0 | 4 | 0.5 |
Inuit |
2 | 0.3 | 0 | 0.0 | 2 | 0.2 |
Indigenous, not otherwise specified |
53 | 8.9 | 66 | 23.6 | 119 | 13.5 |
| South Asian/West Asian/ArabTable 1 footnote d | 38 | 6.4 | 4 | 1.4 | 42 | 4.8 |
| AsianTable 1 footnote e | 42 | 7.0 | 3 | 1.1 | 45 | 5.1 |
| BlackTable 1 footnote f | 106 | 17.7 | 118 | 42.1 | 224 | 25.5 |
| Latin AmericanTable 1 footnote g | 62 | 10.4 | 2 | 0.7 | 64 | 7.3 |
| White | 230 | 38.5 | 39 | 13.9 | 270 | 30.7 |
| OtherTable 1 footnote h | 16 | 2.7 | 2 | 0.7 | 18 | 2.0 |
| SubtotalTable 1 footnote b | 598 | 40.5 | 280 | 43.8 | 880 | 41.5 |
| Not reported | 880 | 59.5 | 359 | 56.2 | 1,242 | 58.5 |
| Total | 1,478 | N/A | 639 | N/A | 2,122 | N/A |
Exposure category distribution
In 2019, 57.1% of adult diagnoses of HIV had a known exposure category (n=1,203). Consistent with previous years, the highest proportion of all reported adult HIV diagnoses in 2019 was among gay, bisexual and other men who have sex with men (gbMSM), at 39.7% (n=478), although the proportion has decreased over time, particularly since 2015, when it was 45.0%. Heterosexual contact was reported among 28.3% (n=340) of cases. The subgroups of the heterosexual contact category followed a consistent pattern, with the proportion of heterosexual contact with no identified risk (Het-NIR) at 10.8% (n=130), followed by heterosexual contact with a person from an HIV-endemic country (Het-Endemic) at 9.2% (n=111), and 8.2% (n=99) attributed to heterosexual contact with a person at risk (Het-Risk). People who inject drugs (PWID) accounted for 21.5% (n=259) of cases (Table 2).
| Exposure category | HIV cases | TotalTable 2 footnote e | ||||
|---|---|---|---|---|---|---|
| Male | Female | |||||
| n | % | n | % | n | % | |
| gbMSM | 477 | 56.2 | N/A | N/A | 478 | 39.7 |
| gbMSM/PWID | 41 | 4.8 | N/A | N/A | 41 | 3.4 |
| PWID | 124 | 14.6 | 135 | 38.4 | 259 | 21.5 |
| Heterosexual contact | 170 | 20.0 | 169 | 48.0 | 340 | 28.3 |
Het-Endemic |
36 | 4.2 | 75 | 21.3 | 111 | 9.2 |
Het-Risk |
51 | 6.0 | 47 | 13.4 | 99 | 8.2 |
Het-NIR |
83 | 9.8 | 47 | 13.4 | 130 | 10.8 |
| OtherTable 2 footnote a | 37 | 4.4 | 48 | 13.6 | 85 | 7.1 |
| SubtotalTable 2 footnote b | 849 | 100.0 | 352 | 100.0 | 1,203 | 100.0 |
| No identified riskTable 2 footnote c | 51 | 3.5 | 26 | 4.1 | 77 | 3.7 |
| Exposure category unknown or not reported ("missing")Table 2 footnote d | 574 | 38.9 | 252 | 40.0 | 828 | 39.3 |
| Total | 1,474 | N/A | 630 | N/A | 2,108 | N/A |
The exposure category variable was analysed separately for males and females. Among adult males in 2019, gbMSM accounted for the highest proportion (56.2%, n=477) of reported cases. Among adult females, exposure through heterosexual contact accounted for the highest proportion at 48.0% (n=169), with 21.3% Het-Endemic (n=75) and 13.4% Het-Risk and Het-NIR each (n=47 each). In addition, PWID accounted for a little over one-third of adult female HIV cases (38.4%, n=135) compared to 14.6% (n=124) of adult males cases (Table 2).
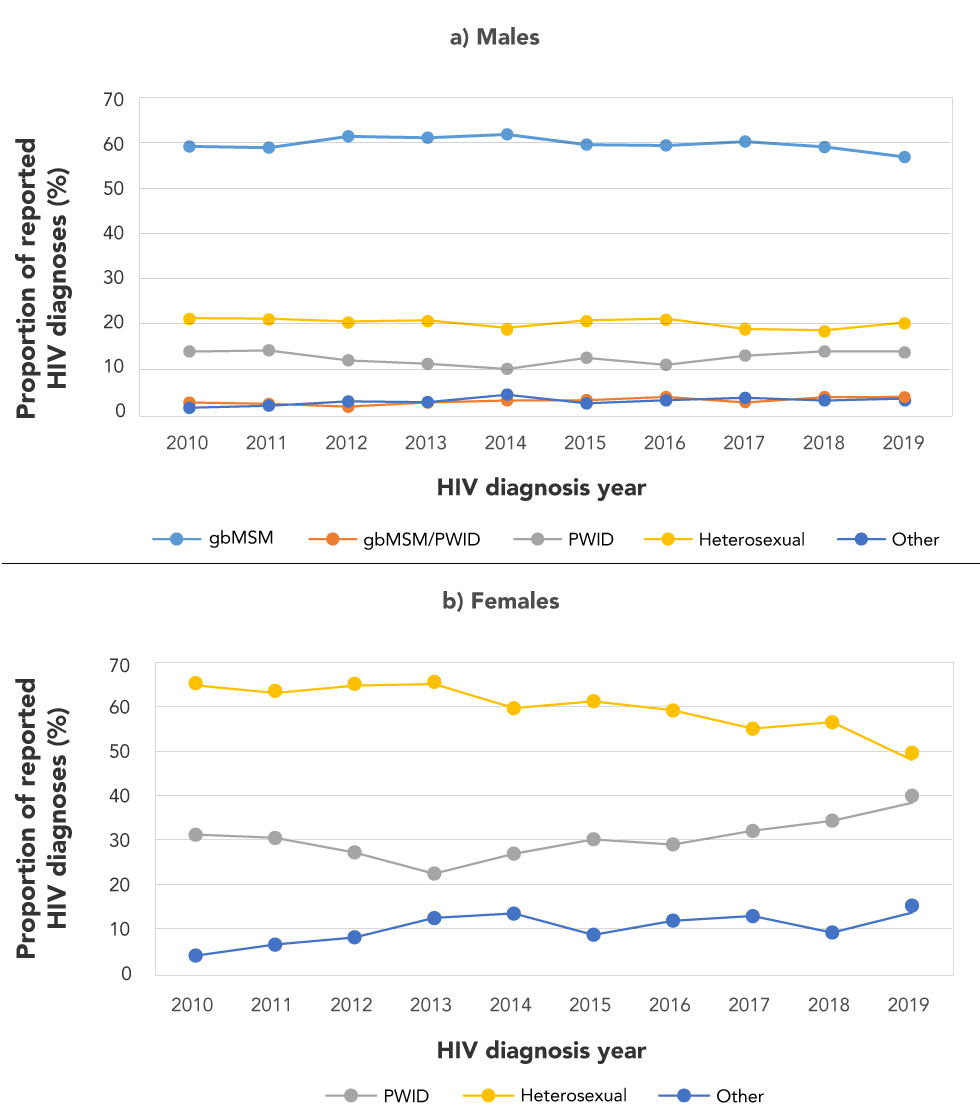
The distribution for exposure categories in males and females for the last 10 years is shown in Figure 5. In males, the distribution of HIV infection within the different exposure categories fluctuated slightly since 2010 but remained relatively stable overall. Of note, the gbMSM and heterosexual exposure categories decreased slightly in the last 10 years (percent decrease 26.3% and 27.0%, respectively), while the PWID exposure category remained relatively stable. Exposure attributed to the gbMSM/PWID category increased in the last 10 years (percent increase 10.9%). In females, there was a considerable decrease in the exposure attributed to heterosexual contact (percent decrease 20.3%), while the PWID increased (percent increase 32.4%).
Figure 5: Percentage distribution of HIV cases among (a) males and (b) females (≥15 years old) by exposure category and year of diagnosis, Canada, 2010–2019 (a and b) Figure 5 footnote a Figure 5 footnote b
Text description: Figure 5
Figure 5: Percentage distribution of HIV cases among (a) males and (b) females (≥15 years old) by exposure category and year of diagnosis, Canada, 2010-2019 (a and b)Figure 5 footnote a Figure 5 footnote b
| Exposure category | Years | |||||||||
|---|---|---|---|---|---|---|---|---|---|---|
| 2010 | 2011 | 2012 | 2013 | 2014 | 2015 | 2016 | 2017 | 2018 | 2019 | |
| a) Exposure category in adults ≥15 years-males, 2010–2019 | ||||||||||
| gbMSM | 58.9 | 58.6 | 61.5 | 61.1 | 62.0 | 59.3 | 59.1 | 60.1 | 58.7 | 56.2 |
| gbMSM/PWID | 3.4 | 3.0 | 2.3 | 3.4 | 3.9 | 4.0 | 4.8 | 3.4 | 4.8 | 4.8 |
| PWID | 14.6 | 14.8 | 12.3 | 11.4 | 10.0 | 12.9 | 11.1 | 13.5 | 14.6 | 14.6 |
| Heterosexual | 21.2 | 21.1 | 20.3 | 20.6 | 18.6 | 20.6 | 21.0 | 18.4 | 18.0 | 20.0 |
| Other | 2.0 | 2.5 | 3.7 | 3.5 | 5.4 | 3.2 | 3.9 | 4.6 | 3.9 | 4.4 |
| b) Adults ≥15 years-females, 2010–2019 | ||||||||||
| PWID | 31.2 | 30.5 | 27.2 | 22.4 | 26.9 | 30.1 | 29.0 | 32.1 | 34.3 | 38.4 |
| Heterosexual | 64.8 | 63.1 | 64.7 | 65.1 | 59.7 | 61.2 | 59.2 | 55.1 | 56.5 | 48.0 |
| Other | 4.0 | 6.5 | 8.1 | 12.5 | 13.4 | 8.7 | 11.8 | 12.9 | 9.2 | 13.6 |
Exposure category distribution by age group
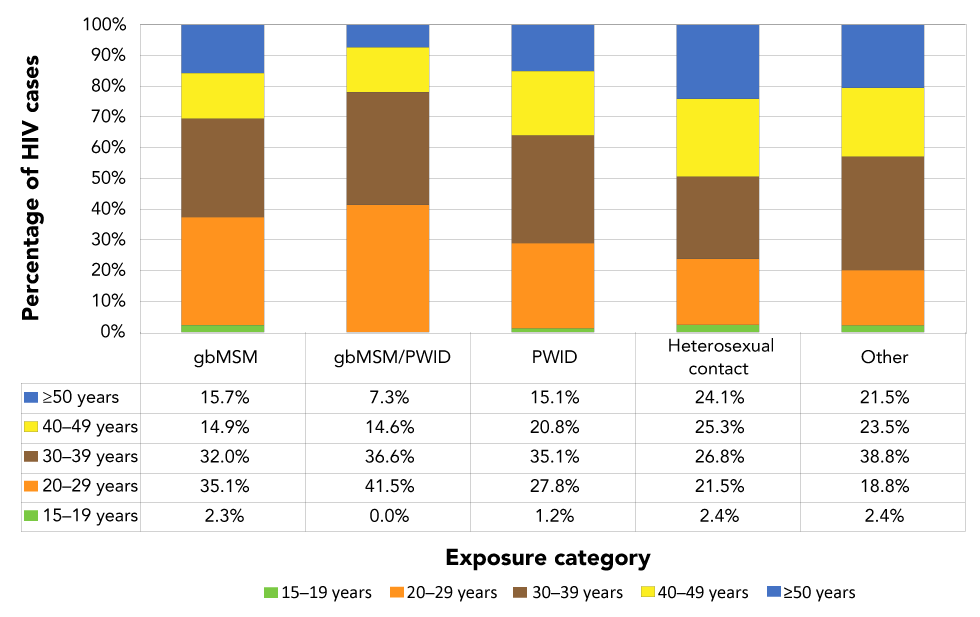
In 2019, of HIV diagnoses with known exposure category, the highest proportion of gbMSM and gbMSM/PWID were in the 20 to 29-year age group at 35.1% (n=168) and 41.5% (n=17), respectively. Among PWID, the highest proportion (35.1%, n=91) was in the 30 to 39-year age group. Cases reported within the heterosexual contact exposure category were evenly distributed across the different age groups for those aged over 20 years (range: 21.5%–26.8%), with the highest proportion in the 30 to 39-year age group (Figure 6).
Figure 6: Proportion of reported HIV cases (≥15 years old) by exposure category and age group, Canada, 2019Figure 6 footnote aFigure 6 footnote bFigure 6 footnote c
Text description: Figure 6
Figure 6: Proportion of reported HIV cases (≥15 years old) by exposure category and age group, Canada, 2019Figure 6 footnote aFigure 6 footnote bFigure 6 footnote c
| Exposure category | Age group | ||||
|---|---|---|---|---|---|
| 15–19 years | 20–29 years | 30–39 years | 40–49 years | ≥50 years | |
| gbMSM | 2.3% | 35.1% | 32.0% | 14.9% | 15.7% |
| gbMSM/PWID | 0.0% | 41.5% | 36.6% | 14.6% | 7.3% |
| PWID | 1.2% | 27.8% | 35.1% | 20.8% | 15.1% |
| Heterosexual contact | 2.4% | 21.5% | 26.8% | 25.3% | 24.1% |
| Other | 2.4% | 18.8% | 38.8% | 23.5% | 21.5% |
Immigration medical screening for HIV
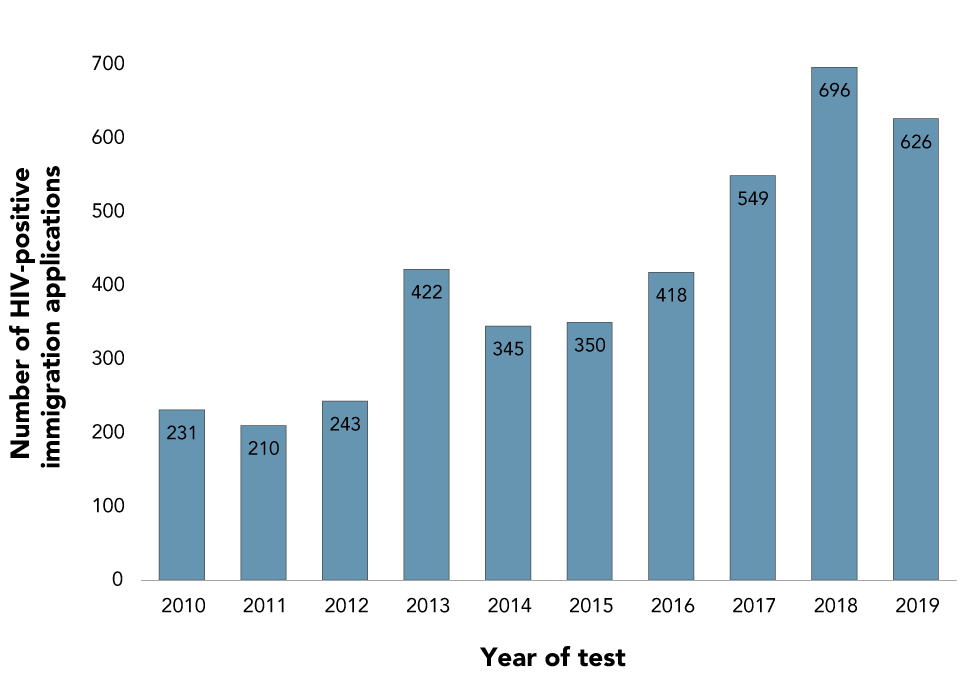
Between 2010 and 2019, a total of 4,090 individuals tested positive for HIV on an IME conducted in Canada, at an average of 409 per year (range: 210–696) (Figure 7). A total of 1,188 migrants tested positive for HIV through an IME in 2019. Of these cases, 52.7% (n=626) cases were tested in Canada and 47.3% (n=562) were tested overseas prior to their arrival in Canada.
Figure 7: Number of migrants who tested positive for HIV during an Immigration Medical Exam conducted in Canada, 2010–2019
Text description: Figure 7
Figure 7: Number of migrants who tested positive for HIV during an Immigration Medical Exam conducted in Canada, 2010–2019
| Year of test | Number of HIV-positive immigration applications |
|---|---|
| 2010 | 231 |
| 2011 | 210 |
| 2012 | 243 |
| 2013 | 422 |
| 2014 | 345 |
| 2015 | 350 |
| 2016 | 418 |
In 2019, of the applicants tested in Canada, a slightly higher proportion of men (54.6%) than of women tested positive on an IME. Those in the 30 to 39-year age group had the highest proportion of positive tests (36.1%), followed by those in the 40 to 49-year age group (26.8%). HIV-positive applicants younger than 29 years old accounted for 22.2% of the total, whereas those in the 50-year-plus age group only accounted for 14.9% of HIV-positive applicants tested in Canada. The majority of in-Canada HIV-positive applicants were in Ontario (57.0%) and Québec (24.6%). Among the HIV-positive applicants tested in Canada, 65.7% were from an HIV-Endemic country.
In 2019, IRCC public health notifications were most commonly sent to Ontario (35.7%), Québec (28.0%), Alberta (18.9%) and British Columbia (8.4%).
Canadian Perinatal HIV Surveillance Program
According to CPHSP, 250 infants were perinatally exposed to HIV in Canada in 2019. One infant tested positive for HIV in 2019. This infant was asymptomatic and born from a mother who did not receive antepartum or intrapartum ART prophylaxis. Since 2012, there have been an average of 250 perinatal exposures per year (range: 217–268) with an average of 5.5 confirmed infections per year (range: 1–12). The trend in proportion of HIV-positive mothers receiving ART each year has been increasing since 2015 (93.5%), with 96.2% receiving ART in 2018 and 98.0% in 2019.
The most commonly reported exposure category for HIV-positive mothers in 2019 continued to be heterosexual contact (77.0%), followed by injection drug use (16.7%). The most commonly reported maternal race/ethnicity was Black (58.4%). This was followed by mothers identifying as Indigenous (20.4%) and White (13.2%). Most HIV-positive mothers were of African (48.0%) or North American (34.8%) origin.
Discussion
Altogether 2,122 HIV diagnoses were reported in 2019 in Canada, and the national diagnosis rate was 5.6 per 100,000 population. Over the past decade, the rates have remained stable over time, with some minor fluctuations. The 2019 diagnosis rate was slightly lower than that in 2018; more time and data are needed to determine whether this decrease is the beginning of a continuing trend.
A total of 1,188 migrants tested positive for HIV on an IME in 2019. Of these cases, 52.7% cases were tested in Canada and 47.3% were tested overseas prior to their arrival in Canada. There were 250 infants perinatally exposed to HIV in Canada in 2019. The one documented perinatal HIV transmission was related to a mother who did not receive antepartum or intrapartum ART prophylaxis.
As in previous years, gbMSM remained the largest proportion of new HIV diagnoses and accounted for over half of adult male cases (56.2%) in 2019. A slight decrease has been noted in rates among males overall since 2016 and in HIV diagnoses among gbMSM since 2017. This decrease in rates in males overall coincides with Health Canada's approval of PrEP, and may reflect the impact of this new HIV prevention technology in this population. This trend echoes that seen in other developed countries, including Australia and the United Kingdom Footnote 14 Footnote 15. In Australia, there has been a decrease of 25.4% in HIV diagnosis among gbMSM since 2016. In the United Kingdom, there has been a decrease of 47.1% since 2014, a change attributed to a significant decline in HIV diagnoses among gay and bisexual men. As PrEP uptake increases in eligible populations, further reductions in HIV diagnosis may be expected.
The decrease in HIV diagnosis in Canada was not as great as that seen in other countries. This indicates that more can be done to increase awareness and use of PrEP. Based on the results of a 2017 survey of gbMSM in Canada, 51.7% of participants reported that they were likely to use PrEP if affordable and available, and only 8.4% were using PrEP at the time of the survey Footnote 16.
The rates of diagnosis in females have increased slightly since 2015. This trend coincides with increasing cases of infectious syphilis in women Footnote 17. These overall trends suggest increases in substance use, injection drug use and prevalence of STBBIs in some networks of women at risk for STBBI. These trends also provide additional support for the integrated national approach articulated by the Government of Canada's framework Footnote 4 to reduce the health impact of STBBIs in Canada in key populations affected by overlapping epidemics (i.e. syndemics) Footnote 18. This increase in rates among women was not observed in other developed countries where information was available. In fact, the rates among women decreased in the United States between 2014 and 2018, with the exception of a slight increase (8%) since 2014 in case counts in women who inject drugs Footnote 19. Likewise, in Australia, the rates of HIV diagnoses in females decreased slightly since 2017 Footnote 14, while the United Kingdom has shown a consistent annual decrease in new HIV diagnoses counts in females since 2010 Footnote 15.
Nearly one-fourth of HIV diagnoses in 2019 were attributed to Indigenous peoples, indicating an overrepresentation of this population in Canadian HIV data. Given that only a limited number of jurisdictions report Indigeneity, these proportions are likely biased. However, it is clear that Indigenous peoples are overrepresented among those living with HIV. New estimates, which rely on HASS data, along with other sources of data indicate that infections among Indigenous people represented 14% of all new infections in 2018, whereas Indigenous people represented only 4.9% of the total Canadian population Footnote 2.
Data from IRCC indicate that while the proportion of migrants with positive HIV test results on their IME has remained relatively stable in recent years, the overall number of people migrating to Canada has increased. However, the number of HIV diagnoses identified through IMEs does not necessarily reflect new HIV cases in Canada. Some migrants who tested HIV positive in overseas IMEs may not arrive in Canada, and those identified during in-Canada IMEs may already be accounted for in provincial/territorial reports. Furthermore, it would be difficult to ascertain the timing of HIV acquisition of the 626 migrants who tested positive during in-Canada IMEs in 2019. More information is needed to better understand the epidemiology of HIV among new Canadians, particularly among those from HIV-endemic countries.
In 2019, there were 250 infants perinatally exposed to HIV in Canada. One mother-to-child HIV transmission was confirmed in a mother who did not receive antepartum or intrapartum ART. Over the years, important mitigation measures have been taken in Canada to prevent mother-to-child HIV transmission. These include an increased access to antenatal care, routine HIV screening of pregnant women and availability of treatment for HIV-positive mothers. Nevertheless, missed opportunities for prevention continue to occur, primarily in vulnerable populations, leading to a small number of perinatal infections Footnote 20.
Despite advances in the prevention, diagnosis and treatment of HIV, HIV and other STBBIs remain a significant health concern in Canada. Surveillance data, such as those presented in this report, are a key component in understanding the burden of STBBI in Canada and to monitor Canada's progress toward the stated goals of the framework Footnote 4.
Strengths and limitations
The main strength of this report is that it is the only source of national epidemiological data on all reported HIV diagnoses in Canada. It also incorporates data on HIV diagnoses among migrants to Canada and perinatal transmission of HIV, which help build a more complete picture of the state of HIV in Canada.
Limitations of HASS have been described previously Footnote 10 Footnote 12 and are common to most surveillance systems. While it is difficult to ascertain the factors that may contribute to noted fluctuations, changes in reporting practices by provincial and territorial health authorities may have had an impact.
The low completion rate of data elements related to the race/ethnicity and exposure setting of new HIV cases, and the resulting potential biases in the available data, create difficulties in making inferences about the factors that influence HIV transmission in Canada. PHAC continues to work with its surveillance partners to enhance the collection of data elements including race/ethnicity information.
As reported by Popovic et al.Footnote 21, HIV cases reported by provinces and territories through routine surveillance mechanisms may have been previously diagnosed, either in another Canadian jurisdiction or in another country; such cases affect observed trends in HIV diagnosis rates. Therefore, it is important to understand the overall burden of HIV infection in people currently living in Canada.
Conclusion
The data in this report are considered provisional and may be subject to change in future HIV surveillance reports. If discrepancies exist between the data summarized in this report and provincial and territorial reports, the most recent provincial and territorial report should be used.
Authors' statement
- NH — Conceptualization, research, writing, original draft, final draft, review, editing, data validation, visualization, supervision
- AW — Data validation, original draft, editing, research
- AR — Data management, data validation, research
- ST — Review, editing
Competing interests
None.
Acknowledgements
The Public Health Agency of Canada (PHAC) would like to acknowledge the following individuals from the provincial and territorial HIV/AIDS programs for their contribution and participation: S Fathima, Alberta Health; A O'Brien, Alberta Health; J Wong, Clinical Prevention Service, Surveillance and Epidemiology, BC Centre for Disease Control; C Loeppky, Manitoba Health; R RaaFat Gad, New Brunswick Department of Health; S Landsburg, New Brunswick Department of Health; S Wertz, New Brunswick Department of Health; B Halfyard, Department of Health and Community Services, Newfoundland and Labrador; M O'Driscoll, Department of Health and Community Services, Newfoundland and Labrador; H Hannah, Department of Health and Social Services, Northwest Territories; B Billard, Nova Scotia Department of Health and Wellness; S Fleming, Nova Scotia Department of Health and Wellness; K Kullerperuma, Nunavut Department of Health; A Kroch, Ontario Treatment Network; J Liu, Public Health Ontario; Dr. M Murti, Public Health Ontario; Dr. M. Cameron, Prince Edward Island Department of Health and Wellness; C Cheverie, Prince Edward Island Department of Health and Wellness; R Bitera, Direction des risques biologiques et de la santé au travail, Institut national de santé publique du Québec; PH Minot, Direction des risques biologiques et de la santé au travail, Institut national de santé publique du Québec; B Serhir, Laboratoire de santé publique du Québec, Institut national de santé publique du Québec; D Sylvain, Laboratoire de santé publique du Québec, Institut national de santé publique du Québec; H Bangura, Saskatchewan Ministry of Health; J Manalo, Saskatchewan Ministry of Health; L Strudwick, Yukon Communicable Disease Control; S Plitt, PHAC, Alberta; E Wong, PHAC, British Columbia; J Paul, PHAC, Manitoba; A Sullivan, PHAC, Ontario; T Schellenberg, PHAC, Saskatchewan; M Nichols, PHAC, Nova Scotia; A Bitnun and L Sauvé, Canadian Perinatal HIV Surveillance Program (CPHSP); C Rank, A Grundy and C Nwoke, Immigration, Refugees and Citizenship Canada (IRCC).
Funding
This work was supported by the Public Health Agency of Canada as part of its core mandate.
Appendix: List of supplementary tables
These tables are available upon request at: phac.hass.aspc@canada.ca.
Table S1: HIV diagnosis rate (per 100,000 population) by province/territory and year of diagnosis (all ages)
Table S2: Number of HIV cases (all ages) by province/territory, sex and year of diagnosis–Canada, 1985–2019
Table S3: Number of HIV cases by age group and province/territory–Canada, 2018–2019
Table S4: Cumulative number of HIV cases among adults (≥15 years old) and children (<15 years old) by sex–Canada, 1985–2019
Table S5: Number of HIV cases among adults (≥15 years old) by year of diagnosis and sex–Canada, 1985–2019
Table S6: Number of cases and HIV diagnosis rate by age group, sex and year of diagnoses–Canada, 1985–2019
Table S7: Number and percentage distribution of HIV cases among adults (≥15 years old) by exposure category and year of diagnosis–Canada, 1985–2019
Table S8: Number and percentage distribution of HIV cases among adult males (≥15 years old) by exposure category and year of diagnosis–Canada, 1985–2019
Table S9: Number and percentage distribution of HIV cases among adult females (≥15 years old) by exposure category and year of diagnosis–Canada, 1985–2019
Table S10: Number and percentage distribution of HIV cases among adults (≥15 years old) by exposure category and age group–Canada, 2018–2019
Table S11: Number and percentage distribution of HIV cases among children (<15 years old) by exposure category and year of diagnoses–Canada, 1985–2018
Table S12: Number of HIV cases by exposure category and province/territory–Canada, 2018–2019
Table S13: Number and percentage distribution of immigration applicants to Canada diagnosed with HIV as a result of an Immigration Medical Exam by year–2002–2019
Table S14: Number and percentage distribution of immigration applicants to Canada diagnosed with HIV as a result of an Immigration Medical Exam by sex, age group and province–2012–2019
Table S15: Number of perinatally HIV-exposed infants by year of birth, current status and use of antiretroviral therapy for prophylaxis–Canada, 1984–2019
Table S16: Number of perinatally HIV-exposed infants by maternal exposure category and year of infant birth–Canada, 1984–2019
Table S17: Number of perinatally HIV-exposed infants by ethnic status and infection status–Canada, 1984–2019
Table S18: Number of perinatally HIV-exposed infants by maternal country of birth and infection status–Canada, 1984–2019
Table S19: Number of perinatally HIV-exposed infants by geographic region and status at last report–Canada, 1984–2019
Table S20: International statistics on reported HIV cases–Canada, 2018
