
Use of an online Foodbook sub-study, February to April 2015

 Download this article as a PDF
Published by: The Public Health Agency of Canada
Issue: Volume 47-01: Foodborne and Animal Contact Disease Outbreaks
Date published: January 2021
ISSN: 1481-8531
Submit a manuscript
About CCDR
Browse
Volume 47-01, January 2021: Foodborne and Animal Contact Disease Outbreaks
Survey
The use of an online survey for collecting food exposure information, Foodbook sub-study, February to April 2015
Christine Gardhouse1, Matt Hurst1, Sujani Sivanantharajah1, Nadia Ciampa1
Affiliation
1 Public Health Agency of Canada, Guelph, ON
Correspondence
Suggested citation
Gardhouse C, Hurst M, Sivanantharajah S, Ciampa N. The use of an online survey for collecting food exposure information, Foodbook sub-study, February to April 2015. Can Commun Dis Rep 2021;47(1):23–9. https://doi.org/10.14745/ccdr.v47i01a05
Keywords: online survey, convenience sample, food exposures, foodborne illness, outbreak investigations, telephone survey
Abstract
Background: During foodborne illness outbreak investigations, comparing food exposure frequencies of cases to those of a control population can help identify suspect food sources. The Public Health Agency of Canada (PHAC) conducted an online survey between February and April 2015 to collect seven-day food exposures from a convenience sample. The study period overlapped with a national, population-based exposure survey being conducted via telephone using random digit dialling. A subset of the food exposure questions from the telephone-based survey was included in the online survey.
Objective: The online survey study objectives were to: 1) describe the survey methodology, survey respondents and response behaviour; and 2) determine if the online methodology is an appropriate alternative to telephone surveys by comparing food exposures.
Methods: The online survey link was distributed via email to employees and public health partners, and was promoted on the PHAC website and social media channels.
Results: In total 2,100 surveys were completed. The majority of respondents were female, with high income and education, aged 30 to 39 years. The proportion reporting consuming the food items in the online survey was generally higher than those reported in the telephone survey, with a mean difference of 6.0% (95% CI: 4.2, 7.8).
Conclusion: In an outbreak investigation, the 6.0% bias could make it more difficult to detect a difference between the case and control food exposures. Nevertheless, given the speed of response and lower resource expenditure of online surveys as well as the willing, able and convenient sample, a bias of 6.0% is considered small enough to be acceptable for future surveys.
Introduction
During investigations of foodborne illness outbreaks, comparing frequencies of exposures of cases to those of a control population can help identify suspect food sources. Using existing population-based exposure data as "control" data is a useful alternative to traditional case-control studiesFootnote 1. Typically, telephone surveys are used to obtain exposure data Footnote 2, but as they are resource intensive and not timely, exploring alternative ways of acquiring and updating exposure data is necessary.
Online surveys have been increasingly used to collect data for research purposes in recent years. Online surveys require fewer resources and less time to implement than traditional telephone survey methods. They also provide a faster response and greater access to harder-to-reach groups Footnote 3 Footnote 4 Footnote 5 Footnote 6. On the other hand, the use of online surveys may result in sampling bias and, if a fixed sampling frame is not in place, it may be difficult to track non-response rates Footnote 7 Footnote 8. Online surveys could potentially be utilized to complement telephone surveys for data collectionFootnote 3 Footnote 5. However, assessing the most appropriate sampling frame to use given the impact on results is an important consideration.
Given the rapid administration and low costs of online surveys, the Public Health Agency of Canada (PHAC) sought to assess their potential use in collecting food exposure control information for enteric disease outbreak situations. To compare the results obtained by these two modes of data collection, PHAC conducted an online survey, using a convenience sample, alongside a larger, national, population-based exposure survey conducted via telephone. This is a common approach to evaluating effectiveness Footnote 9 Footnote 10 Footnote 11 Footnote 12.
The study's objectives were to: 1) describe the survey methodology, survey respondents and response behaviour; and 2) determine if the online methodology used, including the sampling frame, is an acceptable alternative to telephone-based surveys by comparing food exposures.
Methods
Telephone Foodbook survey: Baseline
The national, population-based telephone Foodbook survey was the gold standard used to evaluate the online survey as a method of capturing food exposure information. The telephone Foodbook survey was conducted between April 2014 and April 2015 in all Canadian provinces and territories. The survey included questions about food, water and animal exposures over the past seven days. The telephone-based survey had a robust sampling frame and weighting scheme, making it the ideal comparator. For more details on the methodology used, please refer to the Foodbook Report Footnote 2.
The Foodbook study was approved by Health Canada and the Public Health Agency of Canada's Research Ethics Board (REB 2013-0025) and the Newfoundland and Labrador Health Research Ethics Authority (HREB 13.238).
Online Foodbook survey
The online survey was designed as a sub-study of the overall Foodbook study for the purpose of evaluating the online-based methodology. To help with this comparison, the timeframe overlapped with the telephone Foodbook survey.
The study population for the online survey included Canadian residents aged 16 years and older (or 18 years and older in Québec), who had not travelled outside of their province or territory of residence in the past seven days. The online survey was launched February 24, 2015, and closed April 10, 2015, with participants recruited using a convenience sample.
Similar to the telephone survey, the online survey included questions about respondent demographics and food exposures. Demographic data collected included age, sex, province/territory of residence, education and income. Only a subset of food exposure questions were included in the online survey (i.e. 168 food items) to reduce survey completion time to under 10 minutes and maximize the response rate. The online survey was created using FluidSurveys and was available in both English and French.
Sampling technique
In an outbreak situation, obtaining timely "control" data is essential. A convenience sample is a useful source of such data. The research team implemented various methods to promote the survey and recruit respondents: initial survey promotion via email to internal team members (approximately 40 employees); distribution through a daily, newsletter-type email to all PHAC and Health Canada employees (approximately 13,800 employees); and email to provincial/territorial public health stakeholders. Recruitment expanded via snowball sampling, that is, requesting recipients to forward the invitations to others. The survey was also promoted via PHAC social media (Facebook and Twitter) and banner advertising on the PHAC website. Overall, the sampling frame included Health Canada and PHAC employees, public health and epidemiologist stakeholder groups (local, provincial/territorial, federal) and the general public.
The survey included Canadian residents older than 16 years (or older than 18 years in Québec) who had not travelled outside of their province or territory of residence in the past seven days. Proxy responses were not allowed. The inclusion criteria for the two survey modes were identical other than the age groups and use of proxies.
Participants were asked if they consented to the collection and use of data for the purpose of helping public health professionals investigate illnesses and outbreaks. Individuals who responded "Yes" proceeded to the next phase of the survey.
Some of the non-random elements of the sample collection scheme were corrected by developing a survey weight. Weights were developed for each sex and provincial combination using population totals from the 2011 Census.
Analysis of survey response, respondent demographics and food exposures
The analyses conducted included: 1) assessment of survey response based on recruitment/referral method; 2) description of respondent demographics for both online and telephone surveys; and 3) comparison of food exposure frequencies between telephone and online surveys.
To assess the impact of the various recruitment methods on online survey response, all completed surveys over the entire study period were included for the initial analysis.
Due to low response rates for individuals aged 16 to 19 and 65 years and older, as well as among those living in the territories, and to ensure sufficient sample size for comparison purposes, the unit of analysis, or sample population, was refined for further analyses. The Foodbook online survey group used in subsequent analyses included those aged 20 to 64 years residing in the Canadian provinces, with data collection between February 24 and March 24, 2015.
The comparison Foodbook telephone survey group was composed of the same age group and geography, though it had a wider timeframe of February 10 to April 7, 2015. The wider timeframe (two additional weeks on either side of the dates of the online survey group) was selected to increase the sample size and improve the detection of differences between the groups in the two surveys.
To evaluate the accuracy of the online survey method, food consumption proportions from the Foodbook online survey were compared to the Foodbook telephone survey for the same geographic area (Canadian provinces) and age of respondents (aged 20–64) and similar time window.
Analysis was conducted using STATA version 13.1 (StataCorp LP, College Station, Texas, United States). Descriptive analysis was conducted to assess survey response and respondent demographics. Food exposure comparisons were conducted by analyzing mean differences in the weighted exposure proportions in the online versus the telephone survey group and testing of results to determine statistical significance in observed differences using adjusted Wald tests. After weighted proportions were calculated using svy: proportion, the overall mean difference between these proportions was calculated using the lincom command, which provides 95% confidence intervals (CIs) and the p value. The effect of income and education on the mean difference was explored by post-stratifying on these factors.
Results
Survey response
The soft launch of the survey on February 24, 2015, included a link on the PHAC website (via a banner) and an email sent to a short-list of employees. On February 25, 2015, all Health Canada (n=12,000) and PHAC (n=1,800) employees were notified via email through the organizations' daily internal newsletter. The response rate for this method was 4.6%. On February 26, 2015, the survey was promoted via PHAC's Facebook and Twitter channels, with subsequent re-sharing and re-tweeting of the posts. During the social media campaign period (between February 26 and April 10, 2015), there were 2,777 page views for the Foodbook survey webpage, with 33% of all traffic coming from Facebook or Twitter. The most successful enrolment method-the email invitations sent out to the provinces and territories on March 2, 2015, and the subsequent invitations sent out to provincial/territorial public health group listservs and other distribution channels-generated over 1,000 completions, comprising approximately 48% of the total responses.
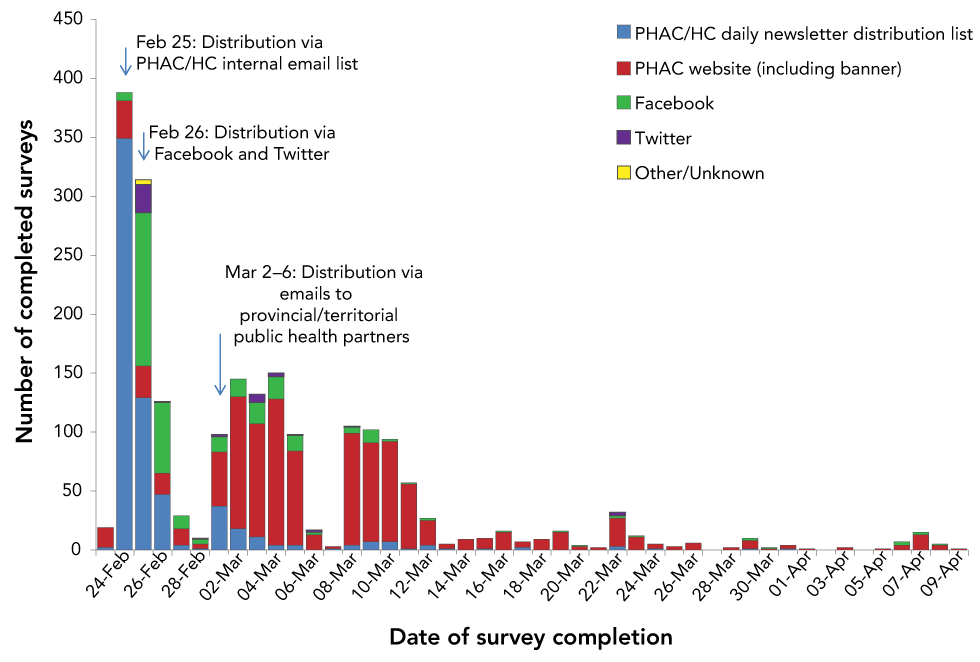
By the end of the campaign (February 24 to April 10, 2015), 2,612 surveys had been submitted. Of these, data for 512 respondents were excluded from further analysis because they did not give consent (n=35), did not meet the inclusion criteria (n=276) or did not complete the survey (n=201). Over three-quarters of respondents (n=2,100; 80%) completed the survey in full. Of those that completed the survey, the majority were referred to the survey via emails sent to stakeholders (which included a link to the Foodbook survey webpage) (n=1,016; 48%), followed by the internal PHAC/Health Canada daily newsletter distribution group who received a direct link to the survey (n=639; 30%), Facebook (n=326; 16%), PHAC website (n=70; 3%), Twitter (n=44; 2%) and other/unknown (n=5; <1%) (Figure 1). Because of the snowball approach used to recruit respondents, it was not possible to capture the full extent of survey promotion and distribution.
Figure 1: Number of surveys by date of completion based on the method of referral to the online survey (n=2,100)
Text description: Figure 1
Figure 1: Number of surveys by date of completion based on the method of referral to the online survey (n=2,100)
The graph shows the number of surveys by date of completion based on the method of referral to the online survey (n=2,100). The survey was launched on February 24, 2015, which included a link on the PHAC website (via a banner) and an email sent to a short-list of employees. On February 25, 2015, the survey invitation was distributed via email to all Health Canada and PHAC employees through their daily internal newsletter. On February 26, 2015, the survey was promoted via PHAC's Facebook and Twitter channels. Email invitations were sent out to provincial/territorial public health partners on March 2, 2015, with subsequent invitations sent out to provincial/territorial public health group listservs and other distribution channels. The survey closed on April 10, 2015.
The average time for survey completion was approximately 17 minutes (median: approximately 9 minutes).
Online and telephone survey group respondent demographics
The results presented refer to the "online survey group," that is, the 20 to 64-year old participants living in the provinces who completed the survey between February 24 and March 24, 2015 (n=1,954), and the "telephone survey group" with survey completions between February 10 and April 7, 2015 (n=395).
Although the distribution of male and female participants in both the online and telephone survey groups was similar, the age group distributions differed (Table 1). The largest proportion of participants in the online survey group were the 30 to 39-year olds (34.6%), and in the telephone survey group, the 50 to 64-year olds (48.0%). The geographic distribution of participants was similar across the survey methods. The online survey group generally had a higher income and a higher level of education than the telephone survey group.
| Characteristics | Online participants | Telephone participants | p-value | ||
|---|---|---|---|---|---|
| Raw counts (n) | Weighted proportion (%) | Raw counts (n) | Weighted proportion (%) | ||
| Sex | |||||
| Men | 278 | 49.1 | 150 | 56.5 | 0.155 |
| Women | 1,676 | 50.9 | 245 | 43.5 | 0.155 |
| Age group, years | |||||
| 20–29 | 369 | 16.5 | 28 | 6.3 | 0.000 |
| 30–39 | 643 | 34.6 | 43 | 19.5 | 0.000 |
| 40–49 | 437 | 22.2 | 69 | 26.2 | 0.499 |
| 50–64 | 505 | 26.8 | 255 | 48.0 | 0.000 |
| Respondents by provinceTable 1 footnote a | |||||
| British Columbia | 211 | 13.6 | 48 | 9.2 | 0.067 |
| Alberta | 104 | 11.1 | 47 | 9.3 | 0.441 |
| Saskatchewan | 114 | 3.0 | 36 | 3.4 | 0.697 |
| Manitoba | 163 | 3.5 | 33 | 2.1 | 0.037 |
| Ontario | 818 | 37.8 | 75 | 42.4 | 0.429 |
| Québec | 389 | 23.9 | 70 | 26.8 | 0.540 |
| New Brunswick | 15 | 2.3 | 25 | 3.0 | 0.543 |
| Nova Scotia | 37 | 2.8 | 27 | 2.4 | 0.599 |
| Prince Edward Island | 56 | 0.4 | 17 | 0.35 | 0.766 |
| Newfoundland and Labrador | 47 | 1.6 | 17 | 1.0 | 0.224 |
| Respondents by income level ($) | |||||
| Less than $30 000 | 73 | 4.3 | 51 | 8.4 | 0.028 |
| $30 000 or more, but less than $60 000 | 232 | 12.0 | 106 | 33.5 | 0.000 |
| $60 000 or more, but less than $80 000 | 280 | 16.7 | 62 | 16.8 | 0.985 |
| $80 000 or more | 1,150 | 67.0 | 138 | 41.4 | 0.000 |
| Respondents by education level | |||||
| Less than high school diploma or equivalent | 8 | 0.3 | 34 | 4.8 | 0.000 |
| High school diploma or a high school equivalency | 98 | 5.5 | 90 | 15.9 | 0.002 |
| Trade certificate or diploma | 59 | 3.6 | 19 | 4.8 | 0.538 |
| College, CEGEP or other non-university certificate or diploma | 288 | 14.6 | 97 | 25.3 | 0.017 |
| University certificate or diploma below the Bachelors level | 93 | 5.4 | 29 | 10.8 | 0.078 |
| Bachelor's degree | 610 | 33.6 | 71 | 28.9 | 0.464 |
| University certificate, diploma or degree above the Bachelor's level | 653 | 36.9 | 39 | 9.5 | 0.000 |
Exposure comparisons: Foodbook online survey versus telephone survey group results
Food exposures reported by online and telephone survey participants were compared across 168 food items. The difference in the weighted proportions for the food items ranged from 28.6 (spinach) to −9.4 (cauliflower), with a median of 4.6. Overall, the mean difference in consumption proportions was 6.0% (95% CI: 4.2%, 7.8%), with higher proportions more often reported by the online survey respondents. For foods with over 50% of telephone survey participants reporting consumption (i.e. commonly consumed foods), the mean difference in consumption proportions between the online and telephone survey was 6.8%. Table 2 lists the top 10 food items where the largest differences were identified between the two groups. Of the food items with the largest observed differences, 50% were vegetables.
| Food category | Food item | Weighted proportions | Difference between online and telephone participants | p-value | |
|---|---|---|---|---|---|
| Online participants | Telephone participants | ||||
| Top ten food exposures where online survey group participants reported higher than telephone participants | |||||
| Vegetables | Spinach | 56.3 | 27.7 | 28.6 | 0.000 |
| Vegetables | Lettuce on a sandwich | 50.2 | 25.3 | 24.9 | 0.000 |
| Herbs and spices | Curry powder | 37.9 | 14.4 | 23.5 | 0.000 |
| Vegetables | Mesclun greens | 43.3 | 20.5 | 22.8 | 0.000 |
| Vegetables | Cherry or grape tomatoes | 48.0 | 25.3 | 22.7 | 0.000 |
| Cheese | Mozzarella | 65.2 | 44.1 | 21.1 | 0.000 |
| Nuts and seeds | Peanut butter | 67.2 | 46.7 | 20.5 | 0.000 |
| Beef | Beef hamburgers from a restaurant or fast food establishment | 31.3 | 11.4 | 19.9 | 0.000 |
| Poultry | Chicken pieces or parts | 81.5 | 62.1 | 19.4 | 0.001 |
| Vegetables | Packaged lettuce | 69.8 | 51.3 | 18.5 | 0.001 |
| Top ten food exposures where online survey group participants reported lower than telephone participants | |||||
| Vegetables | Cauliflower | 35.7 | 45.1 | -9.4 | 0.102 |
| Vegetables | Iceberg lettuce | 42.8 | 48.2 | -5.5 | 0.345 |
| Vegetables | Bean sprouts | 7.1 | 12.4 | -5.3 | 0.090 |
| Vegetables | Sprouts | 11.8 | 16.7 | -5.0 | 0.171 |
| Herbs and spices | Fresh Thai basil | 4.7 | 9.0 | -4.3 | 0.182 |
| Fish and seafood | Fish (e.g. cooked trout or salmon) | 63.7 | 67.3 | -3.6 | 0.429 |
| Beef | Stewing beef | 21.4 | 25.0 | -3.6 | 0.562 |
| Dairy | Any raw dairy | 6.2 | 9.0 | -2.8 | 0.320 |
| Vegetables | Hothouse tomatoes | 42.4 | 45.0 | -2.6 | 0.653 |
| Deli-meat | Bologna | 4.5 | 7.1 | -2.6 | 0.165 |
Discussion
Survey response
The timeliness of responses varied based on the recruitment approach used. The two approaches that garnered the most immediate responses were the internal newsletter distribution via email to PHAC/Health Canada employees and the social media posting on Facebook. The bulk of the response to the internal newsletter distribution occurred within three days, with most on the day of release, suggesting that it is an excellent platform for gathering time-sensitive information. The response from the social media posting on Facebook was also timely, with most completions within two days. The survey invitations sent via email to the provinces and territories, although accounting for the largest proportion of respondents, took approximately two weeks for the full effect, likely due to the snowball approach used.
Our results show that implementing all three approaches simultaneously could potentially result in 1,600 or more survey completions within five business days. This would be the recommended course of action for time-sensitive outbreak investigations.
Respondent demographics
Weighted results indicated that respondents from each province were similarly represented in the online and the telephone survey (Table 1). This was expected, as the weights were designed to correct for over or under-represented provinces. More importantly, given that previous research has shown that there can be disparities in income and education distributions when using online versus telephone survey methods Footnote 13, the research team compared the income and education in the online and the telephone surveys and found that they differed. The online survey had more respondents with higher incomes and higher education status than the telephone survey. This likely reflected the sampling frame, which included a large proportion of government employees and public health professionals.
Exposure comparisons
The second objective of this study was to determine how an online survey performs, compared to a traditional telephone survey, when measuring food exposure proportions for the population. The research team assessed the concordance in results between the two methods by comparing the weighted food exposure proportions of the online survey with those from the telephone survey.
The proportion of those consuming the food items in the online survey tended to be higher than in the telephone survey. When looking at the difference in the exposure proportions from the two surveys, both higher and lower differences were found, reflecting the sampling variation in both surveys. The top ten largest differences where proportions were higher in the online survey than the telephone survey were all statistically significant; the reverse situation, where proportions were lower in the online survey than in the telephone survey, were not significant. If sampling variation alone were at play, then the overall mean of the consumption proportions would be no different between the surveys. However, the mean difference is 6.0% (95% CI: 4.2%, 7.8%), with the higher proportions more often reported by the online survey respondents, suggesting that there was a general trend for the online survey respondents to be more likely to answer that they had eaten a particular food in the past seven days. Other work has indicated that online surveys, which use questions with two response categories requesting facts as opposed to opinions, have results matching well to the telephone survey Footnote 11.
It is apparent that differences exist between the online and telephone survey modes. Online surveys are self-administered (rather than administered by an interviewer), and the questions are presented visually, in writing (rather than asked verbally), both factors that may affect the results. In addition, as Potoglou et al. found Footnote 5, there is potentially a greater willingness to be honest given the anonymity of an online survey. However, it is also possible that given that an online survey is self-administered, accountability could be decreased and the ease of responding "yes" could be increased. Respondent fatigue may also impact a participant's behaviour in responding, although this may be a factor for both the telephone and the online survey, depending on length. All these factors may have contributed to the overall mean differences between the survey modes.
Another possible explanation for the bias is the distributional effect from having more people with high income or higher education completing the online survey. This was explored further by comparing the online survey group results after stratification by income and education to the same post-stratified results in the telephone survey group. No discernable pattern or trend was found in the types of foods consumed for either income or education. Also, the positive overall bias in the online survey results was still present.
Potential use in outbreak investigations
The 6.0% bias means that proportions calculated from a similar online survey would be larger, on average, than from a telephone survey, which would result in a larger denominator in a case-control odds ratio, resulting in a smaller overall odds ratio. This has the potential to make it more difficult to detect a difference between the case and control food exposure proportions. For more commonly consumed foods (i.e. those with over 50% consumption using the telephone survey results), the difference does not appreciably increase (i.e. 6.8% vs 6.0%). Although commonly consumed foods would already be harder to detect as potential sources or risk factors (in an odds ratio), the 6.8% bias (versus 6.0%) is not considered to be large and would not adversely affect the analysis in most situations.
Limitations
Despite the overall success of the Foodbook online survey in terms of survey response and general comparability of exposure proportions with those of the telephone survey, the convenience sampling strategy used lent itself to potential bias, with certain demographic populations (i.e. females, high income and high education) being over-represented. Also, the online survey recruitment methods did not result in enough responses from the territories, and those younger than 20 or 65 years and older. It is also important to note that in considering limitations and appropriateness of the online survey compared to the telephone survey, the use of a telephone survey also has drawbacks, as it is an increasingly outdated mode of data collection and resource intensive.
Conclusion
Overall, given the speed and lower resource expenditure for the online Foodbook survey using a convenience sampling method, as well as the willing, able and convenient sample, a bias of 6.0% is considered small enough to be acceptable for surveys where timeliness is a key requirement. In addition, given the growing popularity and preference of using online surveys as a data collection tool, which is expected to continue growing, using the online mode of data collection, in concert with other techniques that improve the representativeness of the sampling frame, is also worth exploring for future surveys that seek to be the new gold standard.
Authors' statement
- CG — Conceptualization and implementation of study, conceptualization, drafting and/or revising the paper
- MH — Conceptualization, analysis and interpretation of data, drafting and/or revising the paper
- SS — Conceptualization, analysis and interpretation of data, drafting and/or revising the paper
- NC — Assisted with implementation of study, conceptualization, drafting and/or revising the paper
Competing interests
None.
Acknowledgements
The authors thank the Outbreak Management Division and Food-Borne Disease and Antimicrobial Resistance Surveillance Division (Centre for Foodborne, Environmental and Zoonotic Infectious Diseases, Public Health Agency of Canada), as well as provincial and territorial epidemiologists for their assistance with the Foodbook project. The authors also thank L Guarna and the Digital Communications team (Communications and Public Affairs Branch, Health Canada) for their assistance with Communications and web-related aspects of the online survey. Finally, the authors thank J Cutler, A Kerr and S Connors for their involvement in the analysis and interpretation of findings for the online survey sub-study project.Funding
This work was supported by the Public Health Agency of Canada, as part of the overall Foodbook study project.
