
COVID-19 transmission using the IDMS epidemiological-modelling app

 Download this article as a PDF
Published by: The Public Health Agency of Canada
Issue: Volume 48-10, October 2022: Equity, Diversity and Inclusion in Public Health
Date published: October 2022
ISSN: 1481-8531
Submit a manuscript
About CCDR
Browse
Volume 48-10, October 2022: Equity, Diversity and Inclusion in Public Health
Implementation Science
Modelling COVID-19 transmission using IDSIM, an epidemiological-modelling desktop app with multi-level immunization capabilities
Eleodor Nichita1, Mary-Anne Pietrusiak2, Fangli Xie2, Peter Schwanke1, Anjali Pandya2
Affiliations
1 Ontario Tech University, Oshawa, ON
2 Durham Region Health Department, Whitby, ON
Correspondence
Suggested citation
Nichita E, Pietrusiak M-A, Xie F, Schwanke P, Pandya A. Modelling COVID-19 transmission using IDSIM, an epidemiological-modelling desktop app with multi-level immunization capabilities. Can Commun Dis Rep 2022;48(10):449–64. https://doi.org/10.14745/ccdr.v48i10a05
Keywords: COVID-19, compartmental epidemiological model, IDSIM app, vaccination levels, immunity waning, variants
Abstract
Background: The coronavirus disease 2019 (COVID-19) pandemic has placed unprecedented demands on local public health units in Ontario, Canada, one of which was the need for in-house epidemiological modelling capabilities. The objective of this study is to develop a native Windows desktop app for epidemiological modelling, to be used by public health unit epidemiologists to predict COVID-19 transmission in Durham Region.
Methods: The developed app is an implementation of a multi-stratified compartmental epidemiological model that can accommodate multiple virus variants and levels of vaccination, as well as public health measures such as physical distancing, contact tracing followed by quarantine and testing followed by isolation. It was used to investigate the effects of different factors on COVID-19 transmission, including vaccination coverage, vaccine effectiveness, waning of vaccine-induced immunity and the advent of the Omicron variant. The simulation start date was November 22, 2021.
Results: For the Delta variant, at least 90% of the population would need to be vaccinated to achieve herd immunity. A Delta-variant-only epidemiological curve would be flattened from the start in the absence of immunity waning and within six months in the presence of immunity waning. The percentage of infections caused by the Omicron variant was forecast to increase from 1% to 97% in the first month of the simulation. Total Omicron infections were forecasted to be reduced, respectively, by 26% or 41% if 3,000 or 5,000 booster doses were administered per day.
Conclusion: For the Delta variant, both natural and vaccination-induced immunity are necessary to achieve herd immunity, and waning of vaccine-induced immunity lengthens the time necessary to reach herd immunity. In the absence of additional public health measures, a wave driven by the Omicron variant was predicted to pose significant public health challenges with infections predicted to peak in 2–3 months from the start of the simulation, depending on the rate of administration of booster doses.
Introduction
On March 11, 2020, the World Health Organization declared the coronavirus disease 2019 (COVID-19) epidemic, caused by the severe acute respiratory syndrome coronavirus 2 (SARS-CoV-2), a pandemic. Like other affected countries, Canada and its provinces instituted emergency public health measures to control virus transmission, in the form of masking mandates, detection, isolation and quarantine, international travel restrictions, work from home, school and business closures and even stay-at-home orders Footnote 1. Some of these measures came at great economic cost and having an inordinately large number of infections was unacceptable due to the strain they would have placed on medical services. Therefore, it became very important to model the pandemic and to use model predictions to assess demands on the health system and to guide policy decisions around public health measures.
At the federal level, the Public Health Agency of Canada created a Canadian COVID-19 modelling network made up of federal, provincial, territorial and university-based modellers and epidemiologists Footnote 2. Modelling results were used to inform policies, guide public health action and communicate with the public.
In the Province of Ontario, the COVID-19 Modelling Consensus Table was created in March 2020 to bring together multiple groups of experts, health system leaders and senior decision makers and to generate consensus estimates based on multiple modelling results and expert opinions. Such estimates were used to inform policy decisions on public health measures, to communicate with the public, and to evaluate health system status and demands Footnote 3.
To model COVID transmission under different scenarios, a vast number of models were being developed in Canada and around the world using an array of software packages. For example, modelling efforts at the Public Health Agency of Canada resulted in the development of both compartmental Footnote 4 and agent-based models Footnote 5. The former was implemented using the Analytica software package, while the latter was implemented using the AnyLogic software package. Another compartmental model was developed by Tuite et al. Footnote 6 with the specific aim of modelling COVID transmission in Ontario. In Europe, a team centred at the University of Cambridge developed another compartmental model Footnote 7 and implemented it using a pre-packaged initial-value ordinary-differential solver developed in the Python programming language. Virtually all available models were focused on evaluating non-pharmaceutical interventions (e.g. testing and tracing, physical distancing). They did not have the ability to simulate the effect of vaccines, especially those administered in multiple doses, or the waning of vaccine-induced protection. Available models were also not convenient for individual public health units (PHUs) because they required familiarity with specific software packages used to implement them. In practice, this meant that a multidisciplinary team consisting of both epidemiologists and computational scientists was needed to correctly and efficiently use the models and corresponding software packages.
In the summer of 2020, as the province of Ontario was recovering from the first wave of COVID-19 infections, it became clear that a second wave was developing. Local PHUs were called upon to make forecasts about the future evolution of cases, estimate demands on hospitals and recommend public health interventions at a time when modelling resources, both computational and human, were scarce. Modelling results prepared at the national or provincial level by sizeable teams of epidemiologists and mathematicians were only partially applicable to local situations.
The Regional Municipality of Durham, which comprises areas to the east of Toronto and has a population of approximately 750,000, was facing challenges common to all Ontario PHUs. To alleviate the shortage of modelling resources, Durham Region Health Department established a collaboration with Ontario Tech University to develop in-house COVID-19 epidemiological modelling capabilities. The immediate objective was to create a model and software package in the form of a Windows desktop app to be used by staff epidemiologists for making forecasts and informing policy decisions without the need for high-performance computing systems or extensive training.
For simplicity and practicality, a dynamic compartmental (deterministic) model developed by the Public Health Agency of Canada Footnote 4 was initially adopted. This initial model consisted of seven compartments (susceptible, exposed, exposed quarantined, infectious, infectious isolated, hospitalized, and removed), and allowed for only one ancestral strain. It was implemented as a Modern Fortran (Fortran with object-oriented programming features) code with an Excel/Visual-Basic user interface. As variants emerged and vaccines became available, additional capabilities were added to the model and the implementation was switched to a native MS-Windows desktop app with a Modern Fortran computational backend. The app was named IDSIM (Infectious-Disease SIMulator). This work presents the (November 2021) IDSIM model and illustrates some of its capabilities by performing four simulations of COVID-19 transmission under different conditions.
Epidemiological model
The epidemiological model is a multi-stratified compartmental model that can accommodate multiple virus variants and levels of vaccination, as well as public health measures such as physical distancing, contact tracing followed by quarantine and testing followed by isolation.
Compartments and flowchart
The diagram of the epidemiological model is shown in Figure 1.
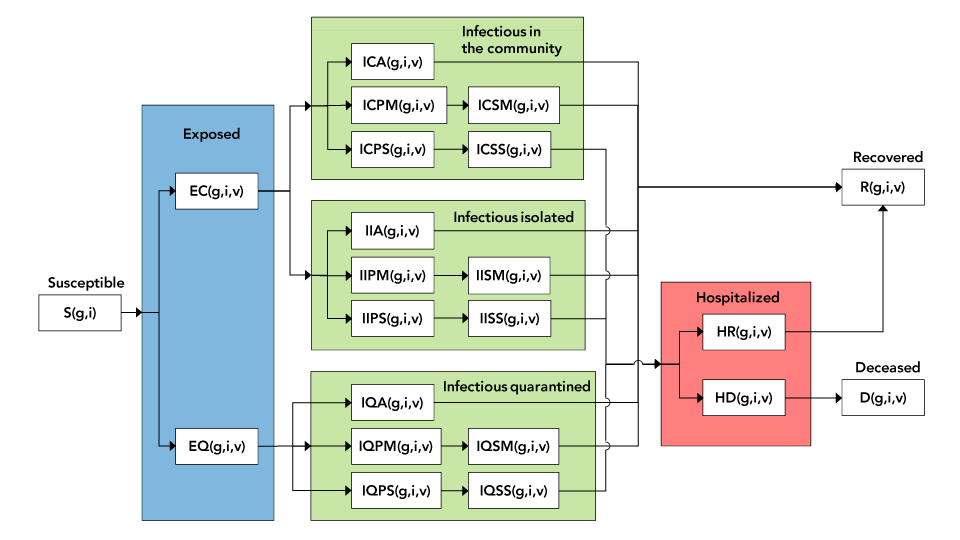
Figure 1 - Text description
The figure shows a detailed diagram of the compartmental model. The blue area covers all exposed individuals, be they quarantined or in the community. The green area covers all infectious individuals. The three separate rectangles refer respectively to infectious individuals in the community, tested and isolated, and quarantined. The pink area covers hospitalized individuals.
The population in each compartment is categorized by combined stratum (subscript g), immunization status (subscript i) and variant (subscript v). The differential equations governing transition from one compartment to another are presented in the Appendix.
Variants
The variant subscript v, applies to all compartments other than the one comprised of susceptible individuals.
Combined strata
Each combined stratum is a combination of strata corresponding to multiple stratifications. For example, if a particular population were stratified by age into two strata, those under 50 years and those 50 years and older, and by gender into two strata, female and male, then subscript g would take values between 1 and 4, corresponding to the four combined strata: females under 50 years, females 50 years and older, males under 50 years, and males 50 years and older.
Immunization status
The immunization status can have as many levels as necessary, identified by subscript i. For example, subscript i could take values between 1 and 5, with the following meanings: 1) not vaccinated; 2) first dose administered, first dose protection not yet achieved; 3) first dose protection achieved; 4) second dose administered, second dose protection not yet achieved and 5) second dose protection achieved.
Persons advance from one immunization level to the next either through vaccination or the passing of time. Using the example above, individuals would move from level 1 to level 2 and from level 3 to level 4 through vaccination (defined by the number of people being vaccinated daily), and from level 2 to level 3 and from level 4 to level 5 by the simple passing of time (defined by the average time necessary to achieve protection after vaccination). This is illustrated in Figure 2.
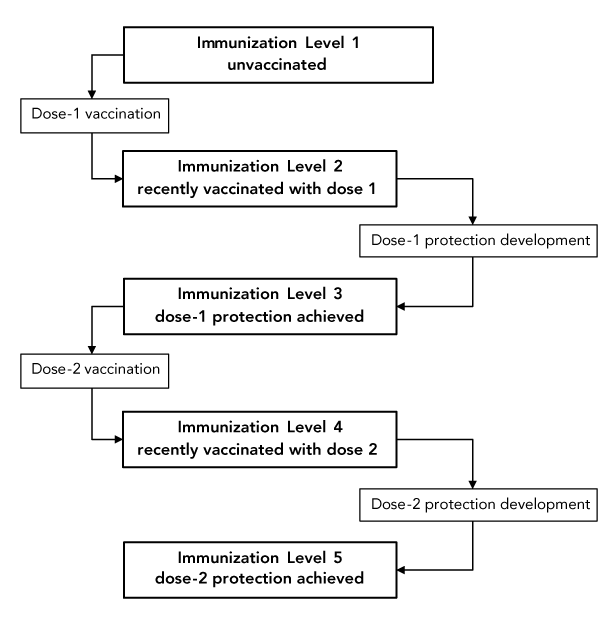
Figure 2 - Text description
The figure shows an immunization scheme with five immunization levels. Individuals advance from level 1 to level 2 and from level 3 to level 4 through vaccination. They advance from level 2 to level 3 and from level 4 to level 5 by the simple passing of time, as vaccine-induced immunity develops.
Transmission model
Persons become exposed through contact with one or multiple infectious individuals. The exposure rate is characterized by the number of contacts per individual per day and by the probability of transmission with contact. The former is characterized by an average number of daily contacts for the population. The latter is characterized by an average number for the population which is then modulated by variant-dependent and vaccination-level-dependent factors.
Stratification parameters
Each stratification can have a different number of strata. Each stratum is defined by the following parameters:
- Fraction of population belonging to the stratum
- Susceptibility modulator (a factor that multiplies the probability of transmission with contact for susceptible individuals belonging to the stratum)
- Severity modulator (a factor that multiplies the fraction of symptomatic individuals in the stratum that go on to develop severe symptoms). For example, in the 80 years and older age group, a value greater than one would be appropriate to represent the higher probability of severe outcomes for that age group
Variant parameters
Each variant, including the ancestral strain, is defined by the following parameters:
- Latency time (since exposure)
- Incubation time (since exposure)
- Time to hospitalization for severe cases (since exposure)
- Time to recovery for non-severe cases (since exposure)
- Time to recovery after hospitalization (for severe cases that recover)
- Time to death after hospitalization (for severe cases that do not recover)
- Probability of transmission with contact
- Fraction of infectious individuals that are symptomatic
- Fraction of infectious symptomatic individuals that have severe symptoms
- Fraction of hospitalized individuals that recover
Immunization-level parameters
Each immunization level is defined by the following parameters:
- Transmissibility factor (a factor, usually less than or equal to one, that multiplies the probability of transmission with contact for infectious individuals with a specific vaccination level)
- For infectious individuals who are unvaccinated or recently vaccinated (before developing protection), this factor would be one. For individuals who are both vaccinated and infectious and who have already developed some protection, the factor would normally be less than one to represent the fact that those individuals are less contagious
- Susceptibility factor (a factor, usually less than or equal to one, that multiplies the probability of transmission with contact for susceptible individuals with a specific vaccination level)
- For susceptible individuals who are unvaccinated or recently vaccinated (before developing protection), this factor would be one. For susceptible individuals who have already developed some protection, the factor would normally be less than one to represent the fact that those individuals are less likely to become infected. This factor is essentially equal to one minus the vaccine efficacy
- Severity factor (a factor, usually less than or equal to one, that multiplies the fraction of symptomatic individuals with severe symptoms)
- For infectious symptomatic individuals who are unvaccinated or recently vaccinated (before developing protection), this factor would be one. For infectious symptomatic individuals who have already developed some protection, the factor would normally be less than one, to represent the fact that those individuals are less likely to develop severe symptoms
- Rate at which individuals move from one immunization level to the next, expressed as either of the following:
- Persons vaccinated per unit time (day)
- Average time (days) before protection level changes following vaccination
Parameters for public health measures
Public health measures are characterized by the following parameters:
- Fraction of exposed individuals that are successfully quarantined
- Fraction of infectious individuals that are tested and successfully isolated
- Coefficient for additional unspecified public health measures. This general factor, usually less than or equal to 1, appears in the force of infection to account for measures such as mask wearing or physical distancing. It can also be manually adjusted to fit model predictions to actual recorded data
Modelling of decrease in vaccine protection over time and of third dose
The multi-level immunization status can be used to model the decrease in vaccine protection and subsequent need for a third doses once the protection has decreased to a certain level. An example is to use eight immunization levels as follows:
- Not vaccinated
- First dose administered, protection after first dose not yet achieved
- First dose administered, protection after first dose achieved
- Second dose administered, protection after second dose not yet achieved
- Second dose administered, protection after second dose achieved
- Second dose protection decreased
- Third dose administered, protection after third dose not yet achieved
- Third dose administered, protection after third dose achieved
Progression from level 5 to level 6 happens through the passage of time (e.g. three months for a 20% decrease in vaccine protection). Progression from level 6 to level 7 happens through administration of the third vaccine dose. Progression from level 7 to level 8 happens through the passage of time (e.g. two weeks for increased protection to develop).
Model assumptions
In its current form, the model makes several assumptions:
- Recovery from one variant offers full and permanent immunity against all variants
- Breakdown by strata in a particular stratification is independent of the other stratifications. As with the previous stratification example, if 50% of the population were female and 50% of the population were male, that is assumed to be true both for persons under 50 years and for persons 50 years and older. Similarly, if 60% of the population is under 50 years and 40% is 50 years and older, then that is assumed to be true for both male and female populations
- All severe cases are hospitalized
- The number of contacts per day per person is the same for all combined strata and independent of the vaccination level of an individual. Quarantined, isolated and hospitalized individuals are assumed to have no contacts
Simulation starting and end points
Initial conditions at "Day 0" can be specified in detail, including the population of each compartment by stratum, vaccination status and variant. This allows simulations to start from realistic data acquired in the field rather than from generic assumptions of one infectious individual. The end point of a simulation can be saved and used as the starting point of a new simulation, thus allowing the indefinite extension of the simulation time interval.
Time-dependent epidemiological parameters
Time-dependent parameters can be simulated by assuming them to be constant over finite time intervals, with step changes from one interval to the next. For example, the simulation of an entire year can be performed in 30-day intervals, with parameters updated at the start of each simulation interval.
COVID-19 transmission simulations
Four simulations were performed to investigate the effect of specific factors on COVID-19 transmission in Durham Region:
- Simulation 1: Effect of different vaccination coverage values with vaccination being the only public health measure, assuming no waning of vaccine-induced immunity over time
- Simulation 2: Effect of different vaccine effectiveness values with specified public health measures in place, assuming no waning of vaccine-induced immunity over time
- Simulation 3: Effect of waning vaccine-induced immunity after three months, assuming specified public health measures
- Simulation 4: Effect of the advent the Omicron variant, and impact of COVID-19 booster vaccines on transmission and severity of Delta and Omicron variants assuming specified health measures and waning of vaccine-induced immunity over time
Pfizer-BioNTech (Comirnaty, BNT162b2) and Moderna (Spikevax, mRNA-1273) were the two main types of COVID-19 vaccines offered in Durham Region. Vaccine effectiveness against COVID-19 infection dropped between three and six months. It was assumed that individuals in Durham Region received their second dose, on average, four months prior to the simulation start date.
Stratification by age group was not used. This simplification was adopted because reliable age-dependent data such as transmissibility, severity and vaccine efficacy were not available. While age-dependent contact matrices for a period pre-dating COVID-19 were available Footnote 8 they were not used, because such matrices would have had an effect on the overall simulation results only if transmissibility and vaccine efficacy were also broken down by age groups.
General simulation parameters are shown in Table 1 and were based on information available in November 2021. The best estimates for some of the parameters in Table 1 (e.g. latency period, incubation period, duration of hospital stay, vaccine effectiveness, severity) have since changed. Parameters specific to individual simulations are shown in Table 2. For all simulations, Day 0 was November 22, 2021.
| Parameter | Value | Source |
|---|---|---|
| Number of strata | 1 | User specified |
| Number of infectious individuals on Day 0 | 200 active cases reported on Day 0. For each reported case, there are three undetected cases in the community, for a total of 800 infectious individuals | PHU data, Footnote 9 |
| Number of contacts per day | 10 | Footnote 10 Footnote 11 |
| Latency period | 3 days for Delta 1 day for Omicron |
Footnote 12 Footnote 13 Footnote 14 |
| Incubation time | 5 days for Delta 3 days for Omicron |
Footnote 12 Footnote 13 Footnote 14 Footnote 15 |
| Time to hospitalization (from exposure) | 10 days for Delta and Omicron | PHU data |
| Time to recovery for non-severe (from exposure) | 14 days for Delta and Omicron | PHU data |
| Time to recovery after hospitalization | 14 days for Delta 10 days for Omicron |
PHU data, Footnote 14 |
| Time to death after hospitalization | 15 days for Delta and Omicron | PHU data |
| Probability of transmission with contact | 0.058 for Delta (estimated based on R0, infectious period and contact rate) 0.232 for Omicron |
Footnote 16 Footnote 17 |
| Fraction symptomatic (of infectious) | 0.85 for Delta & Omicron | PHU data |
| Fraction severe (of symptomatic) | 0.03 for Delta 0.012 for Omicron |
PHU data, Footnote 18 |
| Fraction recovered after hospitalization | 0.6 for Delta 0.8 for Omicron |
PHU data, Footnote 19 |
| Transmissibility factor for unvaccinated | 1 for Delta and Omicron | Footnote 20 |
| Susceptibility factor for unvaccinated | 1 for Delta and Omicron | Footnote 20 |
| Severity factor for unvaccinated | 1 for Delta and Omicron | Footnote 19 |
| Transmissibility factor after 1 dose | 0.8 for Delta and Omicron | Footnote 20 |
| Susceptibility factor after 1 dose | 0.7 for Delta and Omicron | Footnote 20 Footnote 21 |
| Severity factor after 1 dose | 0.3 for Delta and Omicron | Footnote 19 |
| Transmissibility factor after 2 doses | 0.5 for Delta 0.6 for Omicron |
Footnote 20 |
| Susceptibility factor after 2 doses | 0.2 for Delta 0.6 for Omicron |
Footnote 20 Footnote 22 Footnote 23 |
| Severity factor after 2 doses | 0.2 for Delta 0.3 for Omicron |
Footnote 13 Footnote 24 |
| Transmissibility factor after 3 doses | 0.5 for Delta 0.5 for Omicron |
Footnote 20 |
| Susceptibility factor after 3 doses | 0.1 for Delta 0.3 for Omicron |
Footnote 22 |
| Severity factor after 3 doses | 0.06 for Delta 0.1 for Omicron |
Footnote 13 Footnote 24 |
| Fraction of population with 1 dose on Day 0 | 0.01–0.03 | PHU data |
| Fraction of population with 2 doses on Day 0 | 0.72–0.74 | User specified |
| Fraction of population with 3 doses on Day 0 | 0 | User specified |
| Number of exposed individuals on Day 0 | 218 | PHU data |
| Infectious period | 11 days for Delta 13 days for Omicron |
Calculated based on recovery period |
| Population | 738,000 | Census data |
| Number of recovered persons on Day 0 | 110,700 | PHU data |
| Number of deceased persons on Day 0 | 389 | PHU data |
|
||
| Parameter | Simulation 1: Different vaccination coverage values |
Simulation 2: Different vaccine effectiveness values |
Simulation 3: Cases with and without waning immunity |
Simulation 4: Evolution of Delta and Omicron variants and effect of booster doses |
|---|---|---|---|---|
| Distribution of variants on Day 0 | 100% Delta | 99% Delta and 1% Omicron | ||
| Vaccination levels | Unvaccinated Two doses |
Unvaccinated Dose 1 Dose 2 |
Unvaccinated Dose 1 Dose 2 Reduced immunity |
Unvaccinated Dose 1 Dose 2 (reduced immunity) Dose 3 |
| Vaccination coverage | Compare transmission under different vaccination proportions: 70%, 80%, 90% and 100% | Start with a vaccination coverage of 2% for Dose 1, 72% for Dose 2 400 Dose 1 administrated per day 300 Dose 2 administrated per day |
Start with a vaccination coverage of 1% for Dose 1, 74% for Dose 2 and 0% for Dose 3 500 Dose 1 administrated per day 200 Dose 2 administrated per day 3,000 or 5,000 Dose 3 administered per day |
|
| Public health measures | Public health measure coefficient is 1, no isolation and no quarantine | Public health measure coefficient is 0.8 (fitted to match the estimated value of Rt≈1 for Durham Region on Day 0) All the cases reported are isolated and 5% of exposed are quarantined |
||
| Vaccine effectiveness | Vaccine effectiveness is 80% Vaccine reduces transmission by 50% after Dose 2 and reduces severity by 85% |
Compare the following: Effectiveness rate of 33% for Dose 1 and 80% for Dose 2 Effectiveness rate of 56% for Dose 1 and 87% for Dose 2 |
Effectiveness at two weeks: 33% for Dose 1; 80% for Dose 2 Transmissibility at two weeks: 83% for Dose 1; 50% for Dose 2 |
Omicron variant is four times as transmissible as the Delta variant |
| Waning immunity after vaccination | None | None | Vaccine effectiveness 12 weeks Dose 2: 45% Transmissibility 12 weeks after Dose 2: 76% |
Reduced protection for individuals who had only two doses of vaccine |
Results and discussion
The first simulation was performed to quantify the impact of different vaccination proportions on COVID-19 transmission assuming vaccination was the only public health control measure and no additional vaccinations during the simulation period.
Figure 3 shows simulation results for daily reported new infections for different vaccination proportions. Results predicted that the number of daily reported COVID-19 cases would significantly decrease with increased vaccination proportions; however, even with an 80% vaccination coverage, there would still be a very high number of daily reported cases. At least 90% of the total population would need to be vaccinated to control an epidemic consisting of the Delta variant. In reality, it would have been hard to reach such high vaccination coverage, particularly when younger age groups were ineligible for vaccination. The results suggest that even small increases in vaccination coverage can significantly reduce COVID-19 transmission but that other control measures would also be needed. Public health control measures other than vaccination can include case detection, contact tracing and quarantine, physical distancing, limiting social gatherings, mask use, self-monitoring and other "lockdown" measures.
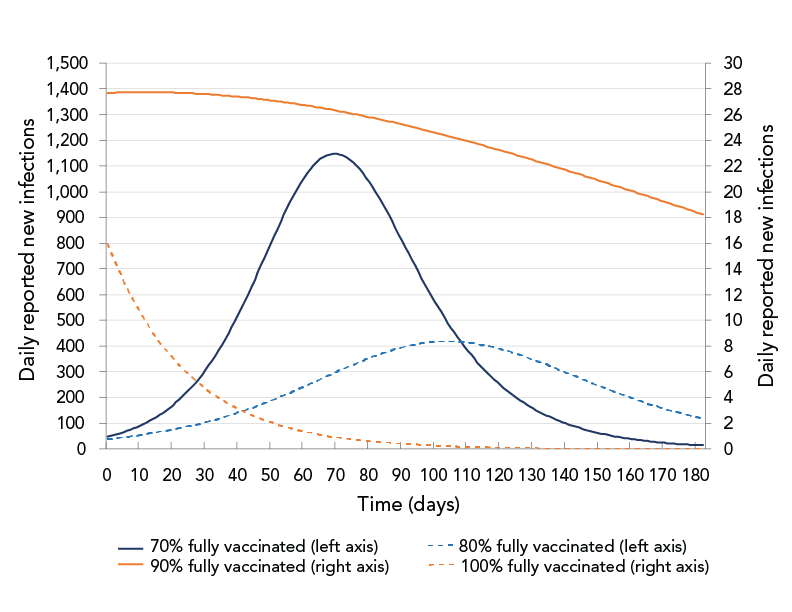
Figure 3 - Text description
The figure shows daily reported new infections as a function of time for different vaccination proportions: 70%, 80%, 90%, 100%. The curves for 70% and 80% coverage show an increase followed by a decrease. The curves for 90% and 100% coverage show that the numbers of daily new infections decrease from the beginning of the simulation.
The second simulation evaluated the impact of two different vaccine effectiveness values on COVID-19 transmission under the specific public health control measures in effect in Durham Region in November 2021, as shown in Table 2. The two sets of values for vaccine effectiveness were drawn from United Kingdom (UK) Footnote 20 and an Ontario Footnote 21 study. The Ontario study found a higher vaccine effectiveness than the UK study. Under the control measures in effect in November 2021, the effective reproduction number, Rt, estimated based on daily case data, was approximately 1.0. To account for all public health measures not explicitly modelled (e.g. masking, physical distancing) the public health measure coefficient was manually fitted, so on Day 0, the predicted Rt matched the estimated Rt≈1 in Durham Region for the month of November 2021. The starting population vaccination fraction was 2% for dose-1 and 72% for dose-2. Each day, 400 people were assumed to be vaccinated with the first dose and 300 people vaccinated with the second dose. This corresponded to 92% of the total population having completed two doses by the end of the 180-day simulation period. Simulation results for the two sets of vaccine effectiveness data are shown in Figure 4.
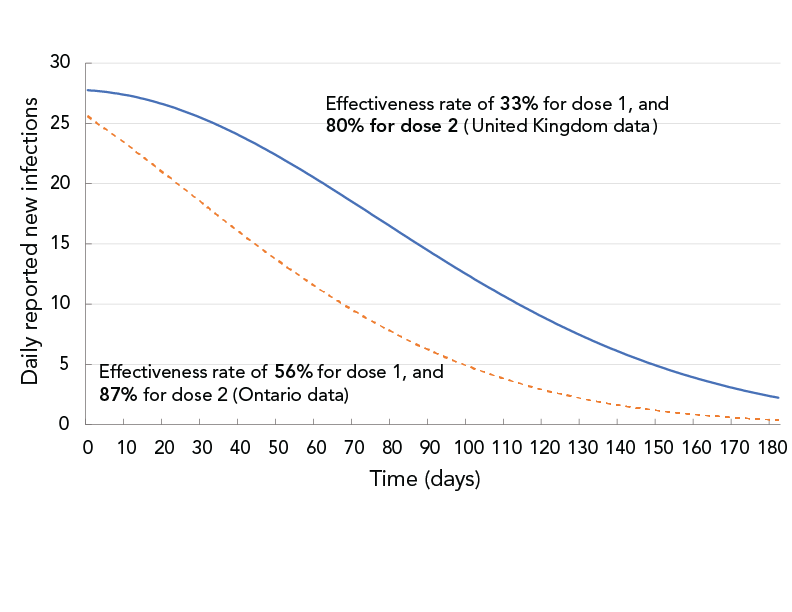
Figure 4 - Text description
The figure shows daily reported new infections as a function of time for two sets of vaccine effectiveness data. The solid curve corresponds to 33% effectiveness after dose 1 and 80% after dose 2. The dashed curve corresponds to 56% effectiveness after dose 1 and 87% after dose 2. The solid curve shows a slower decrease than the dashed curve.
With then-current (November 2021) vaccination and other public health control measures, it was projected that the daily new infections (assuming only Delta variant) would decrease over time. However, at day 90, the projection based on the UK vaccine-effectiveness data showed twice the number of daily reported infections than the projection based on the Ontario vaccine-effectiveness data.
In addition to comparing the effectiveness of different control measures, the modelling application can also be used to understand the impact of waning vaccine-induced immunity on COVID-19 transmission.
The third simulation was performed to estimate the impact of decreasing vaccine effectiveness over time. It compared the case of no immunity waning to the case of immunity waning after three months. To account for all public health measures not explicitly modelled, the public health measure coefficient was manually fitted so, on Day 0, the predicted Rt matched the estimated Rt≈1 in Durham Region for the month of November 2021. Results are shown in Figure 5.
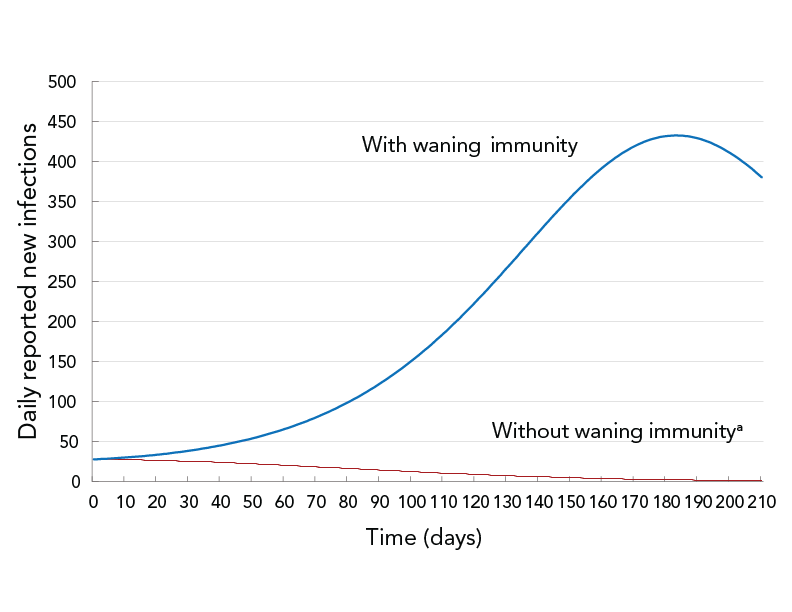
Figure 5 - Text description
The figure shows daily reported new infections as a function of time for two scenarios: permanent vaccine-induced immunity (dashed curve) and waning vaccine-induced immunity (solid curve). The dashed curve shows a decrease from the start of the simulation, while the solid curve shows an increase followed by a decrease.
- Footnote a
-
12 weeks after full vaccination, vaccine effectiveness is assumed to decrease from 80% to 45% and the reduction of transmissibility in vaccinated people is assumed to drop from 50% to 24%
Under the then-current (November 2021) vaccination program and other public health measures, assuming no waning of immunity after vaccination, the epidemiological curve was projected to be flattened from the beginning and daily reported new infections to be decreasing. The waning of immunity reduces the likelihood of being protected from COVID-19 infection (vaccination effectiveness) and increases the likelihood of fully-vaccinated people transmitting the disease. Assuming waning immunity, the number of daily reported new infections was forecast to be higher and the epidemiological curve to flatten six months into the simulation period.
The modelling application can also simulate disease transmission with multiple variants. The fourth simulation investigated the advent of the Omicron variant in addition to the Delta variant, as well as the effectiveness of a third dose (booster) of messenger ribonucleic acid (mRNA) vaccine in preventing COVID-19 infection, hospitalization and death. The Omicron variant was assumed to be four times as transmissible as the Delta variant Footnote 21. On Day 0 of the simulation, 99% of the existing infections were assumed to be due to the Delta variant and 1% to the Omicron variant. To account for all public health measures not explicitly modelled, the public health measure coefficient was manually fitted so, on Day 0, the predicted Rt matched the estimated Rt≈1 in Durham Region for the month of November 2021. The COVID-19 infections, hospitalizations and deaths were compared for three scenarios: 1) no third (booster) dose of mRNA vaccine; 2) 3,000 booster doses administrated per day; and 3) 5,000 booster doses administrated per day. The booster-dose coverage was assumed to start at 0% on Day 0 of the simulation and booster doses were assumed to be administered until booster coverage reached 93% of the eligible population (18 years of age or older). It would have taken 180 days to reach 93% booster coverage with 3,000 booster doses being administered per day and 110 days to reach that coverage level with 5,000 booster doses being administered per day.
Figure 6 shows the forecast impact of the Omicron variant and the third dose of vaccine on disease transmission. The number of new Omicron-variant infections was projected to surpass the number of new Delta-variant infections after just two weeks from Day 0, in the middle of December 2021. Within a month, Omicron was projected to become the dominant variant and account for the majority (97%) of infections. Similar results were found by the Ontario COVID-19 Science Advisory Table Footnote 25.
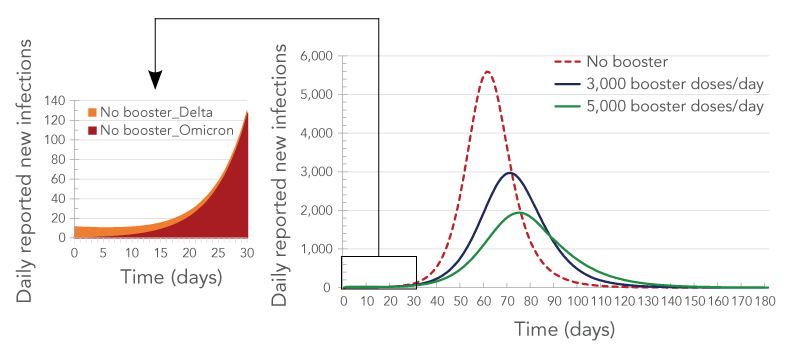
Figure 6 - Text description
The figure shows the number of reported daily new infections as a function of time in the presence of two variants (Delta and Omicron) for three rates of booster administration: no booster (brown curve), 3,000 booster-doses/day (green curve) and 5,000 booster-doses/day (blue curve). The brown curve has the highest peak, followed by the green curve and the blue curve. The callout shows the breakdown by variant of the daily new cases as a function of time in the absence of boosters. The curve corresponding to the Omicron variant shows a sharp increase with time while the curve corresponding to the Delta variant shows a decrease with time.
Simulation results suggested that booster doses would have a dramatic impact on COVID-19-related infections, hospitalizations (including inpatients and intensive care units) and deaths (Figure 6, Figure 7 and Figure 8). It was forecast that over a quarter of infections (26%) would be prevented if 3,000 booster doses were administered each day in Durham Region, and 41% of infections would be prevented if 5,000 booster doses were administered each day. Administering 5,000 booster doses each day was forecast to also prevent more than half of the hospitalizations and almost half of the deaths (Table 3, Table 4 and Figure 8).

Figure 7 - Text description
The figure shows the number of patients in hospital (left panel) and the cumulative number of deaths (right panel) as a function of time for three rates of booster administration: no booster (brown curve), 3,000 booster-doses/day (blue curve) and 5,000 booster-doses/day (green curve). On the left panel, the brown curve has the highest peak, followed by the blue curve and the green curve. On the right panel, all three curves start by increasing and then all plateau. The brown-curve plateau is the highest, followed by the blue-curve plateau and the green-curve plateau.
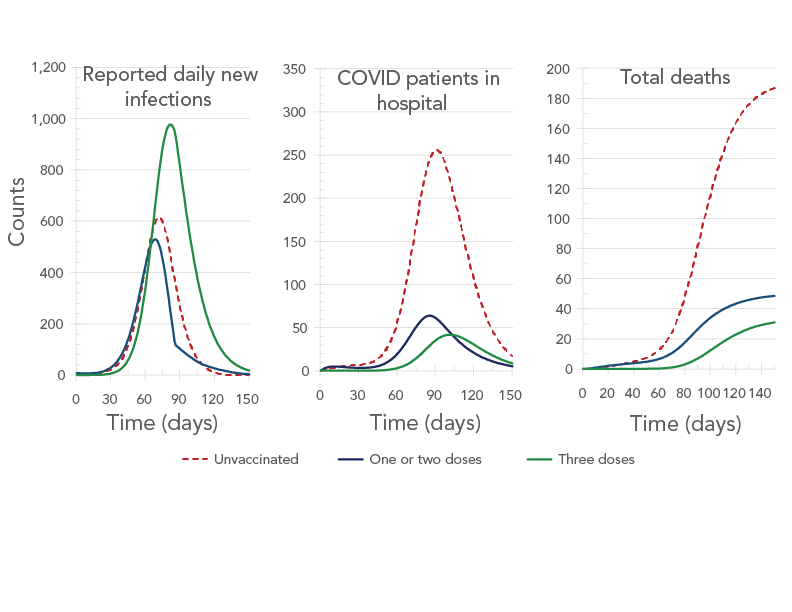
Figure 8 - Text description
The figure shows the daily new infections (left panel), number of patients in hospital (center panel), and the cumulative number of deaths (right panel) as a function of time. Each panel shows three curves corresponding to no vaccination (brown curve), one or two doses (blue curve) and three doses (green curve). The left panel shows all three curves to have peaks, with the tallest being the one for the green curve, followed by the one for the brown curve and the one for the blue curve. The central panel shows all three curves to have peaks, with the tallest being the one for the brown curve, followed by the one for the blue curve and the one for the green curve. On the right panel, all three curves start by increasing and then all plateau. The brown-curve plateau is the highest, followed by the blue-curve plateau and the green-curve plateau.
| Group | Total infections | % decrease in total infections | Highest hospitalizations on a single day | % decrease in hospitalization peak | Total hospitalizations | % decrease in total hospitalizations | Total deaths | % decrease in total deaths |
|---|---|---|---|---|---|---|---|---|
| No booster | 558,841 | - | 851 | - | 2,558 | - | 509 | - |
| 3,000 booster doses/day | 411,500 | 26% | 517 | 39% | 1,766 | 31% | 357 | 30% |
| 5,000 booster doses/day | 328,533 | 41% | 352 | 59% | 1,354 | 47% | 273 | 46% |
|
||||||||
| Indicator | Counts | Proportions | |||||
|---|---|---|---|---|---|---|---|
| Unvaccinated | 1 or 2 doses | 3 doses | Total | Unvaccinated | 1 or 2 doses | 3 doses | |
| Total infections | 90,288 | 74,919 | 163,327 | 328,533 | 27% | 23% | 50% |
| Hospitalization peak | 256 | 64 | 42 | 362 | 71% | 18% | 12% |
| Total hospitalizations | 946 | 241 | 167 | 1354 | 70% | 18% | 12% |
| Total deaths | 190 | 50 | 33 | 273 | 70% | 18% | 12% |
Figure 8 shows the forecast number of daily reported new infections, patients in hospital on a given day, and total deaths by vaccination status for the 5,000 booster-dose per day scenario. Although vaccinated people were predicted to account for almost three quarters of the COVID-19 infections by day 180, they were predicted to account for only 30% of severe cases (measured by hospitalizations and deaths).
It is informative to compare actual data with the simulation results that are closest to the scenario that developed in real life, namely the fourth simulation—assuming 3,000 booster doses administered per day. Actual hospital occupancy data were not directly available and were estimated based on daily admissions data from the PHU assuming an average hospital stay for the Omicron-dominated wave of five days. The average hospital stay was estimated based on the age-specific average hospital length of stay for an Omicron-dominated wave Footnote 26 and the age distribution of hospital admissions for the Durham-Region PHU. The comparison is shown in Figure 9 for daily reported cases and hospital occupancy. A detailed analysis of what simulation-parameter values would lead to the best agreement between forecast and actual numbers would involve rigorous model calibration using least square minimization analysis, which was not part of the work reported here, so only a rough analysis is provided with the caveat to treat this simple analysis with caution. Figure 9 shows that the actual daily reported cases begin to increase substantially approximately two weeks earlier than predicted by the simulation. We hypothesize that this is because on Day 0 of the simulation, the Omicron wave was already more advanced than assumed. In other words, the 1% Omicron prevalence assumed in the simulation was likely a more accurate description of the situation on November 8, 2021, rather than on November 22, 2021. For hospital occupancy, it would first appear that the forecast and actual numbers increase at the same time; however, that is an artifact of assuming an average hospital stay of 10 days, whereas the actual hospital stay for the Omicron-driven wave was approximately five days. This means that hospital occupancy was overestimated by a factor of approximately two. To estimate agreement if the starting point of the simulation was moved back to November 8, 2021, and if the hospital stay was assumed to be five days instead of 10, one can look at the dashed lines in Figure 9, which show the forecast number of reported cases and half the forecast hospital occupancy with both curves shifted back in time by 14 days. The agreement between the forecast and the actual reported daily infections is now quite good for the first ~50 days of the simulation (up to near the end of December). After December 28, 2021, the forecast and actual curve begin to diverge markedly, with the actual number of reported new infections decreasing abruptly while the forecast number continues to increase. This could be attributed to a combination of factors such as change in public behaviour (presumably as a consequence of public messaging, since public health measures had not been changed at that point) and a change in testing and reporting rules for new infections on December 31, 2021 Footnote 27. Forecast hospital occupancy also looks close to the actual one for the first two months of the simulation once the time shift and length of hospital stay are accounted for. The forecast hospital-occupancy curve leads the actual hospital occupancy curve by approximately two days, which may be explained by an underestimation of the time between symptom onset and hospitalization for hospitalized Omicron cases.
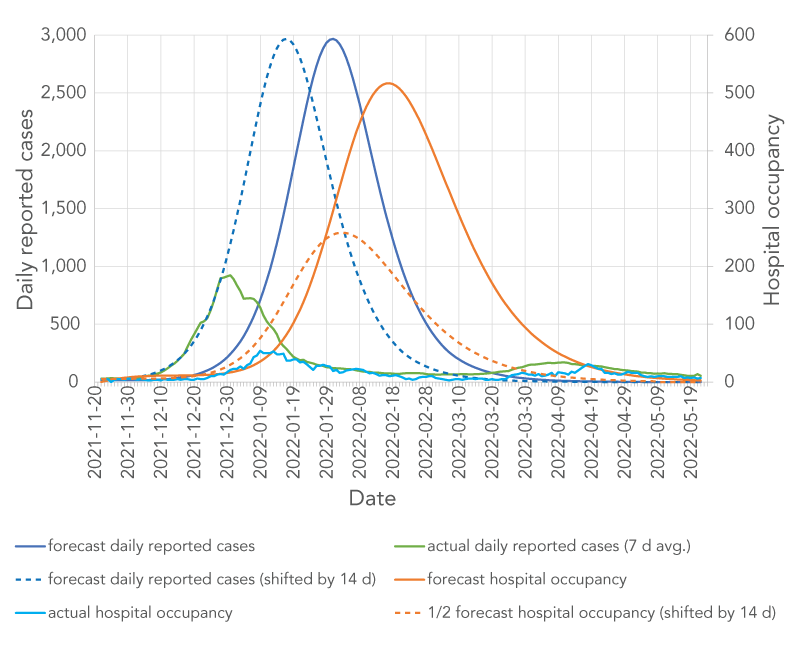
Figure 9 - Text description
The figure shows daily reported cases (left y axis) and hospital occupancy (right y axis) as a function of time. Six curves are shown: 1) forecast daily reported cases (solid blue line), 2) forecast daily reported cases shifted by 14 days (dashed blue line), 3) actual daily reported cases (solid green line), 4) forecast hospital occupancy (solid tan line), 5) half of forecast hospital occupancy shifted by 14 days (dashed tan line), 6) actual hospital occupancy (solid fuchsia line). All lines representing daily reported cases display peaks at different times. The hospital occupancy lines show peaks delayed by approximately 14 days with respect to the peaks in daily reported-cases.
Limitations
Limitations of the current model include the assumption of full and permanent immunity after infection and the assumption that infection with one variant will offer immunity against all other variants.
Conclusion
A new, easy-to-use epidemiological-modelling desktop app was developed based on a multi-compartment deterministic epidemiological model. The app can be downloaded from the IDSIM website. The app can model different levels of vaccine-induced immunity, as well as the developing and waning of immunity with time after vaccination. The functionality of the app was demonstrated by using it to simulate the effects of specific factors on COVID-19 transmission. Simulation results yielded several conclusions:
- For the Delta variant, herd immunity is not achievable through vaccination only. To maintain a reproduction number below one, public health measures need to be in place until natural immunity achieved through infection with the virus, along with immunity through vaccination, brings the overall immunity to the level necessary for herd immunity. Herd immunity is even harder to achieve with the more transmissible Omicron variant.
- Waning vaccine-induced immunity prolongs the time public health measures need to stay in place and the time necessary to approach herd immunity through additional infections.
- The Omicron variant quickly outcompeted the Delta variant. Results suggested this to happen within two weeks of the simulation start and the number of daily new cases was projected to start decreasing after two to three months, depending on the rate of administration of booster doses.
- Booster doses have an important contribution to mitigating the effects of waning immunity and immune evasion by reducing COVID-19 infections, hospitalizations and deaths.
- The IDSIM app can assist PHUs by providing control over what simulations they require depending upon the local situation and ever-changing face of COVID-19, including new variants and sub-variants, changing vaccine eligibility, coverage and effectiveness and shifting public health measures. The tool provides PHU-specific results that can be used to enhance other local, provincial, national and international information. In Durham Region, weekly projections were produced for Health Department leadership and shared with the local hospital network to help prepare for possible surges in cases and hospitalizations.
The model is currently being extended to include options to model reinfection with either the same or a different variant, as well as stratum-specific number of contacts per day. The inclusion of these new features will allow more realistic simulations, including the study of annual, possibly seasonal, epidemics under endemic conditions.
While COVID-19 provided the impetus for this work, the developed model and desktop app are flexible enough to be applicable to other communicable diseases being monitored by PHUs. Thus, it is expected that IDSIM will be a welcome addition to the tools in current use by epidemiologists in PHUs.
Authors' statement
The following are each author's contributions to the reported work.
EN — Conceptualization, methodology, software, writing–original draft, writing–review and editing, supervision, project administration, funding acquisition
MP — Conceptualization, methodology, writing–review and editing, supervision
FX — Conceptualization, methodology, formal analysis, investigation, data curation, writing–original draft, writing–review and editing, visualization
PS — Conceptualization, methodology, software, writing–review and editing, visualization
AP — Conceptualization, methodology, data curation, writing–review and editing
The content and view expressed in this article are those of the authors and do not necessarily reflect those of the Government of Canada.
Competing interests
None.
Acknowledgments
The reported work was supported in part by an Alliance COVID-19 grant from the Canadian Natural Sciences and Engineering Research Council (NSERC).
Funding
This work was supported by NSERC and by the Regional Municipality of Durham.
References
- Footnote 1
-
Government of Ontario. News Release. Ontario Enacts Declaration of Emergency to Protect the Public. Toronto, ON: Government of Ontario; March 12, 2020. https://news.ontario.ca/en/release/56356/ontario-enacts-declaration-of-emergency-to-protect-the-public#content
- Footnote 2
-
Public Health Agency of Canada. Mathematical modelling and COVID-19. Ottawa, ON: PHAC; (modified 2022-04-01). https://www.canada.ca/en/public-health/services/diseases/coronavirus-disease-covid-19/epidemiological-economic-research-data/mathematical-modelling.html
- Footnote 3
-
Hillmer MP, Feng P, McLaughlin JR, Murty VK, Sander B, Greenberg A, Brown AD. Ontario's COVID-19 Modelling Consensus Table: mobilizing scientific expertise to support pandemic response. Can J Public Health 2021;112(5):799–806. https://doi.org/10.17269/s41997-021-00559-8
- Footnote 4
-
Ogden NH, Fazil A, Arino J, Berthiaume P, Fisman DN, Greer AL, Ludwig A, Ng V, Tuite AR, Turgeon P, Waddell LA, Wu J. Modelling scenarios of the epidemic of COVID-19 in Canada. Can Commun Dis Rep 2020;46(8):198–204. https://doi.org/10.14745/ccdr.v46i06a08
- Footnote 5
-
Ng V, Fazil A, Waddell LA, Bancej C, Turgeon P, Otten A, Atchessi N, Ogden NH. Projected effects of nonpharmaceutical public health interventions to prevent resurgence of SARS-CoV-2 transmission in Canada. CMAJ 2020;192(37):E1053–E1064. https://doi.org/10.1503/cmaj.200990
- Footnote 6
-
Tuite AR, Fisman DN, Greer AL. Mathematical modelling of COVID-19 transmission and mitigation strategies in the population of Ontario, Canada. CMAJ 2020;192(19):E497–E505. https://doi.org/10.1503/cmaj.200476
- Footnote 7
-
Chowdhury R, Heng K, Shawon MSR, Goh G, Okonofua D, Ochoa-Rosales C, Gonzalez-Jaramillo V, Bhuiya A, Reidpath D, Prathapan S, Shahzad S, Althaus CL, Gonzalez-Jaramillo N, Franco OH; Global Dynamic Interventions Strategies for COVID-19 Collaborative Group. Dynamic interventions to control COVID-19 pandemic: a multivariate prediction modelling study comparing 16 worldwide countries. Eur J Epidemiol 2020;35(5):389–399. https://doi.org/10.1007/s10654-020-00649-w
- Footnote 8
-
Prem K, Cook AR, Jit M. Projecting social contact matrices in 152 countries using contact surveys and demographic data. PLoS Comput Biol 2017;13(9):e1005697. https://doi.org/10.1371/journal.pcbi.1005697
- Footnote 9
-
Public Health Ontario. Enhanced Epidemiological Summary. COVID-19 Case Fatality, Case Identification, and Attack Rates in Ontario. Toronto, ON: PHO; 2020. https://www.publichealthontario.ca/-/media/documents/ncov/epi/2020/06/covid19-epi-case-identification-age-only-template.pdf?sc_lang=en
- Footnote 10
-
Mossong J, Hens N, Jit M, Beutels P, Auranen K, Mikolajczyk R, Massari M, Salmaso S, Tomba GS, Wallinga J, Heijne J, Sadkowska-Todys M, Rosinska M, Edmunds WJ. Social Contacts and Mixing Patterns Relevant to the Spread of Infectious Diseases. PLoS Med 2008;5(3):e74. https://doi.org/10.1371/journal.pmed.0050074
- Footnote 11
-
Feehan DM, Mahmud AS. Quantifying population contact patterns in the United States during the COVID-19 pandemic. Nat Commun 2021;12(1):893. https://doi.org/10.1038/s41467-021-20990-2
- Footnote 12
-
Li B, Deng A, Li K, Hu Y, Li Z, Shi Y, Xiong Q, Liu Z, Guo Q, Zou L, Zhang H, Zhang M, Ouyang F, Su J, Su W, Xu J, Lin H, Sun J, Peng J, Jiang H, Zhou P, Hu T, Luo M, Zhang Y, Zheng H, Xiao J, Liu T, Tan M, Che R, Zeng H, Zheng Z, Huang Y, Yu J, Yi L, Wu J, Chen J, Zhong H, Deng X, Kang M, Pybus OG, Hall M, Lythgoe KA, Li Y, Yuan J, He J, Lu J. infection and transmission in a large well-traced outbreak caused by the Delta SARS-CoV-2 variant. Nat Commun 2022;13(1):460. https://doi.org/10.1038/s41467-022-28089-y
- Footnote 13
-
Jansen L, Tegomoh B, Lange K, Showalter K, Figliomeni J, Abdalhamid B, Iwen PC, Fauver J, Buss B, Donahue M. Investigation of a SARS-CoV-2 B.1.1.529 (Omicron) Variant Cluster — Nebraska, November–December 2021. MMWR Morb Mortal Wkly Rep 2021;70(5152):1782–4. https://doi.org/10.15585/mmwr.mm705152e3
- Footnote 14
-
Hay JA, Kissler SM, Fauver JR, Mack C, Tai CG, Samant RM, Connolly S, Anderson DJ, Khullar G, MacKay M, Patel M, Kelly S, Manhertz A, Eiter I, Salgado D, Baker T, Howard B, Dudley JT, Mason CE, Ho DD, Grubaugh ND, Grad YH. Viral dynamics and duration of PCR positivity of the SARS-CoV-2 Omicron variant. medRxiv 2022.01.13.22269257. https://doi.org/10.1101/2022.01.13.22269257
- Footnote 15
-
Wang Y, Chen R, Hu F, Lan Y, Yang Z, Zhan C, Shi J, Deng X, Jiang M, Zhong S, Liao B, Deng K, Tang J, Guo L, Jiang M, Fan Q, Li M, Liu J, Shi Y, Deng X, Xiao X, Kang M, Li Y, Guan W, Li Y, Li S, Li F, Zhong N, Tang X. Transmission, viral kinetics and clinical characteristics of the emergent SARS-CoV-2 Delta VOC in Guangzhou, China. EClinicalMedicine 2021;40:101129. https://doi.org/10.1016/j.eclinm.2021.101129
- Footnote 16
-
Liu Y, Rocklov J. The reproductive number of the Delta variant of SARS-CoV-2 is far higher compared to the ancestral SARS-CoV-2 virus. J Travel Medicine 2021;28(7):taab124. https://doi.org/10.1093/jtm/taab124
- Footnote 17
-
Ito K, Piantham C, Nishiura H. Relative instantaneous reproduction number of Omicron SARS-CoV-2 variant with respect to the Delta variant in Denmark. J Med Virol 2022;94(5):2265–8. https://doi.org/10.1002/jmv.27560
- Footnote 18
-
Public Health Ontario. Early Estimates of Omicron Severity in Ontario based on a Matched Cohort Study of Cases occurring between November 22 and December 24, 2021. Toronto, ON: PHO; 2021. https://www.publichealthontario.ca/-/media/documents/ncov/epi/covid-19-epi-enhanced-estimates-omicron-severity study.pdf?sc_lang=en#:~:text=Among%20matched%20Omicron%20cases%20with,22%20and%20 December%2024%2C%202021%3A&text=3%2F9%2C087%20(%3C0.1%25),9%2C087%20 (0.3%25)%20Delta%20cases.&text=53%2F9%2C087%20(0.6%25)%20 matched,9%2C087%20(1.4%25)%20Delta%20cases
- Footnote 19
-
Public Health Ontario. COVID-19 Real-World Vaccine Effectiveness –What We Know So Far. Toronto, ON: PHO; 2021. https://www.publichealthontario.ca/-/media/documents/ncov/covid-wwksf/2021/04/wwksf-vaccine-effectiveness.pdf
sc_lang=en#:~:text=5%2C22%20A%20further%20analysis,second%20dose%20of%20mRNA%20vaccine - Footnote 20
-
Eyre DW, Taylor D, Purver M, Chapman D, Fowler T, Pouwels KB, Walker AS, Peto TEA. The impact of SARS-CoV-2 vaccination on Alpha & Delta variant transmission. medRXiv 2021.09.28.21264260. https://doi.org/10.1101/2021.09.28.21264260
- Footnote 21
-
Nasreen S, Chung H, He S, Brown KA, Gubbay JB, Buchan SA, Fell DB, Austin PC, Schwartz KL, Sundaram ME, Calzavara A, Chen B, Tadrous M, Wilson K, Wilson SE, Kwong JC. Effectiveness of COVID-19 vaccines against variants of concern, Canada. medRxiv 2021.06.28.21259420. https://doi.org/10.1101/2021.06.28.21259420
- Footnote 22
-
UK Health Security Agency. SARS-CoV-2 variants of concern and variants under investigation in England: Technical briefing 33. London, UK: UKHSA; December 23, 2021. https://assets.publishing.service.gov.uk/government/uploads/system/uploads/attachment_data/file/1043807/technical-briefing-33.pdf
- Footnote 23
-
Andrews N, Stowe J, Kirsebom F, Toffa S, Rickeard T, Gallagher E, Gower C, Kall M, Groves N, O'Connell AM, Simons D, Blomquist PB, Zaidi A, Nash S, Iwani Binti Abdul Aziz N, Thelwall S, Dabrera G, Myers R, Amirthalingam G, Gharbia S, Barrett JC, Elson R, Ladhani SN, Ferguson N, Zambon M, Campbell CNJ, Brown K, Hopkins S, Chand M, Ramsay M, Lopez Bernal J. Effectiveness of COVID-19 vaccines against the Omicron (B.1.1.529) variant of concern. N Engl J Med 2022;386(16):1532–46. https://doi.org/10.1056/NEJMoa2119451
- Footnote 24
-
Thompson MG, Natarajan K, Irving SA, Rowley EA, Griggs EP, Gaglani M, Klein NP, Grannis SJ, DeSilva MB, Stenehjem E, Reese SE, Dickerson M, Naleway AL, Han J, Konatham D, McEvoy C, Rao S, Dixon BE, Dascomb K, Lewis N, Levy ME, Patel P, Liao IC, Kharbanda AB, Barron MA, Fadel WF, Grisel N, Goddard K, Yang DH, Wondimu MH, Murthy K, Valvi NR, Arndorfer J, Fireman B, Dunne MM, Embi P, Azziz-Baumgartner E, Zerbo O, Bozio CH, Reynolds S, Ferdinands J, Williams J, Link-Gelles R, Schrag SJ, Verani JR, Ball S, Ong TC. Effectiveness of a Third Dose of mRNA Vaccines Against COVID-19–Associated Emergency Department and Urgent Care Encounters and Hospitalizations Among Adults During Periods of Delta and Omicron Variant Predominance — VISION Network, 10 States. MMWR Morb Mortal Wkly Rep 2022;71(4):139–145. https://doi.org/10.15585/mmwr.mm7104e3
- Footnote 25
-
Ontario COVID Dashboard: Percentage of Cases Caused by Different Variants in Ontario. Ontario COVID-19 Science Advisory Table. January 2022. https://covid19-sciencetable.ca/ontario-dashboard/
- Footnote 26
-
Tobin RJ, Wood JG, Jayasundara D, Sara G, Walker J, Martin GE, McCaw JM, Shearer FM, Price DJ. Hospital length of stay in a mixed Omicron and Delta epidemic in New South Wales, Australia. medRxiv 2022.03.16.22271361. https://doi.org/10.1101/2022.03.16.22271361
- Footnote 27
-
Government of Ontario. News Release. Ontario Updating Public Health Measures and Guidance in Response to Omicron. Students returning to in-person learning on January 5, 2022. Toronto, ON: Government of Ontario; January 5, 2022. https://news.ontario.ca/en/release/1001386/ontario-updating-public-health-measures-and-guidance-in-response-to-omicron
Appendix: Model equations
A.1 Notations
The equations in this appendix use the following notations.
General parameters, quantities and identifiers
Ns Number of stratifications
k Stratification index (k=1,2,…Ns)
nk Number of strata in stratification k
sk stratum index for stratification k (sk = 1,2...nk)
g Combined-stratum index (g={s1, s2…sNs})
ns Total number of combined strata (ns=ΠNsk=1[nk])
C Compartment identifier. The compartment identifiers are described in section 2.1 of the main paper. For example, C=EQ denotes the "Exposed Quarantined" compartment.
NCg,I,v(t) Number of individuals in compartment C belonging to combined stratum g, with immunization level i, affected by variant v, at time t. For example, NEQg,I,v(t) denotes the number of exposed quarantined individuals.
N Total population
χ Probability of transmission with contact (with an infectious individual)
Φ Contact rate (number of contacts [with other individuals] a [susceptible] individual has per unit time [day])
Stratification parameters
αsusk,sk Susceptibility modulator for stratum sk of stratification k
αsusg Susceptibility modulator for combined stratum g (αsusg =ΠNsk=1[αsusk,sk])
αsevk,sk Severity modulator for stratum sk of stratification k
αsevg Severity modulator for combined stratum g (αsevg =ΠNsk=1[αsevk,sk])
Variant parameters
Tlatv Latency time (since exposure) for variant v
Tincv Incubation time (since exposure) for variant v
Thosv Time to hospitalization for severe cases (since exposure) for variant v
Trecv Time to recovery for non-severe cases (since exposure) for variant v
Thos-recv Time to recovery after hospitalization (for severe cases that recover)
Thos-decv Time to death after hospitalization (for severe cases that do not recover)
χv Probability of transmission with contact
γsymv Fraction of infectious individuals that are symptomatic
γsevv Fraction of infectious symptomatic individuals that have severe symptoms
γhos-recv Fraction of hospitalized individuals that recover
Immunization parameters
θtrai,v Transmissibility factor for variant v and immunization level i
θsusi,v Susceptibility factor for variant v and immunization level i
θsevi,v Severity factor for variant v and immunization level i
Rvaci Persons with immunity level i vaccinated per unit time (day)
Tvaci Time (days) spent in immunity level i before advancing to immunity level i+1
Note: For im`munization levels, i, for which progression to level i+1 happens through vaccination, Rvaci ≠ 0 and Tvaci = 0. For immunization levels, i, for which progression to level i+1 happens through the simple passage of time (such as in the case of developing protection after vaccination or in the case of protection waning), Rvaci = 0 and 1/ Tvaci ≠ 0. In short, either Rvaci or Tvaci, but not both, apply to any immunity level i, and Rvaci / Tvaci = 0.
Parameters for public health measures
γq Fraction of exposed individuals that are successfully quarantined
γti Fraction of infectious individuals that are tested and successfully isolated
σphm Coefficient for additional, unspecified, public health measures
A.2 Force of infection
The force (risk) of infection is a susceptible individual's probability of exposure per unit time. The force of infection is denoted by λg,i,v(t) and has the following expression:
#1
λg,i,v(t)= σphm ×αsusg × θsusi,v × χv × Σi'[ θtrai',v×Φ/(N- Σg'',i'',v''[NDg'',i'',v''(t)])× Σg'[ΣC ⸦infectious in the community [NCg',i',v(t)]]]
For a small number of deaths, Σg',i'',v'[NDg',i'',v'(t)]<<N, the force of infection can be approximated by:
#2
λg,i,v(t)≈σphm×αsusg×θsusi,v×Σi' [θtrai',v×χv×Φ/N×Σg'[ΣC ⸦infectious in the community [NCg',i',v(t)]]
A.3 Vaccination
Only individuals who are susceptible or otherwise in the community (neither isolated nor quarantined) and not symptomatic are vaccinated under normal circumstances. Consequently, the number of "vaccinable" persons with immunization level i, at any given time is:
#3
Nvaci(t)=Σg[NSg,i(t)]+Σg[Σv[NECg,i,v(t)]]+Σg[Σv[NICAg,i,v(t)]]+Σg[Σv[NICPMg,i,v(t)]]+Σg[Σv[NICPSg,i,v(t)]]
If exposed and infectious individuals are much fewer than the susceptible ones, it can be assumed that only susceptible individuals are being vaccinated and then the number of vaccinable individuals can be approximated as:
#4
Nvaci(t)≈Σg[NSg,i(t)]
This work assumes that only susceptible individuals are being vaccinated.
With the above notations, the balance equations for each compartment are written as below.
A.4 Balance equations
#5
d/dt[NSg,i(t)]=-(Iv[Ag,i,v(t)])xNSg,i(t)+Rvaci-1xNSg,i-1(t)/Nvaci-1(t)+NSg,i-1(t)/Tvaci-1-Rvaci-1xNSg,i(t)/Nvaci(t)-NSg,i(t)/Tvaci
The fourth and fifth terms on the right represent the rate at which persons with current immunization level i move to immunization level i+1. As explained in the note for the immunization parameters, only one of the two terms is nonzero. Similarly, terms two and three on the right represent the rate at which persons with current immunization level i-1 move to immunization level i, and only one of them is nonzero.
#6
d/dt[NECg,i,v(t)]=(1-γq)×λg,i,v(t)×NSg,i,v(t)+NECg,i-1,v(t)/Tvaci-1-NECg,i,v(t)/Tvaci
#7
d/dt[NEQg,i,v(t)]=γq×λg,i,v(t)×NSg,i,v(t)+NEQg,i-1,v(t)/Tvaci-1-NEQg,i,v(t)/Tvaci
#8
d/dt[NICAg,i,v(t)]=(1-γsymv)×(1-γti)×NECg,i,v(t)/Tlatv-NICAg,i,v(t)/(Trec-nsv-Tlatv)+NICAg,i-1,v(t)/Tvaci-1- NICAg,i,v(t)/Tvaci
#9
d/dt[NICPMg,i,v(t)]=(1-αsevg×γsevv)×γsymv×(1-γti)× NECg,i,v(t)/Tlatv-NICPMg,i,v(t)/(Tincv-Tlatv)+NICPMg,i-1,v(t)/Tvaci
#10
d/dt[NICPSg,i,v(t)]=αsevg×γsevv×γsymv×(1-γti)×NECg,i,v(t)/Tlatv-NICPSg,i,v(t)/(Tincv-Tlatv)+NICPSg,i-1,v(t)/Tvaci-1-NICPSg,i,v(t)/Tvaci
#11
d/dt[NIIAg,i,v(t)]=(1-γsymv)×γti×NECg,i,v(t)/Tlatv-NIIAg,i,v(t)/(Trec-nsv-Tlatv)+NIIAg,i-1,v(t)/Tvaci-1-NIIAg,i,v(t)/Tvaci
#12
d/dt[NIIPMg,i,v(t)]=(1-αsevg×γsevv)×γsymv×γti×NECg,i,v(t)/Tlatv-NIIPMg,i,v(t)/(Tincv-Tlatv)+NIIPMg,i-1,v(t)/Tvaci-1-NIIPMg,i,v(t)/Tvaci
#13
d/dt[NIIPSg,i,v(t)]=αsevg×γsevv×γsymv×γti×NECg,i,v(t)/Tlatv-NIIPSg,i,v(t)/(Tincv-Tlatv)+NIIPSg,i-1,v(t)/Tvaci-1- NIIPSg,i,v(t)/Tvaci
#14
d/dt[NIQAg,i,v(t)]=(1-γsymv)×NEQg,i,v(t)/Tlatv-sNIQAg,i,v(t)/(Trec-nsv-Tlatv)+NIQAg,i-1,v(t)/Tvaci-1-NIQAg,i,v(t)/Tvaci
#15
d/dt[NIQPMg,i,v(t)]=(1-αsevg×γsevv)×γsymv×NEQg,i,v(t)/Tlatv-NIQPMg,i,v(t)/(Tincv-Tlatv)+NIQPMg,i-1,v(t)/Tvaci-1-NIQPMg,i,v(t)/Tvaci
#16
d/dt[NIQPSg,i,v(t)]=αsevg×γsevv×γsymv×NEQg,i,v(t)/Tlatv-NIQPSg,i,v(t)/(Tincv-Tlatv)+NIQPSg,i-1,v(t)/Tvaci-1-NIQPSg,i,v(t)/Tvaci
#17
d/dt[NICSMg,i,v(t)]=NICPMg,i,v(t)/(Tincv-Tlatv)-NICSMg,i,v(t)/(Trec-nsv-Tincv)+NICSMg,i-1,v(t)/Tvaci-1-NICSMg,i,v(t)/Tvaci
#18
d/dt[NICSSg,i,v(t)]=NICPSg,i,v(t)/(Tincv-Tlatv)-NICSSg,i,v(t)/(Thosv-Tincv)+NICSSg,i-1,v(t)/Tvaci-1-NICSSg,i,v(t)/Tvaci
#19
d/dt[NIISMg,i,v(t)]=NIIPMg,i,v(t)/(Tincv-Tlatv)-NIISMg,i,v(t)/(Trec-nsv-Tincv)+NIISMg,i-1,v(t)/Tvaci-1-NIISMg,i,v(t)/Tvaci
#20
d/dt[NIISSg,i,v(t)]=NIIPSg,i,v(t)/(Tincv-Tlatv)-NIISSg,i,v(t)/(Thosv-Tincv)+NIISSg,i-1,v(t)/Tvaci-1-NIISSg,i,v(t)/Tvaci
#21
d/dt[NIQSMg,i,v(t)]=NIQPMg,i,v(t)/(Tincv-Tlatv)-NIQSMg,i,v(t)/(Trec-nsv-Tincv)+NIQSMg,i-1,v(t)/Tvaci-1-NIQSMg,i,v(t)/Tvaci
#22
d/dt[NIQSSg,i,v(t)]=NIQPSg,i,v(t)/(Tincv-Tlatv)-NIQSSg,i,v(t)/(Thosv-Tincv)+NIQSSg,i-1,v(t)/Tvaci-1-NIQSSg,i,v(t)/Tvaci
#23
d/dt[NHRg,i,v(t)]=γhos-recv×[NICSSg,i,v(t)+NIISSg,i,v(t)+NIQSSg,i,v(t)]/(Thosv-Tincv)-NHRg,i,v(t)/Thos-recv+NHRg,i-1,v(t)/Tvaci-1-NHRg,i,v(t)/Tvaci
#24
d/dt[NHDg,i,v(t)]=(1-γhos-recv)×[NICSSg,i,v(t)+NIISSg,i,v(t)+NIQSSg,i,v(t)]/(Thosv-Tincv)-NHDg,i,v(t)/Thos-decv+NHDg,i-1,v(t)/Tvaci-1-NHDg,i,v(t)/Tvaci
#25
d/dt[NRg,i,v(t)]=NICAg,i,v(t)/(Trec-nsv-Tlatv)+NICSMg,i,v(t)/(Trec-nsv-Tincv)+NIIAg,i,v(t)/(Trec-nsv-Tlatv)+NIISMg,i,v(t)/(Trec-nsv-Tincv)+NIQAg,i,v(t)/(Trec-nsv-Tlatv)+NIQSMg,i,v(t)/(Trec-nsv-Tincv)-NHRg,i,v(t)/Thos-recv+NRg,i-1,v(t)/Tvaci-1-NRg,i,v(t)/Tvaci
#26
d/dt[NDg,i,v(t)]=NHDg,i,v(t)/Thos-decv
In balance equations #6 to #25, corresponding to any compartment C other than S, the two terms on the right-hand side of type NCg,i-1,v(t)/Tvaci-1 and NCg,i,v(t)/Tvaci represent, respectively, the rate at which persons with current immunization level i-1 move to immunization level i and the rate at which persons with current immunization level i move to immunization level i+1, through the passage of time. Depending on the desired type of simulation, one or both terms can be zero (See also previous note for the immunization parameters).
