Intentional injury hospitalizations in geographical areas with a high percentage of Aboriginal-identity residents, 2004/2005 to 2009/2010 - CDIC: Vol 34, No 2-3, July 2014
Volume 34 · Number 2-3 · July 2014
Chronic Diseases and Injuries in Canada
Intentional injury hospitalizations in geographical areas with a high percentage of Aboriginal-identity residents, 2004/2005 to 2009/2010
L. N. Oliver, PhD; P. Finès, PhD; E. Bougie, PhD; D. Kohen, PhD
https://doi.org/10.24095/hpcdp.34.2/3.03
This article has been peer reviewed.
Author reference:
Health Analysis Division, Statistics Canada, Ottawa, Ontario, Canada
Correspondence: Philippe Finès, Health Analysis Division, RH Coats Building, Section 24A, 100 Tunney's Pasture Drive, Statistics Canada, Ottawa, Ontario, K1A 0T6; Tel.: 514-283-6847; Fax: 514-283-9350; Email: philippe.fines@statcan.gc.ca
Abstract
Introduction: This study describes rates of self-inflicted and assault-related injury hospitalizations in areas with a relatively high percentage of residents identifying as First Nations, Métis and Inuit, by injury cause, age group and sex.
Methods: All separation records from acute in-patient hospitals for Canadian provinces and territories excluding Quebec were obtained from the Discharge Abstract Database. Dissemination areas with more than 33% of residents reporting an Aboriginal identity in the 2006 Census were categorized as high-percentage Aboriginal-identity areas.
Results: Overall, in high-percentage Aboriginal-identity areas, age-standardized hospitalization rates (ASHRs) for self-inflicted injuries were higher among females, while ASHRs for assault-related injuries were higher among males. Residents of high-percentage Aboriginal-identity areas were at least three times more likely to be hospitalized due to a self-inflicted injury and at least five times more likely to be hospitalized due to an assault-related injury compared with those living in low-percentage Aboriginal-identity areas.
Conclusion: Future research should examine co-morbidities, socio-economic conditions and individual risk behaviours as factors associated with intentional injury hospitalizations.
Keywords: Aboriginal, injuries, intentional injuries, self-inflicted injuries, assault
Introduction
Aboriginal people in Canada (i.e. First Nations, Métis and Inuit) generally experience poorer health and lower life expectancy than the overall Canadian population;Footnote 1 they also experience higher rates of mortality and morbidity due to injuries.Footnote 10,Footnote 11,Footnote 12 Injuries are important to study because they are considered largely preventable, have long-term health effects and are associated with high health care costs.Footnote 3,Footnote 4,Footnote 13 Intentional injuries—which can be divided into self-inflicted and assault-related injuries—are particularly relevant to the Aboriginal population as several studies have shown higher rates of mortality due to suicide and homicide among First Nations and Métis populations.Footnote 2,Footnote 5 For example, rates of mortality due to suicide or self-inflicted injury among residents of Inuit Nunangat, which has a predominant Inuit population, are at least 11 times higher than that of the rest of Canada.Footnote 6,Footnote 7
While mortality data is commonly used to examine intentional injuries, hospitalization data is also important because many intentional injuries do not result in death and are associated with co-morbidities (e.g. mental health diagnoses). As an illustration of the importance of hospitalization data, self-inflicted injury hospitalization rates have been found to be higher among femalesFootnote 8,Footnote 14,Footnote 15 while mortality data show higher rates of suicide among males.Footnote 15,Footnote 16
Individual Aboriginal identifiers are not routinely available on national hospitalization databases that contain injury information. As a result, existing studies tend to either use selected provincial databases that do contain identifying information or make use of a geographical approach. Provincial studies that use hospitalization data containing individual Aboriginal identifiers have been limited to those of the western provinces, where there is information on people registered under the Indian Act. These studies have found higher rates of self-inflicted and assault-related injury hospitalizations for registered First Nations compared to the general population.Footnote 1,Footnote 8,Footnote 9 However, these studies exclude Métis, Inuit and non-registered First Nations people.
Studies that use a geographical approach have found higher rates of intentional injury hospitalization in regions with a high percentage of Aboriginal-identity residents. A national study (excluding Quebec) found that areas with populations reporting predominant Aboriginal identity had rates of assault-related and self-inflicted injury hospitalizations that were, respectively, nine and six times higher than rates in areas with a low percentage of Aboriginal-identity residents.Footnote 10 Hospitalizations due to assaults were at least 17 times higher, and rates for self-inflicted injuries were at least six times higher in First Nations communities compared to southern municipalities in Ontario.Footnote 11 Relatively little information exists on intentional injury hospitalizations for the Inuit population, though higher rates of violent crimes, suicide mortality and unintentional injury hospitalization in Inuit communities have been documented.Footnote 6,Footnote 7,Footnote 17 Injury was recently identified as a gap in Métis-related health research.Footnote 12 While we found no studies examining hospitalizations for self-inflicted or assault-related injuries for the Métis population, one recent study showed higher self-reported suicide ideation among Métis people compared with non-Aboriginal people.Footnote 18
Our analysis, which uses national data and a geographical approach, examines intentional injury hospitalizations for children and adults who live in areas where at least 33% of the residents report an Aboriginal identity. The purpose of our study is two-fold:
- to calculate rates of self-inflicted and assault-related injury hospitalization in areas with a relatively high percentage of First Nations–, Métis-and Inuit-identity residents by age group and sex, and
- to compare those rates to areas with a relatively low percentage of Aboriginal-identity residents. This study differs from othersFootnote 10,Footnote 17,Footnote 19 as it takes a national focus on intentional injuries, examines different causes of injury and compares results for areas with a high and with a low percentage of people identifying as Aboriginal.
Methods
This study uses the same database and methodology as reported in a previous study focusing on hospitalizations for unintentional injuries.Footnote 20
Hospitalization data
Hospitalization data for six fiscal years, 2004/2005 to 2009/2010, came from the Discharge Abstract Database.Footnote 21 This file contains information on all in-patient acute-care hospital separations (due to discharges, deaths, sign-outs and transfers) in the Canadian provinces and territories excluding Quebec. For each separation, information is available on age, sex, residential postal code, the date of admission and discharge and diagnoses codes based on the International Classification of Diseases 10th Revision, Canadian version (ICD-10-CA).Footnote 22
We examined two categories of intentional injuries: self-inflicted injuries, which are purposely inflicted on oneself, and assaults, which are purposely inflicted to another person but exclude those due to war or legal intervention. Self-inflicted injuries were classified into cutting/piercing, drowning/suffocation and poisoning, whereas assault injuries were classified into cutting/piercing, struck by/against and sexual assault/maltreatment. Other categories of self-inflicted and assault-related injuries (such as falls, fire/hot substance, firearms or land transportation) were not analysed due to the small sample sizes. All categories with the exception of sexual assault/maltreatment were derived from the International Collaborative Effort on Injury Statistics ICD codes. Examples for each category of intentional injury are available on request.
Individuals transferred between facilities have multiple hospital separation records for a single injury episode, which can cause a single injury event to be counted more than once. To avoid multiple counting, any patient that was discharged and re-admitted to another facility on the same day was counted as a single episode. Data represent injury episodes rather than the number of individuals as it is possible that an individual was hospitalized more than once over the six-year period. Finally, episodes with multiple types of injuries could count towards multiple categories if applicable (e.g. self-inflicted as poisoning and cutting/piercing).
Geozones method
Dissemination areas (DAs) are small geographical units with a population between 400 and 700.Footnote 23 DAs with more than 33% of residents reporting an Aboriginal identity in the 2006 Census were classified as high-percentage Aboriginal-identity areas and further classified as First Nations, Métis or Inuit based on the predominant Aboriginal group. This area-based method has been used previously;Footnote 10,Footnote 17 further information is available elsewhere.Footnote 24 Residential postal codes on the hospital separation records were used to determine the DA of residence via the Postal Code Conversion File Plus.Footnote 25
In 2006, there were 38 869 DAs in Canada (excluding Quebec) that had less than 33% of residents reporting an Aboriginal identity, that is, low-percentage Aboriginal-identity areas. Among the 2174 DAs where more than 33% of residents reported an Aboriginal identity, 1929 were high-percentage First Nations–identity areas, 186 were high-percentage Métis-identity areas and 59 were high-percentage Inuit-identity areas.
These four types of areas—high-percentage First Nations–, Métis- and Inuit-identity DAs and low-percentage Aboriginal-identity DAs—differ according to several socioeconomic characteristics. As shown in Table 1, low-percentage Aboriginal-identity DAs are generally more affluent than high-percentage Aboriginal-identity DAs.
TABLE 1
Demographic and socio-economic 2006 census characteristics, by Aboriginal-identity group in dissemination area, Canada (excluding Quebec)
| |
High-percentage First Nations–identity DAsTable 1 - Footnote a |
High-percentage Métis-identity DAsTable 1 - Footnote a |
High-percentage Inuit-identity DAsTable 1 - Footnote a |
Low-percentage Aboriginal-identity DAs |
|
|
| Number of DAs, n |
1288 |
178 |
56 |
38 710 |
| Total population, n |
419 699 |
78 173 |
39 948 |
23 217 988 |
| Population with an Aboriginal identity, % |
79.9 |
54.7 |
81.4 |
2.8 |
| Population living in crowded conditions, % |
19.7 |
8.1 |
27.4 |
3.2 |
| Population living in dwellings in need of major repairs, % |
36.7 |
20.5 |
23.7 |
6.9 |
| Population aged 25–64 years without a high school diploma, % |
42.1 |
32.6 |
41.5 |
14.4 |
| Population aged ≥ 15 years who are unemployed, % |
20.0 |
12.3 |
16.5 |
6.2 |
| Population aged ≥ 15 years who are in the labour force, % |
55.5 |
63.6 |
66.3 |
67.7 |
| DA in CMA/CA |
21.8 |
27.4 |
0.0 |
78.9 |
| DA outside strong / moderate MIZTable 1 - Footnote b |
6.8 |
14.0 |
0.0 |
11.8 |
| DA outside weak / no MIZTable 1 - Footnote b |
71.3 |
58.6 |
100.0 |
9.3 |
| Mean household income (SD), $ |
22 512 (10 541) |
32 163 (10 517) |
41 252 (14 528) |
47 406 (25 792) |
Analyses
Age-standardized hospitalization rates (ASHR) were calculated over the 6-year period (2004/2005–2009/2010) and were standardized to the age-structure of the 2006 Aboriginal-identity population in 5-year age intervals (i.e. they were computed as the weighted sum of age-specific hospitalization rates, where weights correspond to the proportion that each age group represents in the age-structure of the reference population). The denominator used to calculate the rates was from the 2006 census, which corresponds to the midpoint of the hospitalization data and was multiplied by six to calculate ASHRs for the 6-year period. ASHRs (per 10 000 person years) were calculated for five age groups (0–9, 10–19, 20–29, 30–44 and ≥ 45 years) and by sex for high-percentage First Nations–, Métis- and Inuit-identity areas and for low-percentage Aboriginal-identity areas. Since hospitalizations for self-inflicted injuries were rare among children aged 0 to 9 years, they were not analysed. Due to small populations, global non-response or incompletely enumerated Indian Reserves, a small number of DAs lacked the detailed age and sex data required for age-standardization. For these DAs, age and sex were estimated from total population counts or population estimates of incompletely enumerated Indian reserves. Rate ratios (RRs) compare the rates in high-percentage First Nations–, Métis- and Inuit-identity areas to rates in low-percentage Aboriginal-identity areas. We based confidence intervals (CIs) for rates and rate ratios on a log-normality assumption using the method specified in Kegler.Footnote 26 Two rates or rate ratios were considered significantly different if their 95% confidence intervals did not overlap. All analyses were done using statistical package SAS version 9.1.3 (SAS Institute Inc., Cary, NC, US).
Results
Table 2 shows descriptive statistics for the sample and the counts for self-inflicted and assault-related injury hospitalizations. Females had more hospitalizations for self-inflicted injuries than did males, whereas males had more hospitalizations for assault-related injuries. For self-inflicted injuries, the three most common causes were poisoning (86%), cutting/ piercing (9%) and drowning/suffocation (2%) (Table 3). For assault injuries, the three most common causes were struck by/against (60%), cutting/piercing (20%) and sexual assault and maltreatment (7%); struck by/against was the most frequent cause among each type of area for both sexes, while cutting/piercing was second among males and sexual assault and maltreatment was second among females (Table 4).
TABLE 2
Counts and descriptive statistics for intentional injury hospitalizations, by sex, dissemination area reporting Aboriginal identity, age group, and leading causes of injury, Canada (excluding Quebec), 2004/2005–2009/2010
| Descriptive statistics |
Self-Inflicted |
Assault |
| Number |
% |
Number |
% |
|
|
| Total (all causes) |
77 497 |
|
43 854 |
|
| Sex |
| Females |
47 341 |
61.1 |
8376 |
19.1 |
| Males |
30 156 |
38.9 |
35 478 |
80.9 |
| DA identity group |
| High-percentage First Nations–identity |
5424 |
7.0 |
7682 |
17.5 |
| High-percentage Métis-identity |
622 |
0.8 |
774 |
1.8 |
| High-percentage Inuit-identity |
781 |
1.0 |
480 |
1.1 |
| Low-percentage Aboriginal-identity |
70 670 |
91.2 |
34 918 |
79.6 |
| Age group, years |
| 0–9 |
x |
x |
1272 |
2.9 |
| 10–19 |
13 545 |
17.5 |
7189 |
16.4 |
| 20–29 |
16 156 |
20.8 |
14 505 |
33.1 |
| 30–44 |
23 837 |
30.8 |
12 715 |
29.0 |
| ≥ 45 |
23 931 |
30.9 |
8173 |
18.6 |
| Leading causes of injury |
| Poisoning |
66 724 |
86.1 |
— |
— |
| Cutting/piercing |
6956 |
9.0 |
8917 |
20.3 |
| Drowning/suffocation |
1464 |
1.9 |
— |
— |
| Struck by/against |
— |
— |
26 211 |
59.8 |
| Sexual assault and maltreatment |
n/a |
n/a |
3108 |
7.1 |
TABLE 3
Age-standardized hospitalization rates per 10 000 person-years for self-inflicted injuries, by age, sex, top injury causes and Aboriginal-identity group dissemination areas
| Injury category |
Aboriginal Identity AreaTable 3 - Footnote a |
Percentage of injury category within sex and area, all ages, % |
Age, years |
| All |
10–19 |
20–29 |
30–44 |
≥ 45 |
| Rate |
95% CI |
Rate |
95% CI |
Rate |
95% CI |
Rate |
95% CI |
Rate |
95% CI |
|
|
| Females |
Total self-inflicted
(all causes combined) |
High % First Nations |
100 |
28.44 |
27.53–29.39 |
40.52 |
39.12–43.07 |
49.67 |
46.61–52.94 |
40.29 |
37.97–42.74 |
15.98 |
14.63–17.45 |
| High % Métis |
100 |
19.14 |
17.37–21.09 |
28.73 |
23.91–34.51 |
36.10 |
29.92–43.56 |
22.67 |
18.84–27.28 |
11.72 |
9.38–14.64 |
| High % Inuit |
100 |
44.04 |
40.46–47.95 |
80.82 |
70.43–92.73 |
90.56 |
78.11–105.01 |
50.18 |
42.17–59.71 |
12.72 |
8.89–18.20 |
| Low % Aboriginal |
100 |
6.25 |
6.19–6.31 |
9.02 |
8.83–9.22 |
9.36 |
9.16–9.56 |
8.05 |
7.91–8.19 |
5.10 |
5.01–5.19 |
| Poisoning |
High % First Nations |
87 |
24.78 |
23.93–25.67 |
33.65 |
31.47–35.98 |
42.39 |
39.56–45.42 |
36.20 |
34.01–38.53 |
14.83 |
13.53–16.25 |
| High % Métis |
85 |
16.18 |
14.57–17.97 |
22.67 |
18.44–27.88 |
28.38 |
22.97–35.06 |
21.45 |
17.73–25.95 |
10.44 |
8.25–13.21 |
| High % Inuit |
91 |
40.20 |
36.78–43.94 |
74.46 |
64.52–85.94 |
80.26 |
68.58–93.92 |
46.50 |
38.83–55.68 |
11.92 |
8.22–17.27 |
| Low % Aboriginal |
89 |
5.59 |
5.53–5.65 |
7.94 |
7.76–8.12 |
8.18 |
8.00–8.37 |
7.28 |
7.15–7.42 |
4.70 |
4.61–4.79 |
| Cutting/piercing |
High % First Nations |
8 |
2.22 |
1.98–2.50 |
4.20 |
3.48–5.08 |
4.56 |
3.70–5.63 |
2.33 |
1.82–2.98 |
0.72 |
0.47–1.10 |
| High % Métis |
12 |
2.24 |
1.68–2.99 |
4.52 |
2.85–7.18 |
6.06 |
3.82–9.61 |
x |
x |
x |
x |
| High % Inuit |
4 |
1.79 |
1.18–2.73 |
x |
x |
x |
x |
x |
x |
x |
x |
| Low % Aboriginal |
8 |
0.48 |
0.47–0.50 |
0.84 |
0.78–0.90 |
0.87 |
0.81–0.93 |
0.55 |
0.51–0.59 |
0.26 |
0.24–0.28 |
| Drowning/Suffocation |
High % First Nations |
4 |
1.09 |
0.92–1.28 |
2.16 |
1.66–2.81 |
2.04 |
1.49–2.79 |
1.43 |
1.04–1.95 |
x |
x |
| High % Métis |
x |
x |
x |
x |
x |
x |
x |
x |
x |
x |
x |
| High % Inuit |
2 |
1.02 |
0.58–1.80 |
x |
x |
x |
x |
x |
x |
x |
x |
| Low % Aboriginal |
1 |
0.06 |
0.05–0.06 |
0.10 |
0.08–0.12 |
0.10 |
0.08–0.12 |
0.06 |
0.05–0.07 |
0.03 |
0.03–0.04 |
| Males |
| Total self-inflicted (all causes combined) |
High % First Nations |
100 |
14.39 |
13.75–15.06 |
13.13 |
11.83–14.58 |
32.19 |
29.71–34.89 |
22.71 |
20.96–24.59 |
9.22 |
8.24–10.32 |
| High % Métis |
100 |
9.56 |
8.33–10.96 |
12.25 |
9.28–16.16 |
20.41 |
15.81–26.35 |
11.65 |
8.96–15.13 |
6.56 |
4.91–8.76 |
| High % Inuit |
100 |
21.50 |
19.07–24.23 |
37.70 |
30.99–45.86 |
49.18 |
40.12–60.29 |
21.55 |
16.65–27.89 |
7.25 |
4.62–11.37 |
| Low % Aboriginal |
100 |
3.77 |
3.73–3.82 |
3.09 |
2.98–3.20 |
6.34 |
6.18–6.51 |
6.04 |
5.92–6.17 |
4.03 |
3.95–4.11 |
| Poisoning |
High % First Nations |
72 |
10.38 |
9.84–10.95 |
9.25 |
8.17–10.48 |
20.41 |
18.45–22.58 |
17.74 |
16.21–19.41 |
7.45 |
6.57–8.45 |
| High % Métis |
74 |
7.06 |
6.02–8.28 |
9.31 |
6.77–12.79 |
14.21 |
10.46–19.29 |
8.73 |
6.45–11.82 |
5.05 |
3.62–7.04 |
| High % Inuit |
60 |
12.90 |
11.06–15.06 |
21.08 |
16.23–27.40 |
28.61 |
21.90–37.37 |
14.96 |
10.97–20.41 |
4.59 |
2.61–8.10 |
| Low % Aboriginal |
81 |
3.04 |
3.00–3.08 |
2.50 |
2.41–2.60 |
4.86 |
4.72–5.01 |
4.96 |
4.84–5.07 |
3.33 |
3.26–3.40 |
| Cutting/piercing |
High % First Nations |
15 |
2.18 |
1.94–2.45 |
1.64 |
1.22–2.21 |
7.50 |
6.35–8.86 |
2.52 |
1.98–3.20 |
0.89 |
0.62–1.28 |
| High % Métis |
14 |
1.35 |
0.93–1.95 |
x |
x |
5.18 |
3.12–8.60 |
x |
x |
x |
x |
| High % Inuit |
11 |
2.43 |
1.71–3.46 |
x |
x |
7.27 |
4.30–12.28 |
x |
x |
x |
x |
| Low % Aboriginal |
11 |
0.43 |
0.41–0.45 |
0.32 |
0.29–0.36 |
0.90 |
0.84–0.97 |
0.66 |
0.62–0.70 |
0.40 |
0.38–0.43 |
| Drowning/Suffocation |
High % First Nations |
7 |
1.07 |
0.90–1.26 |
1.79 |
1.35–2.37 |
2.44 |
1.82–3.27 |
1.17 |
0.82–1.66 |
0.32 |
0.17–0.57 |
| High % Métis |
5 |
0.50 |
0.27–0.94 |
x |
x |
x |
x |
x |
x |
x |
x |
| High % Inuit |
9 |
1.95 |
1.31–2.88 |
x |
x |
5.83 |
3.23–10.54 |
x |
x |
x |
x |
| Low % Aboriginal |
3 |
0.11 |
0.10–0.12 |
0.14 |
0.11–0.16 |
0.22 |
0.19–0.25 |
0.14 |
0.13–0.17 |
0.09 |
0.08–0.10 |
TABLE 4
Age-standardized hospitalization rates per 10 000 person-years for assault-related injuries, by age, sex, top injury causes and Aboriginal-identity group dissemination areas
| Injury category |
Aboriginal Identity AreaTable 3 - Footnote a |
Percentage of injury category within sex and area, all ages, % |
Age, years |
| All |
0–9 |
10–19 |
20–29 |
30–44 |
≥ 45 |
| Rate |
95% CI |
Rate |
95% CI |
Rate |
95% CI |
Rate |
95% CI |
Rate |
95% CI |
Rate |
95% CI |
|
|
| Females |
| Total assault (all causes combined) |
High % First Nations |
100 |
15.73 |
15.05–16.44 |
3.28 |
2.65–4.06 |
13.23 |
11.89–14.72 |
33.45 |
30.95–36.15 |
24.53 |
22.75–26.46 |
8.08 |
7.16–9.13 |
| High % Métis |
100 |
8.27 |
7.14–9.57 |
x |
x |
6.56 |
4.47–9.64 |
16.53 |
12.53–21.82 |
13.02 |
10.19–16.64 |
4.55 |
3.22–6.45 |
| High % Inuit |
100 |
16.81 |
14.59–19.37 |
x |
x |
6.75 |
4.19–10.85 |
28.90 |
22.23–37.56 |
31.66 |
25.44–39.39 |
14.40 |
10.28–20.17 |
| Low % Aboriginal |
100 |
0.88 |
0.85–0.90 |
0.56 |
0.51–0.62 |
0.79 |
0.74–0.85 |
1.43 |
1.36–1.51 |
1.17 |
1.12–1.23 |
0.57 |
0.54–0.60 |
| Struck by/against |
High % First Nations |
57 |
8.93 |
8.42–9.46 |
x |
x |
7.16 |
6.19–8.28 |
19.43 |
17.55–21.51 |
14.94 |
13.56–16.46 |
4.88 |
4.17–5.71 |
| High % Métis |
54 |
4.46 |
3.66–5.45 |
x |
x |
3.04 |
1.73–5.35 |
10.25 |
7.21–14.57 |
7.33 |
5.29–10.16 |
2.76 |
1.78–4.30 |
| High % Inuit |
54 |
9.08 |
7.49–11.02 |
x |
x |
4.36 |
2.41–7.87 |
17.58 |
12.55–24.61 |
14.83 |
10.78–20.41 |
8.88 |
5.79–13.64 |
| Low % Aboriginal |
45 |
0.39 |
0.38–0.41 |
0.03 |
0.02–0.04 |
0.33 |
0.30–0.37 |
0.76 |
0.71–0.82 |
0.60 |
0.56–0.64 |
0.29 |
0.27–0.31 |
| Cutting/piercing |
High % First Nations |
12 |
1.86 |
1.64–2.12 |
x |
x |
2.28 |
1.76–2.94 |
5.04 |
4.13–6.16 |
2.38 |
1.86–3.03 |
0.49 |
0.29–0.81 |
| High % Métis |
13 |
1.11 |
0.74–1.66 |
x |
x |
x |
x |
x |
x |
x |
x |
x |
x |
| High % Inuit |
9 |
1.57 |
0.99–2.51 |
x |
x |
x |
x |
x |
x |
x |
x |
x |
x |
| Low % Aboriginal |
12 |
0.11 |
0.10–0.12 |
x |
x |
0.13 |
0.11–0.16 |
0.22 |
0.19–0.25 |
0.16 |
0.14–0.18 |
0.04 |
0.04–0.05 |
| Sexual assault/ Maltreatment |
High % First Nations |
19 |
2.96 |
2.68–3.27 |
3.04 |
2.44–3.79 |
2.62 |
2.06–3.33 |
4.36 |
3.51–5.40 |
3.83 |
3.16–4.64 |
1.52 |
1.16–2.00 |
| High % Métis |
19 |
1.55 |
1.10–2.18 |
x |
x |
x |
x |
x |
x |
2.44 |
1.38–4.29 |
x |
x |
| High % Inuit |
25 |
4.16 |
3.14–5.52 |
x |
x |
x |
x |
x |
x |
8.72 |
5.79–13.13 |
x |
x |
| Low % Aboriginal |
30 |
0.26 |
0.25–0.27 |
0.48 |
0.43–0.53 |
0.23 |
0.20–0.26 |
0.28 |
0.24–0.31 |
0.23 |
0.20–0.25 |
0.15 |
0.13–0.16 |
| Males |
| Total assault (all causes combined) |
High % First Nations |
100 |
44.28 |
43.14–45.44 |
4.16 |
3.45–5.01 |
34.99 |
32.82–37.31 |
108.69 |
104.04–113.55 |
70.56 |
67.44–73.83 |
23.61 |
22.01–25.33 |
| High % Métis |
100 |
27.40 |
25.26–29.72 |
3.10 |
1.76–5.46 |
24.72 |
20.34–30.05 |
64.88 |
56.22–74.88 |
43.44 |
37.89–49.81 |
12.98 |
10.56–15.96 |
| High % Inuit |
100 |
22.88 |
20.38–25.70 |
6.58 |
4.09–10.59 |
12.36 |
8.79–17.39 |
49.91 |
40.84–60.99 |
36.71 |
30.07–44.82 |
17.51 |
13.06–23.48 |
| Low % Aboriginal |
100 |
4.58 |
4.53–4.63 |
0.73 |
0.68–0.79 |
5.05 |
4.91–5.19 |
11.74 |
11.52–11.97 |
5.38 |
5.26–5.50 |
2.22 |
2.16–2.28 |
| Struck by/against |
High % First Nations |
60 |
26.44 |
25.56–27.34 |
0.61 |
0.37–0.99 |
20.52 |
18.87–22.31 |
64.21 |
60.66–67.97 |
43.31 |
40.88–45.89 |
15.47 |
14.18–16.87 |
| High % Métis |
57 |
15.70 |
14.11–17.48 |
x |
x |
14.18 |
10.96–18.34 |
37.45 |
31.02–45.23 |
27.18 |
22.87–32.30 |
6.55 |
4.89–8.79 |
| High % Inuit |
60 |
13.71 |
11.80–15.93 |
x |
x |
6.37 |
3.96–10.25 |
31.88 |
24.79–41.00 |
24.79 |
19.43–31.64 |
10.80 |
7.45–15.66 |
| Low % Aboriginal |
61 |
2.77 |
2.73–2.81 |
0.05 |
0.04–0.07 |
3.03 |
2.93–3.14 |
7.30 |
7.13–7.48 |
3.37 |
3.28–3.47 |
1.48 |
1.43–1.53 |
| Cutting/piercing |
High % First Nations |
25 |
10.89 |
10.33–11.48 |
x |
x |
10.41 |
9.26–11.71 |
30.32 |
27.91–32.94 |
15.73 |
14.29–17.32 |
4.14 |
3.50–4.91 |
| High % Métis |
25 |
6.97 |
5.93–8.20 |
x |
x |
6.62 |
4.54–9.65 |
19.80 |
15.27–25.67 |
8.90 |
6.58–12.05 |
3.26 |
2.15–4.94 |
| High % Inuit |
19 |
4.36 |
3.34–5.68 |
x |
x |
x |
x |
9.73 |
6.20–15.27 |
6.75 |
4.25–10.74 |
3.88 |
2.09–7.22 |
| Low % Aboriginal |
22 |
1.02 |
1.00–1.05 |
x |
x |
1.39 |
1.32–1.47 |
2.77 |
2.66–2.88 |
1.17 |
1.12–1.23 |
0.31 |
0.29–0.34 |
| Sexual assault/ Maltreatment |
High % First Nations |
2 |
0.91 |
0.76–1.08 |
2.87 |
2.29–3.58 |
x |
x |
x |
x |
0.64 |
0.40–1.03 |
0.40 |
0.24–0.65 |
| High % Métis |
3 |
0.84 |
0.52–1.34 |
x |
x |
x |
x |
x |
x |
x |
x |
x |
x |
| High % Inuit |
7 |
1.52 |
0.96–2.39 |
5.42 |
3.21–9.15 |
x |
x |
x |
x |
x |
x |
x |
x |
| Low % Aboriginal |
3 |
0.15 |
0.14–0.16 |
0.61 |
0.56–0.67 |
0.06 |
0.05–0.08 |
0.03 |
0.02–0.04 |
0.02 |
0.01–0.03 |
0.03 |
0.02–0.04 |
Hospitalizations due to self-inflicted injuries
Across all areas (high- and low-percentage Aboriginal-identity), self-inflicted ASHRs for all causes combined were significantly higher for females than for males (Table 3) for all ages combined and all age groups. For example, the ASHR for causes combined and for age groups combined ranged from 6.2 per 10 000 person-years [95% CI: 6.2–6.3] (low-percentage Aboriginal-identity area) to 44.0 per 10 000 person-years [95% CI: 40.5–47.9] (high-percentage Inuit-identity area) for females, and from 3.8 [95% CI: 3.7-3.8] (low-percentage Aboriginal-identity area) to 21.5 [95% CI: 19.1–24.2] (high-percentage Inuit-identity area) for males.
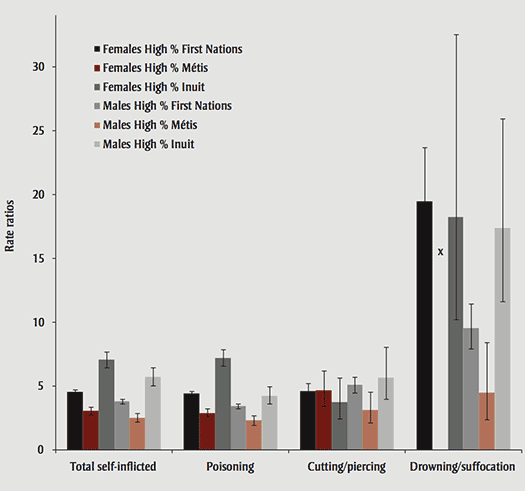
For all causes combined and for all ages combined, RRs show that for both males and females, the ASHRs of self-inflicted injury hospitalizations in high-percentage First Nations–, Métis- and Inuit-identity areas were at least 2.5 times those observed in low-percentage Aboriginal-identity areas (Figure 1). RRs were highest for high-percentage Inuit areas where ASHRs for self-inflicted injuries among males and females were over 5 times those observed in low-percentage Aboriginal-identity areas.
FIGURE 1
Rate ratios for self-inflicted injuries, total age groups, by sex, top injury causes, and Aboriginal-identity group dissemination areas, Canada (excluding Quebec), 2004/2005–2009/2010
[FIGURE 1, Text Equivalent]
Chronic Diseases and Injuries in Canada - Volume 34, Number 2-3, July 2014
FIGURE 1
Changes in the prevalence of youth in grades 6 to 9 reporting that they live in a home where no one is allowed to smoke inside, by region of Canada, 2004, 2006, 2008
Figure 1 shows changes in the prevalence of youth reporting that they live in a smoke-free home by region. Between 2004 and 2008, the prevalence of youth in grades 6 to 9 reporting that no one is allowed to smoke in the home increased by 13.3%. In addition, the prevalence of youth reporting that people are allowed to smoke anywhere in the home decreased by 32.3%. However, the prevalence of youth reporting being exposed to SHS inside the home on a daily or almost daily basis decreased by only 4.7%. Further, this decrease was only observed among female youth, with the prevalence increasing among male youth. For all provinces, except British Columbia, there was an increase in the prevalence of youth who reported no exposure to SHS in the home over time
Notes: Reference group is Low % Aboriginal areas.
''x'' indicates that the data was suppressed to meet the confidentiality requirements of the Statistics Act.
All rate ratios were statistically significant since their 95% confidence intervals did not include value 1.
ASHRs for self-inflicted injuries tended to peak among 20- to 29-year-olds for both males and females; however this age-related peak was statistically significant only in high-percentage First Nations–identity areas. The lowest self-inflicted ASHRs were among those aged 45 years and over across all identity areas compared to the three younger age groups. Similarly, RRs were lowest in the 45 year plus age group compared to the three younger age groups; this was consistent across high-percentage First Nations–, Métis- and Inuit-identity areas (data not shown).
Self-inflicted poisoning, cutting/piercing and drowning/suffocation
There were differences in the types of self-inflicted injuries by sex and by Aboriginal-identity area (Table 3). For females, the majority of self-inflicted injuries were due to poisoning and the difference between high- and low-percentage Aboriginal-identity areas ranged only slightly, from 85% to 91%. The second most prevalent type of self-inflicted injury hospitalization for females was due to cutting/piercing, from 4% (high-percentage Inuit-identity areas) to 12% (high-percentage Métis-identity areas). The percentage of self-inflicted injury hospitalizations due to drowning/ suffocation among females was less than 4% for all areas. For males, the majority of self-inflicted injury hospitalizations were also due to poisoning and ranged from 60% (high-percentage Inuit-identity areas) to 81% (low-percentage Aboriginal-identity areas). The proportion of hospitalizations due to cutting/piercing ranged from 11% to 15%, and the proportion of self-inflicted injury hospitalizations due to drowning/suffocation ranged from 3% (low-percentage Aboriginal-identity areas) to 9% (high-percentage Inuit-identity areas).
Some causes of self-inflicted injuries presented large disparities between high- and low-percentage Aboriginal-identity areas. More precisely, while overall rates were low, males and females living in high-percentage First Nations– and high-percentage Inuit-identity areas were at least 9 times more likely to be hospitalized for self-inflicted injuries due to drowning/ suffocation compared to low-percentage Aboriginal-identity areas (Figure 1). Further, some RRs for self-inflicted injuries due to cutting/piercing were higher than the overall RR for all causes combined. This was the case for males in high-percentage First Nations–identity areas (RRs = 5.1 versus 3.8) and females in high-percentage Métis-identity areas (RRs = 4.6 versus 3.1). Females living in high-percentage Inuit-identity areas had a RR for cutting/piercing that was lower than the overall RR for self-inflicted injury hospitalizations (RRs = 3.7 versus 7.1). Turning to self-inflicted poisoning, the RR for males in high-percentage Inuit-identity areas was lower than the overall RR for self-inflicted injuries (RRs = 4.2 versus 5.7). Also, RRs for self-inflicted poisoning were higher for females than males in high-percentage First Nations– and high-percentage Inuit-identity areas.
Hospitalizations due to assault-related injuries
ASHRs for assault-related injuries were higher among males than females, and this was consistent across high- and low-percentage Aboriginal-identity areas (Table 4). For example, among males, the ASHR for all causes combined ranged from 4.6 per 10 000 person-years (95% CI: 4.5–4.6) in low-percentage Aboriginal-identity areas to 44.3 per 10 000 person-years (95% CI: 43.1–45.4) in high-percentage First Nations–identity areas; among females, the rates ranged from 0.9 (95% CI: 0.9–0.9) in low-percentage Aboriginal-identity areas to 16.8 (95% CI: 14.6–19.4) in high-percentage Inuit-identity areas.
However, RRs for all causes combined in high-percentage First Nations–, Métis- and Inuit-identity areas were higher among females than among males. RRs show that females living in high-percentage First Nations–identity areas were 17.9 times more likely to be hospitalized due to an assault than females in low-percentage Aboriginal-identity areas, and females in high-percentage Métis and high-percentage Inuit-identity areas were 9.4 and 19.2 (respectively) more likely to be hospitalized due to an assault. Among males, the RR for assault hospitalizations was 9.7 for high-percentage First Nations–, 6.0 for high-percentage Métis- and 5.0 for high-percentage Inuit-identity areas (Figure 2).
FIGURE 2
Rate ratios for assault-related injuries, total age groups, by sex, top injury causes, and Aboriginal-identity group dissemination areas, Canada (excluding Quebec), 2004/2005–2009/2010
[FIGURE 2, Text Equivalent]
Chronic Diseases and Injuries in Canada - Volume 34, Number 2-3, July 2014
FIGURE 2
Changes in the prevalence of youth in grades 6 to 9 reporting that they were exposed to smoking while riding in a car in the previous 7 days, by region of Canada, 2004, 2006, 2008
Figure 2 shows changes in the prevalence of youth reporting that they were exposed to smoking while riding in a car in the previous 7 days, also by region. The prevalence of youth in grades 6 to 9 reporting being exposed to SHS in cars decreased by 18.0% between 2004 and 2008, as well as across all provinces except Quebec and British Columbia.
Notes: Reference group is Low % Aboriginal areas.
All rate ratios were statistically significant since their 95% confidence intervals did not include value 1.
As with self-inflicted injuries, for both males and females across all areas, the ASHR for assault-related injuries tended to peak in the 20- to 29-year-old age group (data not shown). However, RRs comparing assault hospitalizations in high- and low-percentage Aboriginal-identity areas did not show a systematic pattern across age groups (data not shown).
Assaults by being struck, cut/pierced, and sexually assaulted/maltreated
The majority of assault-related injury hospitalizations were due to being struck, and this was consistent for both males and females across all areas (Table 4). RRs show that injury hospitalizations due to being struck was over 20 times higher among females living in high-percentage First Nations– and high-percentage Inuit-identity areas compared to low-percentage Aboriginal-identity areas for all ages combined (Figure 2). The RR for females living in high-percentage Métis-identity areas was somewhat lower. For males, injury hospitalizations due to being struck were approximately 10 times greater in high-percentage First Nations–identity areas and approximately five times greater in high-percentage Inuit- and high-percentage Métis-identity areas compared to low-percentage Aboriginal-identity areas.
RRs show that assaults by being cut/ pierced among males were approximately ten times higher in high-percentage First Nations–identity areas, seven times higher in high-percentage Métis-identity areas and four times higher in high-percentage Inuit-identity areas compared to low-percentage Aboriginal-identity areas. For females, even though the ASHR for this type of assault was low at less than 2 per 10 000 person-years across high- and low-percentage Aboriginal-identity areas (Table 4), assault hospitalizations due to cutting/ piercing were respectively 17, 10 and 15 times higher in high-percentage First Nations–, Métis- and Inuit-identity areas compared to low-percentage Aboriginal-identity areas, for all ages combined (Figure 2).
Contrary to other types of assault, injury-hospitalizations due to sexual assault/ maltreatment were higher for females than males across high- and low-percentage Aboriginal-identity areas. Still, RRs show that both males and females living in high-percentage First Nations–, Métis- and Inuit-identity areas were at least five times more likely to be hospitalized due to sexual assault/maltreatment than those living in low-percentage Aboriginal-identity areas (Figure 2).
Discussion
This study is important because it is the first to use Canadian national population-based hospitalization data to describe patterns of intentional injury hospitalizations for high-percentage First Nations–, Métis- and Inuit-identity areas compared to low-percentage Aboriginal-identity areas. The use of six years of hospitalization data allowed us to produce rates by intentional injury cause, age and sex for high-percentage and low-percentage Aboriginal areas. These data are important to provide detailed information on differences in rates of intentional injury and can be used to track future changes over time. Overall, we found that hospitalization rates for self-inflicted injuries in high-percentage First Nations–, Métis- and Inuit-identity areas were at least three times those observed in low-Aboriginal-identity areas (for any sex, cause, age group), whereas hospitalization rates for assault-related injuries in high-percentage Aboriginal areas were at least five times those observed in low-percentage Aboriginal-identity areas (for any sex, cause, age group). These findings are consistent with other studies using national, provincial and individual data.Footnote 1,Footnote 8,Footnote 9,Footnote 10,Footnote 11 While a recent study that also used hospitalization data found higher rates of self-inflicted injury in neighbourhoods with lower socio-economic status,Footnote 27 our study cannot separate out these influences. High-percentage First Nations–, Métis- and Inuit-identity DAs have less affluent socioeconomic conditions than low-percentage Aboriginal-identity DAs; trying to understand the impact of socio-economic conditions on rates of injury hospitalization for Aboriginal- and non-Aboriginal–identity areas is an important area for future research.
For males in high-percentage Aboriginal-identity areas, assault-related hospitalizations were between five and ten times higher than low-percentage Aboriginal-identity areas. Females living in high-percentage First Nations– and high-percentage Inuit-identity areas were at particular risk of assault-related injury hospitalization, with rates at least 18 times higher than low-percentage Aboriginal-identity areas. RRs for females were highest for assaults due to being struck whereas females in high-percentage First Nations– and high-percentage Inuit-identity areas were over 20 times more likely to be hospitalized than females in low-percentage Aboriginal-identity areas. Similar results have been found for females living in First Nations communities in Ontario,Footnote 11 and indigenous females in Queensland, Australia.Footnote 28
In this study, we found higher rates of self-inflicted injury hospitalization in high-percentage Aboriginal-identity areas, with poisoning, cutting/piercing and drowning/suffocation being the three leading causes of hospitalization. Rates of self-inflicted injury hospitalization were higher for females than males, and rates were highest for males and females living in high-percentage Inuit-identity areas. These findings are consistent with other CanadianFootnote 1,Footnote 6,Footnote 7,Footnote 15 and international (New Zealand, Alaska, Greenland, Norway)Footnote 29,Footnote 30 studies. These findings are also consistent with a study on self-reported suicide ideation, which showed higher prevalence of lifetime suicidal ideation and attempts among respondents reporting a Métis identity compared to non-Aboriginal respondents.Footnote 18
Strengths and limitations
It is important to note that this is an ecological study reporting results for geographical areas. The associations observed should therefore be interpreted as applying to geographical areas only.
While a strength of this study was the use of six years of hospital separation data to provide information on intentional injury hospitalizations in high-percentage and low-percentage Aboriginal-identity areas, there are also some limitations of this data source. As individual Aboriginal identifiers were not available on hospital records, we used a 33% cut-off to define high-percentage Aboriginal-identity dissemination areas. As the populations of these areas consist of both Aboriginal and non-Aboriginal residents, the results are not generalizable to the First Nations, Métis and Inuit populations in Canada. While the geographical identifiers on the hospital separation records indicate the postal code of the individual's residence, the location where the injury occurred was not available. However, information on the location of self-reported injuries exists elsewhere.Footnote 31
Hospitalization data from Quebec were not available, and in-patient hospitalization data included here are not representative of all serious or medically treated self-inflicted or assault-related injuries.Footnote 15 For example, this study did not capture information on the most serious intentional injuries (i.e. suicide, homicide) resulting in death prior to hospital admission. While the data used in this study did not determine if the intent of self-inflicted injury was self-harm or suicide, self-inflicted injuries have been described as markers of poor mental health and suicidality.Footnote 18,Footnote 29,Footnote 30,Footnote 32,Footnote 33,Footnote 34,Footnote 35,Footnote 36,Footnote 37,Footnote 38,Footnote 39,Footnote 40
Individuals presenting only to emergency departments but not admitted as inpatients were also excluded. It is also possible that some self-inflicted injuries were coded as ''undetermined,'' thereby underestimating the actual rate of injury hospitalizations.Footnote 41 The hospitalization data also lacked individual-level socioeconomic or behavioural information, which may explain individual risk factors for intentional injury hospitalization.Footnote 42
Conclusion
This study has demonstrated that areas with a high percentage of residents identifying as Aboriginal (i.e. First Nations, Métis and Inuit) have higher rates of hospitalization due to self-inflicted and assault-related injury compared to areas with a low percentage of residents identifying as Aboriginal. This study is the first to examine intentional injury hospitalization by cause for area-based Aboriginal identity in Canada. Future research could examine injury severity, as there is some evidence that severity may differ between Aboriginal and non-Aboriginal populations.Footnote 9,Footnote 43 Approximately 70% of inpatient hospitalizations for self-inflicted injuries also include a mental illness diagnosis,Footnote 15 suggesting the importance of future research examining co-morbidities, as mental health has been linked to self-inflicted injury hospitalizations.Footnote 36 Research should also examine area-based socio-economic conditions as well as individual risk behaviours as factors associated with both intentional injuries and hospitalizations.Footnote 15,Footnote 42,Footnote 44 Finally, the specific cultural, historical and environmental contexts that may explain higher rates of assault and self-inflicted injury hospitalizations in high-percentage Aboriginal-identity areasFootnote 36,Footnote 37,Footnote 45 would contribute to our understanding.
Acknowledgements
We thank John Graham McLean for his input on suicidality. We thank two anonymous reviewers for their helpful comments. This study was funded by the First Nations and Inuit Health Branch (FNIHB), Health Canada.
References
