
Appendix B: 2008 Canadian Integrated Program for Antimicrobial Resistance Surveillance (CIPARS) annual report – Minimal inhibitory concentration tables
Canadian Integrated Program for Antimicrobial Resistance Surveillance (CIPARS)
Appendix B - Minimal Inhibitory Concentration Tables
The following information is important for the interpretation of tables presenting results on the distribution of minimal inhibitory concentrations (MICs).
- Roman numerals I to IV indicate the ranking of human medicine importance as outlined by the Veterinary Drugs Directorate, Health Canada.
- The unshaded fields indicate the range tested for each antimicrobial in the plate configuration.
- Red numbers indicate the percentage of isolates that were resistant to the antimicrobial according to the predefined resistance breakpoint.
- Numbers to the right of the highest concentration in the tested range (i.e. red numbers in shaded fields) represent the percentage of isolates with growth in all wells within the tested range, indicating that the actual MICs were greater than the tested range of concentrations.
- Numbers at the lowest concentration in the tested range (i.e. blue numbers at the far left in unshaded fields) represent the percentage of isolates susceptible to the antimicrobial at the indicated or lower concentrations.
- Solid vertical lines represent resistance breakpoints.
- Dotted vertical lines represent susceptibility breakpoints.
- MIC 50 = MIC at which 50% of isolates were inhibited by a specific antimicrobial.
- MIC 90 = MIC at which 90% of isolates were inhibited by a specific antimicrobial.
- %R = Percentage of isolates that were resistant to a specific antimicrobial.
Humans
Table B.1. Distribution of minimal inhibitory concentrations for antimicrobials in Salmonella Enteritidis isolates from humans; Surveillance of Human Clinical Isolates, 2008.
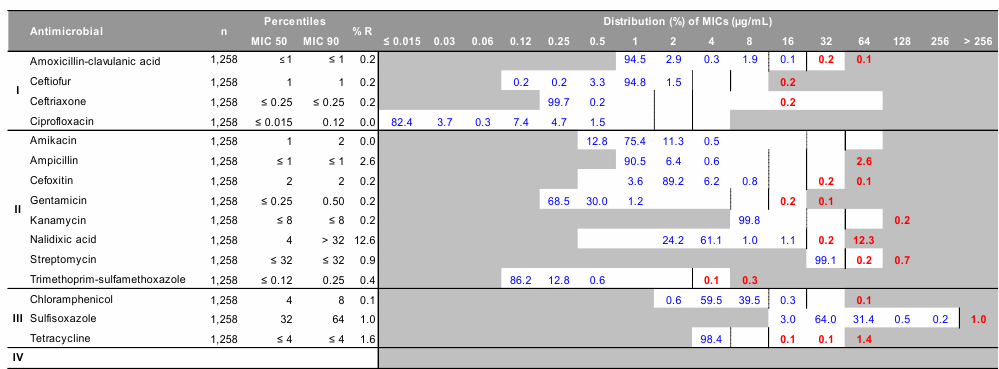
Information on how to interpret the MIC tables is provided at the beginning of Appendix B.
Table B.1. - Text Equivalent
| Antimicrobial | n | Percentiles | % R | Distribution (%) of MICs (µg/mL) | |||||||||||||||||
|---|---|---|---|---|---|---|---|---|---|---|---|---|---|---|---|---|---|---|---|---|---|
| MIC 50 | MIC 90 | ≤ 0.015 | 0.03 | 0.06 | 0.12 | 0.25 | 0.5 | 1 | 2 | 4 | 8 | 16 | 32 | 64 | 128 | 256 | > 256 | ||||
| I | Amoxicillin-clavulanic acid | 1,258 | ≤ 1 | ≤ 1 | 0.2 | 94.5 | 2.9 | 0.3 | 1.9 | 0.1 | 0.2 | 0.1 | |||||||||
| Ceftiofur | 1,258 | 1 | 1 | 0.2 | 0.2 | 0.2 | 3.3 | 94.8 | 1.5 | 0.2 | |||||||||||
| Ceftriaxone | 1,258 | ≤ 0.25 | ≤ 0.25 | 0.2 | 99.7 | 0.2 | 0.2 | ||||||||||||||
| Ciprofloxacin | 1,258 | ≤ 0.015 | 0.12 | 0.0 | 82.4 | 3.7 | 0.3 | 7.4 | 4.7 | 1.5 | |||||||||||
| II | Amikacin | 1,258 | 1 | 2 | 0.0 | 12.8 | 75.4 | 11.3 | 0.5 | ||||||||||||
| Ampicillin | 1,258 | ≤ 1 | ≤ 1 | 2.6 | 90.5 | 6.4 | 0.6 | 2.6 | |||||||||||||
| Cefoxitin | 1,258 | 2 | 2 | 0.2 | 3.6 | 89.2 | 6.2 | 0.8 | 0.2 | 0.1 | |||||||||||
| Gentamicin | 1,258 | ≤ 0.25 | 0.50 | 0.2 | 68.5 | 30.0 | 1.2 | 0.2 | 0.1 | ||||||||||||
| Kanamycin | 1,258 | ≤ 8 | ≤ 8 | 0.2 | 99.8 | 0.2 | |||||||||||||||
| Nalidixic acid | 1,258 | 4 | > 32 | 12.6 | 24.2 | 61.1 | 1.0 | 1.1 | 0.2 | 12.3 | |||||||||||
| Streptomycin | 1,258 | ≤ 32 | ≤ 32 | 0.9 | 99.1 | 0.2 | 0.7 | ||||||||||||||
| Trimethoprim-sulfamethoxazole | 1,258 | ≤ 0.12 | 0.25 | 0.4 | 86.2 | 12.8 | 0.6 | 0.1 | 0.3 | ||||||||||||
| III | Chloramphenicol | 1,258 | 4 | 8 | 0.1 | 0.6 | 59.5 | 39.5 | 0.3 | 0.1 | |||||||||||
| Sulfisoxazole | 1,258 | 32 | 64 | 1.0 | 3.0 | 64.0 | 31.4 | 0.5 | 0.2 | 1.0 | |||||||||||
| Tetracycline | 1,258 | ≤ 4 | ≤ 4 | 1.6 | 98.4 | 0.1 | 0.1 | 1.4 | |||||||||||||
| IV | |||||||||||||||||||||
Table B.2. Distribution of minimal inhibitory concentrations for antimicrobials in Salmonella Heidelberg isolates from humans; Surveillance of Human Clinical Isolates, 2008.
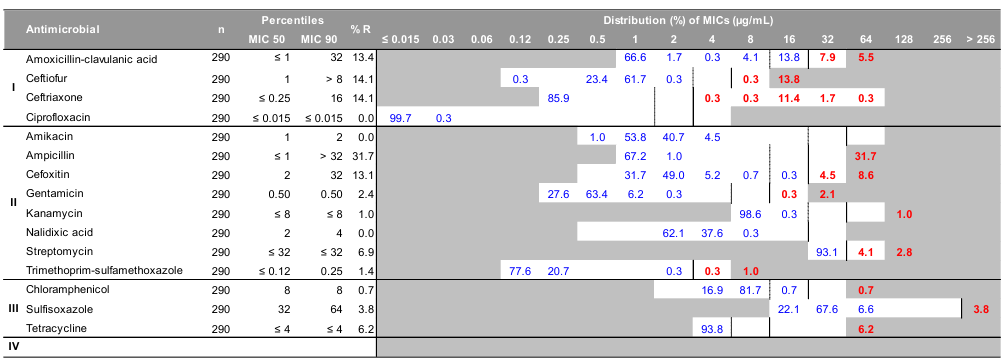
Information on how to interpret the MIC tables is provided at the beginning of Appendix B.
Table B.2. - Text Equivalent
| Antimicrobial | n | Percentiles | % R | Distribution (%) of MICs (µg/mL) | |||||||||||||||||
|---|---|---|---|---|---|---|---|---|---|---|---|---|---|---|---|---|---|---|---|---|---|
| MIC 50 | MIC 90 | ≤ 0.015 | 0.03 | 0.06 | 0.12 | 0.25 | 0.5 | 1 | 2 | 4 | 8 | 16 | 32 | 64 | 128 | 256 | > 256 | ||||
| I | Amoxicillin-clavulanic acid | 290 | ≤ 1 | 32 | 13.4 | 66.6 | 1.7 | 0.3 | 4.1 | 13.8 | 7.9 | 5.5 | |||||||||
| Ceftiofur | 290 | 1 | > 8 | 14.1 | 0.3 | 23.4 | 61.7 | 0.3 | 0.3 | 13.8 | |||||||||||
| Ceftriaxone | 290 | ≤ 0.25 | 16 | 14.1 | 85.9 | 0.3 | 0.3 | 11.4 | 1.7 | 0.3 | |||||||||||
| Ciprofloxacin | 290 | ≤ 0.015 | ≤ 0.015 | 0.0 | 99.7 | 0.3 | |||||||||||||||
| II | Amikacin | 290 | 1 | 2 | 0.0 | 1.0 | 53.8 | 40.7 | 4.5 | ||||||||||||
| Ampicillin | 290 | ≤ 1 | > 32 | 31.7 | 67.2 | 1.0 | 31.7 | ||||||||||||||
| Cefoxitin | 290 | 2 | 32 | 13.1 | 31.7 | 49.0 | 5.2 | 0.7 | 0.3 | 4.5 | 8.6 | ||||||||||
| Gentamicin | 290 | 0.50 | 0.50 | 2.4 | 27.6 | 63.4 | 6.2 | 0.3 | 0.3 | 2.1 | |||||||||||
| Kanamycin | 290 | ≤ 8 | ≤ 8 | 1.0 | 98.6 | 0.3 | 1.0 | ||||||||||||||
| Nalidixic acid | 290 | 2 | 4 | 0.0 | 62.1 | 37.6 | 0.3 | ||||||||||||||
| Streptomycin | 290 | ≤ 32 | ≤ 32 | 6.9 | 93.1 | 4.1 | 2.8 | ||||||||||||||
| Trimethoprim-sulfamethoxazole | 290 | ≤ 0.12 | 0.25 | 1.4 | 77.6 | 20.7 | 0.3 | 0.3 | 1.0 | ||||||||||||
| III | Chloramphenicol | 290 | 8 | 8 | 0.7 | 16.9 | 81.7 | 0.7 | 0.7 | ||||||||||||
| Sulfisoxazole | 290 | 32 | 64 | 3.8 | 22.1 | 67.6 | 6.6 | 3.8 | |||||||||||||
| Tetracycline | 290 | ≤ 4 | ≤ 4 | 6.2 | 93.8 | 6.2 | |||||||||||||||
| IV | |||||||||||||||||||||
Table B.3. Distribution of minimal inhibitory concentrations for antimicrobials in Salmonella Newport isolates from humans; Surveillance of Human Clinical Isolates, 2008.
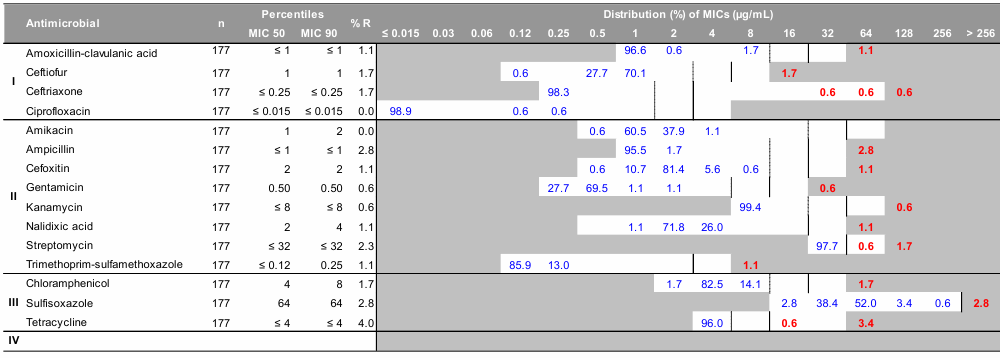
Information on how to interpret the MIC tables is provided at the beginning of Appendix B.
Table B.3. - Text Equivalent
| Antimicrobial | Percentiles | % R | Distribution (%) of MICs (µg/mL) | ||||||||||||||||||
|---|---|---|---|---|---|---|---|---|---|---|---|---|---|---|---|---|---|---|---|---|---|
| n | MIC 50 | MIC 90 | ≤ 0.015 | 0.03 | 0.06 | 0.12 | 0.25 | 0.5 | 1 | 2 | 4 | 8 | 16 | 32 | 64 | 128 | 256 | > 256 | |||
| I | Amoxicillin-clavulanic acid | 177 | ≤ 1 | ≤ 1 | 1.1 | 96.6 | 0.6 | 1.7 | 1.1 | ||||||||||||
| Ceftiofur | 177 | 1 | 1 | 1.7 | 0.6 | 27.7 | 70.1 | 1.7 | |||||||||||||
| Ceftriaxone | 177 | ≤ 0.25 | ≤ 0.25 | 1.7 | 98.3 | 0.6 | 0.6 | 0.6 | |||||||||||||
| Ciprofloxacin | 177 | ≤ 0.015 | ≤ 0.015 | 0.0 | 98.9 | 0.6 | 0.6 | ||||||||||||||
| II | Amikacin | 177 | 1 | 2 | 0.0 | 0.6 | 60.5 | 37.9 | 1.1 | ||||||||||||
| Ampicillin | 177 | ≤ 1 | ≤ 1 | 2.8 | 95.5 | 1.7 | 2.8 | ||||||||||||||
| Cefoxitin | 177 | 2 | 2 | 1.1 | 0.6 | 10.7 | 81.4 | 5.6 | 0.6 | 1.1 | |||||||||||
| Gentamicin | 177 | 0.50 | 0.50 | 0.6 | 27.7 | 69.5 | 1.1 | 1.1 | 0.6 | ||||||||||||
| Kanamycin | 177 | ≤ 8 | ≤ 8 | 0.6 | 99.4 | 0.6 | |||||||||||||||
| Nalidixic acid | 177 | 2 | 4 | 1.1 | 1.1 | 71.8 | 26.0 | 1.1 | |||||||||||||
| Streptomycin | 177 | ≤ 32 | ≤ 32 | 2.3 | 97.7 | 0.6 | 1.7 | ||||||||||||||
| Trimethoprim-sulfamethoxazole | 177 | ≤ 0.12 | 0.25 | 1.1 | 85.9 | 13.0 | 1.1 | ||||||||||||||
| III | Chloramphenicol | 177 | 4 | 8 | 1.7 | 1.7 | 82.5 | 14.1 | 1.7 | ||||||||||||
| Sulfisoxazole | 177 | 64 | 64 | 2.8 | 2.8 | 38.4 | 52.0 | 3.4 | 0.6 | 2.8 | |||||||||||
| Tetracycline | 177 | ≤ 4 | ≤ 4 | 4.0 | 96.0 | 0.6 | 3.4 | ||||||||||||||
| IV | |||||||||||||||||||||
Table B.4. Distribution of minimal inhibitory concentrations for antimicrobials in Salmonella Paratyphi A and S. Paratyphi B isolates from humans; Surveillance of Human Clinical Isolates, 2008.
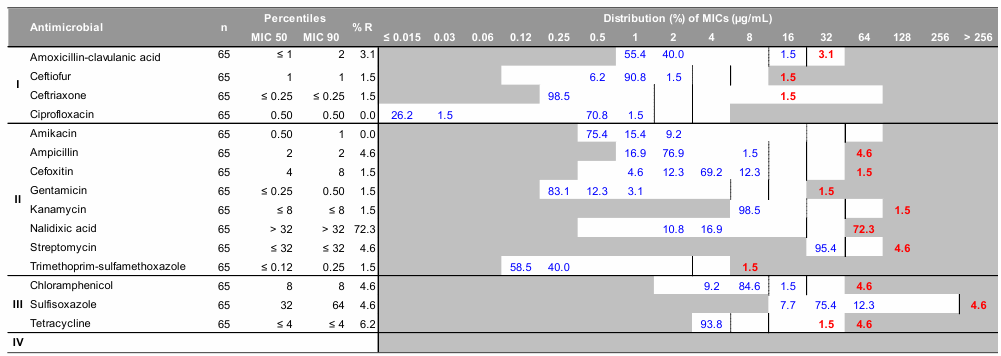
Information on how to interpret the MIC tables is provided at the beginning of Appendix B.
Table B.4. - Text Equivalent
| Antimicrobial | n | Percentiles | % R | Distribution (%) of MICs (µg/mL) | |||||||||||||||||
|---|---|---|---|---|---|---|---|---|---|---|---|---|---|---|---|---|---|---|---|---|---|
| MIC 50 | MIC 90 | ≤ 0.015 | 0.03 | 0.06 | 0.12 | 0.25 | 0.5 | 1 | 2 | 4 | 8 | 16 | 32 | 64 | 128 | 256 | > 256 | ||||
| I | Amoxicillin-clavulanic acid | 65 | ≤ 1 | 2 | 3.1 | 55.4 | 40.0 | 1.5 | 3.1 | ||||||||||||
| Ceftiofur | 65 | 1 | 1 | 1.5 | 6.2 | 90.8 | 1.5 | 1.5 | |||||||||||||
| Ceftriaxone | 65 | ≤ 0.25 | ≤ 0.25 | 1.5 | 98.5 | 1.5 | |||||||||||||||
| Ciprofloxacin | 65 | 0.50 | 0.50 | 0.0 | 26.2 | 1.5 | 70.8 | 1.5 | |||||||||||||
| II | Amikacin | 65 | 0.50 | 1 | 0.0 | 75.4 | 15.4 | 9.2 | |||||||||||||
| Ampicillin | 65 | 2 | 2 | 4.6 | 16.9 | 76.9 | 1.5 | 4.6 | |||||||||||||
| Cefoxitin | 65 | 4 | 8 | 1.5 | 4.6 | 12.3 | 69.2 | 12.3 | 1.5 | ||||||||||||
| Gentamicin | 65 | ≤ 0.25 | 0.50 | 1.5 | 83.1 | 12.3 | 3.1 | 1.5 | |||||||||||||
| Kanamycin | 65 | ≤ 8 | ≤ 8 | 1.5 | 98.5 | 1.5 | |||||||||||||||
| Nalidixic acid | 65 | > 32 | > 32 | 72.3 | 10.8 | 16.9 | 72.3 | ||||||||||||||
| Streptomycin | 65 | ≤ 32 | ≤ 32 | 4.6 | 95.4 | 4.6 | |||||||||||||||
| Trimethoprim-sulfamethoxazole | 65 | ≤ 0.12 | 0.25 | 1.5 | 58.5 | 40.0 | 1.5 | ||||||||||||||
| III | Chloramphenicol | 65 | 8 | 8 | 4.6 | 9.2 | 84.6 | 1.5 | 4.6 | ||||||||||||
| Sulfisoxazole | 65 | 32 | 64 | 4.6 | 7.7 | 75.4 | 12.3 | 4.6 | |||||||||||||
| Tetracycline | 65 | ≤ 4 | ≤ 4 | 6.2 | 93.8 | 1.5 | 4.6 | ||||||||||||||
| IV | |||||||||||||||||||||
Table B.5. Distribution of minimal inhibitory concentrations for antimicrobials in Salmonella Typhi isolates from humans; Surveillance of Human Clinical Isolates, 2008.
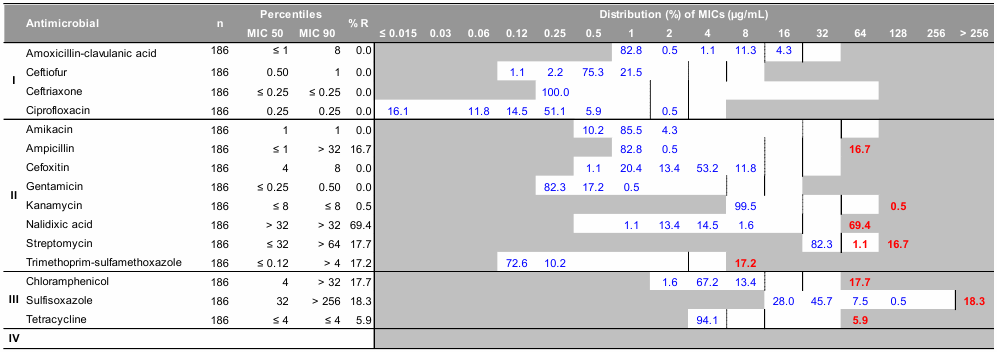
Information on how to interpret the MIC tables is provided at the beginning of Appendix B.
Table B.5. - Text Equivalent
| Antimicrobial | n | Percentiles | % R | Distribution (%) of MICs (µg/mL) | |||||||||||||||||
|---|---|---|---|---|---|---|---|---|---|---|---|---|---|---|---|---|---|---|---|---|---|
| MIC 50 | MIC 90 | ≤ 0.015 | 0.03 | 0.06 | 0.12 | 0.25 | 0.5 | 1 | 2 | 4 | 8 | 16 | 32 | 64 | 128 | 256 | > 256 | ||||
| I | Amoxicillin-clavulanic acid | 186 | ≤ 1 | 8 | 0.0 | 82.8 | 0.5 | 1.1 | 11.3 | 4.3 | |||||||||||
| Ceftiofur | 186 | 0.50 | 1 | 0.0 | 1.1 | 2.2 | 75.3 | 21.5 | |||||||||||||
| Ceftriaxone | 186 | ≤ 0.25 | ≤ 0.25 | 0.0 | 100.0 | ||||||||||||||||
| Ciprofloxacin | 186 | 0.25 | 0.25 | 0.0 | 16.1 | 11.8 | 14.5 | 51.1 | 5.9 | 0.5 | |||||||||||
| II | Amikacin | 186 | 1 | 1 | 0.0 | 10.2 | 85.5 | 4.3 | |||||||||||||
| Ampicillin | 186 | ≤ 1 | > 32 | 16.7 | 82.8 | 0.5 | 16.7 | ||||||||||||||
| Cefoxitin | 186 | 4 | 8 | 0.0 | 1.1 | 20.4 | 13.4 | 53.2 | 11.8 | ||||||||||||
| Gentamicin | 186 | ≤ 0.25 | 0.50 | 0.0 | 82.3 | 17.2 | 0.5 | ||||||||||||||
| Kanamycin | 186 | ≤ 8 | ≤ 8 | 0.5 | 99.5 | 0.5 | |||||||||||||||
| Nalidixic acid | 186 | > 32 | > 32 | 69.4 | 1.1 | 13.4 | 14.5 | 1.6 | 69.4 | ||||||||||||
| Streptomycin | 186 | ≤ 32 | > 64 | 17.7 | 82.3 | 1.1 | 16.7 | ||||||||||||||
| Trimethoprim-sulfamethoxazole | 186 | ≤ 0.12 | > 4 | 17.2 | 72.6 | 10.2 | 17.2 | ||||||||||||||
| III | Chloramphenicol | 186 | 4 | > 32 | 17.7 | 1.6 | 67.2 | 13.4 | 17.7 | ||||||||||||
| Sulfisoxazole | 186 | 32 | > 256 | 18.3 | 28.0 | 45.7 | 7.5 | 0.5 | 18.3 | ||||||||||||
| Tetracycline | 186 | ≤ 4 | ≤ 4 | 5.9 | 94.1 | 5.9 | |||||||||||||||
| IV | |||||||||||||||||||||
Table B.6. Distribution of minimal inhibitory concentrations for antimicrobials in Salmonella Typhimurium isolates from humans; Surveillance of Human Clinical Isolates, 2008.
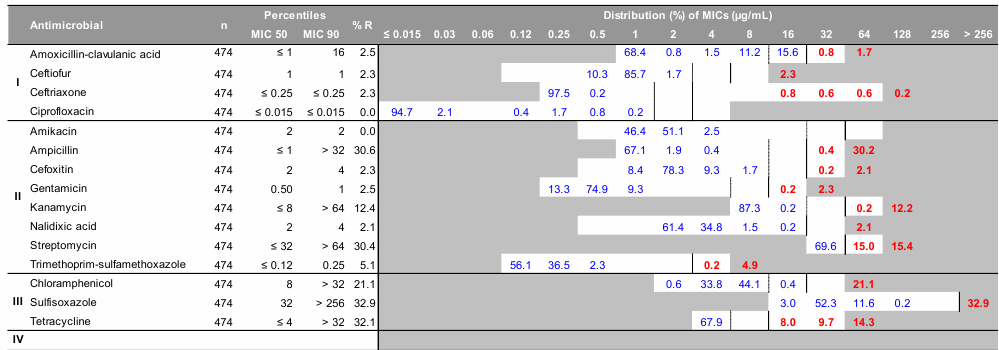
Information on how to interpret the MIC tables is provided at the beginning of Appendix B.
Table B.6. - Text Equivalent
| Antimicrobial | n | Percentiles | % R | Distribution (%) of MICs (µg/mL) | |||||||||||||||||
|---|---|---|---|---|---|---|---|---|---|---|---|---|---|---|---|---|---|---|---|---|---|
| MIC 50 | MIC 90 | ≤ 0.015 | 0.03 | 0.06 | 0.12 | 0.25 | 0.5 | 1 | 2 | 4 | 8 | 16 | 32 | 64 | 128 | 256 | > 256 | ||||
| I | Amoxicillin-clavulanic acid | 474 | ≤ 1 | 16 | 2.5 | 68.4 | 0.8 | 1.5 | 11.2 | 15.6 | 0.8 | 1.7 | |||||||||
| Ceftiofur | 474 | 1 | 1 | 2.3 | 10.3 | 85.7 | 1.7 | 2.3 | |||||||||||||
| Ceftriaxone | 474 | ≤ 0.25 | ≤ 0.25 | 2.3 | 97.5 | 0.2 | 0.8 | 0.6 | 0.6 | 0.2 | |||||||||||
| Ciprofloxacin | 474 | ≤ 0.015 | ≤ 0.015 | 0.0 | 94.7 | 2.1 | 0.4 | 1.7 | 0.8 | 0.2 | |||||||||||
| II | Amikacin | 474 | 2 | 2 | 0.0 | 46.4 | 51.1 | 2.5 | |||||||||||||
| Ampicillin | 474 | ≤ 1 | > 32 | 30.6 | 67.1 | 1.9 | 0.4 | 0.4 | 30.2 | ||||||||||||
| Cefoxitin | 474 | 2 | 4 | 2.3 | 8.4 | 78.3 | 9.3 | 1.7 | 0.2 | 2.1 | |||||||||||
| Gentamicin | 474 | 0.50 | 1 | 2.5 | 13.3 | 74.9 | 9.3 | 0.2 | 2.3 | ||||||||||||
| Kanamycin | 474 | ≤ 8 | > 64 | 12.4 | 87.3 | 0.2 | 0.2 | 12.2 | |||||||||||||
| Nalidixic acid | 474 | 2 | 4 | 2.1 | 61.4 | 34.8 | 1.5 | 0.2 | 2.1 | ||||||||||||
| Streptomycin | 474 | ≤ 32 | > 64 | 30.4 | 69.6 | 15.0 | 15.4 | ||||||||||||||
| Trimethoprim-sulfamethoxazole | 474 | ≤ 0.12 | 0.25 | 5.1 | 56.1 | 36.5 | 2.3 | 0.2 | 4.9 | ||||||||||||
| III | Chloramphenicol | 474 | 8 | > 32 | 21.1 | 0.6 | 33.8 | 44.1 | 0.4 | 21.1 | |||||||||||
| Sulfisoxazole | 474 | 32 | > 256 | 32.9 | 3.0 | 52.3 | 11.6 | 0.2 | 32.9 | ||||||||||||
| Tetracycline | 474 | ≤ 4 | > 32 | 32.1 | 67.9 | 8.0 | 9.7 | 14.3 | |||||||||||||
| IV | |||||||||||||||||||||
Table B.7. Distribution of minimal inhibitory concentrations for antimicrobials in Salmonella "Other Serovars" isolates from humans; Surveillance of Human Clinical Isolates, 2008.
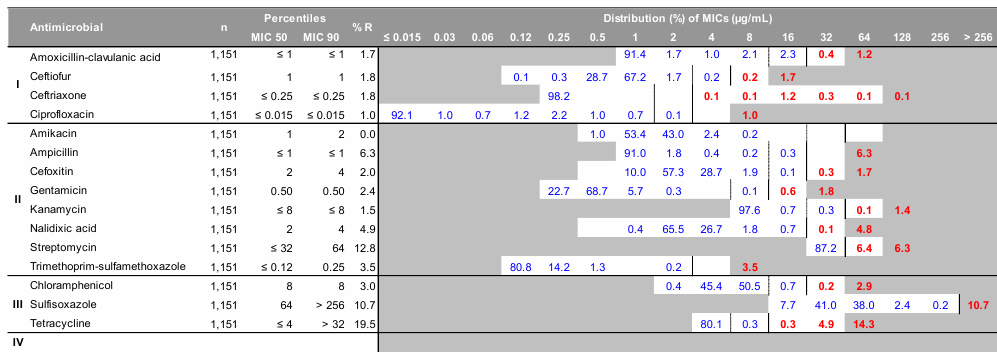
Information on how to interpret the MIC tables is provided at the beginning of Appendix B.
Table B.7. - Text Equivalent
| Antimicrobial | n | Percentiles | % R | Distribution (%) of MICs (µg/mL) | |||||||||||||||||
|---|---|---|---|---|---|---|---|---|---|---|---|---|---|---|---|---|---|---|---|---|---|
| MIC 50 | MIC 90 | ≤ 0.015 | 0.03 | 0.06 | 0.12 | 0.25 | 0.5 | 1 | 2 | 4 | 8 | 16 | 32 | 64 | 128 | 256 | > 256 | ||||
| I | Amoxicillin-clavulanic acid | 1,151 | ≤ 1 | ≤ 1 | 1.7 | 91.4 | 1.7 | 1.0 | 2.1 | 2.3 | 0.4 | 1.2 | |||||||||
| Ceftiofur | 1,151 | 1 | 1 | 1.8 | 0.1 | 0.3 | 28.7 | 67.2 | 1.7 | 0.2 | 0.2 | 1.7 | |||||||||
| Ceftriaxone | 1,151 | ≤ 0.25 | ≤ 0.25 | 1.8 | 98.2 | 0.1 | 0.1 | 1.2 | 0.3 | 0.1 | 0.1 | ||||||||||
| Ciprofloxacin | 1,151 | ≤ 0.015 | ≤ 0.015 | 1.0 | 92.1 | 1.0 | 0.7 | 1.2 | 2.2 | 1.0 | 0.7 | 0.1 | 1.0 | ||||||||
| II | Amikacin | 1,151 | 1 | 2 | 0.0 | 1.0 | 53.4 | 43.0 | 2.4 | 0.2 | |||||||||||
| Ampicillin | 1,151 | ≤ 1 | ≤ 1 | 6.3 | 91.0 | 1.8 | 0.4 | 0.2 | 0.3 | 6.3 | |||||||||||
| Cefoxitin | 1,151 | 2 | 4 | 2.0 | 10.0 | 57.3 | 28.7 | 1.9 | 0.1 | 0.3 | 1.7 | ||||||||||
| Gentamicin | 1,151 | 0.50 | 0.50 | 2.4 | 22.7 | 68.7 | 5.7 | 0.3 | 0.1 | 0.6 | 1.8 | ||||||||||
| Kanamycin | 1,151 | ≤ 8 | ≤ 8 | 1.5 | 97.6 | 0.7 | 0.3 | 0.1 | 1.4 | ||||||||||||
| Nalidixic acid | 1,151 | 2 | 4 | 4.9 | 0.4 | 65.5 | 26.7 | 1.8 | 0.7 | 0.1 | 4.8 | ||||||||||
| Streptomycin | 1,151 | ≤ 32 | 64 | 12.8 | 87.2 | 6.4 | 6.3 | ||||||||||||||
| Trimethoprim-sulfamethoxazole | 1,151 | ≤ 0.12 | 0.25 | 3.5 | 80.8 | 14.2 | 1.3 | 0.2 | 3.5 | ||||||||||||
| III | Chloramphenicol | 1,151 | 8 | 8 | 3.0 | 0.4 | 45.4 | 50.5 | 0.7 | 0.2 | 2.9 | ||||||||||
| Sulfisoxazole | 1,151 | 64 | > 256 | 10.7 | 7.7 | 41.0 | 38.0 | 2.4 | 0.2 | 10.7 | |||||||||||
| Tetracycline | 1,151 | ≤ 4 | > 32 | 19.5 | 80.1 | 0.3 | 0.3 | 4.9 | 14.3 | ||||||||||||
| IV | |||||||||||||||||||||
Beef Cattle
Table B.8. Distribution of minimal inhibitory concentrations for antimicrobials in Salmonella isolates from cattle; Surveillance of Animal Clinical Isolates, 2008.
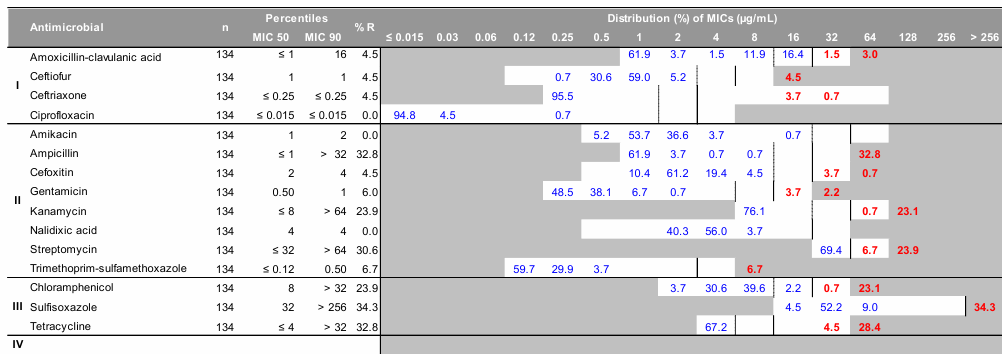
Information on how to interpret the MIC tables is provided at the beginning of Appendix B.
Table B.8. - Text Equivalent
| Antimicrobial | n | Percentiles | % R | Distribution (%) of MICs (µg/mL) | |||||||||||||||||
|---|---|---|---|---|---|---|---|---|---|---|---|---|---|---|---|---|---|---|---|---|---|
| MIC 50 | MIC 90 | ≤ 0.015 | 0.03 | 0.06 | 0.12 | 0.25 | 0.5 | 1 | 2 | 4 | 8 | 16 | 32 | 64 | 128 | 256 | > 256 | ||||
| I | Amoxicillin-clavulanic acid | 134 | ≤ 1 | 16 | 4.5 | 61.9 | 3.7 | 1.5 | 11.9 | 16.4 | 1.5 | 3.0 | |||||||||
| Ceftiofur | 134 | 1 | 1 | 4.5 | 0.7 | 30.6 | 59.0 | 5.2 | 4.5 | ||||||||||||
| Ceftriaxone | 134 | ≤ 0.25 | ≤ 0.25 | 4.5 | 95.5 | 3.7 | 0.7 | ||||||||||||||
| Ciprofloxacin | 134 | ≤ 0.015 | ≤ 0.015 | 0.0 | 94.8 | 4.5 | 0.7 | ||||||||||||||
| II | Amikacin | 134 | 1 | 2 | 0.0 | 5.2 | 53.7 | 36.6 | 3.7 | 0.7 | |||||||||||
| Ampicillin | 134 | ≤ 1 | > 32 | 32.8 | 61.9 | 3.7 | 0.7 | 0.7 | 32.8 | ||||||||||||
| Cefoxitin | 134 | 2 | 4 | 4.5 | 10.4 | 61.2 | 19.4 | 4.5 | 3.7 | 0.7 | |||||||||||
| Gentamicin | 134 | 0.50 | 1 | 6.0 | 48.5 | 38.1 | 6.7 | 0.7 | 3.7 | 2.2 | |||||||||||
| Kanamycin | 134 | ≤ 8 | > 64 | 23.9 | 76.1 | 0.7 | 23.1 | ||||||||||||||
| Nalidixic acid | 134 | 4 | 4 | 0.0 | 40.3 | 56.0 | 3.7 | ||||||||||||||
| Streptomycin | 134 | ≤ 32 | > 64 | 30.6 | 69.4 | 6.7 | 23.9 | ||||||||||||||
| Trimethoprim-sulfamethoxazole | 134 | ≤ 0.12 | 0.50 | 6.7 | 59.7 | 29.9 | 3.7 | 6.7 | |||||||||||||
| III | Chloramphenicol | 134 | 8 | > 32 | 23.9 | 3.7 | 30.6 | 39.6 | 2.2 | 0.7 | 23.1 | ||||||||||
| Sulfisoxazole | 134 | 32 | > 256 | 34.3 | 4.5 | 52.2 | 9.0 | 34.3 | |||||||||||||
| Tetracycline | 134 | ≤ 4 | > 32 | 32.8 | 67.2 | 4.5 | 28.4 | ||||||||||||||
| IV | |||||||||||||||||||||
Table B.9. Distribution of minimal inhibitory concentrations for antimicrobials in Escherichia coli isolates from beef cattle; Abattoir Surveillance, 2008.
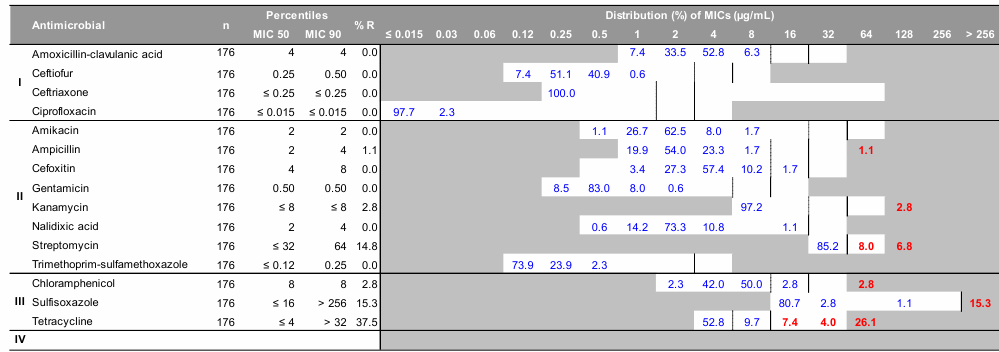
Information on how to interpret the MIC tables is provided at the beginning of Appendix B.
Table B.9. - Text Equivalent
| Antimicrobial | n | Percentiles | % R | Distribution (%) of MICs (µg/mL) | |||||||||||||||||
|---|---|---|---|---|---|---|---|---|---|---|---|---|---|---|---|---|---|---|---|---|---|
| MIC 50 | MIC 90 | ≤ 0.015 | 0.03 | 0.06 | 0.12 | 0.25 | 0.5 | 1 | 2 | 4 | 8 | 16 | 32 | 64 | 128 | 256 | > 256 | ||||
| I | Amoxicillin-clavulanic acid | 176 | 4 | 4 | 0.0 | 7.4 | 33.5 | 52.8 | 6.3 | ||||||||||||
| Ceftiofur | 176 | 0.25 | 0.50 | 0.0 | 7.4 | 51.1 | 40.9 | 0.6 | |||||||||||||
| Ceftriaxone | 176 | ≤ 0.25 | ≤ 0.25 | 0.0 | 100.0 | ||||||||||||||||
| Ciprofloxacin | 176 | ≤ 0.015 | ≤ 0.015 | 0.0 | 97.7 | 2.3 | |||||||||||||||
| II | Amikacin | 176 | 2 | 2 | 0.0 | 1.1 | 26.7 | 62.5 | 8.0 | 1.7 | |||||||||||
| Ampicillin | 176 | 2 | 4 | 1.1 | 19.9 | 54.0 | 23.3 | 1.7 | 1.1 | ||||||||||||
| Cefoxitin | 176 | 4 | 8 | 0.0 | 3.4 | 27.3 | 57.4 | 10.2 | 1.7 | ||||||||||||
| Gentamicin | 176 | 0.50 | 0.50 | 0.0 | 8.5 | 83.0 | 8.0 | 0.6 | |||||||||||||
| Kanamycin | 176 | ≤ 8 | ≤ 8 | 2.8 | 97.2 | 2.8 | |||||||||||||||
| Nalidixic acid | 176 | 2 | 4 | 0.0 | 0.6 | 14.2 | 73.3 | 10.8 | 1.1 | ||||||||||||
| Streptomycin | 176 | ≤ 32 | 64 | 14.8 | 85.2 | 8.0 | 6.8 | ||||||||||||||
| Trimethoprim-sulfamethoxazole | 176 | ≤ 0.12 | 0.25 | 0.0 | 73.9 | 23.9 | 2.3 | ||||||||||||||
| III | Chloramphenicol | 176 | 8 | 8 | 2.8 | 2.3 | 42.0 | 50.0 | 2.8 | 2.8 | |||||||||||
| Sulfisoxazole | 176 | ≤ 16 | > 256 | 15.3 | 80.7 | 2.8 | 1.1 | 15.3 | |||||||||||||
| Tetracycline | 176 | ≤ 4 | > 32 | 37.5 | 52.8 | 9.7 | 7.4 | 4.0 | 26.1 | ||||||||||||
| IV | |||||||||||||||||||||
Table B.10. Distribution of minimal inhibitory concentrations for antimicrobials in Escherichia coli isolates from beef, by province/region; Retail Meat Surveillance, 2008.
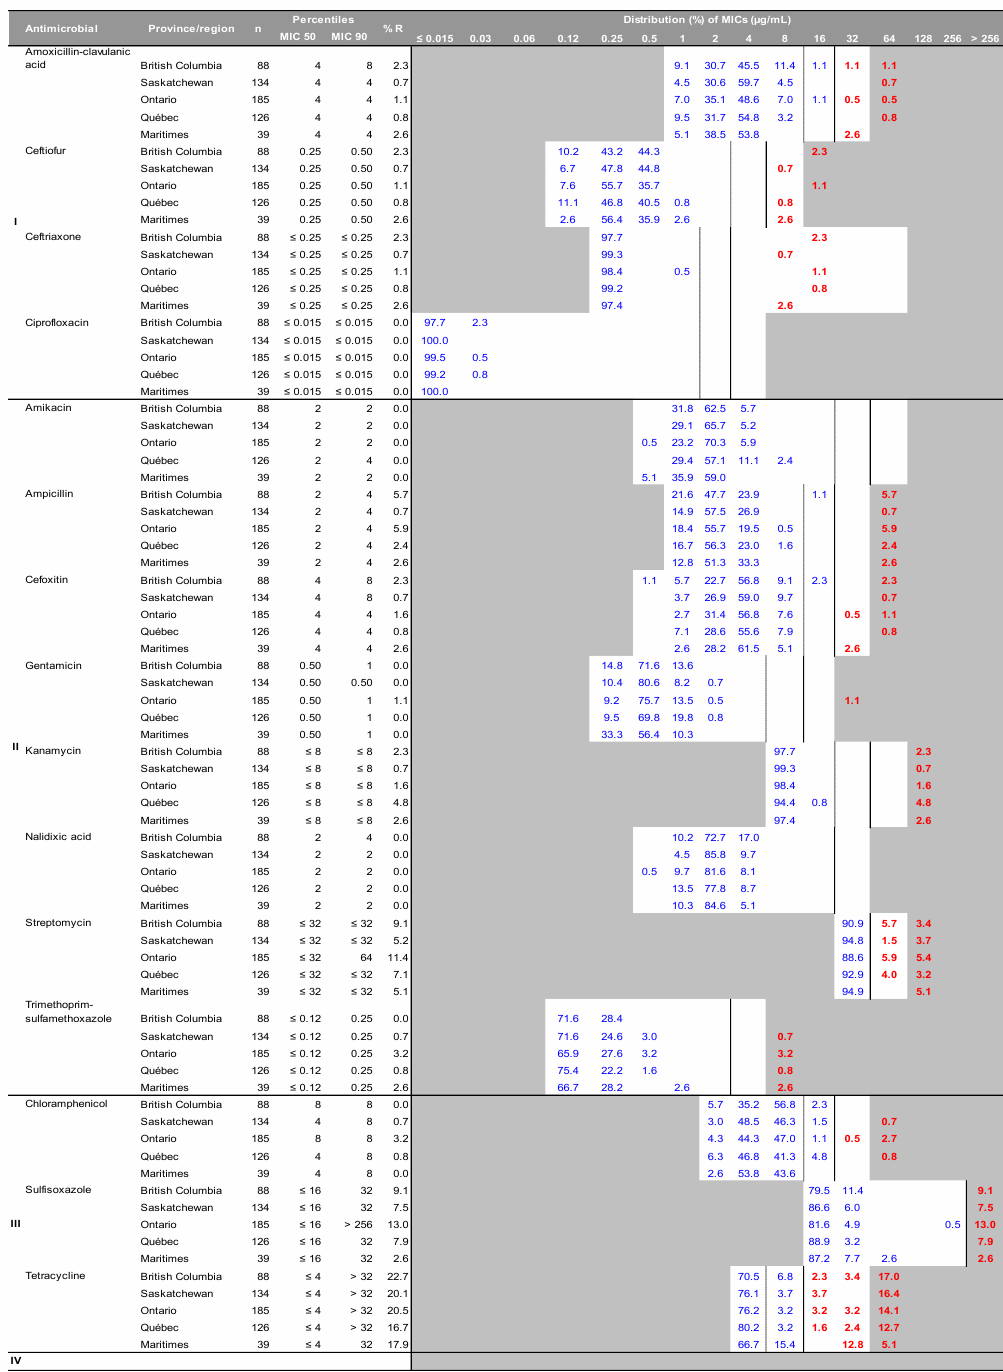
Information on how to interpret the MIC tables is provided at the beginning of Appendix B.
The Maritimes region includes New Brunswick, Nova Scotia, and Prince Edward Island.
Table B.10. - Text Equivalent
| Antimicrobial | Province/region | n | Percentiles | % R | Distribution (%) of MICs (µg/mL) | |||||||||||||||||
|---|---|---|---|---|---|---|---|---|---|---|---|---|---|---|---|---|---|---|---|---|---|---|
| MIC 50 | MIC 90 | ≤ 0.015 | 0.03 | 0.06 | 0.12 | 0.25 | 0.5 | 1 | 2 | 4 | 8 | 16 | 32 | 64 | 128 | 256 | > 256 | |||||
| I | Amoxicillin-clavulanic acid | British Columbia | 88 | 4 | 8 | 2.3 | 9.1 | 30.7 | 45.5 | 11.4 | 1.1 | 1.1 | 1.1 | |||||||||
| Saskatchewan | 134 | 4 | 4 | 0.7 | 4.5 | 30.6 | 59.7 | 4.5 | 0.7 | |||||||||||||
| Ontario | 185 | 4 | 4 | 1.1 | 7.0 | 35.1 | 48.6 | 7.0 | 1.1 | 0.5 | 0.5 | |||||||||||
| Québec | 126 | 4 | 4 | 0.8 | 9.5 | 31.7 | 54.8 | 3.2 | 0.8 | |||||||||||||
| Maritimes | 39 | 4 | 4 | 2.6 | 5.1 | 38.5 | 53.8 | 2.6 | ||||||||||||||
| Ceftiofur | British Columbia | 88 | 0.25 | 0.50 | 2.3 | 10.2 | 43.2 | 44.3 | 2.3 | |||||||||||||
| Saskatchewan | 134 | 0.25 | 0.50 | 0.7 | 6.7 | 47.8 | 44.8 | 0.7 | ||||||||||||||
| Ontario | 185 | 0.25 | 0.50 | 1.1 | 7.6 | 55.7 | 35.7 | 1.1 | ||||||||||||||
| Québec | 126 | 0.25 | 0.50 | 0.8 | 11.1 | 46.8 | 40.5 | 0.8 | 0.8 | |||||||||||||
| Maritimes | 39 | 0.25 | 0.50 | 2.6 | 2.6 | 56.4 | 35.9 | 2.6 | 2.6 | |||||||||||||
| Ceftriaxone | British Columbia | 88 | ≤ 0.25 | ≤ 0.25 | 2.3 | 97.7 | 2.3 | |||||||||||||||
| Saskatchewan | 134 | ≤ 0.25 | ≤ 0.25 | 0.7 | 99.3 | 0.7 | ||||||||||||||||
| Ontario | 185 | ≤ 0.25 | ≤ 0.25 | 1.1 | 98.4 | 0.5 | 1.1 | |||||||||||||||
| Québec | 126 | ≤ 0.25 | ≤ 0.25 | 0.8 | 99.2 | 0.8 | ||||||||||||||||
| Maritimes | 39 | ≤ 0.25 | ≤ 0.25 | 2.6 | 97.4 | 2.6 | ||||||||||||||||
| Ciprofloxacin | British Columbia | 88 | ≤ 0.015 | ≤ 0.015 | 0.0 | 97.7 | 2.3 | |||||||||||||||
| Saskatchewan | 134 | ≤ 0.015 | ≤ 0.015 | 0.0 | 100.0 | |||||||||||||||||
| Ontario | 185 | ≤ 0.015 | ≤ 0.015 | 0.0 | 99.5 | 0.5 | ||||||||||||||||
| Québec | 126 | ≤ 0.015 | ≤ 0.015 | 0.0 | 99.2 | 0.8 | ||||||||||||||||
| Maritimes | 39 | ≤ 0.015 | ≤ 0.015 | 0.0 | 100.0 | |||||||||||||||||
| II | Amikacin | British Columbia | 88 | 2 | 2 | 0.0 | 31.8 | 62.5 | 5.7 | |||||||||||||
| Saskatchewan | 134 | 2 | 2 | 0.0 | 29.1 | 65.7 | 5.2 | |||||||||||||||
| Ontario | 185 | 2 | 2 | 0.0 | 0.5 | 23.2 | 70.3 | 5.9 | ||||||||||||||
| Québec | 126 | 2 | 4 | 0.0 | 29.4 | 57.1 | 11.1 | 2.4 | ||||||||||||||
| Maritimes | 39 | 2 | 2 | 0.0 | 5.1 | 35.9 | 59.0 | |||||||||||||||
| Ampicillin | British Columbia | 88 | 2 | 4 | 5.7 | 21.6 | 47.7 | 23.9 | 1.1 | 5.7 | ||||||||||||
| Saskatchewan | 134 | 2 | 4 | 0.7 | 14.9 | 57.5 | 26.9 | 0.7 | ||||||||||||||
| Ontario | 185 | 2 | 4 | 5.9 | 18.4 | 55.7 | 19.5 | 0.5 | 5.9 | |||||||||||||
| Québec | 126 | 2 | 4 | 2.4 | 16.7 | 56.3 | 23.0 | 1.6 | 2.4 | |||||||||||||
| Maritimes | 39 | 2 | 4 | 2.6 | 12.8 | 51.3 | 33.3 | 2.6 | ||||||||||||||
| Cefoxitin | British Columbia | 88 | 4 | 8 | 2.3 | 1.1 | 5.7 | 22.7 | 56.8 | 9.1 | 2.3 | 2.3 | ||||||||||
| Saskatchewan | 134 | 4 | 8 | 0.7 | 3.7 | 26.9 | 59.0 | 9.7 | 0.7 | |||||||||||||
| Ontario | 185 | 4 | 4 | 1.6 | 2.7 | 31.4 | 56.8 | 7.6 | 0.5 | 1.1 | ||||||||||||
| Québec | 126 | 4 | 4 | 0.8 | 7.1 | 28.6 | 55.6 | 7.9 | 0.8 | |||||||||||||
| Maritimes | 39 | 4 | 4 | 2.6 | 2.6 | 28.2 | 61.5 | 5.1 | 2.6 | |||||||||||||
| Gentamicin | British Columbia | 88 | 0.50 | 1 | 0.0 | 14.8 | 71.6 | 13.6 | ||||||||||||||
| Saskatchewan | 134 | 0.50 | 0.50 | 0.0 | 10.4 | 80.6 | 8.2 | 0.7 | ||||||||||||||
| Ontario | 185 | 0.50 | 1 | 1.1 | 9.2 | 75.7 | 13.5 | 0.5 | 1.1 | |||||||||||||
| Québec | 126 | 0.50 | 1 | 0.0 | 9.5 | 69.8 | 19.8 | 0.8 | ||||||||||||||
| Maritimes | 39 | 0.50 | 1 | 0.0 | 33.3 | 56.4 | 10.3 | |||||||||||||||
| Kanamycin | British Columbia | 88 | ≤ 8 | ≤ 8 | 2.3 | 97.7 | 2.3 | |||||||||||||||
| Saskatchewan | 134 | ≤ 8 | ≤ 8 | 0.7 | 99.3 | 0.7 | ||||||||||||||||
| Ontario | 185 | ≤ 8 | ≤ 8 | 1.6 | 98.4 | 1.6 | ||||||||||||||||
| Québec | 126 | ≤ 8 | ≤ 8 | 4.8 | 94.4 | 0.8 | 4.8 | |||||||||||||||
| Maritimes | 39 | ≤ 8 | ≤ 8 | 2.6 | 97.4 | 2.6 | ||||||||||||||||
| Nalidixic acid | British Columbia | 88 | 2 | 4 | 0.0 | 10.2 | 72.7 | 17.0 | ||||||||||||||
| Saskatchewan | 134 | 2 | 2 | 0.0 | 4.5 | 85.8 | 9.7 | |||||||||||||||
| Ontario | 185 | 2 | 2 | 0.0 | 0.5 | 9.7 | 81.6 | 8.1 | ||||||||||||||
| Québec | 126 | 2 | 2 | 0.0 | 13.5 | 77.8 | 8.7 | |||||||||||||||
| Maritimes | 39 | 2 | 2 | 0.0 | 10.3 | 84.6 | 5.1 | |||||||||||||||
| Streptomycin | British Columbia | 88 | ≤ 32 | ≤ 32 | 9.1 | 90.9 | 5.7 | 3.4 | ||||||||||||||
| Saskatchewan | 134 | ≤ 32 | ≤ 32 | 5.2 | 94.8 | 1.5 | 3.7 | |||||||||||||||
| Ontario | 185 | ≤ 32 | 64 | 11.4 | 88.6 | 5.9 | 5.4 | |||||||||||||||
| Québec | 126 | ≤ 32 | ≤ 32 | 7.1 | 92.9 | 4.0 | 3.2 | |||||||||||||||
| Maritimes | 39 | ≤ 32 | ≤ 32 | 5.1 | 94.9 | 5.1 | ||||||||||||||||
| Trimethoprim-sulfamethoxazole | British Columbia | 88 | ≤ 0.12 | 0.25 | 0.0 | 71.6 | 28.4 | |||||||||||||||
| Saskatchewan | 134 | ≤ 0.12 | 0.25 | 0.7 | 71.6 | 24.6 | 3.0 | 0.7 | ||||||||||||||
| Ontario | 185 | ≤ 0.12 | 0.25 | 3.2 | 65.9 | 27.6 | 3.2 | 3.2 | ||||||||||||||
| Québec | 126 | ≤ 0.12 | 0.25 | 0.8 | 75.4 | 22.2 | 1.6 | 0.8 | ||||||||||||||
| Maritimes | 39 | ≤ 0.12 | 0.25 | 2.6 | 66.7 | 28.2 | 2.6 | 2.6 | ||||||||||||||
| III | Chloramphenicol | British Columbia | 88 | 8 | 8 | 0.0 | 5.7 | 35.2 | 56.8 | 2.3 | ||||||||||||
| Saskatchewan | 134 | 4 | 8 | 0.7 | 3.0 | 48.5 | 46.3 | 1.5 | 0.7 | |||||||||||||
| Ontario | 185 | 8 | 8 | 3.2 | 4.3 | 44.3 | 47.0 | 1.1 | 0.5 | 2.7 | ||||||||||||
| Québec | 126 | 4 | 8 | 0.8 | 6.3 | 46.8 | 41.3 | 4.8 | 0.8 | |||||||||||||
| Maritimes | 39 | 4 | 8 | 0.0 | 2.6 | 53.8 | 43.6 | |||||||||||||||
| Sulfisoxazole | British Columbia | 88 | ≤ 16 | 32 | 9.1 | 79.5 | 11.4 | 9.1 | ||||||||||||||
| Saskatchewan | 134 | ≤ 16 | 32 | 7.5 | 86.6 | 6.0 | 7.5 | |||||||||||||||
| Ontario | 185 | ≤ 16 | > 256 | 13.0 | 81.6 | 4.9 | 0.5 | 13.0 | ||||||||||||||
| Québec | 126 | ≤ 16 | 32 | 7.9 | 88.9 | 3.2 | 7.9 | |||||||||||||||
| Maritimes | 39 | ≤ 16 | 32 | 2.6 | 87.2 | 7.7 | 2.6 | 2.6 | ||||||||||||||
| Tetracycline | British Columbia | 88 | ≤ 4 | > 32 | 22.7 | 70.5 | 6.8 | 2.3 | 3.4 | 17.0 | ||||||||||||
| Saskatchewan | 134 | ≤ 4 | > 32 | 20.1 | 76.1 | 3.7 | 3.7 | 16.4 | ||||||||||||||
| Ontario | 185 | ≤ 4 | > 32 | 20.5 | 76.2 | 3.2 | 3.2 | 3.2 | 14.1 | |||||||||||||
| Québec | 126 | ≤ 4 | > 32 | 16.7 | 80.2 | 3.2 | 1.6 | 2.4 | 12.7 | |||||||||||||
| Maritimes | 39 | ≤ 4 | 32 | 17.9 | 66.7 | 15.4 | 12.8 | 5.1 | ||||||||||||||
| IV | ||||||||||||||||||||||
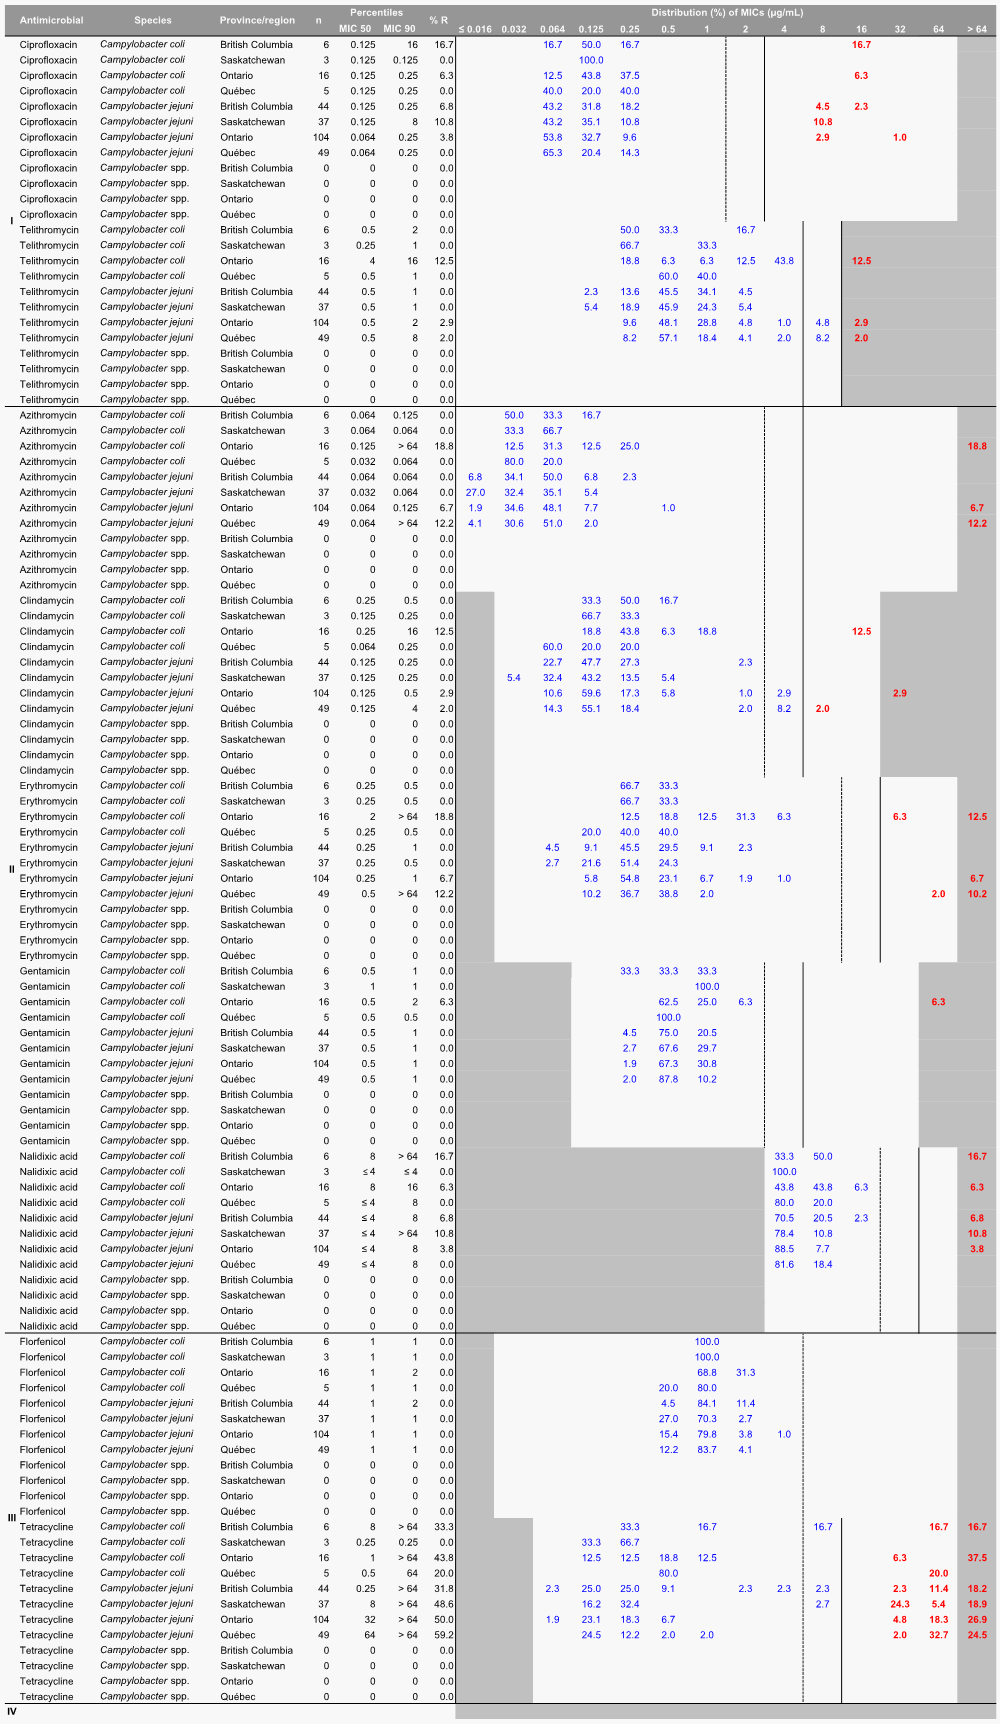
Table B.11. Distribution of minimal inhibitory concentrations for antimicrobials in Campylobacter isolates from beef cattle, by Campylobacter species; Abattoir Surveillance, 2008.
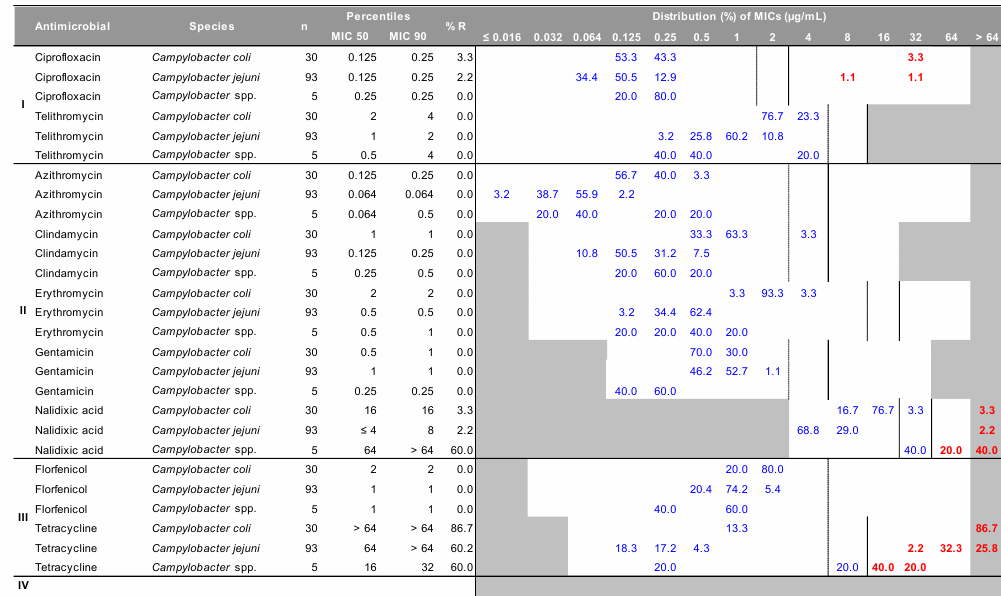
Information on how to interpret the MIC tables is provided at the beginning of Appendix B.
Campylobacter spp. include unidentified species, some of which may be intrinsically resistant to nalidixic acid.
Table B.11. - Text Equivalent
| Antimicrobial | Species | n | Percentiles | % R | Distribution (%) of MICs (µg/mL) | |||||||||||||||
|---|---|---|---|---|---|---|---|---|---|---|---|---|---|---|---|---|---|---|---|---|
| MIC 50 | MIC 90 | ≤ 0.016 | 0.032 | 0.064 | 0.125 | 0.25 | 0.5 | 1 | 2 | 4 | 8 | 16 | 32 | 64 | > 64 | |||||
| I | Ciprofloxacin | Campylobacter coli | 30 | 0.125 | 0.25 | 3.3 | 53.3 | 43.3 | 3.3 | |||||||||||
| Ciprofloxacin | Campylobacter jejuni | 93 | 0.125 | 0.25 | 2.2 | 34.4 | 50.5 | 12.9 | 1.1 | 1.1 | ||||||||||
| Ciprofloxacin | Campylobacter spp. | 5 | 0.25 | 0.25 | 0.0 | 20.0 | 80.0 | |||||||||||||
| Telithromycin | Campylobacter coli | 30 | 2 | 4 | 0.0 | 76.7 | 23.3 | |||||||||||||
| Telithromycin | Campylobacter jejuni | 93 | 1 | 2 | 0.0 | 3.2 | 25.8 | 60.2 | 10.8 | |||||||||||
| Telithromycin | Campylobacter spp. | 5 | 0.5 | 4 | 0.0 | 40.0 | 40.0 | 20.0 | ||||||||||||
| II | Azithromycin | Campylobacter coli | 30 | 0.125 | 0.25 | 0.0 | 56.7 | 40.0 | 3.3 | |||||||||||
| Azithromycin | Campylobacter jejuni | 93 | 0.064 | 0.064 | 0.0 | 3.2 | 38.7 | 55.9 | 2.2 | |||||||||||
| Azithromycin | Campylobacter spp. | 5 | 0.064 | 0.5 | 0.0 | 20.0 | 40.0 | 20.0 | 20.0 | |||||||||||
| Clindamycin | Campylobacter coli | 30 | 1 | 1 | 0.0 | 33.3 | 63.3 | 3.3 | ||||||||||||
| Clindamycin | Campylobacter jejuni | 93 | 0.125 | 0.25 | 0.0 | 10.8 | 50.5 | 31.2 | 7.5 | |||||||||||
| Clindamycin | Campylobacter spp. | 5 | 0.25 | 0.5 | 0.0 | 20.0 | 60.0 | 20.0 | ||||||||||||
| Erythromycin | Campylobacter coli | 30 | 2 | 2 | 0.0 | 3.3 | 93.3 | 3.3 | ||||||||||||
| Erythromycin | Campylobacter jejuni | 93 | 0.5 | 0.5 | 0.0 | 3.2 | 34.4 | 62.4 | ||||||||||||
| Erythromycin | Campylobacter spp. | 5 | 0.5 | 1 | 0.0 | 20.0 | 20.0 | 40.0 | 20.0 | |||||||||||
| Gentamicin | Campylobacter coli | 30 | 0.5 | 1 | 0.0 | 70.0 | 30.0 | |||||||||||||
| Gentamicin | Campylobacter jejuni | 93 | 1 | 1 | 0.0 | 46.2 | 52.7 | 1.1 | ||||||||||||
| Gentamicin | Campylobacter spp. | 5 | 0.25 | 0.25 | 0.0 | 40.0 | 60.0 | |||||||||||||
| Nalidixic acid | Campylobacter coli | 30 | 16 | 16 | 3.3 | 16.7 | 76.7 | 3.3 | 3.3 | |||||||||||
| Nalidixic acid | Campylobacter jejuni | 93 | ≤ 4 | 8 | 2.2 | 68.8 | 29.0 | 2.2 | ||||||||||||
| Nalidixic acid | Campylobacter spp. | 5 | 64 | > 64 | 60.0 | 40.0 | 20.0 | 40.0 | ||||||||||||
| III | Florfenicol | Campylobacter coli | 30 | 2 | 2 | 0.0 | 20.0 | 80.0 | ||||||||||||
| Florfenicol | Campylobacter jejuni | 93 | 1 | 1 | 0.0 | 20.4 | 74.2 | 5.4 | ||||||||||||
| Florfenicol | Campylobacter spp. | 5 | 1 | 1 | 0.0 | 40.0 | 60.0 | |||||||||||||
| Tetracycline | Campylobacter coli | 30 | > 64 | > 64 | 86.7 | 13.3 | 86.7 | |||||||||||||
| Tetracycline | Campylobacter jejuni | 93 | 64 | > 64 | 60.2 | 18.3 | 17.2 | 4.3 | 2.2 | 32.3 | 25.8 | |||||||||
| Tetracycline | Campylobacter spp. | 5 | 16 | 32 | 60.0 | 20.0 | 20.0 | 40.0 | 20.0 | |||||||||||
| IV | ||||||||||||||||||||
Chickens
Table B.12. Distribution of minimal inhibitory concentrations for antimicrobials in Salmonella isolates from chickens; Abattoir Surveillance, 2008.
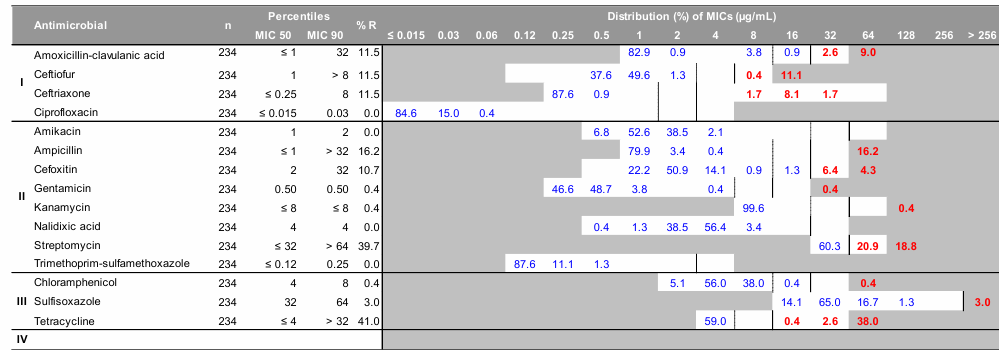
Information on how to interpret the MIC tables is provided at the beginning of Appendix B.
Table B.12. - Text Equivalent
| Antimicrobial | n | Percentiles | % R | Distribution (%) of MICs (µg/mL) | |||||||||||||||||
|---|---|---|---|---|---|---|---|---|---|---|---|---|---|---|---|---|---|---|---|---|---|
| MIC 50 | MIC 90 | ≤ 0.015 | 0.03 | 0.06 | 0.12 | 0.25 | 0.5 | 1 | 2 | 4 | 8 | 16 | 32 | 64 | 128 | 256 | > 256 | ||||
| I | Amoxicillin-clavulanic acid | 234 | ≤ 1 | 32 | 11.5 | 82.9 | 0.9 | 3.8 | 0.9 | 2.6 | 9.0 | ||||||||||
| Ceftiofur | 234 | 1 | > 8 | 11.5 | 37.6 | 49.6 | 1.3 | 0.4 | 11.1 | ||||||||||||
| Ceftriaxone | 234 | ≤ 0.25 | 8 | 11.5 | 87.6 | 0.9 | 1.7 | 8.1 | 1.7 | ||||||||||||
| Ciprofloxacin | 234 | ≤ 0.015 | 0.03 | 0.0 | 84.6 | 15.0 | 0.4 | ||||||||||||||
| II | Amikacin | 234 | 1 | 2 | 0.0 | 6.8 | 52.6 | 38.5 | 2.1 | ||||||||||||
| Ampicillin | 234 | ≤ 1 | > 32 | 16.2 | 79.9 | 3.4 | 0.4 | 16.2 | |||||||||||||
| Cefoxitin | 234 | 2 | 32 | 10.7 | 22.2 | 50.9 | 14.1 | 0.9 | 1.3 | 6.4 | 4.3 | ||||||||||
| Gentamicin | 234 | 0.50 | 0.50 | 0.4 | 46.6 | 48.7 | 3.8 | 0.4 | 0.4 | ||||||||||||
| Kanamycin | 234 | ≤ 8 | ≤ 8 | 0.4 | 99.6 | 0.4 | |||||||||||||||
| Nalidixic acid | 234 | 4 | 4 | 0.0 | 0.4 | 1.3 | 38.5 | 56.4 | 3.4 | ||||||||||||
| Streptomycin | 234 | ≤ 32 | > 64 | 39.7 | 60.3 | 20.9 | 18.8 | ||||||||||||||
| Trimethoprim-sulfamethoxazole | 234 | ≤ 0.12 | 0.25 | 0.0 | 87.6 | 11.1 | 1.3 | ||||||||||||||
| III | Chloramphenicol | 234 | 4 | 8 | 0.4 | 5.1 | 56.0 | 38.0 | 0.4 | 0.4 | |||||||||||
| Sulfisoxazole | 234 | 32 | 64 | 3.0 | 14.1 | 65.0 | 16.7 | 1.3 | 3.0 | ||||||||||||
| Tetracycline | 234 | ≤ 4 | > 32 | 41.0 | 59.0 | 0.4 | 2.6 | 38.0 | |||||||||||||
| IV | |||||||||||||||||||||
Table B.13. Distribution of minimal inhibitory concentrations for antimicrobials in Salmonella isolates from chicken, by province/region; Retail Meat Surveillance, 2008.
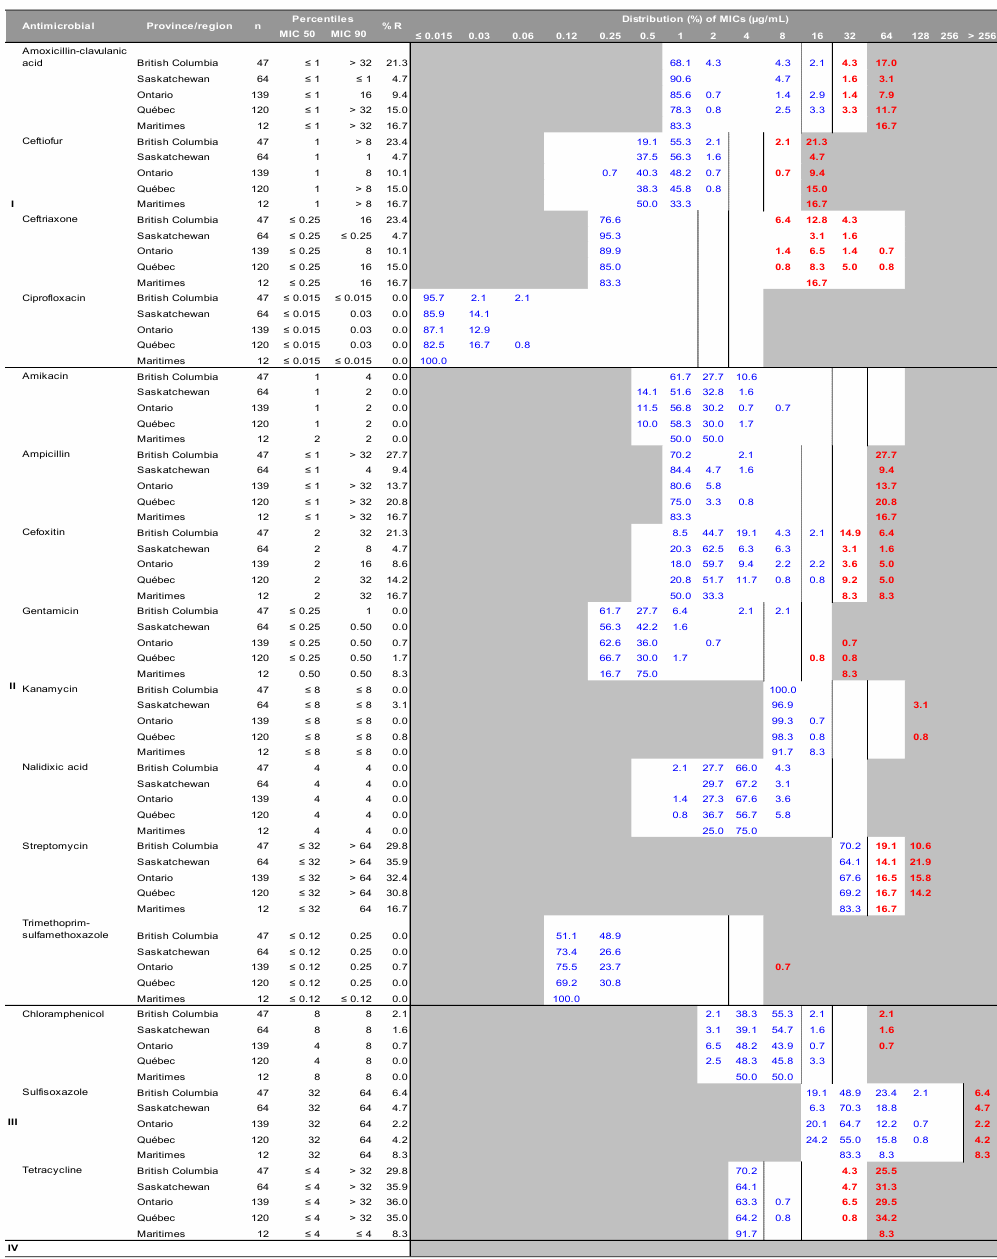
Information on how to interpret the MIC tables is provided at the beginning of Appendix B.
The Maritimes region includes New Brunswick, Nova Scotia, and Prince Edward Island.
Table B.13. - Text Equivalent
| Antimicrobial | Province/region | n | Percentiles | % R | Distribution (%) of MICs (µg/mL) | |||||||||||||||||
|---|---|---|---|---|---|---|---|---|---|---|---|---|---|---|---|---|---|---|---|---|---|---|
| MIC 50 | MIC 90 | ≤ 0.015 | 0.03 | 0.06 | 0.12 | 0.25 | 0.5 | 1 | 2 | 4 | 8 | 16 | 32 | 64 | 128 | 256 | > 256 | |||||
| I | Amoxicillin-clavulanic acid | British Columbia | 47 | ≤ 1 | > 32 | 21.3 | 68.1 | 4.3 | 4.3 | 2.1 | 4.3 | 17.0 | ||||||||||
| Saskatchewan | 64 | ≤ 1 | ≤ 1 | 4.7 | 90.6 | 4.7 | 1.6 | 3.1 | ||||||||||||||
| Ontario | 139 | ≤ 1 | 16 | 9.4 | 85.6 | 0.7 | 1.4 | 2.9 | 1.4 | 7.9 | ||||||||||||
| Québec | 120 | ≤ 1 | > 32 | 15.0 | 78.3 | 0.8 | 2.5 | 3.3 | 3.3 | 11.7 | ||||||||||||
| Maritimes | 12 | ≤ 1 | > 32 | 16.7 | 83.3 | 16.7 | ||||||||||||||||
| Ceftiofur | British Columbia | 47 | 1 | > 8 | 23.4 | 19.1 | 55.3 | 2.1 | 2.1 | 21.3 | ||||||||||||
| Saskatchewan | 64 | 1 | 1 | 4.7 | 37.5 | 56.3 | 1.6 | 4.7 | ||||||||||||||
| Ontario | 139 | 1 | 8 | 10.1 | 0.7 | 40.3 | 48.2 | 0.7 | 0.7 | 9.4 | ||||||||||||
| Québec | 120 | 1 | > 8 | 15.0 | 38.3 | 45.8 | 0.8 | 15.0 | ||||||||||||||
| Maritimes | 12 | 1 | > 8 | 16.7 | 50.0 | 33.3 | 16.7 | |||||||||||||||
| Ceftriaxone | British Columbia | 47 | ≤ 0.25 | 16 | 23.4 | 76.6 | 6.4 | 12.8 | 4.3 | |||||||||||||
| Saskatchewan | 64 | ≤ 0.25 | ≤ 0.25 | 4.7 | 95.3 | 3.1 | 1.6 | |||||||||||||||
| Ontario | 139 | ≤ 0.25 | 8 | 10.1 | 89.9 | 1.4 | 6.5 | 1.4 | 0.7 | |||||||||||||
| Québec | 120 | ≤ 0.25 | 16 | 15.0 | 85.0 | 0.8 | 8.3 | 5.0 | 0.8 | |||||||||||||
| Maritimes | 12 | ≤ 0.25 | 16 | 16.7 | 83.3 | 16.7 | ||||||||||||||||
| Ciprofloxacin | British Columbia | 47 | ≤ 0.015 | ≤ 0.015 | 0.0 | 95.7 | 2.1 | 2.1 | ||||||||||||||
| Saskatchewan | 64 | ≤ 0.015 | 0.03 | 0.0 | 85.9 | 14.1 | ||||||||||||||||
| Ontario | 139 | ≤ 0.015 | 0.03 | 0.0 | 87.1 | 12.9 | ||||||||||||||||
| Québec | 120 | ≤ 0.015 | 0.03 | 0.0 | 82.5 | 16.7 | 0.8 | |||||||||||||||
| Maritimes | 12 | ≤ 0.015 | ≤ 0.015 | 0.0 | 100.0 | |||||||||||||||||
| II | Amikacin | British Columbia | 47 | 1 | 4 | 0.0 | 61.7 | 27.7 | 10.6 | |||||||||||||
| Saskatchewan | 64 | 1 | 2 | 0.0 | 14.1 | 51.6 | 32.8 | 1.6 | ||||||||||||||
| Ontario | 139 | 1 | 2 | 0.0 | 11.5 | 56.8 | 30.2 | 0.7 | 0.7 | |||||||||||||
| Québec | 120 | 1 | 2 | 0.0 | 10.0 | 58.3 | 30.0 | 1.7 | ||||||||||||||
| Maritimes | 12 | 2 | 2 | 0.0 | 50.0 | 50.0 | ||||||||||||||||
| Ampicillin | British Columbia | 47 | ≤ 1 | > 32 | 27.7 | 70.2 | 2.1 | 27.7 | ||||||||||||||
| Saskatchewan | 64 | ≤ 1 | 4 | 9.4 | 84.4 | 4.7 | 1.6 | 9.4 | ||||||||||||||
| Ontario | 139 | ≤ 1 | > 32 | 13.7 | 80.6 | 5.8 | 13.7 | |||||||||||||||
| Québec | 120 | ≤ 1 | > 32 | 20.8 | 75.0 | 3.3 | 0.8 | 20.8 | ||||||||||||||
| Maritimes | 12 | ≤ 1 | > 32 | 16.7 | 83.3 | 16.7 | ||||||||||||||||
| Cefoxitin | British Columbia | 47 | 2 | 32 | 21.3 | 8.5 | 44.7 | 19.1 | 4.3 | 2.1 | 14.9 | 6.4 | ||||||||||
| Saskatchewan | 64 | 2 | 8 | 4.7 | 20.3 | 62.5 | 6.3 | 6.3 | 3.1 | 1.6 | ||||||||||||
| Ontario | 139 | 2 | 16 | 8.6 | 18.0 | 59.7 | 9.4 | 2.2 | 2.2 | 3.6 | 5.0 | |||||||||||
| Québec | 120 | 2 | 32 | 14.2 | 20.8 | 51.7 | 11.7 | 0.8 | 0.8 | 9.2 | 5.0 | |||||||||||
| Maritimes | 12 | 2 | 32 | 16.7 | 50.0 | 33.3 | 8.3 | 8.3 | ||||||||||||||
| Gentamicin | British Columbia | 47 | ≤ 0.25 | 1 | 0.0 | 61.7 | 27.7 | 6.4 | 2.1 | 2.1 | ||||||||||||
| Saskatchewan | 64 | ≤ 0.25 | 0.50 | 0.0 | 56.3 | 42.2 | 1.6 | |||||||||||||||
| Ontario | 139 | ≤ 0.25 | 0.50 | 0.7 | 62.6 | 36.0 | 0.7 | 0.7 | ||||||||||||||
| Québec | 120 | ≤ 0.25 | 0.50 | 1.7 | 66.7 | 30.0 | 1.7 | 0.8 | 0.8 | |||||||||||||
| Maritimes | 12 | 0.50 | 0.50 | 8.3 | 16.7 | 75.0 | 8.3 | |||||||||||||||
| Kanamycin | British Columbia | 47 | ≤ 8 | ≤ 8 | 0.0 | 100.0 | ||||||||||||||||
| Saskatchewan | 64 | ≤ 8 | ≤ 8 | 3.1 | 96.9 | 3.1 | ||||||||||||||||
| Ontario | 139 | ≤ 8 | ≤ 8 | 0.0 | 99.3 | 0.7 | ||||||||||||||||
| Québec | 120 | ≤ 8 | ≤ 8 | 0.8 | 98.3 | 0.8 | 0.8 | |||||||||||||||
| Maritimes | 12 | ≤ 8 | ≤ 8 | 0.0 | 91.7 | 8.3 | ||||||||||||||||
| Nalidixic acid | British Columbia | 47 | 4 | 4 | 0.0 | 2.1 | 27.7 | 66.0 | 4.3 | |||||||||||||
| Saskatchewan | 64 | 4 | 4 | 0.0 | 29.7 | 67.2 | 3.1 | |||||||||||||||
| Ontario | 139 | 4 | 4 | 0.0 | 1.4 | 27.3 | 67.6 | 3.6 | ||||||||||||||
| Québec | 120 | 4 | 4 | 0.0 | 0.8 | 36.7 | 56.7 | 5.8 | ||||||||||||||
| Maritimes | 12 | 4 | 4 | 0.0 | 25.0 | 75.0 | ||||||||||||||||
| Streptomycin | British Columbia | 47 | ≤ 32 | > 64 | 29.8 | 70.2 | 19.1 | 10.6 | ||||||||||||||
| Saskatchewan | 64 | ≤ 32 | > 64 | 35.9 | 64.1 | 14.1 | 21.9 | |||||||||||||||
| Ontario | 139 | ≤ 32 | > 64 | 32.4 | 67.6 | 16.5 | 15.8 | |||||||||||||||
| Québec | 120 | ≤ 32 | > 64 | 30.8 | 69.2 | 16.7 | 14.2 | |||||||||||||||
| Maritimes | 12 | ≤ 32 | 64 | 16.7 | 83.3 | 16.7 | ||||||||||||||||
| Trimethoprim-sulfamethoxazole | British Columbia | 47 | ≤ 0.12 | 0.25 | 0.0 | 51.1 | 48.9 | |||||||||||||||
| Saskatchewan | 64 | ≤ 0.12 | 0.25 | 0.0 | 73.4 | 26.6 | ||||||||||||||||
| Ontario | 139 | ≤ 0.12 | 0.25 | 0.7 | 75.5 | 23.7 | 0.7 | |||||||||||||||
| Québec | 120 | ≤ 0.12 | 0.25 | 0.0 | 69.2 | 30.8 | ||||||||||||||||
| Maritimes | 12 | ≤ 0.12 | ≤ 0.12 | 0.0 | 100.0 | |||||||||||||||||
| III | Chloramphenicol | British Columbia | 47 | 8 | 8 | 2.1 | 2.1 | 38.3 | 55.3 | 2.1 | 2.1 | |||||||||||
| Saskatchewan | 64 | 8 | 8 | 1.6 | 3.1 | 39.1 | 54.7 | 1.6 | 1.6 | |||||||||||||
| Ontario | 139 | 4 | 8 | 0.7 | 6.5 | 48.2 | 43.9 | 0.7 | 0.7 | |||||||||||||
| Québec | 120 | 4 | 8 | 0.0 | 2.5 | 48.3 | 45.8 | 3.3 | ||||||||||||||
| Maritimes | 12 | 8 | 8 | 0.0 | 50.0 | 50.0 | ||||||||||||||||
| Sulfisoxazole | British Columbia | 47 | 32 | 64 | 6.4 | 19.1 | 48.9 | 23.4 | 2.1 | 6.4 | ||||||||||||
| Saskatchewan | 64 | 32 | 64 | 4.7 | 6.3 | 70.3 | 18.8 | 4.7 | ||||||||||||||
| Ontario | 139 | 32 | 64 | 2.2 | 20.1 | 64.7 | 12.2 | 0.7 | 2.2 | |||||||||||||
| Québec | 120 | 32 | 64 | 4.2 | 24.2 | 55.0 | 15.8 | 0.8 | 4.2 | |||||||||||||
| Maritimes | 12 | 32 | 64 | 8.3 | 83.3 | 8.3 | 8.3 | |||||||||||||||
| Tetracycline | British Columbia | 47 | ≤ 4 | > 32 | 29.8 | 70.2 | 4.3 | 25.5 | ||||||||||||||
| Saskatchewan | 64 | ≤ 4 | > 32 | 35.9 | 64.1 | 4.7 | 31.3 | |||||||||||||||
| Ontario | 139 | ≤ 4 | > 32 | 36.0 | 63.3 | 0.7 | 6.5 | 29.5 | ||||||||||||||
| Québec | 120 | ≤ 4 | > 32 | 35.0 | 64.2 | 0.8 | 0.8 | 34.2 | ||||||||||||||
| Maritimes | 12 | ≤ 4 | ≤ 4 | 8.3 | 91.7 | 8.3 | ||||||||||||||||
| IV | ||||||||||||||||||||||
Table B.14. Distribution of minimal inhibitory concentrations for antimicrobials in Salmonella isolates from chickens; Surveillance of Animal Clinical Isolates, 2008.
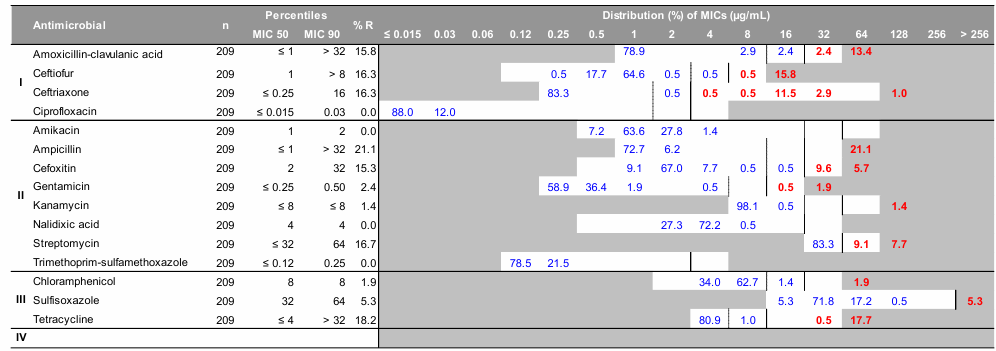
Information on how to interpret the MIC tables is provided at the beginning of Appendix B.
Table B.14. - Text Equivalent
| Antimicrobial | n | Percentiles | % R | Distribution (%) of MICs (µg/mL) | |||||||||||||||||
|---|---|---|---|---|---|---|---|---|---|---|---|---|---|---|---|---|---|---|---|---|---|
| MIC 50 | MIC 90 | ≤ 0.015 | 0.03 | 0.06 | 0.12 | 0.25 | 0.5 | 1 | 2 | 4 | 8 | 16 | 32 | 64 | 128 | 256 | > 256 | ||||
| I | Amoxicillin-clavulanic acid | 209 | ≤ 1 | > 32 | 15.8 | 78.9 | 2.9 | 2.4 | 2.4 | 13.4 | |||||||||||
| Ceftiofur | 209 | 1 | > 8 | 16.3 | 0.5 | 17.7 | 64.6 | 0.5 | 0.5 | 0.5 | 15.8 | ||||||||||
| Ceftriaxone | 209 | ≤ 0.25 | 16 | 16.3 | 83.3 | 0.5 | 0.5 | 0.5 | 11.5 | 2.9 | 1.0 | ||||||||||
| Ciprofloxacin | 209 | ≤ 0.015 | 0.03 | 0.0 | 88.0 | 12.0 | |||||||||||||||
| II | Amikacin | 209 | 1 | 2 | 0.0 | 7.2 | 63.6 | 27.8 | 1.4 | ||||||||||||
| Ampicillin | 209 | ≤ 1 | > 32 | 21.1 | 72.7 | 6.2 | 21.1 | ||||||||||||||
| Cefoxitin | 209 | 2 | 32 | 15.3 | 9.1 | 67.0 | 7.7 | 0.5 | 0.5 | 9.6 | 5.7 | ||||||||||
| Gentamicin | 209 | ≤ 0.25 | 0.50 | 2.4 | 58.9 | 36.4 | 1.9 | 0.5 | 0.5 | 1.9 | |||||||||||
| Kanamycin | 209 | ≤ 8 | ≤ 8 | 1.4 | 98.1 | 0.5 | 1.4 | ||||||||||||||
| Nalidixic acid | 209 | 4 | 4 | 0.0 | 27.3 | 72.2 | 0.5 | ||||||||||||||
| Streptomycin | 209 | ≤ 32 | 64 | 16.7 | 83.3 | 9.1 | 7.7 | ||||||||||||||
| Trimethoprim-sulfamethoxazole | 209 | ≤ 0.12 | 0.25 | 0.0 | 78.5 | 21.5 | |||||||||||||||
| III | Chloramphenicol | 209 | 8 | 8 | 1.9 | 34.0 | 62.7 | 1.4 | 1.9 | ||||||||||||
| Sulfisoxazole | 209 | 32 | 64 | 5.3 | 5.3 | 71.8 | 17.2 | 0.5 | 5.3 | ||||||||||||
| Tetracycline | 209 | ≤ 4 | > 32 | 18.2 | 80.9 | 1.0 | 0.5 | 17.7 | |||||||||||||
| IV | |||||||||||||||||||||
Table B.15. Distribution of minimal inhibitory concentrations for antimicrobials in Escherichia coli isolates from chickens; Abattoir Surveillance, 2008.
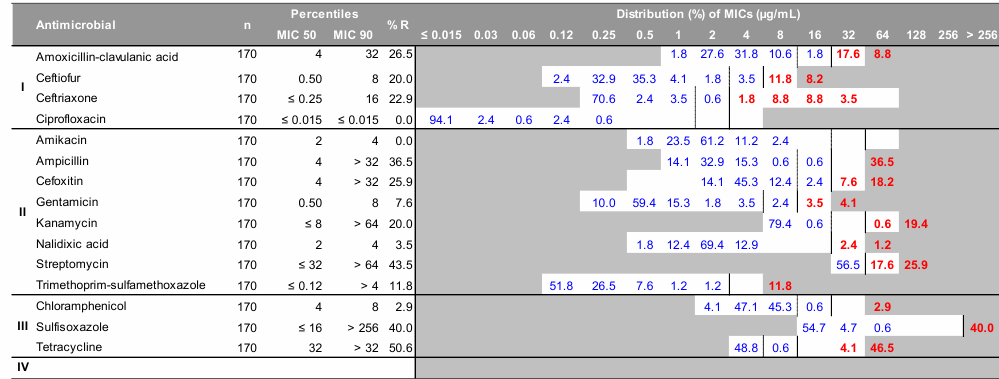
Information on how to interpret the MIC tables is provided at the beginning of Appendix B.
Table B.15. - Text Equivalent
| Antimicrobial | n | Percentiles | % R | Distribution (%) of MICs (µg/mL) | |||||||||||||||||
|---|---|---|---|---|---|---|---|---|---|---|---|---|---|---|---|---|---|---|---|---|---|
| MIC 50 | MIC 90 | ≤ 0.015 | 0.03 | 0.06 | 0.12 | 0.25 | 0.5 | 1 | 2 | 4 | 8 | 16 | 32 | 64 | 128 | 256 | > 256 | ||||
| I | Amoxicillin-clavulanic acid | 170 | 4 | 32 | 26.5 | 1.8 | 27.6 | 31.8 | 10.6 | 1.8 | 17.6 | 8.8 | |||||||||
| Ceftiofur | 170 | 0.50 | 8 | 20.0 | 2.4 | 32.9 | 35.3 | 4.1 | 1.8 | 3.5 | 11.8 | 8.2 | |||||||||
| Ceftriaxone | 170 | ≤ 0.25 | 16 | 22.9 | 70.6 | 2.4 | 3.5 | 0.6 | 1.8 | 8.8 | 8.8 | 3.5 | |||||||||
| Ciprofloxacin | 170 | ≤ 0.015 | ≤ 0.015 | 0.0 | 94.1 | 2.4 | 0.6 | 2.4 | 0.6 | ||||||||||||
| II | Amikacin | 170 | 2 | 4 | 0.0 | 1.8 | 23.5 | 61.2 | 11.2 | 2.4 | |||||||||||
| Ampicillin | 170 | 4 | > 32 | 36.5 | 14.1 | 32.9 | 15.3 | 0.6 | 0.6 | 36.5 | |||||||||||
| Cefoxitin | 170 | 4 | > 32 | 25.9 | 14.1 | 45.3 | 12.4 | 2.4 | 7.6 | 18.2 | |||||||||||
| Gentamicin | 170 | 0.50 | 8 | 7.6 | 10.0 | 59.4 | 15.3 | 1.8 | 3.5 | 2.4 | 3.5 | 4.1 | |||||||||
| Kanamycin | 170 | ≤ 8 | > 64 | 20.0 | 79.4 | 0.6 | 0.6 | 19.4 | |||||||||||||
| Nalidixic acid | 170 | 2 | 4 | 3.5 | 1.8 | 12.4 | 69.4 | 12.9 | 2.4 | 1.2 | |||||||||||
| Streptomycin | 170 | ≤ 32 | > 64 | 43.5 | 56.5 | 17.6 | 25.9 | ||||||||||||||
| Trimethoprim-sulfamethoxazole | 170 | ≤ 0.12 | > 4 | 11.8 | 51.8 | 26.5 | 7.6 | 1.2 | 1.2 | 11.8 | |||||||||||
| III | Chloramphenicol | 170 | 4 | 8 | 2.9 | 4.1 | 47.1 | 45.3 | 0.6 | 2.9 | |||||||||||
| Sulfisoxazole | 170 | ≤ 16 | > 256 | 40.0 | 54.7 | 4.7 | 0.6 | 40.0 | |||||||||||||
| Tetracycline | 170 | 32 | > 32 | 50.6 | 48.8 | 0.6 | 4.1 | 46.5 | |||||||||||||
| IV | |||||||||||||||||||||
Table B.16. Distribution of minimal inhibitory concentrations for antimicrobials in Escherichia coli isolates from chicken, by province/region ; Retail Meat Surveillance, 2008.
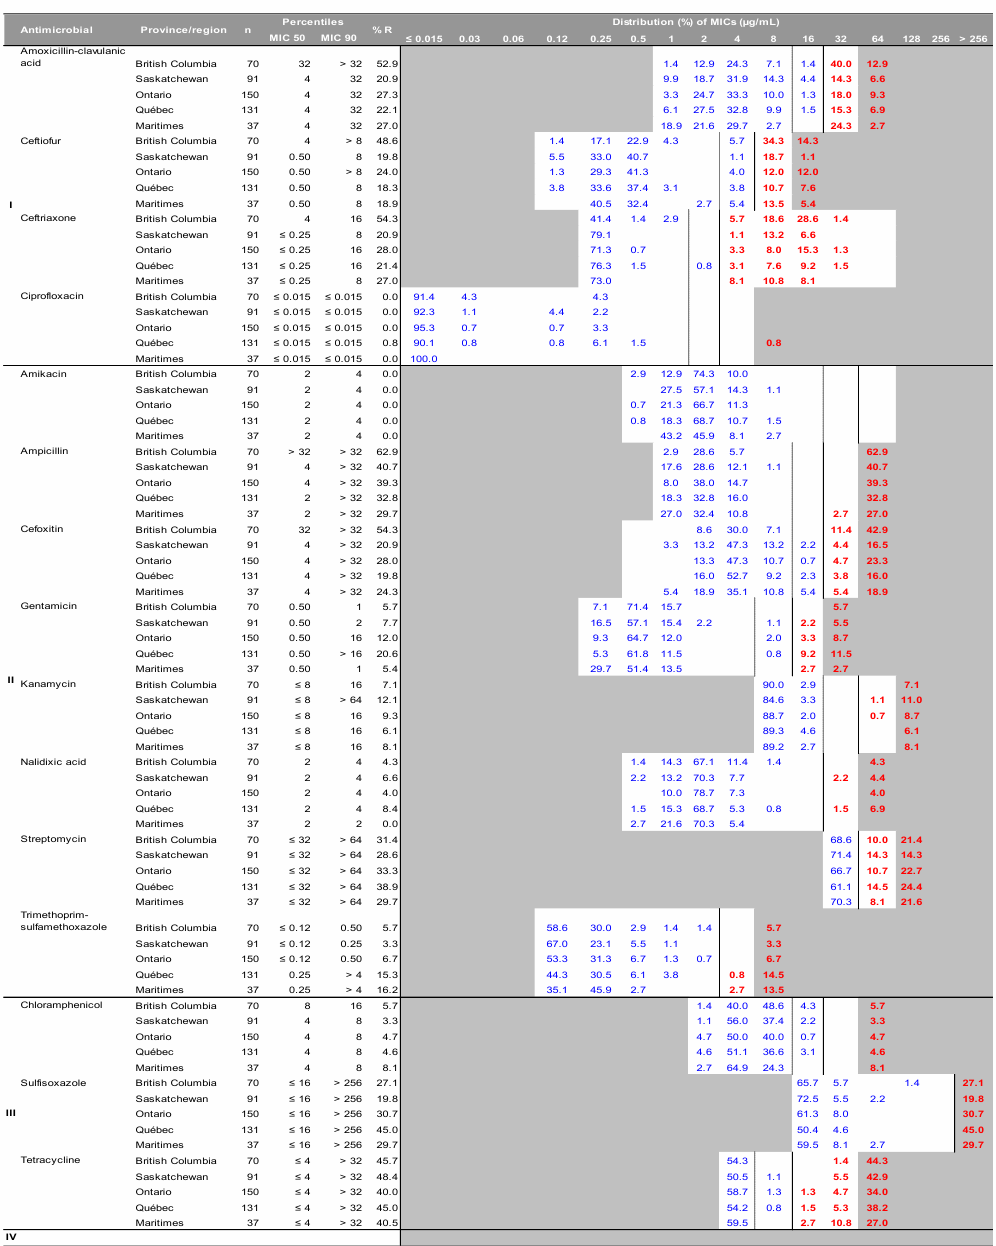
Information on how to interpret the MIC tables is provided at the beginning of Appendix B.
The Maritimes region includes New Brunswick, Nova Scotia, and Prince Edward Island.
Table B.16. - Text Equivalent
| Antimicrobial | Province/region | n | Percentiles | % R | Distribution (%) of MICs (µg/mL) | |||||||||||||||||
|---|---|---|---|---|---|---|---|---|---|---|---|---|---|---|---|---|---|---|---|---|---|---|
| MIC 50 | MIC 90 | ≤ 0.015 | 0.03 | 0.06 | 0.12 | 0.25 | 0.5 | 1 | 2 | 4 | 8 | 16 | 32 | 64 | 128 | 256 | > 256 | |||||
| I | Amoxicillin-clavulanic acid |
British Columbia | 70 | 32 | > 32 | 52.9 | 1.4 | 12.9 | 24.3 | 7.1 | 1.4 | 40.0 | 12.9 | |||||||||
| Saskatchewan | 91 | 4 | 32 | 20.9 | 9.9 | 18.7 | 31.9 | 14.3 | 4.4 | 14.3 | 6.6 | |||||||||||
| Ontario | 150 | 4 | 32 | 27.3 | 3.3 | 24.7 | 33.3 | 10.0 | 1.3 | 18.0 | 9.3 | |||||||||||
| Québec | 131 | 4 | 32 | 22.1 | 6.1 | 27.5 | 32.8 | 9.9 | 1.5 | 15.3 | 6.9 | |||||||||||
| Maritimes | 37 | 4 | 32 | 27.0 | 18.9 | 21.6 | 29.7 | 2.7 | 24.3 | 2.7 | ||||||||||||
| Ceftiofur | British Columbia | 70 | 4 | > 8 | 48.6 | 1.4 | 17.1 | 22.9 | 4.3 | 5.7 | 34.3 | 14.3 | ||||||||||
| Saskatchewan | 91 | 0.50 | 8 | 19.8 | 5.5 | 33.0 | 40.7 | 1.1 | 18.7 | 1.1 | ||||||||||||
| Ontario | 150 | 0.50 | > 8 | 24.0 | 1.3 | 29.3 | 41.3 | 4.0 | 12.0 | 12.0 | ||||||||||||
| Québec | 131 | 0.50 | 8 | 18.3 | 3.8 | 33.6 | 37.4 | 3.1 | 3.8 | 10.7 | 7.6 | |||||||||||
| Maritimes | 37 | 0.50 | 8 | 18.9 | 40.5 | 32.4 | 2.7 | 5.4 | 13.5 | 5.4 | ||||||||||||
| Ceftriaxone | British Columbia | 70 | 4 | 16 | 54.3 | 41.4 | 1.4 | 2.9 | 5.7 | 18.6 | 28.6 | 1.4 | ||||||||||
| Saskatchewan | 91 | ≤ 0.25 | 8 | 20.9 | 79.1 | 1.1 | 13.2 | 6.6 | ||||||||||||||
| Ontario | 150 | ≤ 0.25 | 16 | 28.0 | 71.3 | 0.7 | 3.3 | 8.0 | 15.3 | 1.3 | ||||||||||||
| Québec | 131 | ≤ 0.25 | 16 | 21.4 | 76.3 | 1.5 | 0.8 | 3.1 | 7.6 | 9.2 | 1.5 | |||||||||||
| Maritimes | 37 | ≤ 0.25 | 8 | 27.0 | 73.0 | 8.1 | 10.8 | 8.1 | ||||||||||||||
| Ciprofloxacin | British Columbia | 70 | ≤ 0.015 | ≤ 0.015 | 0.0 | 91.4 | 4.3 | 4.3 | ||||||||||||||
| Saskatchewan | 91 | ≤ 0.015 | ≤ 0.015 | 0.0 | 92.3 | 1.1 | 4.4 | 2.2 | ||||||||||||||
| Ontario | 150 | ≤ 0.015 | ≤ 0.015 | 0.0 | 95.3 | 0.7 | 0.7 | 3.3 | ||||||||||||||
| Québec | 131 | ≤ 0.015 | ≤ 0.015 | 0.8 | 90.1 | 0.8 | 0.8 | 6.1 | 1.5 | 0.8 | ||||||||||||
| Maritimes | 37 | ≤ 0.015 | ≤ 0.015 | 0.0 | 100.0 | |||||||||||||||||
| II | Amikacin | British Columbia | 70 | 2 | 4 | 0.0 | 2.9 | 12.9 | 74.3 | 10.0 | ||||||||||||
| Saskatchewan | 91 | 2 | 4 | 0.0 | 27.5 | 57.1 | 14.3 | 1.1 | ||||||||||||||
| Ontario | 150 | 2 | 4 | 0.0 | 0.7 | 21.3 | 66.7 | 11.3 | ||||||||||||||
| Québec | 131 | 2 | 4 | 0.0 | 0.8 | 18.3 | 68.7 | 10.7 | 1.5 | |||||||||||||
| Maritimes | 37 | 2 | 4 | 0.0 | 43.2 | 45.9 | 8.1 | 2.7 | ||||||||||||||
| Ampicillin | British Columbia | 70 | > 32 | > 32 | 62.9 | 2.9 | 28.6 | 5.7 | 62.9 | |||||||||||||
| Saskatchewan | 91 | 4 | > 32 | 40.7 | 17.6 | 28.6 | 12.1 | 1.1 | 40.7 | |||||||||||||
| Ontario | 150 | 4 | > 32 | 39.3 | 8.0 | 38.0 | 14.7 | 39.3 | ||||||||||||||
| Québec | 131 | 2 | > 32 | 32.8 | 18.3 | 32.8 | 16.0 | 32.8 | ||||||||||||||
| Maritimes | 37 | 2 | > 32 | 29.7 | 27.0 | 32.4 | 10.8 | 2.7 | 27.0 | |||||||||||||
| Cefoxitin | British Columbia | 70 | 32 | > 32 | 54.3 | 8.6 | 30.0 | 7.1 | 11.4 | 42.9 | ||||||||||||
| Saskatchewan | 91 | 4 | > 32 | 20.9 | 3.3 | 13.2 | 47.3 | 13.2 | 2.2 | 4.4 | 16.5 | |||||||||||
| Ontario | 150 | 4 | > 32 | 28.0 | 13.3 | 47.3 | 10.7 | 0.7 | 4.7 | 23.3 | ||||||||||||
| Québec | 131 | 4 | > 32 | 19.8 | 16.0 | 52.7 | 9.2 | 2.3 | 3.8 | 16.0 | ||||||||||||
| Maritimes | 37 | 4 | > 32 | 24.3 | 5.4 | 18.9 | 35.1 | 10.8 | 5.4 | 5.4 | 18.9 | |||||||||||
| Gentamicin | British Columbia | 70 | 0.50 | 1 | 5.7 | 7.1 | 71.4 | 15.7 | 5.7 | |||||||||||||
| Saskatchewan | 91 | 0.50 | 2 | 7.7 | 16.5 | 57.1 | 15.4 | 2.2 | 1.1 | 2.2 | 5.5 | |||||||||||
| Ontario | 150 | 0.50 | 16 | 12.0 | 9.3 | 64.7 | 12.0 | 2.0 | 3.3 | 8.7 | ||||||||||||
| Québec | 131 | 0.50 | > 16 | 20.6 | 5.3 | 61.8 | 11.5 | 0.8 | 9.2 | 11.5 | ||||||||||||
| Maritimes | 37 | 0.50 | 1 | 5.4 | 29.7 | 51.4 | 13.5 | 2.7 | 2.7 | |||||||||||||
| Kanamycin | British Columbia | 70 | ≤ 8 | 16 | 7.1 | 90.0 | 2.9 | 7.1 | ||||||||||||||
| Saskatchewan | 91 | ≤ 8 | > 64 | 12.1 | 84.6 | 3.3 | 1.1 | 11.0 | ||||||||||||||
| Ontario | 150 | ≤ 8 | 16 | 9.3 | 88.7 | 2.0 | 0.7 | 8.7 | ||||||||||||||
| Québec | 131 | ≤ 8 | 16 | 6.1 | 89.3 | 4.6 | 6.1 | |||||||||||||||
| Maritimes | 37 | ≤ 8 | 16 | 8.1 | 89.2 | 2.7 | 8.1 | |||||||||||||||
| Nalidixic acid | British Columbia | 70 | 2 | 4 | 4.3 | 1.4 | 14.3 | 67.1 | 11.4 | 1.4 | 4.3 | |||||||||||
| Saskatchewan | 91 | 2 | 4 | 6.6 | 2.2 | 13.2 | 70.3 | 7.7 | 2.2 | 4.4 | ||||||||||||
| Ontario | 150 | 2 | 4 | 4.0 | 10.0 | 78.7 | 7.3 | 4.0 | ||||||||||||||
| Québec | 131 | 2 | 4 | 8.4 | 1.5 | 15.3 | 68.7 | 5.3 | 0.8 | 1.5 | 6.9 | |||||||||||
| Maritimes | 37 | 2 | 2 | 0.0 | 2.7 | 21.6 | 70.3 | 5.4 | ||||||||||||||
| Streptomycin | British Columbia | 70 | ≤ 32 | > 64 | 31.4 | 68.6 | 10.0 | 21.4 | ||||||||||||||
| Saskatchewan | 91 | ≤ 32 | > 64 | 28.6 | 71.4 | 14.3 | 14.3 | |||||||||||||||
| Ontario | 150 | ≤ 32 | > 64 | 33.3 | 66.7 | 10.7 | 22.7 | |||||||||||||||
| Québec | 131 | ≤ 32 | > 64 | 38.9 | 61.1 | 14.5 | 24.4 | |||||||||||||||
| Maritimes | 37 | ≤ 32 | > 64 | 29.7 | 70.3 | 8.1 | 21.6 | |||||||||||||||
| Trimethoprim-sulfamethoxazole | British Columbia | 70 | ≤ 0.12 | 0.50 | 5.7 | 58.6 | 30.0 | 2.9 | 1.4 | 1.4 | 5.7 | |||||||||||
| Saskatchewan | 91 | ≤ 0.12 | 0.25 | 3.3 | 67.0 | 23.1 | 5.5 | 1.1 | 3.3 | |||||||||||||
| Ontario | 150 | ≤ 0.12 | 0.50 | 6.7 | 53.3 | 31.3 | 6.7 | 1.3 | 0.7 | 6.7 | ||||||||||||
| Québec | 131 | 0.25 | > 4 | 15.3 | 44.3 | 30.5 | 6.1 | 3.8 | 0.8 | 14.5 | ||||||||||||
| Maritimes | 37 | 0.25 | > 4 | 16.2 | 35.1 | 45.9 | 2.7 | 2.7 | 13.5 | |||||||||||||
| III | Chloramphenicol | British Columbia | 70 | 8 | 16 | 5.7 | 1.4 | 40.0 | 48.6 | 4.3 | 5.7 | |||||||||||
| Saskatchewan | 91 | 4 | 8 | 3.3 | 1.1 | 56.0 | 37.4 | 2.2 | 3.3 | |||||||||||||
| Ontario | 150 | 4 | 8 | 4.7 | 4.7 | 50.0 | 40.0 | 0.7 | 4.7 | |||||||||||||
| Québec | 131 | 4 | 8 | 4.6 | 4.6 | 51.1 | 36.6 | 3.1 | 4.6 | |||||||||||||
| Maritimes | 37 | 4 | 8 | 8.1 | 2.7 | 64.9 | 24.3 | 8.1 | ||||||||||||||
| Sulfisoxazole | British Columbia | 70 | ≤ 16 | > 256 | 27.1 | 65.7 | 5.7 | 1.4 | 27.1 | |||||||||||||
| Saskatchewan | 91 | ≤ 16 | > 256 | 19.8 | 72.5 | 5.5 | 2.2 | 19.8 | ||||||||||||||
| Ontario | 150 | ≤ 16 | > 256 | 30.7 | 61.3 | 8.0 | 30.7 | |||||||||||||||
| Québec | 131 | ≤ 16 | > 256 | 45.0 | 50.4 | 4.6 | 45.0 | |||||||||||||||
| Maritimes | 37 | ≤ 16 | > 256 | 29.7 | 59.5 | 8.1 | 2.7 | 29.7 | ||||||||||||||
| Tetracycline | British Columbia | 70 | ≤ 4 | > 32 | 45.7 | 54.3 | 1.4 | 44.3 | ||||||||||||||
| Saskatchewan | 91 | ≤ 4 | > 32 | 48.4 | 50.5 | 1.1 | 5.5 | 42.9 | ||||||||||||||
| Ontario | 150 | ≤ 4 | > 32 | 40.0 | 58.7 | 1.3 | 1.3 | 4.7 | 34.0 | |||||||||||||
| Québec | 131 | ≤ 4 | > 32 | 45.0 | 54.2 | 0.8 | 1.5 | 5.3 | 38.2 | |||||||||||||
| Maritimes | 37 | ≤ 4 | > 32 | 40.5 | 59.5 | 2.7 | 10.8 | 27.0 | ||||||||||||||
| IV | ||||||||||||||||||||||
Table B.17. Distribution of minimal inhibitory concentrations for antimicrobials in Campylobacter isolates from chicken, by Campylobacter species and province ; Retail Meat Surveillance, 2008.
Information on how to interpret the MIC tables is provided at the beginning of Appendix B.
Campylobacter spp. include unidentified species, some of which may be intrinsically resistant to nalidixic acid.
Table B.17. - Text Equivalent
| Antimicrobial | Species | Province/region | n | Percentiles | % R | Distribution (%) of MICs (µg/mL) | |||||||||||||||
|---|---|---|---|---|---|---|---|---|---|---|---|---|---|---|---|---|---|---|---|---|---|
| MIC 50 | MIC 90 | ≤ 0.016 | 0.032 | 0.064 | 0.125 | 0.25 | 0.5 | 1 | 2 | 4 | 8 | 16 | 32 | 64 | > 64 | ||||||
| I | Ciprofloxacin | Campylobacter coli | British Columbia | 6 | 0.125 | 16 | 16.7 | 16.7 | 50.0 | 16.7 | 16.7 | ||||||||||
| Ciprofloxacin | Campylobacter coli | Saskatchewan | 3 | 0.125 | 0.125 | 0.0 | 100.0 | ||||||||||||||
| Ciprofloxacin | Campylobacter coli | Ontario | 16 | 0.125 | 0.25 | 6.3 | 12.5 | 43.8 | 37.5 | 6.3 | |||||||||||
| Ciprofloxacin | Campylobacter coli | Québec | 5 | 0.125 | 0.25 | 0.0 | 40.0 | 20.0 | 40.0 | ||||||||||||
| Ciprofloxacin | Campylobacter jejuni | British Columbia | 44 | 0.125 | 0.25 | 6.8 | 43.2 | 31.8 | 18.2 | 4.5 | 2.3 | ||||||||||
| Ciprofloxacin | Campylobacter jejuni | Saskatchewan | 37 | 0.125 | 8 | 10.8 | 43.2 | 35.1 | 10.8 | 10.8 | |||||||||||
| Ciprofloxacin | Campylobacter jejuni | Ontario | 104 | 0.064 | 0.25 | 3.8 | 53.8 | 32.7 | 9.6 | 2.9 | 1.0 | ||||||||||
| Ciprofloxacin | Campylobacter jejuni | Québec | 49 | 0.064 | 0.25 | 0.0 | 65.3 | 20.4 | 14.3 | ||||||||||||
| Ciprofloxacin | Campylobacter spp. | British Columbia | 0 | 0 | 0 | 0.0 | |||||||||||||||
| Ciprofloxacin | Campylobacter spp. | Saskatchewan | 0 | 0 | 0 | 0.0 | |||||||||||||||
| Ciprofloxacin | Campylobacter spp. | Ontario | 0 | 0 | 0 | 0.0 | |||||||||||||||
| Ciprofloxacin | Campylobacter spp. | Québec | 0 | 0 | 0 | 0.0 | |||||||||||||||
| Telithromycin | Campylobacter coli | British Columbia | 6 | 0.5 | 2 | 0.0 | 50.0 | 33.3 | 16.7 | ||||||||||||
| Telithromycin | Campylobacter coli | Saskatchewan | 3 | 0.25 | 1 | 0.0 | 66.7 | 33.3 | |||||||||||||
| Telithromycin | Campylobacter coli | Ontario | 16 | 4 | 16 | 12.5 | 18.8 | 6.3 | 6.3 | 12.5 | 43.8 | 12.5 | |||||||||
| Telithromycin | Campylobacter coli | Québec | 5 | 0.5 | 1 | 0.0 | 60.0 | 40.0 | |||||||||||||
| Telithromycin | Campylobacter jejuni | British Columbia | 44 | 0.5 | 1 | 0.0 | 2.3 | 13.6 | 45.5 | 34.1 | 4.5 | ||||||||||
| Telithromycin | Campylobacter jejuni | Saskatchewan | 37 | 0.5 | 1 | 0.0 | 5.4 | 18.9 | 45.9 | 24.3 | 5.4 | ||||||||||
| Telithromycin | Campylobacter jejuni | Ontario | 104 | 0.5 | 2 | 2.9 | 9.6 | 48.1 | 28.8 | 4.8 | 1.0 | 4.8 | 2.9 | ||||||||
| Telithromycin | Campylobacter jejuni | Québec | 49 | 0.5 | 8 | 2.0 | 8.2 | 57.1 | 18.4 | 4.1 | 2.0 | 8.2 | 2.0 | ||||||||
| Telithromycin | Campylobacter spp. | British Columbia | 0 | 0 | 0 | 0.0 | |||||||||||||||
| Telithromycin | Campylobacter spp. | Saskatchewan | 0 | 0 | 0 | 0.0 | |||||||||||||||
| Telithromycin | Campylobacter spp. | Ontario | 0 | 0 | 0 | 0.0 | |||||||||||||||
| Telithromycin | Campylobacter spp. | Québec | 0 | 0 | 0 | 0.0 | |||||||||||||||
| II | Azithromycin | Campylobacter coli | British Columbia | 6 | 0.064 | 0.125 | 0.0 | 50.0 | 33.3 | 16.7 | |||||||||||
| Azithromycin | Campylobacter coli | Saskatchewan | 3 | 0.064 | 0.064 | 0.0 | 33.3 | 66.7 | |||||||||||||
| Azithromycin | Campylobacter coli | Ontario | 16 | 0.125 | > 64 | 18.8 | 12.5 | 31.3 | 12.5 | 25.0 | 18.8 | ||||||||||
| Azithromycin | Campylobacter coli | Québec | 5 | 0.032 | 0.064 | 0.0 | 80.0 | 20.0 | |||||||||||||
| Azithromycin | Campylobacter jejuni | British Columbia | 44 | 0.064 | 0.064 | 0.0 | 6.8 | 34.1 | 50.0 | 6.8 | 2.3 | ||||||||||
| Azithromycin | Campylobacter jejuni | Saskatchewan | 37 | 0.032 | 0.064 | 0.0 | 27.0 | 32.4 | 35.1 | 5.4 | |||||||||||
| Azithromycin | Campylobacter jejuni | Ontario | 104 | 0.064 | 0.125 | 6.7 | 1.9 | 34.6 | 48.1 | 7.7 | 1.0 | 6.7 | |||||||||
| Azithromycin | Campylobacter jejuni | Québec | 49 | 0.064 | > 64 | 12.2 | 4.1 | 30.6 | 51.0 | 2.0 | 12.2 | ||||||||||
| Azithromycin | Campylobacter spp. | British Columbia | 0 | 0 | 0 | 0.0 | |||||||||||||||
| Azithromycin | Campylobacter spp. | Saskatchewan | 0 | 0 | 0 | 0.0 | |||||||||||||||
| Azithromycin | Campylobacter spp. | Ontario | 0 | 0 | 0 | 0.0 | |||||||||||||||
| Azithromycin | Campylobacter spp. | Québec | 0 | 0 | 0 | 0.0 | |||||||||||||||
| Clindamycin | Campylobacter coli | British Columbia | 6 | 0.25 | 0.5 | 0.0 | 33.3 | 50.0 | 16.7 | ||||||||||||
| Clindamycin | Campylobacter coli | Saskatchewan | 3 | 0.125 | 0.25 | 0.0 | 66.7 | 33.3 | |||||||||||||
| Clindamycin | Campylobacter coli | Ontario | 16 | 0.25 | 16 | 12.5 | 18.8 | 43.8 | 6.3 | 18.8 | 12.5 | ||||||||||
| Clindamycin | Campylobacter coli | Québec | 5 | 0.064 | 0.25 | 0.0 | 60.0 | 20.0 | 20.0 | ||||||||||||
| Clindamycin | Campylobacter jejuni | British Columbia | 44 | 0.125 | 0.25 | 0.0 | 22.7 | 47.7 | 27.3 | 2.3 | |||||||||||
| Clindamycin | Campylobacter jejuni | Saskatchewan | 37 | 0.125 | 0.25 | 0.0 | 5.4 | 32.4 | 43.2 | 13.5 | 5.4 | ||||||||||
| Clindamycin | Campylobacter jejuni | Ontario | 104 | 0.125 | 0.5 | 2.9 | 10.6 | 59.6 | 17.3 | 5.8 | 1.0 | 2.9 | 2.9 | ||||||||
| Clindamycin | Campylobacter jejuni | Québec | 49 | 0.125 | 4 | 2.0 | 14.3 | 55.1 | 18.4 | 2.0 | 8.2 | 2.0 | |||||||||
| Clindamycin | Campylobacter spp. | British Columbia | 0 | 0 | 0 | 0.0 | |||||||||||||||
| Clindamycin | Campylobacter spp. | Saskatchewan | 0 | 0 | 0 | 0.0 | |||||||||||||||
| Clindamycin | Campylobacter spp. | Ontario | 0 | 0 | 0 | 0.0 | |||||||||||||||
| Clindamycin | Campylobacter spp. | Québec | 0 | 0 | 0 | 0.0 | |||||||||||||||
| Erythromycin | Campylobacter coli | British Columbia | 6 | 0.25 | 0.5 | 0.0 | 66.7 | 33.3 | |||||||||||||
| Erythromycin | Campylobacter coli | Saskatchewan | 3 | 0.25 | 0.5 | 0.0 | 66.7 | 33.3 | |||||||||||||
| Erythromycin | Campylobacter coli | Ontario | 16 | 2 | > 64 | 18.8 | 12.5 | 18.8 | 12.5 | 31.3 | 6.3 | 6.3 | 12.5 | ||||||||
| Erythromycin | Campylobacter coli | Québec | 5 | 0.25 | 0.5 | 0.0 | 20.0 | 40.0 | 40.0 | ||||||||||||
| Erythromycin | Campylobacter jejuni | British Columbia | 44 | 0.25 | 1 | 0.0 | 4.5 | 9.1 | 45.5 | 29.5 | 9.1 | 2.3 | |||||||||
| Erythromycin | Campylobacter jejuni | Saskatchewan | 37 | 0.25 | 0.5 | 0.0 | 2.7 | 21.6 | 51.4 | 24.3 | |||||||||||
| Erythromycin | Campylobacter jejuni | Ontario | 104 | 0.25 | 1 | 6.7 | 5.8 | 54.8 | 23.1 | 6.7 | 1.9 | 1.0 | 6.7 | ||||||||
| Erythromycin | Campylobacter jejuni | Québec | 49 | 0.5 | > 64 | 12.2 | 10.2 | 36.7 | 38.8 | 2.0 | 2.0 | 10.2 | |||||||||
| Erythromycin | Campylobacter spp. | British Columbia | 0 | 0 | 0 | 0.0 | |||||||||||||||
| Erythromycin | Campylobacter spp. | Saskatchewan | 0 | 0 | 0 | 0.0 | |||||||||||||||
| Erythromycin | Campylobacter spp. | Ontario | 0 | 0 | 0 | 0.0 | |||||||||||||||
| Erythromycin | Campylobacter spp. | Québec | 0 | 0 | 0 | 0.0 | |||||||||||||||
| Gentamicin | Campylobacter coli | British Columbia | 6 | 0.5 | 1 | 0.0 | 33.3 | 33.3 | 33.3 | ||||||||||||
| Gentamicin | Campylobacter coli | Saskatchewan | 3 | 1 | 1 | 0.0 | 100.0 | ||||||||||||||
| Gentamicin | Campylobacter coli | Ontario | 16 | 0.5 | 2 | 6.3 | 62.5 | 25.0 | 6.3 | 6.3 | |||||||||||
| Gentamicin | Campylobacter coli | Québec | 5 | 0.5 | 0.5 | 0.0 | 100.0 | ||||||||||||||
| Gentamicin | Campylobacter jejuni | British Columbia | 44 | 0.5 | 1 | 0.0 | 4.5 | 75.0 | 20.5 | ||||||||||||
| Gentamicin | Campylobacter jejuni | Saskatchewan | 37 | 0.5 | 1 | 0.0 | 2.7 | 67.6 | 29.7 | ||||||||||||
| Gentamicin | Campylobacter jejuni | Ontario | 104 | 0.5 | 1 | 0.0 | 1.9 | 67.3 | 30.8 | ||||||||||||
| Gentamicin | Campylobacter jejuni | Québec | 49 | 0.5 | 1 | 0.0 | 2.0 | 87.8 | 10.2 | ||||||||||||
| Gentamicin | Campylobacter spp. | British Columbia | 0 | 0 | 0 | 0.0 | |||||||||||||||
| Gentamicin | Campylobacter spp. | Saskatchewan | 0 | 0 | 0 | 0.0 | |||||||||||||||
| Gentamicin | Campylobacter spp. | Ontario | 0 | 0 | 0 | 0.0 | |||||||||||||||
| Gentamicin | Campylobacter spp. | Québec | 0 | 0 | 0 | 0.0 | |||||||||||||||
| Nalidixic acid | Campylobacter coli | British Columbia | 6 | 8 | > 64 | 16.7 | 33.3 | 50.0 | 16.7 | ||||||||||||
| Nalidixic acid | Campylobacter coli | Saskatchewan | 3 | ≤ 4 | ≤ 4 | 0.0 | 100.0 | ||||||||||||||
| Nalidixic acid | Campylobacter coli | Ontario | 16 | 8 | 16 | 6.3 | 43.8 | 43.8 | 6.3 | 6.3 | |||||||||||
| Nalidixic acid | Campylobacter coli | Québec | 5 | ≤ 4 | 8 | 0.0 | 80.0 | 20.0 | |||||||||||||
| Nalidixic acid | Campylobacter jejuni | British Columbia | 44 | ≤ 4 | 8 | 6.8 | 70.5 | 20.5 | 2.3 | 6.8 | |||||||||||
| Nalidixic acid | Campylobacter jejuni | Saskatchewan | 37 | ≤ 4 | > 64 | 10.8 | 78.4 | 10.8 | 10.8 | ||||||||||||
| Nalidixic acid | Campylobacter jejuni | Ontario | 104 | ≤ 4 | 8 | 3.8 | 88.5 | 7.7 | 3.8 | ||||||||||||
| Nalidixic acid | Campylobacter jejuni | Québec | 49 | ≤ 4 | 8 | 0.0 | 81.6 | 18.4 | |||||||||||||
| Nalidixic acid | Campylobacter spp. | British Columbia | 0 | 0 | 0 | 0.0 | |||||||||||||||
| Nalidixic acid | Campylobacter spp. | Saskatchewan | 0 | 0 | 0 | 0.0 | |||||||||||||||
| Nalidixic acid | Campylobacter spp. | Ontario | 0 | 0 | 0 | 0.0 | |||||||||||||||
| Nalidixic acid | Campylobacter spp. | Québec | 0 | 0 | 0 | 0.0 | |||||||||||||||
| III | Florfenicol | Campylobacter coli | British Columbia | 6 | 1 | 1 | 0.0 | 100.0 | |||||||||||||
| Florfenicol | Campylobacter coli | Saskatchewan | 3 | 1 | 1 | 0.0 | 100.0 | ||||||||||||||
| Florfenicol | Campylobacter coli | Ontario | 16 | 1 | 2 | 0.0 | 68.8 | 31.3 | |||||||||||||
| Florfenicol | Campylobacter coli | Québec | 5 | 1 | 1 | 0.0 | 20.0 | 80.0 | |||||||||||||
| Florfenicol | Campylobacter jejuni | British Columbia | 44 | 1 | 2 | 0.0 | 4.5 | 84.1 | 11.4 | ||||||||||||
| Florfenicol | Campylobacter jejuni | Saskatchewan | 37 | 1 | 1 | 0.0 | 27.0 | 70.3 | 2.7 | ||||||||||||
| Florfenicol | Campylobacter jejuni | Ontario | 104 | 1 | 1 | 0.0 | 15.4 | 79.8 | 3.8 | 1.0 | |||||||||||
| Florfenicol | Campylobacter jejuni | Québec | 49 | 1 | 1 | 0.0 | 12.2 | 83.7 | 4.1 | ||||||||||||
| Florfenicol | Campylobacter spp. | British Columbia | 0 | 0 | 0 | 0.0 | |||||||||||||||
| Florfenicol | Campylobacter spp. | Saskatchewan | 0 | 0 | 0 | 0.0 | |||||||||||||||
| Florfenicol | Campylobacter spp. | Ontario | 0 | 0 | 0 | 0.0 | |||||||||||||||
| Florfenicol | Campylobacter spp. | Québec | 0 | 0 | 0 | 0.0 | |||||||||||||||
| Tetracycline | Campylobacter coli | British Columbia | 6 | 8 | > 64 | 33.3 | 33.3 | 16.7 | 16.7 | 16.7 | 16.7 | ||||||||||
| Tetracycline | Campylobacter coli | Saskatchewan | 3 | 0.25 | 0.25 | 0.0 | 33.3 | 66.7 | |||||||||||||
| Tetracycline | Campylobacter coli | Ontario | 16 | 1 | > 64 | 43.8 | 12.5 | 12.5 | 18.8 | 12.5 | 6.3 | 37.5 | |||||||||
| Tetracycline | Campylobacter coli | Québec | 5 | 0.5 | 64 | 20.0 | 80.0 | 20.0 | |||||||||||||
| Tetracycline | Campylobacter jejuni | British Columbia | 44 | 0.25 | > 64 | 31.8 | 2.3 | 25.0 | 25.0 | 9.1 | 2.3 | 2.3 | 2.3 | 2.3 | 11.4 | 18.2 | |||||
| Tetracycline | Campylobacter jejuni | Saskatchewan | 37 | 8 | > 64 | 48.6 | 16.2 | 32.4 | 2.7 | 24.3 | 5.4 | 18.9 | |||||||||
| Tetracycline | Campylobacter jejuni | Ontario | 104 | 32 | > 64 | 50.0 | 1.9 | 23.1 | 18.3 | 6.7 | 4.8 | 18.3 | 26.9 | ||||||||
| Tetracycline | Campylobacter jejuni | Québec | 49 | 64 | > 64 | 59.2 | 24.5 | 12.2 | 2.0 | 2.0 | 2.0 | 32.7 | 24.5 | ||||||||
| Tetracycline | Campylobacter spp. | British Columbia | 0 | 0 | 0 | 0.0 | |||||||||||||||
| Tetracycline | Campylobacter spp. | Saskatchewan | 0 | 0 | 0 | 0.0 | |||||||||||||||
| Tetracycline | Campylobacter spp. | Ontario | 0 | 0 | 0 | 0.0 | |||||||||||||||
| Tetracycline | Campylobacter spp. | Québec | 0 | 0 | 0 | 0.0 | |||||||||||||||
| IV | |||||||||||||||||||||
Table B.18. Distribution of minimal inhibitory concentrations for antimicrobials in Enterococcus isolates from chicken, by Enterococcus species and province; Retail Meat Surveillance, 2008.
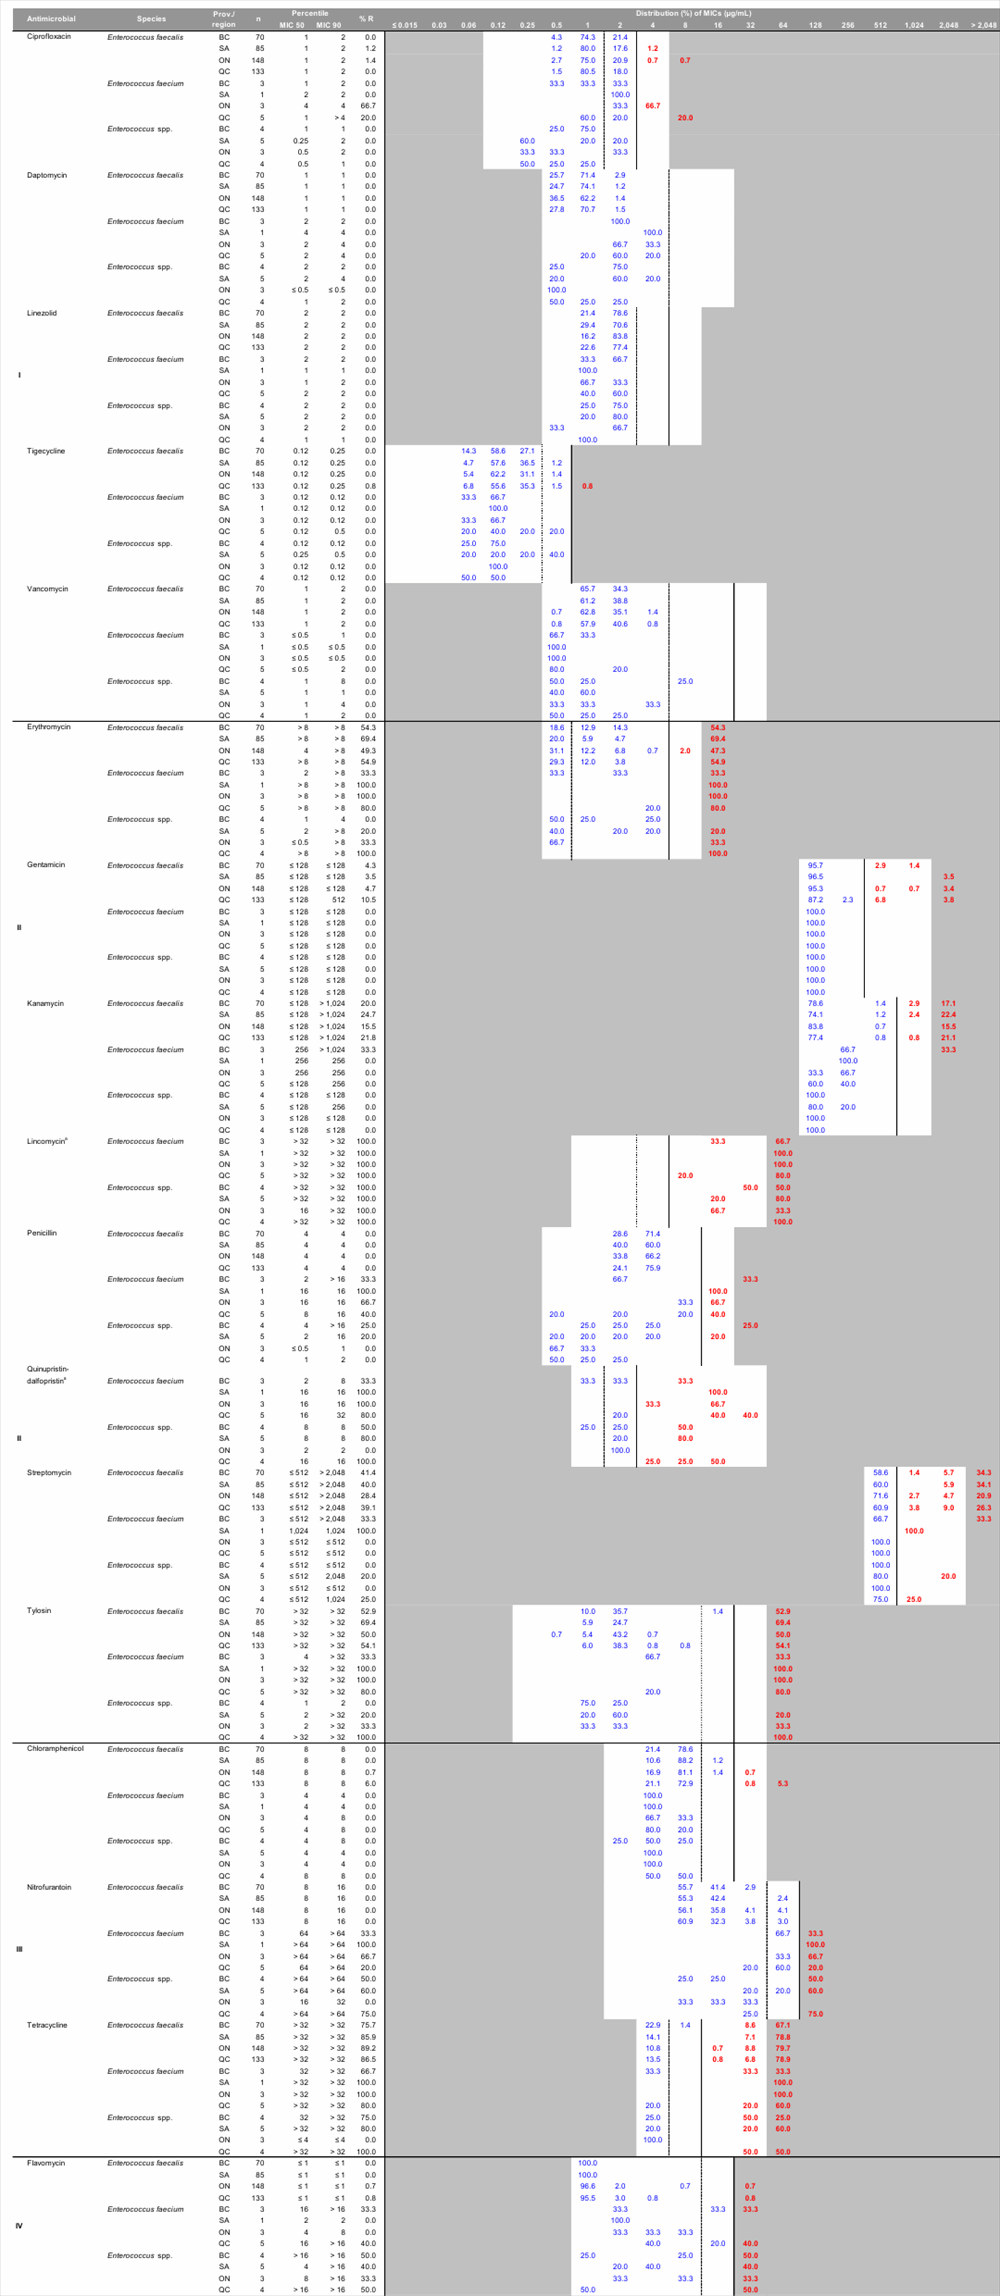
Information on how to interpret the MIC tables is provided at the beginning of Appendix B.
a Resistance to quinupristin-dalfopristin and lincomycin is not reported for E. faecalis because E. faecalis is intrinsically resistant to these antimicrobials.
Table B.18. - Text Equivalent
| Antimicrobial | Species | Prov./ region | n | Percentile | % R | Distribution (%) of MICs (µg/mL) | ||||||||||||||||||||
|---|---|---|---|---|---|---|---|---|---|---|---|---|---|---|---|---|---|---|---|---|---|---|---|---|---|---|
| MIC 50 | MIC 90 | ≤ 0.015 | 0.03 | 0.06 | 0.12 | 0.25 | 0.5 | 1 | 2 | 4 | 8 | 16 | 32 | 64 | 128 | 256 | 512 | 1,024 | 2,048 | > 2,048 | ||||||
| I | Ciprofloxacin | Enterococcus faecalis | BC | 70 | 1 | 2 | 0.0 | 4.3 | 74.3 | 21.4 | ||||||||||||||||
| SA | 85 | 1 | 2 | 1.2 | 1.2 | 80.0 | 17.6 | 1.2 | ||||||||||||||||||
| ON | 148 | 1 | 2 | 1.4 | 2.7 | 75.0 | 20.9 | 0.7 | 0.7 | |||||||||||||||||
| QC | 133 | 1 | 2 | 0.0 | 1.5 | 80.5 | 18.0 | |||||||||||||||||||
| Enterococcus faecium | BC | 3 | 1 | 2 | 0.0 | 33.3 | 33.3 | 33.3 | ||||||||||||||||||
| SA | 1 | 2 | 2 | 0.0 | 100.0 | |||||||||||||||||||||
| ON | 3 | 4 | 4 | 66.7 | 33.3 | 66.7 | ||||||||||||||||||||
| QC | 5 | 1 | > 4 | 20.0 | 60.0 | 20.0 | 20.0 | |||||||||||||||||||
| Enterococcus spp. | BC | 4 | 1 | 1 | 0.0 | 25.0 | 75.0 | |||||||||||||||||||
| SA | 5 | 0.25 | 2 | 0.0 | 60.0 | 20.0 | 20.0 | |||||||||||||||||||
| ON | 3 | 0.5 | 2 | 0.0 | 33.3 | 33.3 | 33.3 | |||||||||||||||||||
| QC | 4 | 0.5 | 1 | 0.0 | 50.0 | 25.0 | 25.0 | |||||||||||||||||||
| Daptomycin | Enterococcus faecalis | BC | 70 | 1 | 1 | 0.0 | 25.7 | 71.4 | 2.9 | |||||||||||||||||
| SA | 85 | 1 | 1 | 0.0 | 24.7 | 74.1 | 1.2 | |||||||||||||||||||
| ON | 148 | 1 | 1 | 0.0 | 36.5 | 62.2 | 1.4 | |||||||||||||||||||
| QC | 133 | 1 | 1 | 0.0 | 27.8 | 70.7 | 1.5 | |||||||||||||||||||
| Enterococcus faecium | BC | 3 | 2 | 2 | 0.0 | 100.0 | ||||||||||||||||||||
| SA | 1 | 4 | 4 | 0.0 | 100.0 | |||||||||||||||||||||
| ON | 3 | 2 | 4 | 0.0 | 66.7 | 33.3 | ||||||||||||||||||||
| QC | 5 | 2 | 4 | 0.0 | 20.0 | 60.0 | 20.0 | |||||||||||||||||||
| Enterococcus spp. | BC | 4 | 2 | 2 | 0.0 | 25.0 | 75.0 | |||||||||||||||||||
| SA | 5 | 2 | 4 | 0.0 | 20.0 | 60.0 | 20.0 | |||||||||||||||||||
| ON | 3 | ≤ 0.5 | ≤ 0.5 | 0.0 | 100.0 | |||||||||||||||||||||
| QC | 4 | 1 | 2 | 0.0 | 50.0 | 25.0 | 25.0 | |||||||||||||||||||
| Linezolid | Enterococcus faecalis | BC | 70 | 2 | 2 | 0.0 | 21.4 | 78.6 | ||||||||||||||||||
| SA | 85 | 2 | 2 | 0.0 | 29.4 | 70.6 | ||||||||||||||||||||
| ON | 148 | 2 | 2 | 0.0 | 16.2 | 83.8 | ||||||||||||||||||||
| QC | 133 | 2 | 2 | 0.0 | 22.6 | 77.4 | ||||||||||||||||||||
| Enterococcus faecium | BC | 3 | 2 | 2 | 0.0 | 33.3 | 66.7 | |||||||||||||||||||
| SA | 1 | 1 | 1 | 0.0 | 100.0 | |||||||||||||||||||||
| ON | 3 | 1 | 2 | 0.0 | 66.7 | 33.3 | ||||||||||||||||||||
| QC | 5 | 2 | 2 | 0.0 | 40.0 | 60.0 | ||||||||||||||||||||
| Enterococcus spp. | BC | 4 | 2 | 2 | 0.0 | 25.0 | 75.0 | |||||||||||||||||||
| SA | 5 | 2 | 2 | 0.0 | 20.0 | 80.0 | ||||||||||||||||||||
| ON | 3 | 2 | 2 | 0.0 | 33.3 | 66.7 | ||||||||||||||||||||
| QC | 4 | 1 | 1 | 0.0 | 100.0 | |||||||||||||||||||||
| Tigecycline | Enterococcus faecalis | BC | 70 | 0.12 | 0.25 | 0.0 | 14.3 | 58.6 | 27.1 | |||||||||||||||||
| SA | 85 | 0.12 | 0.25 | 0.0 | 4.7 | 57.6 | 36.5 | 1.2 | ||||||||||||||||||
| ON | 148 | 0.12 | 0.25 | 0.0 | 5.4 | 62.2 | 31.1 | 1.4 | ||||||||||||||||||
| QC | 133 | 0.12 | 0.25 | 0.8 | 6.8 | 55.6 | 35.3 | 1.5 | 0.8 | |||||||||||||||||
| Enterococcus faecium | BC | 3 | 0.12 | 0.12 | 0.0 | 33.3 | 66.7 | |||||||||||||||||||
| SA | 1 | 0.12 | 0.12 | 0.0 | 100.0 | |||||||||||||||||||||
| ON | 3 | 0.12 | 0.12 | 0.0 | 33.3 | 66.7 | ||||||||||||||||||||
| QC | 5 | 0.12 | 0.5 | 0.0 | 20.0 | 40.0 | 20.0 | 20.0 | ||||||||||||||||||
| Enterococcus spp. | BC | 4 | 0.12 | 0.12 | 0.0 | 25.0 | 75.0 | |||||||||||||||||||
| SA | 5 | 0.25 | 0.5 | 0.0 | 20.0 | 20.0 | 20.0 | 40.0 | ||||||||||||||||||
| ON | 3 | 0.12 | 0.12 | 0.0 | 100.0 | |||||||||||||||||||||
| QC | 4 | 0.12 | 0.12 | 0.0 | 50.0 | 50.0 | ||||||||||||||||||||
| Vancomycin | Enterococcus faecalis | BC | 70 | 1 | 2 | 0.0 | 65.7 | 34.3 | ||||||||||||||||||
| SA | 85 | 1 | 2 | 0.0 | 61.2 | 38.8 | ||||||||||||||||||||
| ON | 148 | 1 | 2 | 0.0 | 0.7 | 62.8 | 35.1 | 1.4 | ||||||||||||||||||
| QC | 133 | 1 | 2 | 0.0 | 0.8 | 57.9 | 40.6 | 0.8 | ||||||||||||||||||
| Enterococcus faecium | BC | 3 | ≤ 0.5 | 1 | 0.0 | 66.7 | 33.3 | |||||||||||||||||||
| SA | 1 | ≤ 0.5 | ≤ 0.5 | 0.0 | 100.0 | |||||||||||||||||||||
| ON | 3 | ≤ 0.5 | ≤ 0.5 | 0.0 | 100.0 | |||||||||||||||||||||
| QC | 5 | ≤ 0.5 | 2 | 0.0 | 80.0 | 20.0 | ||||||||||||||||||||
| Enterococcus spp. | BC | 4 | 1 | 8 | 0.0 | 50.0 | 25.0 | 25.0 | ||||||||||||||||||
| SA | 5 | 1 | 1 | 0.0 | 40.0 | 60.0 | ||||||||||||||||||||
| ON | 3 | 1 | 4 | 0.0 | 33.3 | 33.3 | 33.3 | |||||||||||||||||||
| QC | 4 | 1 | 2 | 0.0 | 50.0 | 25.0 | 25.0 | |||||||||||||||||||
| II | Erythromycin | Enterococcus faecalis | BC | 70 | > 8 | > 8 | 54.3 | 18.6 | 12.9 | 14.3 | 54.3 | |||||||||||||||
| SA | 85 | > 8 | > 8 | 69.4 | 20.0 | 5.9 | 4.7 | 69.4 | ||||||||||||||||||
| ON | 148 | 4 | > 8 | 49.3 | 31.1 | 12.2 | 6.8 | 0.7 | 2.0 | 47.3 | ||||||||||||||||
| QC | 133 | > 8 | > 8 | 54.9 | 29.3 | 12.0 | 3.8 | 54.9 | ||||||||||||||||||
| Enterococcus faecium | BC | 3 | 2 | > 8 | 33.3 | 33.3 | 33.3 | 33.3 | ||||||||||||||||||
| SA | 1 | > 8 | > 8 | 100.0 | 100.0 | |||||||||||||||||||||
| ON | 3 | > 8 | > 8 | 100.0 | 100.0 | |||||||||||||||||||||
| QC | 5 | > 8 | > 8 | 80.0 | 20.0 | 80.0 | ||||||||||||||||||||
| Enterococcus spp. | BC | 4 | 1 | 4 | 0.0 | 50.0 | 25.0 | 25.0 | ||||||||||||||||||
| SA | 5 | 2 | > 8 | 20.0 | 40.0 | 20.0 | 20.0 | 20.0 | ||||||||||||||||||
| ON | 3 | ≤ 0.5 | > 8 | 33.3 | 66.7 | 33.3 | ||||||||||||||||||||
| QC | 4 | > 8 | > 8 | 100.0 | 100.0 | |||||||||||||||||||||
| Gentamicin | Enterococcus faecalis | BC | 70 | ≤ 128 | ≤ 128 | 4.3 | 95.7 | 2.9 | 1.4 | |||||||||||||||||
| SA | 85 | ≤ 128 | ≤ 128 | 3.5 | 96.5 | 3.5 | ||||||||||||||||||||
| ON | 148 | ≤ 128 | ≤ 128 | 4.7 | 95.3 | 0.7 | 0.7 | 3.4 | ||||||||||||||||||
| QC | 133 | ≤ 128 | 512 | 10.5 | 87.2 | 2.3 | 6.8 | 3.8 | ||||||||||||||||||
| Enterococcus faecium | BC | 3 | ≤ 128 | ≤ 128 | 0.0 | 100.0 | ||||||||||||||||||||
| SA | 1 | ≤ 128 | ≤ 128 | 0.0 | 100.0 | |||||||||||||||||||||
| ON | 3 | ≤ 128 | ≤ 128 | 0.0 | 100.0 | |||||||||||||||||||||
| QC | 5 | ≤ 128 | ≤ 128 | 0.0 | 100.0 | |||||||||||||||||||||
| Enterococcus spp. | BC | 4 | ≤ 128 | ≤ 128 | 0.0 | 100.0 | ||||||||||||||||||||
| SA | 5 | ≤ 128 | ≤ 128 | 0.0 | 100.0 | |||||||||||||||||||||
| ON | 3 | ≤ 128 | ≤ 128 | 0.0 | 100.0 | |||||||||||||||||||||
| QC | 4 | ≤ 128 | ≤ 128 | 0.0 | 100.0 | |||||||||||||||||||||
| Kanamycin | Enterococcus faecalis | BC | 70 | ≤ 128 | > 1,024 | 20.0 | 78.6 | 1.4 | 2.9 | 17.1 | ||||||||||||||||
| SA | 85 | ≤ 128 | > 1,024 | 24.7 | 74.1 | 1.2 | 2.4 | 22.4 | ||||||||||||||||||
| ON | 148 | ≤ 128 | > 1,024 | 15.5 | 83.8 | 0.7 | 15.5 | |||||||||||||||||||
| QC | 133 | ≤ 128 | > 1,024 | 21.8 | 77.4 | 0.8 | 0.8 | 21.1 | ||||||||||||||||||
| Enterococcus faecium | BC | 3 | 256 | > 1,024 | 33.3 | 66.7 | 33.3 | |||||||||||||||||||
| SA | 1 | 256 | 256 | 0.0 | 100.0 | |||||||||||||||||||||
| ON | 3 | 256 | 256 | 0.0 | 33.3 | 66.7 | ||||||||||||||||||||
| QC | 5 | ≤ 128 | 256 | 0.0 | 60.0 | 40.0 | ||||||||||||||||||||
| Enterococcus spp. | BC | 4 | ≤ 128 | ≤ 128 | 0.0 | 100.0 | ||||||||||||||||||||
| SA | 5 | ≤ 128 | 256 | 0.0 | 80.0 | 20.0 | ||||||||||||||||||||
| ON | 3 | ≤ 128 | ≤ 128 | 0.0 | 100.0 | |||||||||||||||||||||
| QC | 4 | ≤ 128 | ≤ 128 | 0.0 | 100.0 | |||||||||||||||||||||
| Lincomycina | Enterococcus faecium | BC | 3 | > 32 | > 32 | 100.0 | 33.3 | 66.7 | ||||||||||||||||||
| SA | 1 | > 32 | > 32 | 100.0 | 100.0 | |||||||||||||||||||||
| ON | 3 | > 32 | > 32 | 100.0 | 100.0 | |||||||||||||||||||||
| QC | 5 | > 32 | > 32 | 100.0 | 20.0 | 80.0 | ||||||||||||||||||||
| Enterococcus spp. | BC | 4 | > 32 | > 32 | 100.0 | 50.0 | 50.0 | |||||||||||||||||||
| SA | 5 | > 32 | > 32 | 100.0 | 20.0 | 80.0 | ||||||||||||||||||||
| ON | 3 | 16 | > 32 | 100.0 | 66.7 | 33.3 | ||||||||||||||||||||
| QC | 4 | > 32 | > 32 | 100.0 | 100.0 | |||||||||||||||||||||
| Penicillin | Enterococcus faecalis | BC | 70 | 4 | 4 | 0.0 | 28.6 | 71.4 | ||||||||||||||||||
| SA | 85 | 4 | 4 | 0.0 | 40.0 | 60.0 | ||||||||||||||||||||
| ON | 148 | 4 | 4 | 0.0 | 33.8 | 66.2 | ||||||||||||||||||||
| QC | 133 | 4 | 4 | 0.0 | 24.1 | 75.9 | ||||||||||||||||||||
| Enterococcus faecium | BC | 3 | 2 | > 16 | 33.3 | 66.7 | 33.3 | |||||||||||||||||||
| SA | 1 | 16 | 16 | 100.0 | 100.0 | |||||||||||||||||||||
| ON | 3 | 16 | 16 | 66.7 | 33.3 | 66.7 | ||||||||||||||||||||
| QC | 5 | 8 | 16 | 40.0 | 20.0 | 20.0 | 20.0 | 40.0 | ||||||||||||||||||
| Enterococcus spp. | BC | 4 | 4 | > 16 | 25.0 | 25.0 | 25.0 | 25.0 | 25.0 | |||||||||||||||||
| SA | 5 | 2 | 16 | 20.0 | 20.0 | 20.0 | 20.0 | 20.0 | 20.0 | |||||||||||||||||
| ON | 3 | ≤ 0.5 | 1 | 0.0 | 66.7 | 33.3 | ||||||||||||||||||||
| QC | 4 | 1 | 2 | 0.0 | 50.0 | 25.0 | 25.0 | |||||||||||||||||||
| Quinupristin-dalfopristina | Enterococcus faecium | BC | 3 | 2 | 8 | 33.3 | 33.3 | 33.3 | 33.3 | |||||||||||||||||
| SA | 1 | 16 | 16 | 100.0 | 100.0 | |||||||||||||||||||||
| ON | 3 | 16 | 16 | 100.0 | 33.3 | 66.7 | ||||||||||||||||||||
| QC | 5 | 16 | 32 | 80.0 | 20.0 | 40.0 | 40.0 | |||||||||||||||||||
| Enterococcus spp. | BC | 4 | 8 | 8 | 50.0 | 25.0 | 25.0 | 50.0 | ||||||||||||||||||
| SA | 5 | 8 | 8 | 80.0 | 20.0 | 80.0 | ||||||||||||||||||||
| ON | 3 | 2 | 2 | 0.0 | 100.0 | |||||||||||||||||||||
| QC | 4 | 16 | 16 | 100.0 | 25.0 | 25.0 | 50.0 | |||||||||||||||||||
| Streptomycin | Enterococcus faecalis | BC | 70 | ≤ 512 | > 2,048 | 41.4 | 58.6 | 1.4 | 5.7 | 34.3 | ||||||||||||||||
| SA | 85 | ≤ 512 | > 2,048 | 40.0 | 60.0 | 5.9 | 34.1 | |||||||||||||||||||
| ON | 148 | ≤ 512 | > 2,048 | 28.4 | 71.6 | 2.7 | 4.7 | 20.9 | ||||||||||||||||||
| QC | 133 | ≤ 512 | > 2,048 | 39.1 | 60.9 | 3.8 | 9.0 | 26.3 | ||||||||||||||||||
| Enterococcus faecium | BC | 3 | ≤ 512 | > 2,048 | 33.3 | 66.7 | 33.3 | |||||||||||||||||||
| SA | 1 | 1,024 | 1,024 | 100.0 | 100.0 | |||||||||||||||||||||
| ON | 3 | ≤ 512 | ≤ 512 | 0.0 | 100.0 | |||||||||||||||||||||
| QC | 5 | ≤ 512 | ≤ 512 | 0.0 | 100.0 | |||||||||||||||||||||
| Enterococcus spp. | BC | 4 | ≤ 512 | ≤ 512 | 0.0 | 100.0 | ||||||||||||||||||||
| SA | 5 | ≤ 512 | 2,048 | 20.0 | 80.0 | 20.0 | ||||||||||||||||||||
| ON | 3 | ≤ 512 | ≤ 512 | 0.0 | 100.0 | |||||||||||||||||||||
| QC | 4 | ≤ 512 | 1,024 | 25.0 | 75.0 | 25.0 | ||||||||||||||||||||
| Tylosin | Enterococcus faecalis | BC | 70 | > 32 | > 32 | 52.9 | 10.0 | 35.7 | 1.4 | 52.9 | ||||||||||||||||
| SA | 85 | > 32 | > 32 | 69.4 | 5.9 | 24.7 | 69.4 | |||||||||||||||||||
| ON | 148 | > 32 | > 32 | 50.0 | 0.7 | 5.4 | 43.2 | 0.7 | 50.0 | |||||||||||||||||
| QC | 133 | > 32 | > 32 | 54.1 | 6.0 | 38.3 | 0.8 | 0.8 | 54.1 | |||||||||||||||||
| Enterococcus faecium | BC | 3 | 4 | > 32 | 33.3 | 66.7 | 33.3 | |||||||||||||||||||
| SA | 1 | > 32 | > 32 | 100.0 | 100.0 | |||||||||||||||||||||
| ON | 3 | > 32 | > 32 | 100.0 | 100.0 | |||||||||||||||||||||
| QC | 5 | > 32 | > 32 | 80.0 | 20.0 | 80.0 | ||||||||||||||||||||
| Enterococcus spp. | BC | 4 | 1 | 2 | 0.0 | 75.0 | 25.0 | |||||||||||||||||||
| SA | 5 | 2 | > 32 | 20.0 | 20.0 | 60.0 | 20.0 | |||||||||||||||||||
| ON | 3 | 2 | > 32 | 33.3 | 33.3 | 33.3 | 33.3 | |||||||||||||||||||
| QC | 4 | > 32 | > 32 | 100.0 | 100.0 | |||||||||||||||||||||
| III | Chloramphenicol | Enterococcus faecalis | BC | 70 | 8 | 8 | 0.0 | 21.4 | 78.6 | |||||||||||||||||
| SA | 85 | 8 | 8 | 0.0 | 10.6 | 88.2 | 1.2 | |||||||||||||||||||
| ON | 148 | 8 | 8 | 0.7 | 16.9 | 81.1 | 1.4 | 0.7 | ||||||||||||||||||
| QC | 133 | 8 | 8 | 6.0 | 21.1 | 72.9 | 0.8 | 5.3 | ||||||||||||||||||
| Enterococcus faecium | BC | 3 | 4 | 4 | 0.0 | 100.0 | ||||||||||||||||||||
| SA | 1 | 4 | 4 | 0.0 | 100.0 | |||||||||||||||||||||
| ON | 3 | 4 | 8 | 0.0 | 66.7 | 33.3 | ||||||||||||||||||||
| QC | 5 | 4 | 8 | 0.0 | 80.0 | 20.0 | ||||||||||||||||||||
| Enterococcus spp. | BC | 4 | 4 | 8 | 0.0 | 25.0 | 50.0 | 25.0 | ||||||||||||||||||
| SA | 5 | 4 | 4 | 0.0 | 100.0 | |||||||||||||||||||||
| ON | 3 | 4 | 4 | 0.0 | 100.0 | |||||||||||||||||||||
| QC | 4 | 8 | 8 | 0.0 | 50.0 | 50.0 | ||||||||||||||||||||
| Nitrofurantoin | Enterococcus faecalis | BC | 70 | 8 | 16 | 0.0 | 55.7 | 41.4 | 2.9 | |||||||||||||||||
| SA | 85 | 8 | 16 | 0.0 | 55.3 | 42.4 | 2.4 | |||||||||||||||||||
| ON | 148 | 8 | 16 | 0.0 | 56.1 | 35.8 | 4.1 | 4.1 | ||||||||||||||||||
| QC | 133 | 8 | 16 | 0.0 | 60.9 | 32.3 | 3.8 | 3.0 | ||||||||||||||||||
| Enterococcus faecium | BC | 3 | 64 | > 64 | 33.3 | 66.7 | 33.3 | |||||||||||||||||||
| SA | 1 | > 64 | > 64 | 100.0 | 100.0 | |||||||||||||||||||||
| ON | 3 | > 64 | > 64 | 66.7 | 33.3 | 66.7 | ||||||||||||||||||||
| QC | 5 | 64 | > 64 | 20.0 | 20.0 | 60.0 | 20.0 | |||||||||||||||||||
| Enterococcus spp. | BC | 4 | > 64 | > 64 | 50.0 | 25.0 | 25.0 | 50.0 | ||||||||||||||||||
| SA | 5 | > 64 | > 64 | 60.0 | 20.0 | 20.0 | 60.0 | |||||||||||||||||||
| ON | 3 | 16 | 32 | 0.0 | 33.3 | 33.3 | 33.3 | |||||||||||||||||||
| QC | 4 | > 64 | > 64 | 75.0 | 25.0 | 75.0 | ||||||||||||||||||||
| Tetracycline | Enterococcus faecalis | BC | 70 | > 32 | > 32 | 75.7 | 22.9 | 1.4 | 8.6 | 67.1 | ||||||||||||||||
| SA | 85 | > 32 | > 32 | 85.9 | 14.1 | 7.1 | 78.8 | |||||||||||||||||||
| ON | 148 | > 32 | > 32 | 89.2 | 10.8 | 0.7 | 8.8 | 79.7 | ||||||||||||||||||
| QC | 133 | > 32 | > 32 | 86.5 | 13.5 | 0.8 | 6.8 | 78.9 | ||||||||||||||||||
| Enterococcus faecium | BC | 3 | 32 | > 32 | 66.7 | 33.3 | 33.3 | 33.3 | ||||||||||||||||||
| SA | 1 | > 32 | > 32 | 100.0 | 100.0 | |||||||||||||||||||||
| ON | 3 | > 32 | > 32 | 100.0 | 100.0 | |||||||||||||||||||||
| QC | 5 | > 32 | > 32 | 80.0 | 20.0 | 20.0 | 60.0 | |||||||||||||||||||
| Enterococcus spp. | BC | 4 | 32 | > 32 | 75.0 | 25.0 | 50.0 | 25.0 | ||||||||||||||||||
| SA | 5 | > 32 | > 32 | 80.0 | 20.0 | 20.0 | 60.0 | |||||||||||||||||||
| ON | 3 | ≤ 4 | ≤ 4 | 0.0 | 100.0 | |||||||||||||||||||||
| QC | 4 | > 32 | > 32 | 100.0 | 50.0 | 50.0 | ||||||||||||||||||||
| IV | Flavomycin | Enterococcus faecalis | BC | 70 | ≤ 1 | ≤ 1 | 0.0 | 100.0 | ||||||||||||||||||
| SA | 85 | ≤ 1 | ≤ 1 | 0.0 | 100.0 | |||||||||||||||||||||
| ON | 148 | ≤ 1 | ≤ 1 | 0.7 | 96.6 | 2.0 | 0.7 | 0.7 | ||||||||||||||||||
| QC | 133 | ≤ 1 | ≤ 1 | 0.8 | 95.5 | 3.0 | 0.8 | 0.8 | ||||||||||||||||||
| Enterococcus faecium | BC | 3 | 16 | > 16 | 33.3 | 33.3 | 33.3 | 33.3 | ||||||||||||||||||
| SA | 1 | 2 | 2 | 0.0 | 100.0 | |||||||||||||||||||||
| ON | 3 | 4 | 8 | 0.0 | 33.3 | 33.3 | 33.3 | |||||||||||||||||||
| QC | 5 | 16 | > 16 | 40.0 | 40.0 | 20.0 | 40.0 | |||||||||||||||||||
| Enterococcus spp. | BC | 4 | > 16 | > 16 | 50.0 | 25.0 | 25.0 | 50.0 | ||||||||||||||||||
| SA | 5 | 4 | > 16 | 40.0 | 20.0 | 40.0 | 40.0 | |||||||||||||||||||
| ON | 3 | 8 | > 16 | 33.3 | 33.3 | 33.3 | 33.3 | |||||||||||||||||||
| QC | 4 | > 16 | > 16 | 50.0 | 50.0 | 50.0 | ||||||||||||||||||||
Pigs
Table B.19. Distribution of minimal inhibitory concentrations for antimicrobials in Salmonella isolates from pigs; Farm Surveillance, 2008.
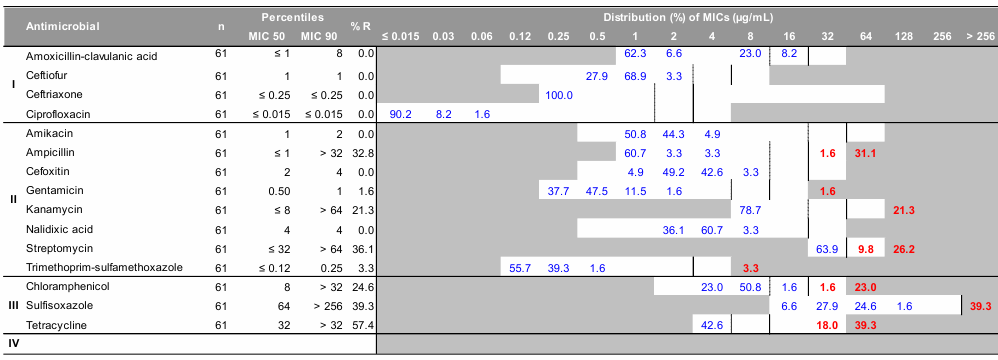
Information on how to interpret the MIC tables is provided at the beginning of Appendix B.
Table B.19. - Text Equivalent
| Antimicrobial | n | Percentiles | % R | Distribution (%) of MICs (µg/mL) | |||||||||||||||||
|---|---|---|---|---|---|---|---|---|---|---|---|---|---|---|---|---|---|---|---|---|---|
| MIC 50 | MIC 90 | ≤ 0.015 | 0.03 | 0.06 | 0.12 | 0.25 | 0.5 | 1 | 2 | 4 | 8 | 16 | 32 | 64 | 128 | 256 | > 256 | ||||
| I | Amoxicillin-clavulanic acid | 61 | ≤ 1 | 8 | 0.0 | 62.3 | 6.6 | 23.0 | 8.2 | ||||||||||||
| Ceftiofur | 61 | 1 | 1 | 0.0 | 27.9 | 68.9 | 3.3 | ||||||||||||||
| Ceftriaxone | 61 | ≤ 0.25 | ≤ 0.25 | 0.0 | 100.0 | ||||||||||||||||
| Ciprofloxacin | 61 | ≤ 0.015 | ≤ 0.015 | 0.0 | 90.2 | 8.2 | 1.6 | ||||||||||||||
| II | Amikacin | 61 | 1 | 2 | 0.0 | 50.8 | 44.3 | 4.9 | |||||||||||||
| Ampicillin | 61 | ≤ 1 | > 32 | 32.8 | 60.7 | 3.3 | 3.3 | 1.6 | 31.1 | ||||||||||||
| Cefoxitin | 61 | 2 | 4 | 0.0 | 4.9 | 49.2 | 42.6 | 3.3 | |||||||||||||
| Gentamicin | 61 | 0.50 | 1 | 1.6 | 37.7 | 47.5 | 11.5 | 1.6 | 1.6 | ||||||||||||
| Kanamycin | 61 | ≤ 8 | > 64 | 21.3 | 78.7 | 21.3 | |||||||||||||||
| Nalidixic acid | 61 | 4 | 4 | 0.0 | 36.1 | 60.7 | 3.3 | ||||||||||||||
| Streptomycin | 61 | ≤ 32 | > 64 | 36.1 | 63.9 | 9.8 | 26.2 | ||||||||||||||
| Trimethoprim-sulfamethoxazole | 61 | ≤ 0.12 | 0.25 | 3.3 | 55.7 | 39.3 | 1.6 | 3.3 | |||||||||||||
| III | Chloramphenicol | 61 | 8 | > 32 | 24.6 | 23.0 | 50.8 | 1.6 | 1.6 | 23.0 | |||||||||||
| Sulfisoxazole | 61 | 64 | > 256 | 39.3 | 6.6 | 27.9 | 24.6 | 1.6 | 39.3 | ||||||||||||
| Tetracycline | 61 | 32 | > 32 | 57.4 | 42.6 | 18.0 | 39.3 | ||||||||||||||
| IV | |||||||||||||||||||||
Table B.20. Distribution of minimal inhibitory concentrations for antimicrobials in Salmonella isolates from pigs; Abattoir Surveillance, 2008.
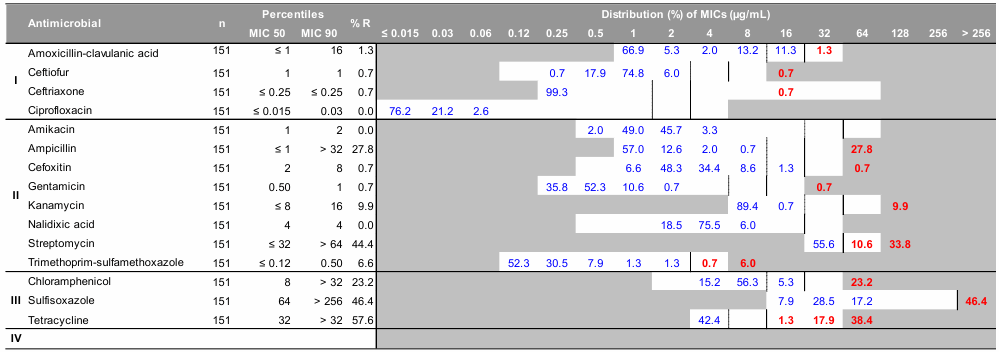
Information on how to interpret the MIC tables is provided at the beginning of Appendix B.
Table B.20. - Text Equivalent
| Antimicrobial | n | Percentiles | % R | Distribution (%) of MICs (µg/mL) | |||||||||||||||||
|---|---|---|---|---|---|---|---|---|---|---|---|---|---|---|---|---|---|---|---|---|---|
| MIC 50 | MIC 90 | ≤ 0.015 | 0.03 | 0.06 | 0.12 | 0.25 | 0.5 | 1 | 2 | 4 | 8 | 16 | 32 | 64 | 128 | 256 | > 256 | ||||
| I | Amoxicillin-clavulanic acid | 151 | ≤ 1 | 16 | 1.3 | 66.9 | 5.3 | 2.0 | 13.2 | 11.3 | 1.3 | ||||||||||
| Ceftiofur | 151 | 1 | 1 | 0.7 | 0.7 | 17.9 | 74.8 | 6.0 | 0.7 | ||||||||||||
| Ceftriaxone | 151 | ≤ 0.25 | ≤ 0.25 | 0.7 | 99.3 | 0.7 | |||||||||||||||
| Ciprofloxacin | 151 | ≤ 0.015 | 0.03 | 0.0 | 76.2 | 21.2 | 2.6 | ||||||||||||||
| II | Amikacin | 151 | 1 | 2 | 0.0 | 2.0 | 49.0 | 45.7 | 3.3 | ||||||||||||
| Ampicillin | 151 | ≤ 1 | > 32 | 27.8 | 57.0 | 12.6 | 2.0 | 0.7 | 27.8 | ||||||||||||
| Cefoxitin | 151 | 2 | 8 | 0.7 | 6.6 | 48.3 | 34.4 | 8.6 | 1.3 | 0.7 | |||||||||||
| Gentamicin | 151 | 0.50 | 1 | 0.7 | 35.8 | 52.3 | 10.6 | 0.7 | 0.7 | ||||||||||||
| Kanamycin | 151 | ≤ 8 | 16 | 9.9 | 89.4 | 0.7 | 9.9 | ||||||||||||||
| Nalidixic acid | 151 | 4 | 4 | 0.0 | 18.5 | 75.5 | 6.0 | ||||||||||||||
| Streptomycin | 151 | ≤ 32 | > 64 | 44.4 | 55.6 | 10.6 | 33.8 | ||||||||||||||
| Trimethoprim-sulfamethoxazole | 151 | ≤ 0.12 | 0.50 | 6.6 | 52.3 | 30.5 | 7.9 | 1.3 | 1.3 | 0.7 | 6.0 | ||||||||||
| III | Chloramphenicol | 151 | 8 | > 32 | 23.2 | 15.2 | 56.3 | 5.3 | 23.2 | ||||||||||||
| Sulfisoxazole | 151 | 64 | > 256 | 46.4 | 7.9 | 28.5 | 17.2 | 46.4 | |||||||||||||
| Tetracycline | 151 | 32 | > 32 | 57.6 | 42.4 | 1.3 | 17.9 | 38.4 | |||||||||||||
| IV | |||||||||||||||||||||
Table B.21. Distribution of minimal inhibitory concentrations for antimicrobials in Salmonella isolates from pork; Retail Meat Surveillance, 2003-2008.
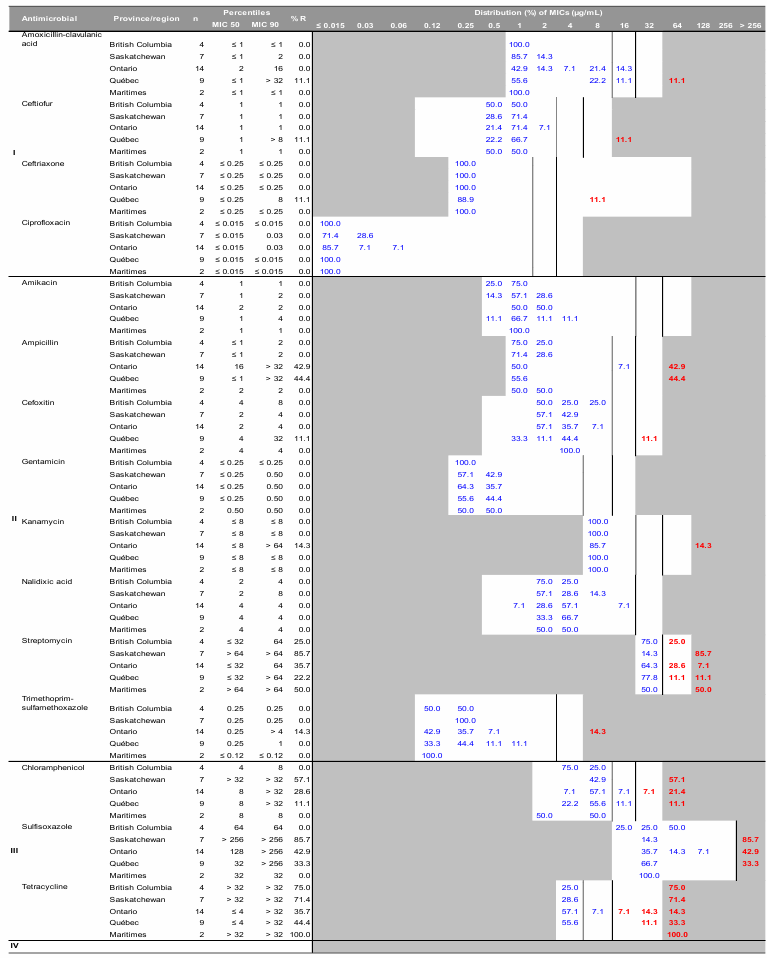
Information on how to interpret the MIC tables is provided at the beginning of Appendix B.
The Maritimes region includes New Brunswick, Nova Scotia, and Prince Edward Island.
Table B.21. - Text Equivalent
| Antimicrobial | Province/region | n | Percentiles | % R | Distribution (%) of MICs (µg/mL) | |||||||||||||||||
|---|---|---|---|---|---|---|---|---|---|---|---|---|---|---|---|---|---|---|---|---|---|---|
| MIC 50 | MIC 90 | ≤ 0.015 | 0.03 | 0.06 | 0.12 | 0.25 | 0.5 | 1 | 2 | 4 | 8 | 16 | 32 | 64 | 128 | 256 | > 256 | |||||
| I | Amoxicillin-clavulanic acid | British Columbia | 4 | ≤ 1 | ≤ 1 | 0.0 | 100.0 | |||||||||||||||
| Saskatchewan | 7 | ≤ 1 | 2 | 0.0 | 85.7 | 14.3 | ||||||||||||||||
| Ontario | 14 | 2 | 16 | 0.0 | 42.9 | 14.3 | 7.1 | 21.4 | 14.3 | |||||||||||||
| Québec | 9 | ≤ 1 | > 32 | 11.1 | 55.6 | 22.2 | 11.1 | 11.1 | ||||||||||||||
| Maritimes | 2 | ≤ 1 | ≤ 1 | 0.0 | 100.0 | |||||||||||||||||
| Ceftiofur | British Columbia | 4 | 1 | 1 | 0.0 | 50.0 | 50.0 | |||||||||||||||
| Saskatchewan | 7 | 1 | 1 | 0.0 | 28.6 | 71.4 | ||||||||||||||||
| Ontario | 14 | 1 | 1 | 0.0 | 21.4 | 71.4 | 7.1 | |||||||||||||||
| Québec | 9 | 1 | > 8 | 11.1 | 22.2 | 66.7 | 11.1 | |||||||||||||||
| Maritimes | 2 | 1 | 1 | 0.0 | 50.0 | 50.0 | ||||||||||||||||
| Ceftriaxone | British Columbia | 4 | ≤ 0.25 | ≤ 0.25 | 0.0 | 100.0 | ||||||||||||||||
| Saskatchewan | 7 | ≤ 0.25 | ≤ 0.25 | 0.0 | 100.0 | |||||||||||||||||
| Ontario | 14 | ≤ 0.25 | ≤ 0.25 | 0.0 | 100.0 | |||||||||||||||||
| Québec | 9 | ≤ 0.25 | 8 | 11.1 | 88.9 | 11.1 | ||||||||||||||||
| Maritimes | 2 | ≤ 0.25 | ≤ 0.25 | 0.0 | 100.0 | |||||||||||||||||
| Ciprofloxacin | British Columbia | 4 | ≤ 0.015 | ≤ 0.015 | 0.0 | 100.0 | ||||||||||||||||
| Saskatchewan | 7 | ≤ 0.015 | 0.03 | 0.0 | 71.4 | 28.6 | ||||||||||||||||
| Ontario | 14 | ≤ 0.015 | 0.03 | 0.0 | 85.7 | 7.1 | 7.1 | |||||||||||||||
| Québec | 9 | ≤ 0.015 | ≤ 0.015 | 0.0 | 100.0 | |||||||||||||||||
| Maritimes | 2 | ≤ 0.015 | ≤ 0.015 | 0.0 | 100.0 | |||||||||||||||||
| II | Amikacin | British Columbia | 4 | 1 | 1 | 0.0 | 25.0 | 75.0 | ||||||||||||||
| Saskatchewan | 7 | 1 | 2 | 0.0 | 14.3 | 57.1 | 28.6 | |||||||||||||||
| Ontario | 14 | 2 | 2 | 0.0 | 50.0 | 50.0 | ||||||||||||||||
| Québec | 9 | 1 | 4 | 0.0 | 11.1 | 66.7 | 11.1 | 11.1 | ||||||||||||||
| Maritimes | 2 | 1 | 1 | 0.0 | 100.0 | |||||||||||||||||
| Ampicillin | British Columbia | 4 | ≤ 1 | 2 | 0.0 | 75.0 | 25.0 | |||||||||||||||
| Saskatchewan | 7 | ≤ 1 | 2 | 0.0 | 71.4 | 28.6 | ||||||||||||||||
| Ontario | 14 | 16 | > 32 | 42.9 | 50.0 | 7.1 | 42.9 | |||||||||||||||
| Québec | 9 | ≤ 1 | > 32 | 44.4 | 55.6 | 44.4 | ||||||||||||||||
| Maritimes | 2 | 2 | 2 | 0.0 | 50.0 | 50.0 | ||||||||||||||||
| Cefoxitin | British Columbia | 4 | 4 | 8 | 0.0 | 50.0 | 25.0 | 25.0 | ||||||||||||||
| Saskatchewan | 7 | 2 | 4 | 0.0 | 57.1 | 42.9 | ||||||||||||||||
| Ontario | 14 | 2 | 4 | 0.0 | 57.1 | 35.7 | 7.1 | |||||||||||||||
| Québec | 9 | 4 | 32 | 11.1 | 33.3 | 11.1 | 44.4 | 11.1 | ||||||||||||||
| Maritimes | 2 | 4 | 4 | 0.0 | 100.0 | |||||||||||||||||
| Gentamicin | British Columbia | 4 | ≤ 0.25 | ≤ 0.25 | 0.0 | 100.0 | ||||||||||||||||
| Saskatchewan | 7 | ≤ 0.25 | 0.50 | 0.0 | 57.1 | 42.9 | ||||||||||||||||
| Ontario | 14 | ≤ 0.25 | 0.50 | 0.0 | 64.3 | 35.7 | ||||||||||||||||
| Québec | 9 | ≤ 0.25 | 0.50 | 0.0 | 55.6 | 44.4 | ||||||||||||||||
| Maritimes | 2 | 0.50 | 0.50 | 0.0 | 50.0 | 50.0 | ||||||||||||||||
| Kanamycin | British Columbia | 4 | ≤ 8 | ≤ 8 | 0.0 | 100.0 | ||||||||||||||||
| Saskatchewan | 7 | ≤ 8 | ≤ 8 | 0.0 | 100.0 | |||||||||||||||||
| Ontario | 14 | ≤ 8 | > 64 | 14.3 | 85.7 | 14.3 | ||||||||||||||||
| Québec | 9 | ≤ 8 | ≤ 8 | 0.0 | 100.0 | |||||||||||||||||
| Maritimes | 2 | ≤ 8 | ≤ 8 | 0.0 | 100.0 | |||||||||||||||||
| Nalidixic acid | British Columbia | 4 | 2 | 4 | 0.0 | 75.0 | 25.0 | |||||||||||||||
| Saskatchewan | 7 | 2 | 8 | 0.0 | 57.1 | 28.6 | 14.3 | |||||||||||||||
| Ontario | 14 | 4 | 4 | 0.0 | 7.1 | 28.6 | 57.1 | 7.1 | ||||||||||||||
| Québec | 9 | 4 | 4 | 0.0 | 33.3 | 66.7 | ||||||||||||||||
| Maritimes | 2 | 4 | 4 | 0.0 | 50.0 | 50.0 | ||||||||||||||||
| Streptomycin | British Columbia | 4 | ≤ 32 | 64 | 25.0 | 75.0 | 25.0 | |||||||||||||||
| Saskatchewan | 7 | > 64 | > 64 | 85.7 | 14.3 | 85.7 | ||||||||||||||||
| Ontario | 14 | ≤ 32 | 64 | 35.7 | 64.3 | 28.6 | 7.1 | |||||||||||||||
| Québec | 9 | ≤ 32 | > 64 | 22.2 | 77.8 | 11.1 | 11.1 | |||||||||||||||
| Maritimes | 2 | > 64 | > 64 | 50.0 | 50.0 | 50.0 | ||||||||||||||||
| Trimethoprim-sulfamethoxazole | British Columbia | 4 | 0.25 | 0.25 | 0.0 | 50.0 | 50.0 | |||||||||||||||
| Saskatchewan | 7 | 0.25 | 0.25 | 0.0 | 100.0 | |||||||||||||||||
| Ontario | 14 | 0.25 | > 4 | 14.3 | 42.9 | 35.7 | 7.1 | 14.3 | ||||||||||||||
| Québec | 9 | 0.25 | 1 | 0.0 | 33.3 | 44.4 | 11.1 | 11.1 | ||||||||||||||
| Maritimes | 2 | ≤ 0.12 | ≤ 0.12 | 0.0 | 100.0 | |||||||||||||||||
| III | Chloramphenicol | British Columbia | 4 | 4 | 8 | 0.0 | 75.0 | 25.0 | ||||||||||||||
| Saskatchewan | 7 | > 32 | > 32 | 57.1 | 42.9 | 57.1 | ||||||||||||||||
| Ontario | 14 | 8 | > 32 | 28.6 | 7.1 | 57.1 | 7.1 | 7.1 | 21.4 | |||||||||||||
| Québec | 9 | 8 | > 32 | 11.1 | 22.2 | 55.6 | 11.1 | 11.1 | ||||||||||||||
| Maritimes | 2 | 8 | 8 | 0.0 | 50.0 | 50.0 | ||||||||||||||||
| Sulfisoxazole | British Columbia | 4 | 64 | 64 | 0.0 | 25.0 | 25.0 | 50.0 | ||||||||||||||
| Saskatchewan | 7 | > 256 | > 256 | 85.7 | 14.3 | 85.7 | ||||||||||||||||
| Ontario | 14 | 128 | > 256 | 42.9 | 35.7 | 14.3 | 7.1 | 42.9 | ||||||||||||||
| Québec | 9 | 32 | > 256 | 33.3 | 66.7 | 33.3 | ||||||||||||||||
| Maritimes | 2 | 32 | 32 | 0.0 | 100.0 | |||||||||||||||||
| Tetracycline | British Columbia | 4 | > 32 | > 32 | 75.0 | 25.0 | 75.0 | |||||||||||||||
| Saskatchewan | 7 | > 32 | > 32 | 71.4 | 28.6 | 71.4 | ||||||||||||||||
| Ontario | 14 | ≤ 4 | > 32 | 35.7 | 57.1 | 7.1 | 7.1 | 14.3 | 14.3 | |||||||||||||
| Québec | 9 | ≤ 4 | > 32 | 44.4 | 55.6 | 11.1 | 33.3 | |||||||||||||||
| Maritimes | 2 | > 32 | > 32 | 100.0 | 100.0 | |||||||||||||||||
| IV | ||||||||||||||||||||||
Table B.22. Distribution of minimal inhibitory concentrations for antimicrobials in Salmonella isolates from pigs; Surveillance of Animal Clinical Isolates, 2008.
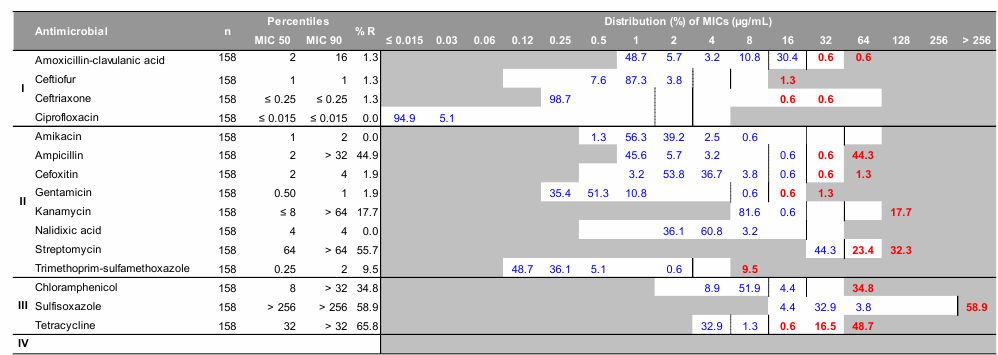
Information on how to interpret the MIC tables is provided at the beginning of Appendix B.
Table B.22. - Text Equivalent
| Antimicrobial | n | Percentiles | % R | Distribution (%) of MICs (µg/mL) | |||||||||||||||||
|---|---|---|---|---|---|---|---|---|---|---|---|---|---|---|---|---|---|---|---|---|---|
| MIC 50 | MIC 90 | ≤ 0.015 | 0.03 | 0.06 | 0.12 | 0.25 | 0.5 | 1 | 2 | 4 | 8 | 16 | 32 | 64 | 128 | 256 | > 256 | ||||
| I | Amoxicillin-clavulanic acid | 158 | 2 | 16 | 1.3 | 48.7 | 5.7 | 3.2 | 10.8 | 30.4 | 0.6 | 0.6 | |||||||||
| Ceftiofur | 158 | 1 | 1 | 1.3 | 7.6 | 87.3 | 3.8 | 1.3 | |||||||||||||
| Ceftriaxone | 158 | ≤ 0.25 | ≤ 0.25 | 1.3 | 98.7 | 0.6 | 0.6 | ||||||||||||||
| Ciprofloxacin | 158 | ≤ 0.015 | ≤ 0.015 | 0.0 | 94.9 | 5.1 | |||||||||||||||
| II | Amikacin | 158 | 1 | 2 | 0.0 | 1.3 | 56.3 | 39.2 | 2.5 | 0.6 | |||||||||||
| Ampicillin | 158 | 2 | > 32 | 44.9 | 45.6 | 5.7 | 3.2 | 0.6 | 0.6 | 44.3 | |||||||||||
| Cefoxitin | 158 | 2 | 4 | 1.9 | 3.2 | 53.8 | 36.7 | 3.8 | 0.6 | 0.6 | 1.3 | ||||||||||
| Gentamicin | 158 | 0.50 | 1 | 1.9 | 35.4 | 51.3 | 10.8 | 0.6 | 0.6 | 1.3 | |||||||||||
| Kanamycin | 158 | ≤ 8 | > 64 | 17.7 | 81.6 | 0.6 | 17.7 | ||||||||||||||
| Nalidixic acid | 158 | 4 | 4 | 0.0 | 36.1 | 60.8 | 3.2 | ||||||||||||||
| Streptomycin | 158 | 64 | > 64 | 55.7 | 44.3 | 23.4 | 32.3 | ||||||||||||||
| Trimethoprim-sulfamethoxazole | 158 | 0.25 | 2 | 9.5 | 48.7 | 36.1 | 5.1 | 0.6 | 9.5 | ||||||||||||
| III | Chloramphenicol | 158 | 8 | > 32 | 34.8 | 8.9 | 51.9 | 4.4 | 34.8 | ||||||||||||
| Sulfisoxazole | 158 | > 256 | > 256 | 58.9 | 4.4 | 32.9 | 3.8 | 58.9 | |||||||||||||
| Tetracycline | 158 | 32 | > 32 | 65.8 | 32.9 | 1.3 | 0.6 | 16.5 | 48.7 | ||||||||||||
| IV | |||||||||||||||||||||
Table B.23. Distribution of minimal inhibitory concentrations for antimicrobials in Escherichia coli isolates from pigs; Farm Surveillance, 2008.
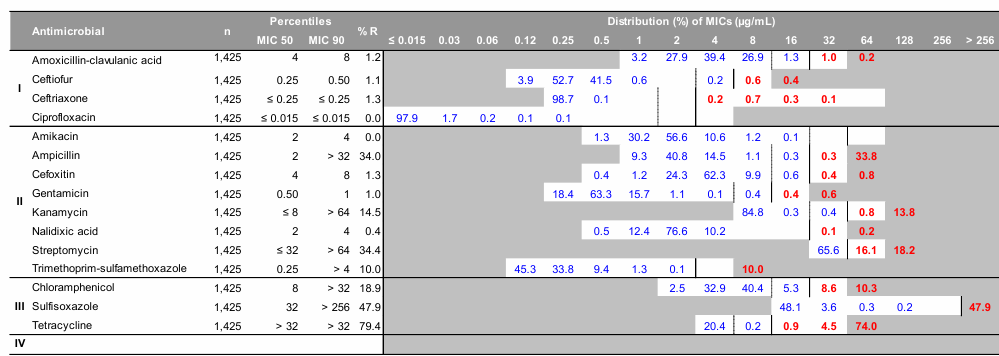
Information on how to interpret the MIC tables is provided at the beginning of Appendix B.
Table B.23. - Text Equivalent
| Antimicrobial | n | Percentiles | % R | Distribution (%) of MICs (µg/mL) | |||||||||||||||||
|---|---|---|---|---|---|---|---|---|---|---|---|---|---|---|---|---|---|---|---|---|---|
| MIC 50 | MIC 90 | ≤ 0.015 | 0.03 | 0.06 | 0.12 | 0.25 | 0.5 | 1 | 2 | 4 | 8 | 16 | 32 | 64 | 128 | 256 | > 256 | ||||
| I | Amoxicillin-clavulanic acid | 1,425 | 4 | 8 | 1.2 | 3.2 | 27.9 | 39.4 | 26.9 | 1.3 | 1.0 | 0.2 | |||||||||
| Ceftiofur | 1,425 | 0.25 | 0.50 | 1.1 | 3.9 | 52.7 | 41.5 | 0.6 | 0.2 | 0.6 | 0.4 | ||||||||||
| Ceftriaxone | 1,425 | ≤ 0.25 | ≤ 0.25 | 1.3 | 98.7 | 0.1 | 0.2 | 0.7 | 0.3 | 0.1 | |||||||||||
| Ciprofloxacin | 1,425 | ≤ 0.015 | ≤ 0.015 | 0.0 | 97.9 | 1.7 | 0.2 | 0.1 | 0.1 | ||||||||||||
| II | Amikacin | 1,425 | 2 | 4 | 0.0 | 1.3 | 30.2 | 56.6 | 10.6 | 1.2 | 0.1 | ||||||||||
| Ampicillin | 1,425 | 2 | > 32 | 34.0 | 9.3 | 40.8 | 14.5 | 1.1 | 0.3 | 0.3 | 33.8 | ||||||||||
| Cefoxitin | 1,425 | 4 | 8 | 1.3 | 0.4 | 1.2 | 24.3 | 62.3 | 9.9 | 0.6 | 0.4 | 0.8 | |||||||||
| Gentamicin | 1,425 | 0.50 | 1 | 1.0 | 18.4 | 63.3 | 15.7 | 1.1 | 0.1 | 0.4 | 0.4 | 0.6 | |||||||||
| Kanamycin | 1,425 | ≤ 8 | > 64 | 14.5 | 84.8 | 0.3 | 0.4 | 0.8 | 13.8 | ||||||||||||
| Nalidixic acid | 1,425 | 2 | 4 | 0.4 | 0.5 | 12.4 | 76.6 | 10.2 | 0.1 | 0.2 | |||||||||||
| Streptomycin | 1,425 | ≤ 32 | > 64 | 34.4 | 65.6 | 16.1 | 18.2 | ||||||||||||||
| Trimethoprim-sulfamethoxazole | 1,425 | 0.25 | > 4 | 10.0 | 45.3 | 33.8 | 9.4 | 1.3 | 0.1 | 10.0 | |||||||||||
| III | Chloramphenicol | 1,425 | 8 | > 32 | 18.9 | 2.5 | 32.9 | 40.4 | 5.3 | 8.6 | 10.3 | ||||||||||
| Sulfisoxazole | 1,425 | 32 | > 256 | 47.9 | 48.1 | 3.6 | 0.3 | 0.2 | 47.9 | ||||||||||||
| Tetracycline | 1,425 | > 32 | > 32 | 79.4 | 20.4 | 0.2 | 0.9 | 4.5 | 74.0 | ||||||||||||
| IV | |||||||||||||||||||||
Table B.24. Distribution of minimal inhibitory concentrations for antimicrobials in Escherichia coli isolates from pigs; Abattoir Surveillance, 2008.
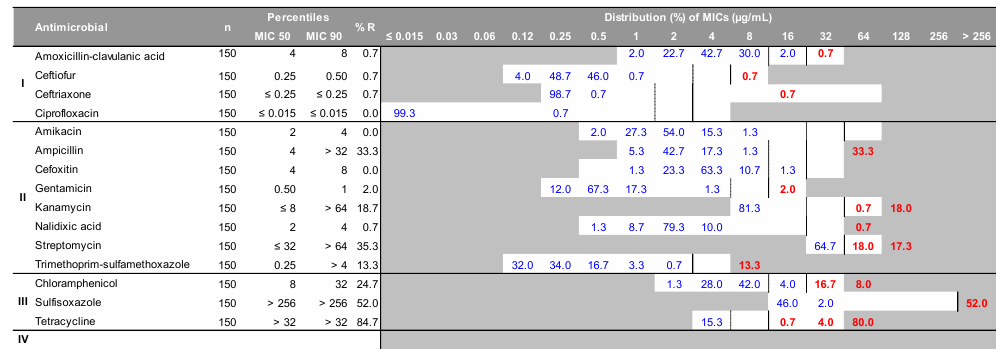
Information on how to interpret the MIC tables is provided at the beginning of Appendix B.
Table B.24. - Text Equivalent
| Antimicrobial | n | Percentiles | % R | Distribution (%) of MICs (µg/mL) | |||||||||||||||||
|---|---|---|---|---|---|---|---|---|---|---|---|---|---|---|---|---|---|---|---|---|---|
| MIC 50 | MIC 90 | ≤ 0.015 | 0.03 | 0.06 | 0.12 | 0.25 | 0.5 | 1 | 2 | 4 | 8 | 16 | 32 | 64 | 128 | 256 | > 256 | ||||
| I | Amoxicillin-clavulanic acid | 150 | 4 | 8 | 0.7 | 2.0 | 22.7 | 42.7 | 30.0 | 2.0 | 0.7 | ||||||||||
| Ceftiofur | 150 | 0.25 | 0.50 | 0.7 | 4.0 | 48.7 | 46.0 | 0.7 | 0.7 | ||||||||||||
| Ceftriaxone | 150 | ≤ 0.25 | ≤ 0.25 | 0.7 | 98.7 | 0.7 | 0.7 | ||||||||||||||
| Ciprofloxacin | 150 | ≤ 0.015 | ≤ 0.015 | 0.0 | 99.3 | 0.7 | |||||||||||||||
| II | Amikacin | 150 | 2 | 4 | 0.0 | 2.0 | 27.3 | 54.0 | 15.3 | 1.3 | |||||||||||
| Ampicillin | 150 | 4 | > 32 | 33.3 | 5.3 | 42.7 | 17.3 | 1.3 | 33.3 | ||||||||||||
| Cefoxitin | 150 | 4 | 8 | 0.0 | 1.3 | 23.3 | 63.3 | 10.7 | 1.3 | ||||||||||||
| Gentamicin | 150 | 0.50 | 1 | 2.0 | 12.0 | 67.3 | 17.3 | 1.3 | 2.0 | ||||||||||||
| Kanamycin | 150 | ≤ 8 | > 64 | 18.7 | 81.3 | 0.7 | 18.0 | ||||||||||||||
| Nalidixic acid | 150 | 2 | 4 | 0.7 | 1.3 | 8.7 | 79.3 | 10.0 | 0.7 | ||||||||||||
| Streptomycin | 150 | ≤ 32 | > 64 | 35.3 | 64.7 | 18.0 | 17.3 | ||||||||||||||
| Trimethoprim-sulfamethoxazole | 150 | 0.25 | > 4 | 13.3 | 32.0 | 34.0 | 16.7 | 3.3 | 0.7 | 13.3 | |||||||||||
| III | Chloramphenicol | 150 | 8 | 32 | 24.7 | 1.3 | 28.0 | 42.0 | 4.0 | 16.7 | 8.0 | ||||||||||
| Sulfisoxazole | 150 | > 256 | > 256 | 52.0 | 46.0 | 2.0 | 52.0 | ||||||||||||||
| Tetracycline | 150 | > 32 | > 32 | 84.7 | 15.3 | 0.7 | 4.0 | 80.0 | |||||||||||||
| IV | |||||||||||||||||||||
Table B.25. Distribution of minimal inhibitory concentrations for antimicrobials in Escherichia coli isolates from pork; Retail Meat Surveillance, 2008.
Information on how to interpret the MIC tables is provided at the beginning of Appendix B.
The Maritimes region includes New Brunswick, Nova Scotia, and Prince Edward Island.
Table B.25. - Text Equivalent
| Antimicrobial | Province/region | n | Percentiles | % R | Distribution (%) of MICs (µg/mL) | |||||||||||||||||
|---|---|---|---|---|---|---|---|---|---|---|---|---|---|---|---|---|---|---|---|---|---|---|
| MIC 50 | MIC 90 | ≤ 0.015 | 0.03 | 0.06 | 0.12 | 0.25 | 0.5 | 1 | 2 | 4 | 8 | 16 | 32 | 64 | 128 | 256 | > 256 | |||||
| I | Amoxicillin-clavulanic acid | British Columbia | 44 | 4 | 8 | 6.8 | 4.5 | 15.9 | 52.3 | 20.5 | 2.3 | 4.5 | ||||||||||
| Saskatchewan | 41 | 4 | 8 | 7.3 | 2.4 | 29.3 | 56.1 | 4.9 | 4.9 | 2.4 | ||||||||||||
| Ontario | 155 | 4 | 8 | 0.6 | 1.9 | 30.3 | 54.2 | 12.3 | 0.6 | 0.6 | ||||||||||||
| Québec | 60 | 4 | 8 | 3.3 | 3.3 | 36.7 | 40.0 | 16.7 | 1.7 | 1.7 | ||||||||||||
| Maritimes | 17 | 4 | 8 | 0.0 | 5.9 | 29.4 | 41.2 | 23.5 | ||||||||||||||
| Ceftiofur | British Columbia | 44 | 0.25 | 0.50 | 6.8 | 6.8 | 47.7 | 36.4 | 2.3 | 4.5 | 2.3 | |||||||||||
| Saskatchewan | 41 | 0.25 | 0.50 | 7.3 | 2.4 | 51.2 | 39.0 | 4.9 | 2.4 | |||||||||||||
| Ontario | 155 | 0.25 | 0.50 | 0.6 | 4.5 | 54.2 | 40.0 | 0.6 | 0.6 | |||||||||||||
| Québec | 60 | 0.25 | 0.50 | 3.3 | 8.3 | 53.3 | 33.3 | 1.7 | 1.7 | 1.7 | ||||||||||||
| Maritimes | 17 | 0.25 | 0.50 | 0.0 | 5.9 | 70.6 | 23.5 | |||||||||||||||
| Ceftriaxone | British Columbia | 44 | ≤ 0.25 | ≤ 0.25 | 6.8 | 93.2 | 2.3 | 4.5 | ||||||||||||||
| Saskatchewan | 41 | ≤ 0.25 | ≤ 0.25 | 7.3 | 92.7 | 2.4 | 2.4 | 2.4 | ||||||||||||||
| Ontario | 155 | ≤ 0.25 | ≤ 0.25 | 0.6 | 99.4 | 0.6 | ||||||||||||||||
| Québec | 60 | ≤ 0.25 | ≤ 0.25 | 3.3 | 96.7 | 1.7 | 1.7 | |||||||||||||||
| Maritimes | 17 | ≤ 0.25 | ≤ 0.25 | 0.0 | 100.0 | |||||||||||||||||
| Ciprofloxacin | British Columbia | 44 | ≤ 0.015 | ≤ 0.015 | 0.0 | 100.0 | ||||||||||||||||
| Saskatchewan | 41 | ≤ 0.015 | ≤ 0.015 | 0.0 | 97.6 | 2.4 | ||||||||||||||||
| Ontario | 155 | ≤ 0.015 | ≤ 0.015 | 0.0 | 99.4 | 0.6 | ||||||||||||||||
| Québec | 60 | ≤ 0.015 | ≤ 0.015 | 1.7 | 95.0 | 1.7 | 1.7 | 1.7 | ||||||||||||||
| Maritimes | 17 | ≤ 0.015 | ≤ 0.015 | 0.0 | 100.0 | |||||||||||||||||
| II | Amikacin | British Columbia | 44 | 2 | 4 | 0.0 | 20.5 | 56.8 | 22.7 | |||||||||||||
| Saskatchewan | 41 | 2 | 4 | 0.0 | 17.1 | 51.2 | 29.3 | 2.4 | ||||||||||||||
| Ontario | 155 | 2 | 4 | 0.0 | 14.8 | 70.3 | 14.2 | 0.6 | ||||||||||||||
| Québec | 60 | 2 | 4 | 0.0 | 21.7 | 56.7 | 21.7 | |||||||||||||||
| Maritimes | 17 | 2 | 2 | 0.0 | 29.4 | 64.7 | 5.9 | |||||||||||||||
| Ampicillin | British Columbia | 44 | 2 | > 32 | 22.7 | 13.6 | 40.9 | 22.7 | 22.7 | |||||||||||||
| Saskatchewan | 41 | 2 | 4 | 9.8 | 12.2 | 51.2 | 26.8 | 9.8 | ||||||||||||||
| Ontario | 155 | 2 | > 32 | 16.8 | 11.6 | 43.9 | 26.5 | 1.3 | 16.8 | |||||||||||||
| Québec | 60 | 2 | > 32 | 18.3 | 13.3 | 56.7 | 10.0 | 1.7 | 18.3 | |||||||||||||
| Maritimes | 17 | 2 | > 32 | 17.6 | 11.8 | 47.1 | 23.5 | 17.6 | ||||||||||||||
| Cefoxitin | British Columbia | 44 | 4 | 8 | 6.8 | 27.3 | 45.5 | 18.2 | 2.3 | 6.8 | ||||||||||||
| Saskatchewan | 41 | 4 | 8 | 7.3 | 2.4 | 17.1 | 61.0 | 12.2 | 7.3 | |||||||||||||
| Ontario | 155 | 4 | 8 | 0.6 | 0.6 | 23.2 | 60.0 | 12.9 | 2.6 | 0.6 | ||||||||||||
| Québec | 60 | 4 | 8 | 3.3 | 3.3 | 28.3 | 51.7 | 13.3 | 1.7 | 1.7 | ||||||||||||
| Maritimes | 17 | 4 | 4 | 0.0 | 5.9 | 29.4 | 58.8 | 5.9 | ||||||||||||||
| Gentamicin | British Columbia | 44 | 0.50 | 1 | 4.5 | 9.1 | 65.9 | 20.5 | 2.3 | 2.3 | ||||||||||||
| Saskatchewan | 41 | 0.50 | 1 | 2.4 | 7.3 | 63.4 | 26.8 | 2.4 | ||||||||||||||
| Ontario | 155 | 0.50 | 1 | 3.2 | 3.9 | 72.3 | 20.0 | 0.6 | 1.9 | 1.3 | ||||||||||||
| Québec | 60 | 0.50 | 1 | 1.7 | 6.7 | 70.0 | 18.3 | 3.3 | 1.7 | |||||||||||||
| Maritimes | 17 | 0.50 | 1 | 0.0 | 17.6 | 70.6 | 11.8 | |||||||||||||||
| Kanamycin | British Columbia | 44 | ≤ 8 | ≤ 8 | 2.3 | 95.5 | 2.3 | 2.3 | ||||||||||||||
| Saskatchewan | 41 | ≤ 8 | ≤ 8 | 2.4 | 95.1 | 2.4 | 2.4 | |||||||||||||||
| Ontario | 155 | ≤ 8 | ≤ 8 | 3.2 | 96.1 | 0.6 | 3.2 | |||||||||||||||
| Québec | 60 | ≤ 8 | ≤ 8 | 1.7 | 96.7 | 1.7 | 1.7 | |||||||||||||||
| Maritimes | 17 | ≤ 8 | > 64 | 11.8 | 88.2 | 11.8 | ||||||||||||||||
| Nalidixic acid | British Columbia | 44 | 2 | 2 | 0.0 | 18.2 | 72.7 | 9.1 | ||||||||||||||
| Saskatchewan | 41 | 2 | 2 | 2.4 | 17.1 | 78.0 | 2.4 | 2.4 | ||||||||||||||
| Ontario | 155 | 2 | 2 | 0.0 | 11.6 | 81.3 | 7.1 | |||||||||||||||
| Québec | 60 | 2 | 4 | 5.0 | 1.7 | 16.7 | 70.0 | 6.7 | 5.0 | |||||||||||||
| Maritimes | 17 | 2 | 2 | 0.0 | 11.8 | 82.4 | 5.9 | |||||||||||||||
| Streptomycin | British Columbia | 44 | ≤ 32 | > 64 | 22.7 | 77.3 | 11.4 | 11.4 | ||||||||||||||
| Saskatchewan | 41 | ≤ 32 | 64 | 14.6 | 85.4 | 9.8 | 4.9 | |||||||||||||||
| Ontario | 155 | ≤ 32 | 64 | 14.2 | 85.8 | 5.8 | 8.4 | |||||||||||||||
| Québec | 60 | ≤ 32 | 64 | 13.3 | 86.7 | 8.3 | 5.0 | |||||||||||||||
| Maritimes | 17 | ≤ 32 | 64 | 11.8 | 88.2 | 11.8 | ||||||||||||||||
| Trimethoprim-sulfamethoxazole | British Columbia | 44 | ≤ 0.12 | 0.50 | 6.8 | 56.8 | 31.8 | 2.3 | 2.3 | 6.8 | ||||||||||||
| Saskatchewan | 41 | ≤ 0.12 | 0.25 | 0.0 | 56.1 | 39.0 | 2.4 | 2.4 | ||||||||||||||
| Ontario | 155 | ≤ 0.12 | 0.50 | 7.1 | 56.8 | 27.7 | 6.5 | 1.9 | 7.1 | |||||||||||||
| Québec | 60 | ≤ 0.12 | > 4 | 10.0 | 58.3 | 25.0 | 6.7 | 10.0 | ||||||||||||||
| Maritimes | 17 | 0.25 | > 4 | 11.8 | 35.3 | 47.1 | 5.9 | 11.8 | ||||||||||||||
| III | Chloramphenicol | British Columbia | 44 | 8 | 8 | 4.5 | 4.5 | 43.2 | 47.7 | 2.3 | 2.3 | |||||||||||
| Saskatchewan | 41 | 8 | 8 | 0.0 | 4.9 | 41.5 | 48.8 | 4.9 | ||||||||||||||
| Ontario | 155 | 4 | 8 | 9.0 | 3.9 | 50.3 | 36.1 | 0.6 | 3.9 | 5.2 | ||||||||||||
| Québec | 60 | 4 | 16 | 6.7 | 6.7 | 50.0 | 33.3 | 3.3 | 3.3 | 3.3 | ||||||||||||
| Maritimes | 17 | 8 | 8 | 5.9 | 41.2 | 52.9 | 5.9 | |||||||||||||||
| Sulfisoxazole | British Columbia | 44 | ≤ 16 | > 256 | 27.3 | 72.7 | 27.3 | |||||||||||||||
| Saskatchewan | 41 | ≤ 16 | > 256 | 12.2 | 80.5 | 7.3 | 12.2 | |||||||||||||||
| Ontario | 155 | ≤ 16 | > 256 | 20.6 | 72.9 | 6.5 | 20.6 | |||||||||||||||
| Québec | 60 | ≤ 16 | > 256 | 23.3 | 65.0 | 11.7 | 23.3 | |||||||||||||||
| Maritimes | 17 | ≤ 16 | > 256 | 17.6 | 76.5 | 5.9 | 17.6 | |||||||||||||||
| Tetracycline | British Columbia | 44 | ≤ 4 | > 32 | 45.5 | 54.5 | 4.5 | 4.5 | 36.4 | |||||||||||||
| Saskatchewan | 41 | ≤ 4 | > 32 | 29.3 | 70.7 | 2.4 | 26.8 | |||||||||||||||
| Ontario | 155 | ≤ 4 | > 32 | 38.1 | 61.9 | 0.6 | 0.6 | 36.8 | ||||||||||||||
| Québec | 60 | ≤ 4 | > 32 | 35.0 | 65.0 | 3.3 | 31.7 | |||||||||||||||
| Maritimes | 17 | ≤ 4 | > 32 | 41.2 | 58.8 | 5.9 | 35.3 | |||||||||||||||
| IV | ||||||||||||||||||||||
Table B.26. Distribution of minimal inhibitory concentrations for antimicrobials in Enterococcus isolates from pigs, by Enterococcus species; Farm Surveillance, 2008.
Information on how to interpret the MIC tables is provided at the beginning of Appendix B.
Table B.26. - Text Equivalent
| Antimicrobial | Species | n | Percentiles | % R | Distribution (%) of MICs (µg/mL) | ||||||||||||||||||||
|---|---|---|---|---|---|---|---|---|---|---|---|---|---|---|---|---|---|---|---|---|---|---|---|---|---|
| MIC 50 | MIC 90 | ≤ 0.015 | 0.03 | 0.06 | 0.12 | 0.25 | 0.5 | 1 | 2 | 4 | 8 | 16 | 32 | 64 | 128 | 256 | 512 | 1,024 | 2,048 | > 2,048 | |||||
| I | Ciprofloxacin | Enterococcus faecalis | 918 | 1 | 2 | 0.2 | 0.1 | 2.8 | 70.2 | 26.7 | 0.2 | ||||||||||||||
| Ciprofloxacin | Enterococcus faecium | 60 | 2 | 4 | 33.3 | 3.3 | 31.7 | 31.7 | 26.7 | 6.7 | |||||||||||||||
| Ciprofloxacin | Enterococcus spp. | 288 | 0.5 | 1 | 1.0 | 14.2 | 60.4 | 17.4 | 6.9 | 0.7 | 0.3 | ||||||||||||||
| Daptomycin | Enterococcus faecalis | 918 | 1 | 1 | 0.1 | 20.2 | 75.3 | 4.4 | 0.1 | 0.1 | |||||||||||||||
| Daptomycin | Enterococcus faecium | 60 | 2 | 4 | 0.0 | 10.0 | 10.0 | 38.3 | 41.7 | ||||||||||||||||
| Daptomycin | Enterococcus spp. | 288 | 1 | 4 | 0.0 | 19.4 | 39.2 | 30.6 | 10.8 | ||||||||||||||||
| Linezolid | Enterococcus faecalis | 918 | 2 | 2 | 0.0 | 2.6 | 24.8 | 72.4 | 0.1 | ||||||||||||||||
| Linezolid | Enterococcus faecium | 60 | 2 | 2 | 0.0 | 6.7 | 93.3 | ||||||||||||||||||
| Linezolid | Enterococcus spp. | 288 | 2 | 2 | 0.0 | 5.6 | 39.9 | 54.5 | |||||||||||||||||
| Tigecycline | Enterococcus faecalis | 918 | 0.25 | 0.25 | 1.6 | 0.3 | 1.2 | 3.2 | 37.6 | 50.1 | 6.0 | 1.6 | |||||||||||||
| Tigecycline | Enterococcus faecium | 60 | 0.12 | 0.5 | 1.7 | 1.7 | 50.0 | 35.0 | 11.7 | 1.7 | |||||||||||||||
| Tigecycline | Enterococcus spp. | 288 | 0.12 | 0.25 | 2.1 | 2.1 | 13.2 | 52.8 | 25.0 | 4.9 | 2.1 | ||||||||||||||
| Vancomycin | Enterococcus faecalis | 918 | 1 | 2 | 0.0 | 0.7 | 80.0 | 19.1 | 0.3 | ||||||||||||||||
| Vancomycin | Enterococcus faecium | 60 | ≤ 0.5 | 2 | 0.0 | 66.7 | 16.7 | 13.3 | 3.3 | ||||||||||||||||
| Vancomycin | Enterococcus spp. | 288 | ≤ 0.5 | 2 | 0.0 | 65.3 | 21.5 | 4.9 | 4.9 | 3.5 | |||||||||||||||
| II | Erythromycin | Enterococcus faecalis | 918 | > 8 | > 8 | 77.8 | 5.7 | 13.0 | 3.4 | 0.2 | 0.9 | 76.9 | |||||||||||||
| Erythromycin | Enterococcus faecium | 60 | 2 | > 8 | 13.3 | 26.7 | 11.7 | 31.7 | 16.7 | 3.3 | 10.0 | ||||||||||||||
| Erythromycin | Enterococcus spp. | 288 | > 8 | > 8 | 65.6 | 32.6 | 1.4 | 0.3 | 1.7 | 63.9 | |||||||||||||||
| Gentamicin | Enterococcus faecalis | 918 | ≤ 128 | 256 | 8.1 | 89.8 | 2.2 | 4.4 | 2.1 | 1.6 | |||||||||||||||
| Gentamicin | Enterococcus faecium | 60 | ≤ 128 | ≤ 128 | 0.0 | 100.0 | |||||||||||||||||||
| Gentamicin | Enterococcus spp. | 288 | ≤ 128 | ≤ 128 | 1.7 | 96.9 | 1.4 | 1.0 | 0.7 | ||||||||||||||||
| Kanamycin | Enterococcus faecalis | 918 | ≤ 128 | > 1,024 | 34.0 | 65.0 | 0.7 | 0.3 | 0.1 | 33.9 | |||||||||||||||
| Kanamycin | Enterococcus faecium | 60 | ≤ 128 | 512 | 8.3 | 60.0 | 18.3 | 13.3 | 8.3 | ||||||||||||||||
| Kanamycin | Enterococcus spp. | 288 | ≤ 128 | > 1,024 | 23.3 | 75.3 | 0.7 | 0.7 | 0.3 | 22.9 | |||||||||||||||
| Lincomycina | Enterococcus faecium | 60 | 16 | > 32 | 88.3 | 8.3 | 3.3 | 6.7 | 35.0 | 13.3 | 33.3 | ||||||||||||||
| Lincomycin | Enterococcus spp. | 288 | > 32 | > 32 | 97.6 | 0.7 | 1.7 | 7.3 | 11.5 | 78.8 | |||||||||||||||
| Penicillin | Enterococcus faecalis | 918 | 4 | 4 | 0.0 | 0.4 | 0.2 | 20.5 | 78.2 | 0.7 | |||||||||||||||
| Penicillin | Enterococcus faecium | 60 | 2 | 8 | 3.3 | 8.3 | 15.0 | 30.0 | 36.7 | 6.7 | 3.3 | ||||||||||||||
| Penicillin | Enterococcus spp. | 288 | 1 | 16 | 11.8 | 43.4 | 21.9 | 4.9 | 11.1 | 6.9 | 5.2 | 6.6 | |||||||||||||
| Quinupristin- dalfopristina |
Enterococcus faecium | 60 | 2 | 4 | 11.7 | 30.0 | 58.3 | 10.0 | 1.7 | ||||||||||||||||
| Quinupristin- dalfopristin |
Enterococcus spp. | 288 | 4 | 8 | 51.7 | 6.9 | 41.3 | 21.9 | 27.4 | 2.4 | |||||||||||||||
| Streptomycin | Enterococcus faecalis | 918 | ≤ 512 | > 2,048 | 47.2 | 52.8 | 3.9 | 13.8 | 29.4 | ||||||||||||||||
| Streptomycin | Enterococcus faecium | 60 | ≤ 512 | ≤ 512 | 8.3 | 91.7 | 6.7 | 1.7 | |||||||||||||||||
| Streptomycin | Enterococcus spp. | 288 | ≤ 512 | > 2,048 | 28.8 | 71.2 | 7.6 | 8.7 | 12.5 | ||||||||||||||||
| Tylosin | Enterococcus faecalis | 918 | > 32 | > 32 | 78.0 | 0.1 | 8.4 | 13.1 | 0.4 | 0.1 | 77.9 | ||||||||||||||
| Tylosin | Enterococcus faecium | 60 | 4 | > 32 | 10.0 | 25.0 | 20.0 | 33.3 | 11.7 | 10.0 | |||||||||||||||
| Tylosin | Enterococcus spp. | 288 | > 32 | > 32 | 66.3 | 0.3 | 0.3 | 6.6 | 22.6 | 3.5 | 0.3 | 0.3 | 66.0 | ||||||||||||
| III | Chloramphenicol | Enterococcus faecalis | 918 | 8 | 8 | 7.4 | 0.1 | 0.4 | 10.3 | 79.5 | 2.2 | 2.5 | 4.9 | ||||||||||||
| Chloramphenicol | Enterococcus faecium | 60 | 4 | 8 | 0.0 | 1.7 | 70.0 | 26.7 | 1.7 | ||||||||||||||||
| Chloramphenicol | Enterococcus spp. | 288 | 4 | 8 | 5.9 | 5.2 | 56.9 | 31.6 | 0.3 | 3.5 | 2.4 | ||||||||||||||
| Nitrofurantoin | Enterococcus faecalis | 918 | 8 | 16 | 0.9 | 0.1 | 1.2 | 74.8 | 21.2 | 0.4 | 1.3 | 0.9 | |||||||||||||
| Nitrofurantoin | Enterococcus faecium | 60 | 64 | 64 | 6.7 | 13.3 | 1.7 | 78.3 | 6.7 | ||||||||||||||||
| Nitrofurantoin | Enterococcus spp. | 288 | 32 | > 64 | 18.8 | 0.3 | 2.4 | 17.7 | 6.9 | 35.8 | 18.1 | 18.8 | |||||||||||||
| Tetracycline | Enterococcus faecalis | 918 | > 32 | > 32 | 93.8 | 6.0 | 0.2 | 1.3 | 3.9 | 88.6 | |||||||||||||||
| Tetracycline | Enterococcus faecium | 60 | ≤ 4 | > 32 | 40.0 | 60.0 | 3.3 | 36.7 | |||||||||||||||||
| Tetracycline | Enterococcus spp. | 288 | > 32 | > 32 | 83.3 | 16.0 | 0.7 | 1.7 | 3.5 | 78.1 | |||||||||||||||
| IV | Flavomycin | Enterococcus faecalis | 918 | ≤ 1 | ≤ 1 | 0.4 | 93.4 | 6.2 | 0.4 | ||||||||||||||||
| Flavomycin | Enterococcus faecium | 60 | > 16 | > 16 | 93.3 | 3.3 | 1.7 | 1.7 | 93.3 | ||||||||||||||||
| Flavomycin | Enterococcus spp. | 288 | 16 | > 16 | 48.3 | 17.4 | 9.4 | 9.0 | 8.7 | 7.3 | 48.3 | ||||||||||||||
a Resistance to quinupristin-dalfopristin and lincomycin is not reported for E. faecalis because E. faecalis is intrinsically resistant to these antimicrobials.
Turkeys
Table B.27. Distribution of minimal inhibitory concentrations for antimicrobials in Salmonella isolates from turkeys; Surveillance of Animal Clinical Isolates, 2008.
Information on how to interpret the MIC tables is provided at the beginning of Appendix B.
Table B.27. - Text Equivalent
| Antimicrobial | n | Percentiles | % R | Distribution (%) of MICs (µg/mL) | |||||||||||||||||
|---|---|---|---|---|---|---|---|---|---|---|---|---|---|---|---|---|---|---|---|---|---|
| MIC 50 | MIC 90 | ≤ 0.015 | 0.03 | 0.06 | 0.12 | 0.25 | 0.5 | 1 | 2 | 4 | 8 | 16 | 32 | 64 | 128 | 256 | > 256 | ||||
| I | Amoxicillin-clavulanic acid | 32 | > 32 | > 32 | 56.3 | 43.8 | 3.1 | 53.1 | |||||||||||||
| Ceftiofur | 32 | > 8 | > 8 | 56.3 | 15.6 | 25.0 | 3.1 | 56.3 | |||||||||||||
| Ceftriaxone | 32 | 16 | 32 | 56.3 | 43.8 | 15.6 | 31.3 | 6.3 | 3.1 | ||||||||||||
| Ciprofloxacin | 32 | ≤ 0.015 | ≤ 0.015 | 0.0 | 96.9 | 3.1 | |||||||||||||||
| II | Amikacin | 32 | 2 | 2 | 0.0 | 3.1 | 46.9 | 40.6 | 9.4 | ||||||||||||
| Ampicillin | 32 | > 32 | > 32 | 56.3 | 40.6 | 3.1 | 56.3 | ||||||||||||||
| Cefoxitin | 32 | 32 | > 32 | 56.3 | 3.1 | 6.3 | 25.0 | 6.3 | 3.1 | 9.4 | 46.9 | ||||||||||
| Gentamicin | 32 | 0.50 | > 16 | 28.1 | 18.8 | 46.9 | 3.1 | 3.1 | 28.1 | ||||||||||||
| Kanamycin | 32 | ≤ 8 | > 64 | 15.6 | 78.1 | 3.1 | 3.1 | 15.6 | |||||||||||||
| Nalidixic acid | 32 | 4 | 4 | 0.0 | 21.9 | 75.0 | 3.1 | ||||||||||||||
| Streptomycin | 32 | ≤ 32 | > 64 | 40.6 | 59.4 | 9.4 | 31.3 | ||||||||||||||
| Trimethoprim-sulfamethoxazole | 32 | ≤ 0.12 | 0.25 | 3.1 | 68.8 | 28.1 | 3.1 | ||||||||||||||
| III | Chloramphenicol | 32 | 8 | 8 | 3.1 | 31.3 | 65.6 | 3.1 | |||||||||||||
| Sulfisoxazole | 32 | 32 | > 256 | 31.3 | 21.9 | 37.5 | 9.4 | 31.3 | |||||||||||||
| Tetracycline | 32 | ≤ 4 | > 32 | 43.8 | 56.3 | 43.8 | |||||||||||||||
| IV | |||||||||||||||||||||
Horses
Table B.28. Distribution of minimal inhibitory concentrations for antimicrobials in Salmonella isolates from horses; Surveillance of Animal Clinical Isolates, 2008.
Information on how to interpret the MIC tables is provided at the beginning of Appendix B.
Table B.28. - Text Equivalent
| Antimicrobial | n | Percentiles | % R | Distribution (%) of MICs (µg/mL) | |||||||||||||||||
|---|---|---|---|---|---|---|---|---|---|---|---|---|---|---|---|---|---|---|---|---|---|
| MIC 50 | MIC 90 | ≤ 0.015 | 0.03 | 0.06 | 0.12 | 0.25 | 0.5 | 1 | 2 | 4 | 8 | 16 | 32 | 64 | 128 | 256 | > 256 | ||||
| I | Amoxicillin-clavulanic acid | 62 | 8 | 32 | 11.3 | 46.8 | 1.6 | 12.9 | 27.4 | 1.6 | 9.7 | ||||||||||
| Ceftiofur | 62 | 1 | > 8 | 11.3 | 32.3 | 56.5 | 11.3 | ||||||||||||||
| Ceftriaxone | 62 | ≤ 0.25 | 16 | 11.3 | 88.7 | 9.7 | 1.6 | ||||||||||||||
| Ciprofloxacin | 62 | ≤ 0.015 | 0.25 | 0.0 | 58.1 | 1.6 | 40.3 | ||||||||||||||
| II | Amikacin | 62 | 1 | 16 | 0.0 | 1.6 | 50.0 | 12.9 | 1.6 | 4.8 | 21.0 | 8.1 | |||||||||
| Ampicillin | 62 | > 32 | > 32 | 51.6 | 46.8 | 1.6 | 51.6 | ||||||||||||||
| Cefoxitin | 62 | 2 | 32 | 11.3 | 35.5 | 41.9 | 11.3 | 8.1 | 3.2 | ||||||||||||
| Gentamicin | 62 | 0.50 | > 16 | 41.9 | 33.9 | 22.6 | 1.6 | 41.9 | |||||||||||||
| Kanamycin | 62 | ≤ 8 | > 64 | 41.9 | 58.1 | 41.9 | |||||||||||||||
| Nalidixic acid | 62 | 4 | 16 | 0.0 | 14.5 | 45.2 | 27.4 | 12.9 | |||||||||||||
| Streptomycin | 62 | ≤ 32 | ≤ 32 | 4.8 | 95.2 | 3.2 | 1.6 | ||||||||||||||
| Trimethoprim-sulfamethoxazole | 62 | 0.25 | > 4 | 41.9 | 43.5 | 14.5 | 41.9 | ||||||||||||||
| III | Chloramphenicol | 62 | 8 | > 32 | 16.1 | 27.4 | 56.5 | 16.1 | |||||||||||||
| Sulfisoxazole | 62 | 64 | > 256 | 41.9 | 8.1 | 30.6 | 19.4 | 41.9 | |||||||||||||
| Tetracycline | 62 | ≤ 4 | ≤ 4 | 3.2 | 93.5 | 3.2 | 3.2 | ||||||||||||||
| IV | |||||||||||||||||||||
Feed and Feed Ingredients
Table B.29. Distribution of minimal inhibitory concentrations for antimicrobials in Salmonella isolates from animal feed; Feed and Feed Ingredients, 2008.
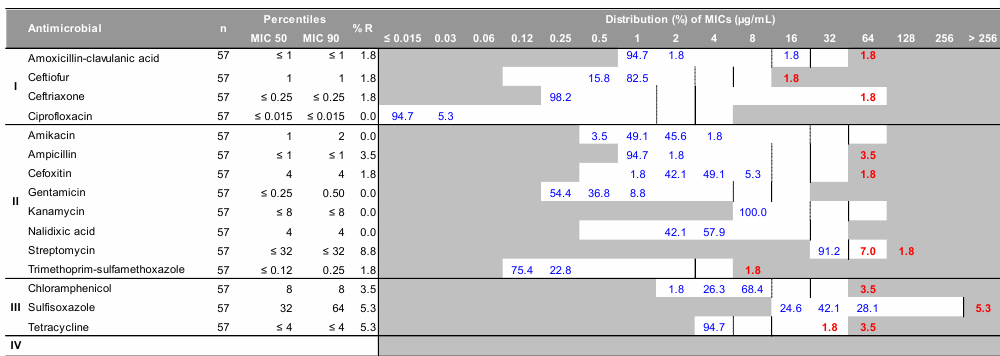
Information on how to interpret the MIC tables is provided at the beginning of Appendix B.
Table B.29. - Text Equivalent
| Antimicrobial | n | Percentiles | % R | Distribution (%) of MICs (µg/mL) | |||||||||||||||||
|---|---|---|---|---|---|---|---|---|---|---|---|---|---|---|---|---|---|---|---|---|---|
| MIC 50 | MIC 90 | ≤ 0.015 | 0.03 | 0.06 | 0.12 | 0.25 | 0.5 | 1 | 2 | 4 | 8 | 16 | 32 | 64 | 128 | 256 | > 256 | ||||
| I | Amoxicillin-clavulanic acid | 57 | ≤ 1 | ≤ 1 | 1.8 | 94.7 | 1.8 | 1.8 | 1.8 | ||||||||||||
| Ceftiofur | 57 | 1 | 1 | 1.8 | 15.8 | 82.5 | 1.8 | ||||||||||||||
| Ceftriaxone | 57 | ≤ 0.25 | ≤ 0.25 | 1.8 | 98.2 | 1.8 | |||||||||||||||
| Ciprofloxacin | 57 | ≤ 0.015 | ≤ 0.015 | 0.0 | 94.7 | 5.3 | |||||||||||||||
| II | Amikacin | 57 | 1 | 2 | 0.0 | 3.5 | 49.1 | 45.6 | 1.8 | ||||||||||||
| Ampicillin | 57 | ≤ 1 | ≤ 1 | 3.5 | 94.7 | 1.8 | 3.5 | ||||||||||||||
| Cefoxitin | 57 | 4 | 4 | 1.8 | 1.8 | 42.1 | 49.1 | 5.3 | 1.8 | ||||||||||||
| Gentamicin | 57 | ≤ 0.25 | 0.50 | 0.0 | 54.4 | 36.8 | 8.8 | ||||||||||||||
| Kanamycin | 57 | ≤ 8 | ≤ 8 | 0.0 | 100.0 | ||||||||||||||||
| Nalidixic acid | 57 | 4 | 4 | 0.0 | 42.1 | 57.9 | |||||||||||||||
| Streptomycin | 57 | ≤ 32 | ≤ 32 | 8.8 | 91.2 | 7.0 | 1.8 | ||||||||||||||
| Trimethoprim-sulfamethoxazole | 57 | ≤ 0.12 | 0.25 | 1.8 | 75.4 | 22.8 | 1.8 | ||||||||||||||
| III | Chloramphenicol | 57 | 8 | 8 | 3.5 | 1.8 | 26.3 | 68.4 | 3.5 | ||||||||||||
| Sulfisoxazole | 57 | 32 | 64 | 5.3 | 24.6 | 42.1 | 28.1 | 5.3 | |||||||||||||
| Tetracycline | 57 | ≤ 4 | ≤ 4 | 5.3 | 94.7 | 1.8 | 3.5 | ||||||||||||||
| IV | |||||||||||||||||||||