
Non-advertised appointments by employment equity group: Fiscal years 2013 to 2023
Table of Contents
Objectives and key takeaways
According to the Employment Equity Act, employment equity aims to achieve equality in the workplace and to correct conditions of disadvantage in employment for the 4 employment equity groups: women, Indigenous PeoplesFootnote 1, persons with disabilities and members of visible minorities. In January 2021, the Clerk of the Privy Council issued a Call to Action on Anti-Racism, Equity, and Inclusion in the Federal Public Service which highlighted the urgency of removing systemic racism from institutions across the federal public service, including those related to the staffing and recruitment processes. Embedded in this call to action, the Clerk underscored the importance of addressing the unique challenges faced by Indigenous Peoples and persons with disabilities, noting that concerted system-wide efforts, together with strong commitment and leadership, can generate the necessary momentum for positive change.Footnote 2
This report contributes to the achievement of these equity and inclusion aims by examining trends in non-advertised appointments within federal public service organizations that rely on the Public Service Commission’s authority to make appointments as set out in the Public Service Employment Act (PSEA). In particular, it updates previous analyses conducted in 2019 and 2021 by looking at the use of non-advertised appointments for persons in employment equity groups (hereafter employment equity groups) for fiscal years 2013 to 2023Footnote 3, including a pre-post analysis of the influence of the New Direction on Staffing (NDS), which came into effect in April 2016.
Following are some of the key takeaways from this analysis:
- Non-advertised appointments have continued to grow since 2016, both in total number as well as in terms of the share of total appointments.
- Women and visible minorities’ (including most subgroups) representation in non-advertised appointments has continued to increase. For visible minorities, representation in non-advertised appointments was consistently lower than for advertised appointments.
- While the representation of persons with disabilities in non-advertised appointments improved recently, persons with disabilities continue to be the only employment equity group with representation in non-advertised appointments below the workforce availability (WFA).
- Finally, Indigenous Peoples are the only employment equity group that did not experience a strong increase in their representation in non-advertised appointments; however, their representation in advertised and non-advertised appointments has remained consistently above their WFA.
Analysis
This analysis presents trends in non-advertised versus advertised appointments for fiscal years 2013 to 2023, using fiscal year 2015 to 2016 as a key benchmark for comparison. The results are disaggregated by employment equity group for women, visible minorities and subgroups, Indigenous Peoples, and persons with disabilities. Comparisons are made across time and with WFA benchmarks; see Annex 1 for details on methodology.
Overall
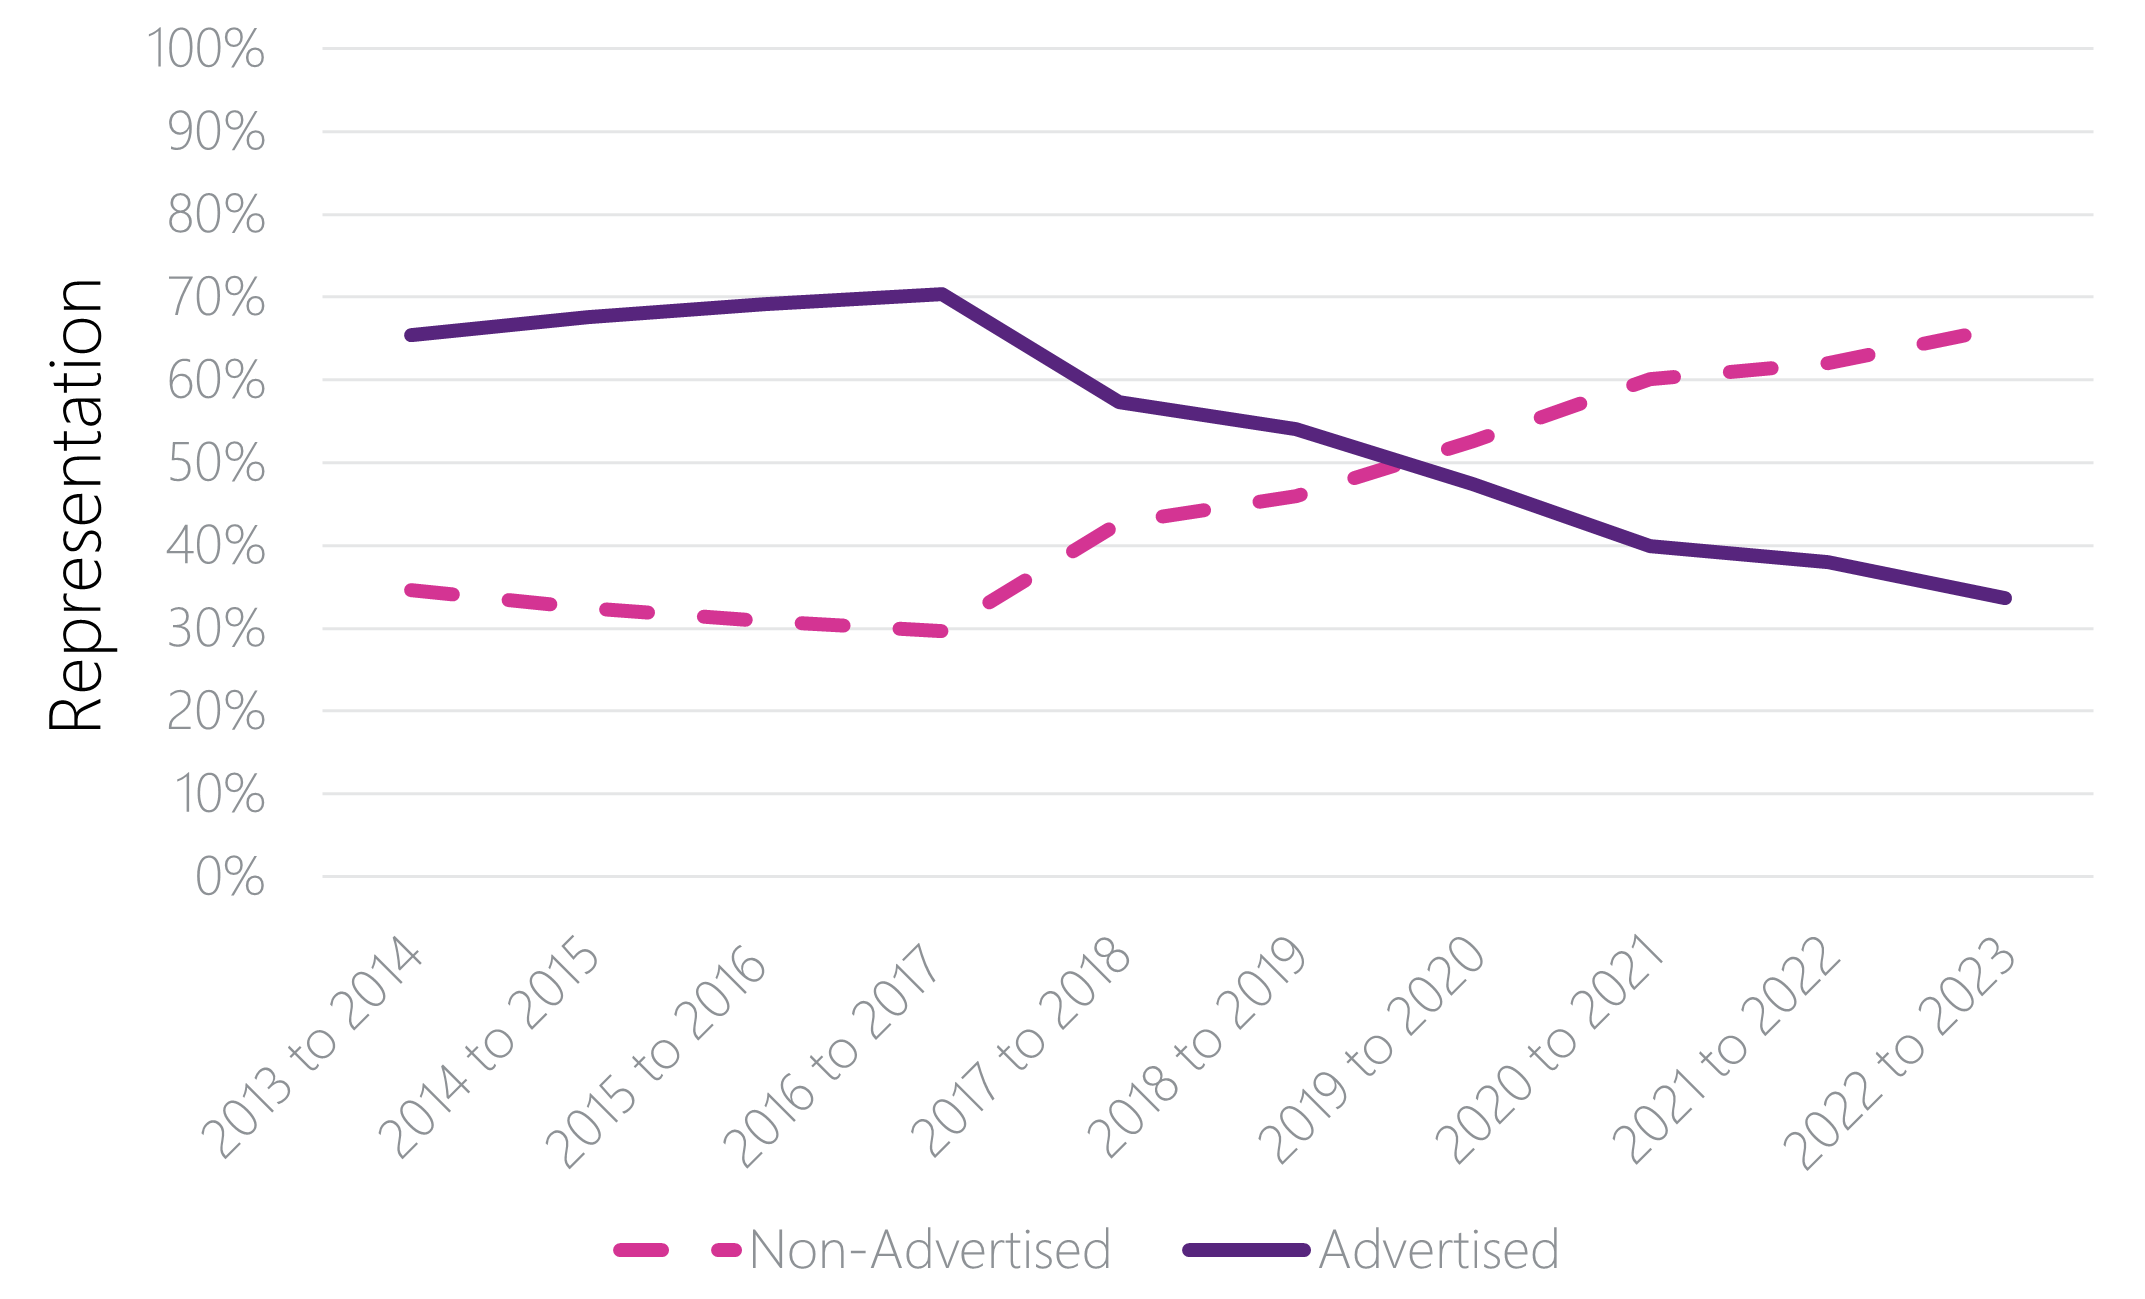
For fiscal years 2015 to 2023, the total number of appointments almost tripled, from 26,433 to 73,883. Further, the share of non-advertised appointments grew from one-third (30.8%) of appointments in fiscal year 2015 to 2016, to more than two-thirds (66.3%) of appointments in fiscal year 2022 to 2023.
Figure 1: Proportion of advertised compared to non-advertised appointments, Fiscal years 2013 to 2023
Text version
| All employees | 2013 to 2014 | 2014 to 2015 | 2015 to 2016 | 2016 to 2017 | 2017 to 2018 | 2018 to 2019 | 2019 to 2020 | 2020 to 2021 | 2021 to 2022 | 2022 to 2023 |
|---|---|---|---|---|---|---|---|---|---|---|
| Non-advertised | 34.6% | 32.4% | 30.8% | 29.7% | 42.7% | 45.9% | 52.6% | 60.0% | 62.0% | 66.3% |
| Advertised | 65.4% | 67.6% | 69.2% | 70.3% | 57.3% | 54.1% | 47.4% | 40.0% | 38.0% | 33.7% |
| Count | 18,963 | 24,638 | 26,433 | 30,431 | 42,117 | 50,028 | 53,827 | 53,099 | 63,837 | 73,883 |
Women
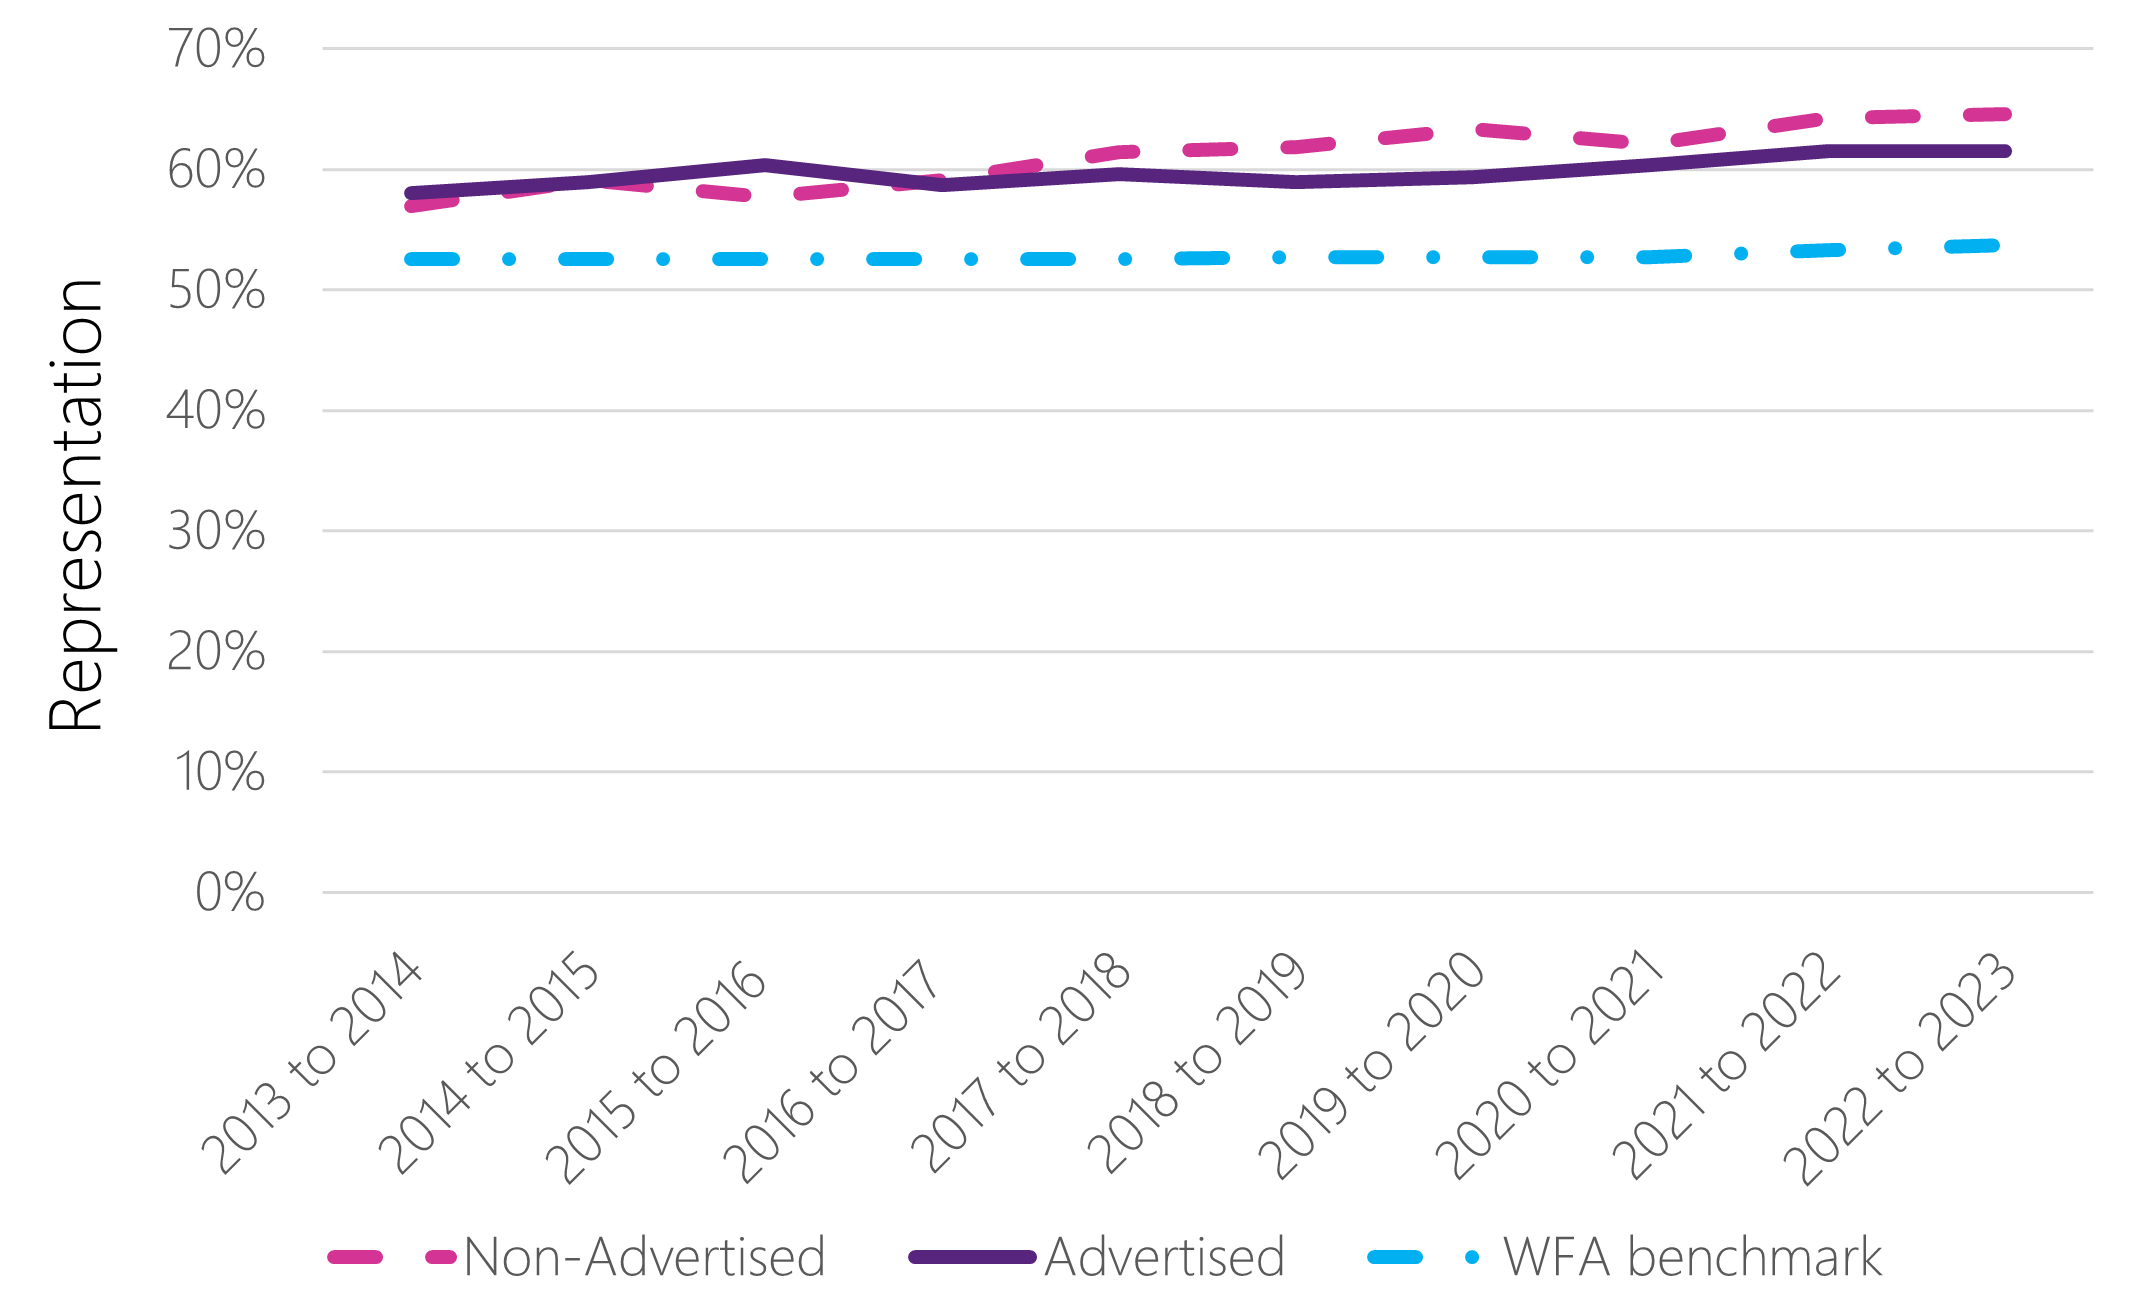
Women’s representation in non-advertised appointments increased from 57.7% in fiscal year 2015 to 2016 to 64.6% in fiscal year 2022 to 2023. By comparison, women’s representation in advertised appointments grew more modestly, increasing from 60.3% in fiscal year 2015 to 2016 to 61.5% in fiscal year 2022 to 2023.
Figure 2: Representation of women in advertised and non-advertised appointments compared to the corresponding workforce availability, Fiscal years 2013 to 2023
Text version
| Women’s representation | 2013 to 2014 | 2014 to 2015 | 2015 to 2016 | 2016 to 2017 | 2017 to 2018 | 2018 to 2019 | 2019 to 2020 | 2020 to 2021 | 2021 to 2022 | 2022 to 2023 |
|---|---|---|---|---|---|---|---|---|---|---|
| Non-advertised | 56.9% | 59.1% | 57.7% | 59.1% | 61.4% | 61.8% | 63.3% | 62.1% | 64.2% | 64.6% |
| Advertised | 58.0% | 58.9% | 60.3% | 58.7% | 59.6% | 58.9% | 59.3% | 60.3% | 61.5% | 61.5% |
| WFA benchmark | 52.5% | 52.5% | 52.5% | 52.5% | 52.5% | 52.7% | 52.7% | 52.7% | 53.3% | 53.7% |
| Count | 10,922 | 14,528 | 15,717 | 17,910 | 25,432 | 30,147 | 33,046 | 32,599 | 40,315 | 46,944 |
Visible minorities
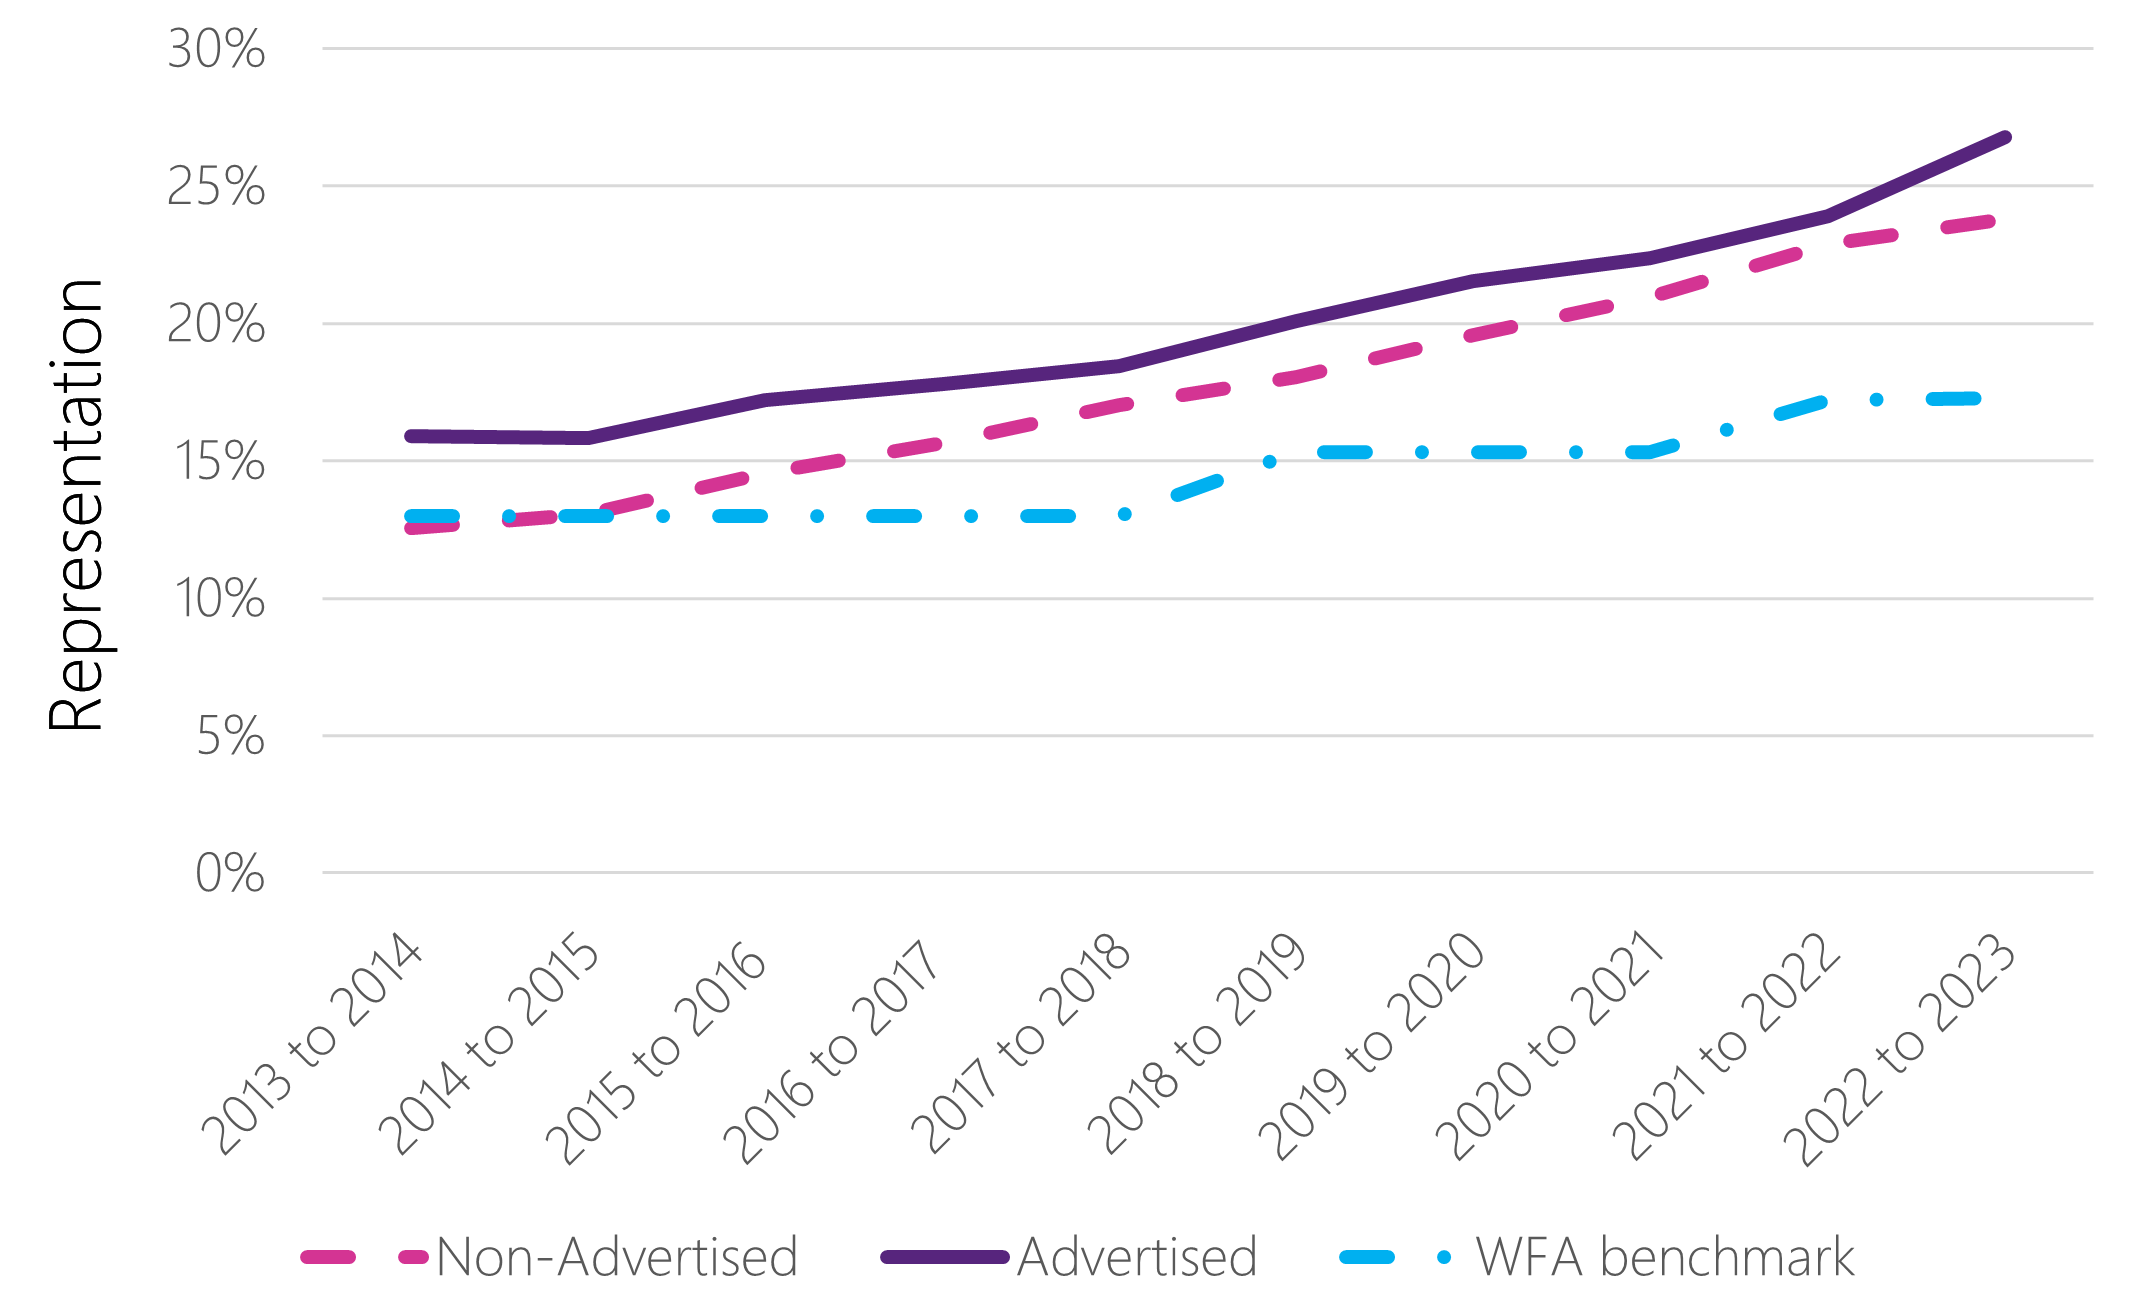
Visible minorities’ representation in both non-advertised and advertised appointments increased steadily over time. For non-advertised appointments, visible minorities’ representation increased from 14.6% in fiscal year 2015 to 2016 to 23.8% in fiscal year 2022 to 2023, while for advertised appointments, it grew from 17.2% to 26.8%. Visible minorities’ representation in non-advertised appointments has also improved relative to the WFA benchmark. Overall, visible minorities’ representation in advertised appointments is slightly higher than for non-advertised appointments.
Most visible minority subgroups experienced growth in their advertised and non-advertised appointment representation. Black public servants were the largest subgroup of visible minorities represented in non-advertised appointments, with their representation more than doubling from 2.2% in fiscal year 2015 to 2016, up to 5.3% in fiscal year 2022 to 2023. A similar trend is observed for Black employees’ representation in advertised appointments, which grew from 2.7% in fiscal year 2015 to 2016 to 6.2% in fiscal year 2022 to 2023. Representation in non-advertised appointments similarly increased for employees self-identifying as: South Asian/East Indian from 2.2% in fiscal year 2015 to 2016 to 4.1% in fiscal year 2022 to 2023; West Asian, North African or Arab from 1.8% in fiscal year 2015 to 2016 to 3.2% in fiscal year 2022 to 2023; and Chinese from 2.2% in fiscal year 2015 to 2016 to 3.0% in fiscal year 2022 to 2023. Detailed results for additional visible minority subgroups are provided in Table 3b of Annex 2.
Figure 3: Representation of visible minorities in advertised and non-advertised appointments compared to the corresponding workforce availability, Fiscal years 2013 to 2023
Text version
| Visible minorities’ representation | 2013 to 2014 | 2014 to 2015 | 2015 to 2016 | 2016 to 2017 | 2017 to 2018 | 2018 to 2019 | 2019 to 2020 | 2020 to 2021 | 2021 to 2022 | 2022 to 2023 |
|---|---|---|---|---|---|---|---|---|---|---|
| Non-advertised | 12.5% | 13.1% | 14.6% | 15.7% | 17.0% | 18.0% | 19.6% | 21.0% | 22.9% | 23.8% |
| Advertised | 15.9% | 15.8% | 17.2% | 17.8% | 18.5% | 20.1% | 21.5% | 22.4% | 23.9% | 26.8% |
| WFA benchmark | 13.0% | 13.0% | 13.0% | 13.0% | 13.0% | 15.3% | 15.3% | 15.3% | 17.2% | 17.3% |
| Count | 2,796 | 3,678 | 4,335 | 5,221 | 7,513 | 9,581 | 11,039 | 11,430 | 14,856 | 18,324 |
Indigenous Peoples
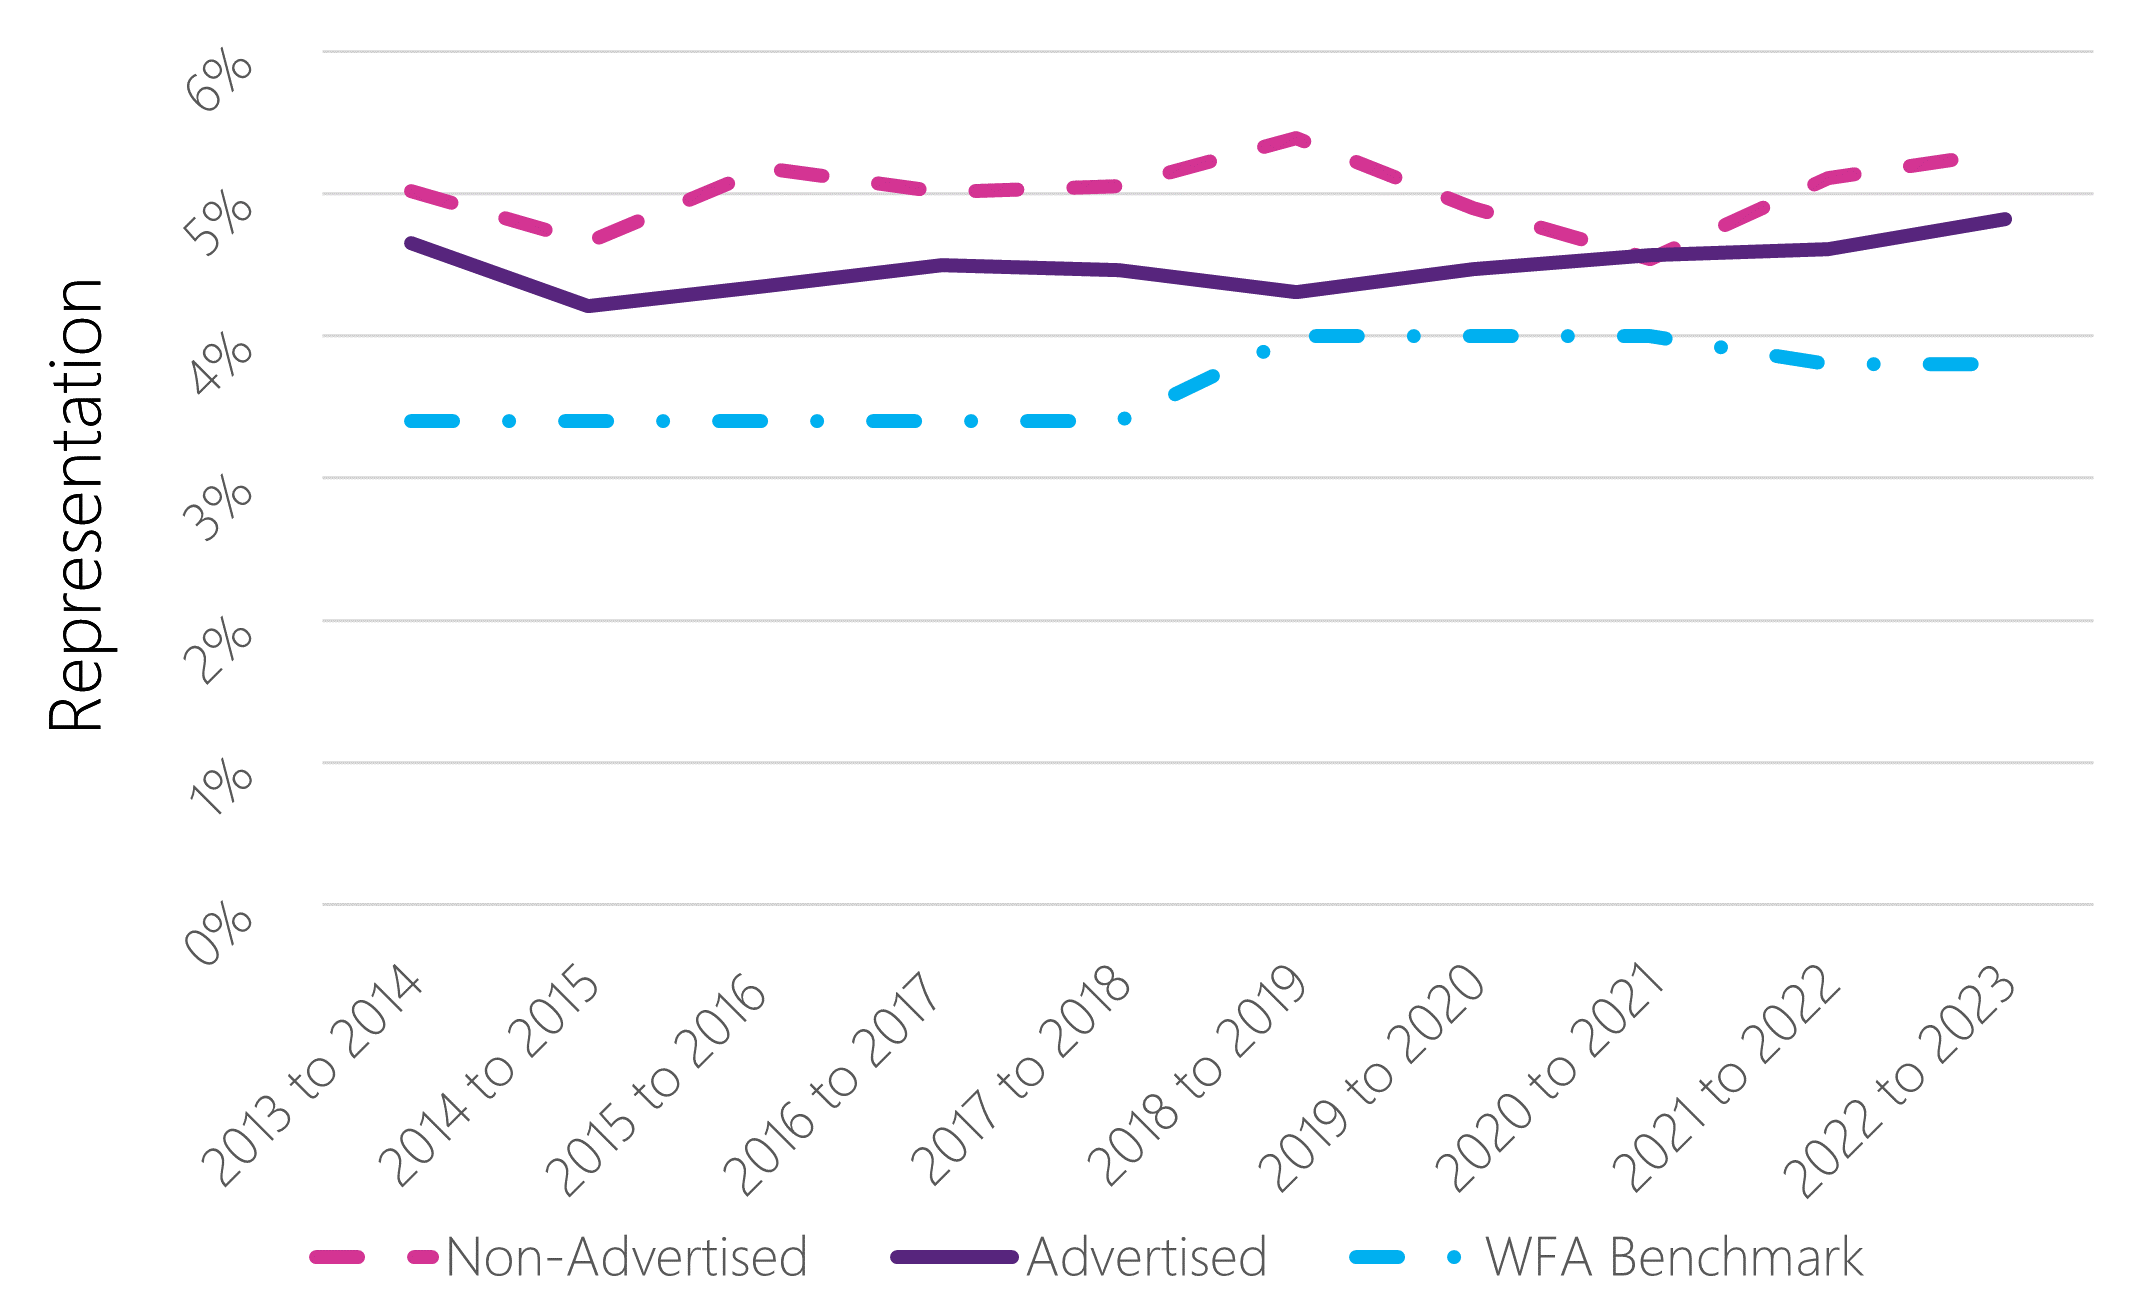
Among all employment equity groups, Indigenous Peoples had the smallest growth in their representation for both non-advertised and advertised appointments. For non-advertised appointments, their representation increased by 0.1 percentage point from 5.2% in fiscal year 2015 to 2016 to 5.3% in fiscal year 2022 to 2023, while for advertised appointments it increased by 0.4 percentage points from 4.4% to 4.8% over the same period. Nevertheless, Indigenous Peoples’ representation in both advertised and non-advertised appointments did consistently remain above the WFA benchmark.
Figure 4: Representation of Indigenous Peoples in advertised and non-advertised appointments compared to the corresponding workforce availability, Fiscal years 2013 to 2023
Text version
| Indigenous Peoples’ representation | 2013 to 2014 | 2014 to 2015 | 2015 to 2016 | 2016 to 2017 | 2017 to 2018 | 2018 to 2019 | 2019 to 2020 | 2020 to 2021 | 2021 to 2022 | 2022 to 2023 |
|---|---|---|---|---|---|---|---|---|---|---|
| Non-advertised | 5.0% | 4.7% | 5.2% | 5.0% | 5.1% | 5.4% | 4.9% | 4.5% | 5.1% | 5.3% |
| Advertised | 4.7% | 4.2% | 4.4% | 4.5% | 4.5% | 4.3% | 4.5% | 4.6% | 4.6% | 4.8% |
| WFA benchmark | 3.4% | 3.4% | 3.4% | 3.4% | 3.4% | 4.0% | 4.0% | 4.0% | 3.8% | 3.8% |
| Count | 906 | 1,073 | 1,218 | 1,416 | 1,986 | 2,402 | 2,528 | 2,416 | 3,142 | 3,791 |
Persons with disabilities
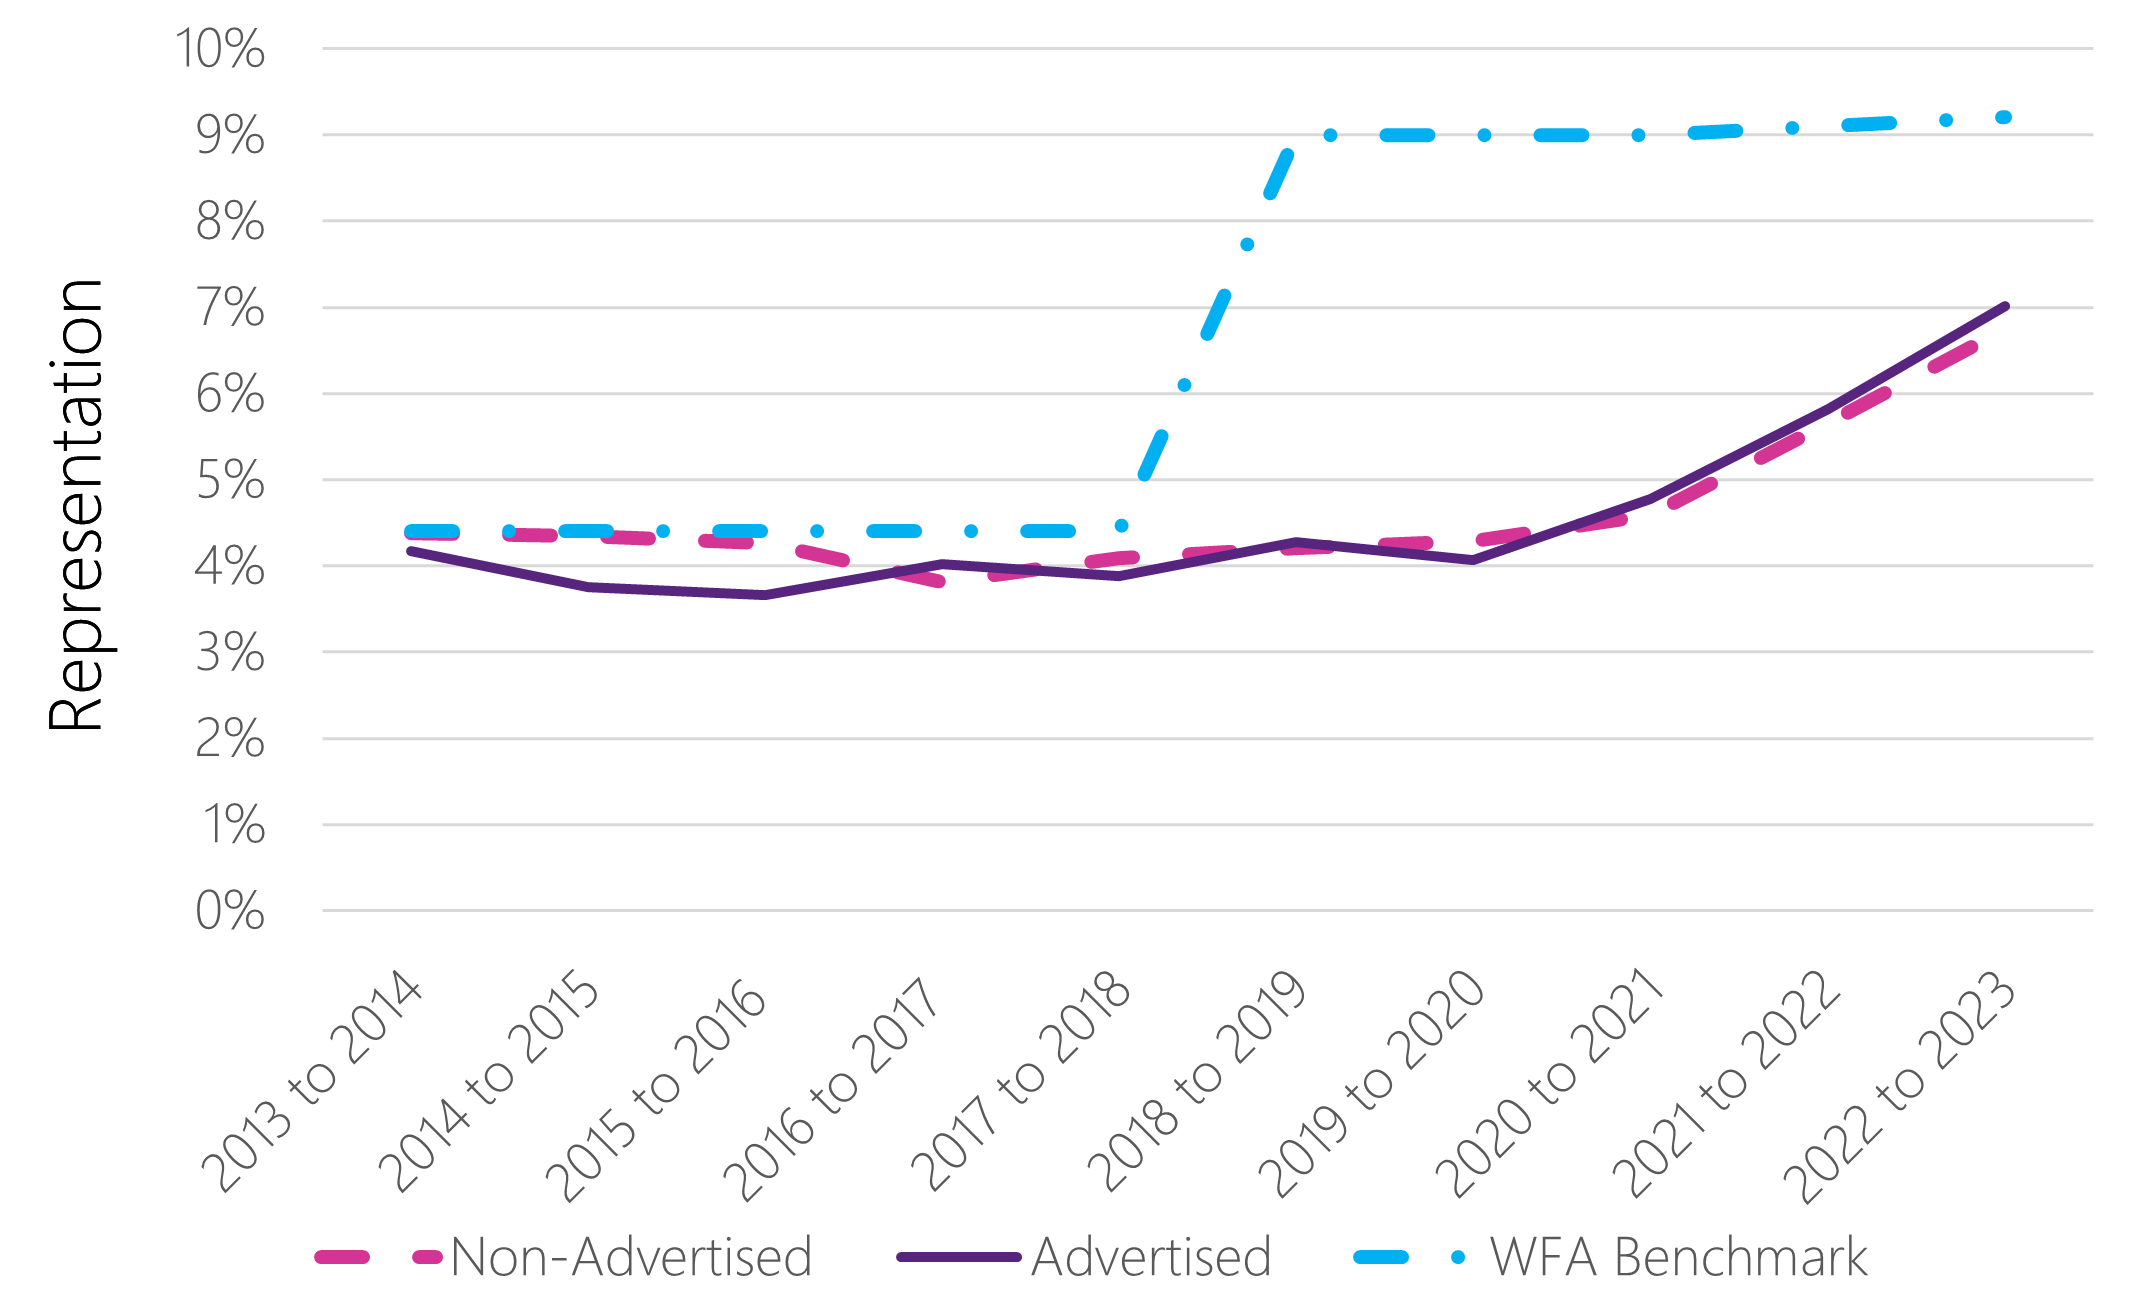
There has been a positive trend in the representation of persons with disabilities in both non-advertised and advertised appointments, particularly since the introduction of the Accessibility Strategy for the Public Service of Canada in 2019. In fact, persons with disabilities’ representation in non-advertised appointments increased from 4.3% in fiscal year 2015 to 2016 to 6.8% in fiscal year 2022 to 2023. Similarly, for advertised appointments, their representation grew from 3.7% in fiscal year 2015 to 2016 to 7.0% in fiscal year 2022 to 2023. While persons with disabilities’ representation has improved, it continues to be below the WFA benchmark.Footnote 4
Figure 5: Representation of persons with disabilities in advertised and non-advertised appointments compared to the corresponding workforce availability, Fiscal years 2013 to 2023
Text version
| Persons with disabilities representation | 2013 to 2014 | 2014 to 2015 | 2015 to 2016 | 2016 to 2017 | 2017 to 2018 | 2018 to 2019 | 2019 to 2020 | 2020 to 2021 | 2021 to 2022 | 2022 to 2023 |
|---|---|---|---|---|---|---|---|---|---|---|
| Non-advertised | 4.4% | 4.4% | 4.3% | 3.8% | 4.1% | 4.2% | 4.3% | 4.6% | 5.7% | 6.8% |
| Advertised | 4.2% | 3.8% | 3.7% | 4.0% | 3.9% | 4.3% | 4.1% | 4.8% | 5.8% | 7.0% |
| WFA benchmark | 4.4% | 4.4% | 4.4% | 4.4% | 4.4% | 9.0% | 9.0% | 9.0% | 9.1% | 9.2% |
| Count | 804 | 971 | 1,016 | 1,205 | 1,672 | 2,120 | 2,255 | 2,474 | 3,650 | 5,052 |
Conclusion
Overall, the analysis found that representation in non-advertised appointments continued to increase among women and visible minorities (including most subgroups) and consistently exceeded their respective WFA benchmarks. For persons with disabilities, the strong gains in representation in non-advertised appointments have been especially concentrated over the past three years since the implementation of the Accessibility Strategy for the Public Service of Canada. Still, more needs to be done for representation in appointments to reflect the new WFA benchmark introduced for persons with disabilities in fiscal year 2018 to 2019. Finally, even though the representation in non-advertised appointments for Indigenous Peoples is consistently higher than their WFA benchmark, this is the only employment equity group that has not experienced a strong increase in representation in advertised or non-advertised appointments.
Annex 1 - Methodology
The analysis considers differences in the representation of employment equity groups in non-advertised appointments compared to advertised appointments and their respective workforce availability benchmark (WFA).
The analysis covers persons employed in departments and agencies that rely on the Public Service Commission’s authority to make appointments as set out in the Public Service Employment Act (PSEA). Employees in separate agencies as well as those who are in term positions of less than three months or in a training program are not included in the analysis. Results are based on the fiscal year in which the staffing activity occurred according to the pay system.
Employees are categorized as receiving either an advertised or a non-advertised appointment using a data matching system that identifies appointments associated with a corresponding job advertised on the Government of Canada jobs website. Matched data are from the PSC’s Public Service Resourcing System (PSRS) and Priority Information Management System (PIMS), as well as the PSC’s administrative hiring and staffing data, which is derived from the Treasury Board of Canada Secretariat Incumbent Master file.
Appointments to advertised and non-advertised positions include:
- Promotions
- Acting appointment of four months or more
- New public servant hires to indeterminate and term positions of at least three months in length
Workforce availability (WFA) estimates are used to assess the representativeness of employment equity groups in accordance with the Employment Equity Act. WFA benchmarks are obtained from the Report on Employment Equity in the Public Service of Canada, which is updated and published annually by the Treasury Board of Canada Secretariat.
The analysis is supplemented by self-identification data for employment equity groups from the Employment Equity Data Bank. Data from the Employment Equity Database is collected from employees on a voluntary basis through a self-identification questionnaire administered on behalf of the Treasury Board of Canada Secretariat.
Annex 2 - Data tables
| All employees | 2013 to 2014 | 2014 to 2015 | 2015 to 2016 | 2016 to 2017 | 2017 to 2018 | 2018 to 2019 | 2019 to 2020 | 2020 to 2021 | 2021 to 2022 | 2022 to 2023 |
|---|---|---|---|---|---|---|---|---|---|---|
| Non-advertised | 34.6% | 32.4% | 30.8% | 29.7% | 42.7% | 45.9% | 52.6% | 60.0% | 62.0% | 66.3% |
| Advertised | 65.4% | 67.6% | 69.2% | 70.3% | 57.3% | 54.1% | 47.4% | 40.0% | 38.0% | 33.7% |
| Count | 18,963 | 24,638 | 26,433 | 30,431 | 42,117 | 50,028 | 53,827 | 53,099 | 63,837 | 73,883 |
| Women’s representation | 2013 to 2014 | 2014 to 2015 | 2015 to 2016 | 2016 to 2017 | 2017 to 2018 | 2018 to 2019 | 2019 to 2020 | 2020 to 2021 | 2021 to 2022 | 2022 to 2023 |
|---|---|---|---|---|---|---|---|---|---|---|
| Non-advertised | 56.9% | 59.1% | 57.7% | 59.1% | 61.4% | 61.8% | 63.3% | 62.1% | 64.2% | 64.6% |
| Advertised | 58.0% | 58.9% | 60.3% | 58.7% | 59.6% | 58.9% | 59.3% | 60.3% | 61.5% | 61.5% |
| WFA benchmark | 52.5% | 52.5% | 52.5% | 52.5% | 52.5% | 52.7% | 52.7% | 52.7% | 53.3% | 53.7% |
| Count | 10,922 | 14,528 | 15,717 | 17,910 | 25,432 | 30,147 | 33,046 | 32,599 | 40,315 | 46,944 |
| Visible minorities’ representation | 2013 to 2014 | 2014 to 2015 | 2015 to 2016 | 2016 to 2017 | 2017 to 2018 | 2018 to 2019 | 2019 to 2020 | 2020 to 2021 | 2021 to 2022 | 2022 to 2023 |
|---|---|---|---|---|---|---|---|---|---|---|
| Non-advertised | 12.5% | 13.1% | 14.6% | 15.7% | 17.0% | 18.0% | 19.6% | 21.0% | 22.9% | 23.8% |
| Advertised | 15.9% | 15.8% | 17.2% | 17.8% | 18.5% | 20.1% | 21.5% | 22.4% | 23.9% | 26.8% |
| WFA benchmark | 13.0% | 13.0% | 13.0% | 13.0% | 13.0% | 15.3% | 15.3% | 15.3% | 17.2% | 17.3% |
| Count | 2,796 | 3,678 | 4,335 | 5,221 | 7,513 | 9,581 | 11,039 | 11,430 | 14,856 | 18,324 |
| Visible minority subgroup | Type of appointment and count | 2013 to 2014 | 2014 to 2015 | 2015 to 2016 | 2016 to 2017 | 2017 to 2018 | 2018 to 2019 | 2019 to 2020 | 2020 to 2021 | 2021 to 2022 | 2022 to 2023 |
|---|---|---|---|---|---|---|---|---|---|---|---|
| Black | Non-advertised | 2.2% | 2.4% | 2.1% | 2.4% | 2.8% | 3.5% | 4.0% | 4.3% | 5.1% | 5.3% |
| Black | Advertised | 2.5% | 2.8% | 2.7% | 3.1% | 3.3% | 4.0% | 4.4% | 4.8% | 5.2% | 6.2% |
| Black | Count | 456 | 656 | 677 | 885 | 1,300 | 1,898 | 2,249 | 2,415 | 3,292 | 4,156 |
| Chinese | Non-advertised | 2.2% | 2.3% | 2.2% | 2.3% | 2.4% | 2.3% | 2.6% | 2.9% | 3.0% | 3.0% |
| Chinese | Advertised | 2.4% | 2.8% | 2.7% | 2.6% | 2.6% | 2.9% | 3.0% | 3.3% | 3.6% | 3.5% |
| Chinese | Count | 444 | 641 | 662 | 758 | 1,065 | 1,310 | 1,511 | 1,610 | 2,046 | 2,351 |
| Filipino | Non-advertised | 0.5% | 0.6% | 0.6% | 0.7% | 0.7% | 0.6% | 0.7% | 0.8% | 0.9% | 1.0% |
| Filipino | Advertised | 0.6% | 0.6% | 0.6% | 0.5% | 0.5% | 0.7% | 0.9% | 0.8% | 1.0% | 1.0% |
| Filipino | Count | 107 | 147 | 156 | 173 | 242 | 347 | 417 | 434 | 576 | 718 |
| Japanese | Non-advertised | * | * | * | * | 0.1% | 0.1% | 0.1% | 0.1% | 0.1% | 0.1% |
| Japanese | Advertised | * | * | * | * | 0.1% | 0.1% | 0.1% | 0.1% | 0.1% | 0.1% |
| Japanese | Count | * | * | * | * | 44 | 54 | 44 | 60 | 61 | 72 |
| Korean | Non-advertised | * | 0.1% | 0.3% | 0.2% | 0.2% | 0.2% | 0.3% | 0.3% | 0.4% | 0.4% |
| Korean | Advertised | * | 0.2% | 0.3% | 0.2% | 0.3% | 0.3% | 0.4% | 0.4% | 0.4% | 0.5% |
| Korean | Count | * | 43 | 71 | 56 | 103 | 133 | 169 | 196 | 256 | 331 |
| South Asian/East Indian | Non-advertised | 1.8% | 2.0% | 2.2% | 2.1% | 2.7% | 2.9% | 3.0% | 3.7% | 4.2% | 4.1% |
| South Asian/East Indian | Advertised | 2.8% | 2.9% | 2.7% | 2.8% | 2.8% | 3.3% | 4.0% | 4.2% | 4.7% | 5.5% |
| South Asian/East Indian | Count | 467 | 642 | 678 | 781 | 1,163 | 1,564 | 1,883 | 2,060 | 2,781 | 3,378 |
| Southeast Asian | Non-advertised | 0.5% | 0.6% | 0.7% | 0.5% | 0.7% | 0.8% | 0.9% | 0.9% | 1.0% | 1.0% |
| Southeast Asian | Advertised | 0.5% | 0.6% | 0.7% | 0.6% | 0.7% | 0.9% | 1.0% | 1.0% | 1.0% | 1.1% |
| Southeast Asian | Count | 97 | 148 | 181 | 168 | 288 | 420 | 493 | 496 | 629 | 748 |
| Non-white West Asian,North African or Arab | Non-advertised | 1.4% | 1.9% | 1.8% | 1.8% | 1.9% | 2.2% | 2.6% | 2.7% | 2.9% | 3.2% |
| Non-white West Asian,North African or Arab | Advertised | 1.9% | 1.7% | 1.8% | 2.0% | 2.1% | 2.5% | 2.7% | 2.5% | 2.7% | 3.4% |
| Non-white West Asian,North African or Arab | Count | 325 | 424 | 475 | 585 | 865 | 1,176 | 1,432 | 1,376 | 1,800 | 2,429 |
| Non-white Latin American | Non-advertised | 0.4% | 0.4% | 0.5% | 0.5% | 0.7% | 1.0% | 0.8% | 0.9% | 1.0% | 1.3% |
| Non-white Latin American | Advertised | 0.6% | 0.5% | 0.6% | 0.7% | 0.7% | 0.8% | 0.8% | 0.9% | 1.1% | 1.3% |
| Non-white Latin American | Count | 101 | 114 | 150 | 204 | 297 | 451 | 451 | 482 | 677 | 955 |
| Person of mixed origin | Non-advertised | 1.3% | 1.1% | 1.2% | 1.3% | 1.4% | 1.6% | 1.7% | 1.8% | 2.1% | 2.1% |
| Person of mixed origin | Advertised | 1.2% | 1.1% | 1.2% | 1.2% | 1.2% | 1.7% | 1.8% | 2.1% | 2.1% | 2.2% |
| Person of mixed origin | Count | 231 | 277 | 323 | 386 | 533 | 813 | 951 | 1,023 | 1,320 | 1,555 |
| Indigenous Peoples’ representation | 2013 to 2014 | 2014 to 2015 | 2015 to 2016 | 2016 to 2017 | 2017 to 2018 | 2018 to 2019 | 2019 to 2020 | 2020 to 2021 | 2021 to 2022 | 2022 to 2023 |
|---|---|---|---|---|---|---|---|---|---|---|
| Non-advertised | 5.0% | 4.7% | 5.2% | 5.0% | 5.1% | 5.4% | 4.9% | 4.5% | 5.1% | 5.3% |
| Advertised | 4.7% | 4.2% | 4.4% | 4.5% | 4.5% | 4.3% | 4.5% | 4.6% | 4.6% | 4.8% |
| WFA benchmark | 3.4% | 3.4% | 3.4% | 3.4% | 3.4% | 4.0% | 4.0% | 4.0% | 3.8% | 3.8% |
| Count | 906 | 1,073 | 1,218 | 1,416 | 1,986 | 2,402 | 2,528 | 2,416 | 3,142 | 3,791 |
| Persons with disabilities representation | 2013 to 2014 | 2014 to 2015 | 2015 to 2016 | 2016 to 2017 | 2017 to 2018 | 2018 to 2019 | 2019 to 2020 | 2020 to 2021 | 2021 to 2022 | 2022 to 2023 |
|---|---|---|---|---|---|---|---|---|---|---|
| Non-advertised | 4.4% | 4.4% | 4.3% | 3.8% | 4.1% | 4.2% | 4.3% | 4.6% | 5.7% | 6.8% |
| Advertised | 4.2% | 3.8% | 3.7% | 4.0% | 3.9% | 4.3% | 4.1% | 4.8% | 5.8% | 7.0% |
| WFA benchmark | 4.4% | 4.4% | 4.4% | 4.4% | 4.4% | 9.0% | 9.0% | 9.0% | 9.1% | 9.2% |
| Count | 804 | 971 | 1,016 | 1,205 | 1,672 | 2,120 | 2,255 | 2,474 | 3,650 | 5,052 |
Note: Due to confidentiality, data are suppressed for subgroups with fewer than 10 observations. Suppression is designated by an asterisk (*).
Note: The count row presents the sum of all non-advertised and advertised appointments.