Serving Canadians Better – Consultation Summary Report
October 10, 2019
Prepared for:
Canada Revenue Agency
Chief Service Officer
Prepared by:
Stantec Consulting Ltd.

This document entitled Serving Canadians Better was prepared by Stantec Consulting Ltd. ("Stantec") for the account of Canada Revenue Agency (the "Client"). Any reliance on this document by any third party is strictly prohibited. The material in it reflects Stantec's professional judgment in light of the scope, schedule and other limitations stated in the document and in the contract between Stantec and the Client. The opinions in the document are based on conditions and information existing at the time the document was published and do not take into account any subsequent changes. In preparing the document, Stantec did not verify information supplied to it by others. Any use which a third party makes of this document is the responsibility of such third party. Such third party agrees that Stantec shall not be responsible for costs or damages of any kind, if any, suffered by it or any other third party as a result of decisions made or actions taken based on this document.
Prepared by

Kaelin Koufogiannakis
Reviewed by

Michele Perret
Table of contents
- Executive Summary
- 1.0 Introduction
- 2.0 Consultation Design
- 3.0 What We Heard: Facilitated In-Person Sessions
- 4.0 What We Heard: Online Consultation
- 5.0 Next Steps
- Appendix A – Participant Demographics (In-Person Sessions)
- Appendix B – Summary of Participant Evaluations
- Appendix C – Online Consultation Design
Executive Summary
In line with its commitment to be a client-centric organization that is fair, trusted and helpful by putting people first, the Canada Revenue Agency (CRA)'s Chief Service Officer (CSO) led an integrated public and stakeholder consultation process after the 2019 tax season to receive input on different perspectives of the CRA and service experiences with the CRA.
Specifically, the CSO led a consultation process between April and June 2019 that included an online consultation and seven facilitated in-person sessions. The in-person sessions, which were held across Canada, included members of the general public and agencies, including NGOs, that support and advocate for vulnerable Canadians. Four in-person sessions were conducted in English, and three were conducted in French. A total of 142 people participated in the seven sessions, and a range of people identifying themselves as individual taxpayers, tax preparers/professionals, self-employed individuals, business owners, or "other" responded to each of the three subjects (service experiences, service improvements, and future direction) in the online consultation.
During the in-person sessions, attendees were asked:
- What does good service look like?
- How do we get there?
- What does success look like?
Attendees identified services offered by the CRA, such as My Account and Autofill my return, as positive changes and encouraged the CRA to continue providing these services. Current service issues that attendees commonly emphasized included call centre wait times, the need to make it easier to access and understand programs and resources that meet diverse needs, and a lack of information on dealing with scams and clarity of information.
Attendees characterized an ideal service relationship as including more personalized service with a broader variety of options for interacting with agents, more education and communication from the CRA and continuous opportunities to provide feedback. Having a partnership mentality, increased transparency, and empathetic attitudes were other key characteristics of an ideal service relationship. Attendees indicated that two years in the future, the CRA should have implemented more personalized, empathetic customer service with improved accessibility, better access to information, decreased wait times, and enhanced education for young people and newcomers. Online consultation respondents also noted the need for more consistency and accuracy in the information that CRA agents provide when assisting Canadians with their income tax and benefit returns.
The CRA also launched and promoted an online consultation which generated approximately 3,300 responses from Canadians.
This report includes an overview of the consultation program design and statistics, and what we heard from the facilitated in-person sessions and online consultation.
1.0 Introduction
1.1 Background
The CSO's mandate is to:
- Guide the development and transformation of CRA programs and services to improve the service experience of Canadians both from a functional and emotional perspective;
- Design CRA programs and services from a client's perspective and across the continuum of potential interactions—programs and channels; and
- Create service outcomes that uphold—and go beyond—what is outlined in the Taxpayers' Bill of Rights and proactively leverage the feedback CRA gets from clients in program and service design and delivery.
Stantec Consulting Ltd. (Stantec) was hired as a neutral, third-party facilitator to manage logistics, recruit participants for the facilitated sessions, collaborate with the CRA to finalize the facilitation guides, facilitate and take notes at the workshops, and write summaries of each workshop and a final summary of the consultation process. Stantec was also asked to summarize the online consultation data and was not involved in the design of the questions or the architecture of the online consultation.
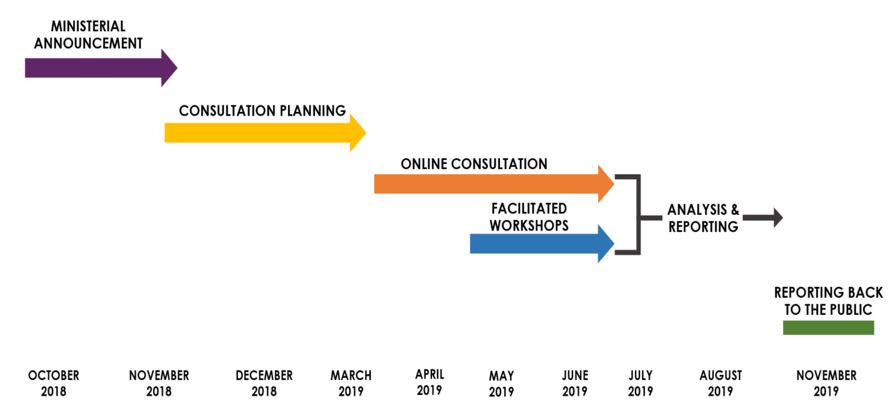
The consultation process occurred as follows:
Text description for consultation process details chart
- This is a timeline of the consultation process that dates from October 2018 until November 2019. The timeline is divided into 6 phases. The first phase is titled ministerial announcement, which is displayed as a purple arrow, starting from October 2018 until the beginning of November 2018. The second phase is titled consultation planning, which is displayed as a yellow arrow and begins at the end of November 2018 until the beginning of April 2019. The third phase is titled online consultation, which is displayed as an orange arrow from March 2019 until the end of June 2019. The fourth phase is titled in-person sessions, which is displayed as a blue arrow and starts at the end of April 2019 and ends in June 2019. The fifth phase is analysis and reporting, which is displayed as a black arrow and spans from July 2019 until the beginning of November 2019. Two black lines from the online consultation and in-person sessions come together to signify that the analysis and reporting comes from the results of both these phases. The sixth phase is reporting back to the public and is displayed as a solid green line over November 2019.
1.2 Objectives and Purpose
The purpose of the consultation was to listen to and learn from Canadians about their current service experience with the CRA and their expectations for the future to inform the CRA service transformation agenda over the next 2 years. The consultation process was limited to gathering input/feedback concerning service delivery issues and opportunities for improvement related to the mandate of the CRA. Specific objectives of the public consultation included:
- To inform the Canadian public about the CRA's current services, the current status of known service challenges and constraints, and the progress being made towards a people-focused CRA.
- To listen to and learn from Canadians about general challenges and opportunities they encounter when interacting with the CRA's people, products and services.
- To gain insight about clients' perceptions of the gaps between their current relationship with the CRA and their desired one.
- To identify and discuss what Canadians expect from the CRA, and what would signal to them that the CRA has changed its approach and is committed to improving service in a tangible way.
- To inform participants of how the CRA will use the feedback and offer opportunities to participate in future engagements.
The public consultation is a part of a robust and continuing effort (including ongoing public opinion research surveys and focus groups, an expert panel, design jams, and user experience testing) to hear from Canadians on how to improve their overall service experience.
Following each in-person consultation session participants were notified directly of the high-level findings discussed, which were also posted on CRA's online consultation platform Footnote 1. The CRA will share the consultation results with Canadians in Fall 2019. Feedback gathered from the public has been summarized in this report, to guide improvements to how the CRA designs and delivers services. The input received will assist CRA internal governance in making decisions regarding enhancements to service improvement over the short and long-term horizon of its transformation journey.
2.0 Consultation Design
From mid-April to mid-June 2019, the CRA conducted an online consultation on Canada.ca, and it held seven facilitated in-person sessions across Canada. The in-person sessions were designed for two audiences: the general public and the agencies that support vulnerable Canadians and advocate for them.
Section 3.1 summarizes the results of the in-person sessions, and Section 3.2 summarizes the results of the online consultation.
2.1 Facilitated In-Person Sessions
Seven facilitated in-person sessions were held between May and June 2019 in six cities: Halifax, Moncton, Montreal (2 sessions), Mississauga, Winnipeg and Vancouver. Four of the sessions were conducted in English and three in French. A total of 142 people participated in the seven sessions. The following summarizes the location, date, and attendance of the in-person sessions.
| Session Date | Session Location | Session Type | Session Language | Attendance |
|---|---|---|---|---|
| May 2, 2019 | Halifax, NS | General Public | English | 23 |
| May 9, 2019 | Mississauga, ON | General Public | English | 23 |
| May 16, 2019 | Vancouver, BC | Advocates | English | 15 |
| May 22, 2019 | Moncton, NB | General Public | French | 19 |
| May 27, 2019 | Montreal, QC | Advocates | French | 14 |
| May 27, 2019 | Montreal, QC | General Public | French | 23 |
| June 4, 2019 | Winnipeg, MB | General Public | English | 25 |
Various senior CRA leaders attended each session as part of the CRA's commitment for decision-makers to attend and receive feedback firsthand. The CSO attended all seven in-person sessions, while other sessions included the Commissioner of the CRA, the Minister of National Revenue, the Deputy Commissioner, or local CRA senior managers. Attendees at all sessions noted this representation from senior leaders positively and felt it showed their opinions were genuinely valued.
2.1.1 Session Strategy
The in-person sessions were designed to meet specific outcomes, summarized below.
| Session Outputs | Design |
|---|---|
| Receive input from regions across Canada | Host sessions in communities from coast to coast |
| Recruit participants from different walks of life to receive input that reflects a range of different service related experiences. | Host sessions in both official languages Recruit attendees based on diverse population demographics Create sessions targeting the general population Create sessions targeting advocates for vulnerable populations |
| Provide opportunities for different types of interactions at sessions. | Use multiple formats for conversations, including small and large group discussions, presentation of information by CRA representatives, ice breaker, and Q&A with representatives from CSO and other CRA program areas |
| Incentivize and help remove common barriers to participation | Offer honoraria to:
Host sessions at accessible locations and times (daytime for advocates, evenings for general public) Provide meals for session attendees |
2.1.2 Session Recruitment
The public session attendees were recruited by a third party using a telephone survey to screen participants and generate a diverse cross-section of Canadian taxpayers in terms of age, gender, and economic status. There was no demographic quota used in selecting these participants; however, the selection criteria demonstrated an effort to recruit a diverse mix of Canadians. Graphs capturing participant demographics collectively across all sessions are included in the Appendix A. The criteria sought to recruit individuals was based on:
- A recent interaction with the CRA (different channels considered)
- Varying levels of income
- Age category
- Employment status
- Sector of the economy (if employed)
- Household size and number of dependents
- Level of education
- Racial/Cultural Identity
- Gender
Participants also had to meet the following standards:
- Canadian citizen, 18 years or older
- Has contacted or been contacted by the CRA in the past 12 months or logged into the CRA's My Account in the past 12 months
- Has not been involved in CRA focus groups in the past six months or has not participated in more than four CRA focus groups in the past five years
- Not employed in a related industry (for example, H&R Block)
The advocacy session attendees were recruited from organizations in Montreal and Vancouver that assist vulnerable members of the community with their taxes or help them qualify for social programs that rely on tax filings. The CRA sought to recruit advocates representing the following groups of Canadians:
- Seniors
- Newcomers
- Persons with disabilities
- Modest income Canadians
- Youth and students
- Refugees
- Housing insecure individuals
The identities of participants were kept anonymous to create a comfortable and safe environment that would encourage them to speak without the fear of judgement or consequence.
2.1.3 Session Logistics
The in-person sessions for the general public consisted of three English-language sessions (Halifax, Mississauga, and Winnipeg) and two French-language sessions (Moncton and Montreal). The sessions took place from 6 pm to 9 pm, which was intended to be outside the working hours of most Canadians.
Two sessions were held for advocates for vulnerable populations: a French session in Montreal and an English session in Vancouver. Both advocate sessions took place in the morning so that representatives could attend as part of their workday.
Details on session locations, dates and attendance can be found in Section 3.1.
2.1.4 Session Structure
In-person sessions lasted approximately 3 hours and opened with the Stantec facilitator welcoming the group, providing an Indigenous traditional territory acknowledgement, a safety review and an overview of the meeting's purpose and agenda. The CSO presented information on her role and the consultation's purpose, and she outlined service improvements undertaken since 2015. Stantec or CRA note takers documented the feedback in small groups. The Stantec facilitator documented feedback shared during the whole group report back following small group discussions.
Discussions with participants were divided into three topics:
- What does good service look like?
- How do we get there?
- What does success look like?
Supporting questions related to each topic were included in the both the small-and large-group facilitated discussions.
The same questions were asked during the public and advocate sessions and the English and French sessions. Note takers recorded information discussed in the groups or posted on flipcharts. Section 5 summarizes the themes from these in-person sessions.
Online Consultation
The CRA ran an online consultation with the general public using its online engagement tool, CRA Engage – What we heard, from April 23 to June 18, 2019. It posed questions on three subjects: service experience, service improvements, and future direction. There were three separate questionnaires, one for each subject. Each subject contained multiple choice and open-ended questions, which were designed to allow the participants to quickly navigate through them. The online consultation was available in French and English, and the results from both languages were pooled together for analysis.
Stantec was tasked with analyzing and summarizing the online consultation data and was not involved in the design of online consultation questions or its architecture. A summarized analysis of the online consultation responses provided to Stantec is included in Section 6.0.
The following table summarizes the number of respondents who completed each questionnaire.
| Consultation Subject | Total Submissions |
|---|---|
| Service Experience | 1,502 |
| Service Improvements | 1,483 |
| Future Direction | 362 |
| Total | 3,347 |
3.0 What We Heard: Facilitated In-Person
Attendees at the in-person sessions provided feedback on three main topics.
Topic 1: What does good service look like?
- Question 1A – What do you want the CRA to keep doing?
- Question 1B – What do you want the CRA to change?
Topic 2: How do we get there? Our service journey into the future.
- Question 2A – What does an ideal service relationship with the CRA look like?
Topic 3: What does success look like?
- Question 3A – Describe characteristics of a good service relationship.
- Question 3B – Two years in the future, what tangible things has the CRA done to continue showing its commitment and shift in approach?
Sections 3.1 to 3.3 summarize the themes that arose from attendees' discussion of each topic. Themes were generated based on repeated comments or discussion topics that could be grouped together. In general, similar themes were reflected in the English and French sessions. The advocate sessions included discussions of services specific to the work done by their organizations: these themes are included in the summary below.
3.1 Topic 1: What does good service look like?
Attendees were asked about what the CRA should keep doing and what should be changed.
3.1.1 Question 1A – What do you want the CRA to keep doing?
Theme A) Continue helpful service improvements.
Attendees at every session welcomed the improvements that have streamlined their ability to interact with the CRA, including Autofill my return, the call centres' new callback feature, and My Account. The attendees who had used Autofill my return mentioned it shortened the time it took to complete their tax returns. Attendees positively viewed My Account features such as using a secure partner to access the service, viewing information from previous tax years, comparing returns and taxes owed, and receiving email notifications about online mail from the CRA. Occasional reference was made to the high level of security in online services, which was viewed positively.
Theme B) Call centre agents are knowledgeable and professional.
At six of the sessions, attendees commented that they have had positive experiences with call centre agents and that they found the agents able to provide good answers to their questions and professional in their interactions. This included providing information on unique tax situations and commonly asked questions, directing callers to additional resources on the website, and helping them access My Account.
Theme C) Continue website design improvements that enhance access to information.
Attendees at five sessions described the CRA's web content on Canada.ca positively, with comments that it looks modern and is easier to navigate than other government websites. They generally indicated that the CRA's web pages provide answers to most questions, if the correct search terms are used. However, some attendees identified difficulties finding the information they were looking for and suggested there is room for improvement in the search engine and in creating a menu that gives easy access to frequently requested pages.
Theme D) The volunteer help line and outreach program are valuable resources for advocates.
In the advocate sessions, a common theme was the value of the CVITP help line and the outreach program. Attendees positively viewed the availability of outreach officers for in-person visits and outreach programs like orientation sessions, training for volunteers, webinars and access to resources. The ability of advocates to submit Form T1013, Authorizing or Cancelling a Representative, online and receive instant access to clients' tax information was also noted as a useful feature.
3.1.2 Question 1B – What do you want the CRA to change?
Note: Attendees provided many suggestions for changes that the CRA could make, but it is worth noting that some suggested features already exist. This suggests a lack of awareness of what is already offered, indicating that further information and outreach on existing programs may be required.
Theme A) Make it easier for diverse Canadians to access and understand programs and resources that meet their needs.
Attendees at nearly every session, including both advocate sessions, mentioned the need for the CRA to provide better accessibility for Canada's increasingly diverse population, and they identified access and support barriers for seniors and newcomers. These barriers include language, fear of government agencies, fear of scammers, lack of education on tax processes, and having to call multiple departments to get answers. Advocates also expressed that, because many of their clients have not been in Canada for long or do not have a fixed address, it can be difficult to provide the types of personal information the CRA requires.
The technical language of CRA web content can also be a significant barrier to understanding for both established Canadians and newcomers. Opportunities to improve accessibility include providing services and documents in frequently used languages other than English and French (for example, Mandarin, Punjabi, Arabic, Hindi, or Spanish), using less technical language for online information, using new technologies to assist people with visual and hearing impairments, and providing service options for seniors who prefer not to go online.
Some attendees in the advocate sessions also indicated that raising the income threshold to qualify for the Community Volunteer Income Tax Program (CVITP) would let more people get help, including many of the working poor who do not currently qualify.
Some attendees at the Montreal session suggested that volunteer organizations should be able to receive an official accreditation with the CRA to ensure a standard of quality and ongoing services.
Theme B) Implement more upgrades and updates to technology.
At every session, attendees discussed their appreciation for the technological improvements that the CRA has made in recent years and asked for these improvements to continue. A frequent suggestion was allow online chats (also known as live chats) on My Account for specific information and on Canada.ca for general inquiries.
While attendees felt that My Account has been a great innovation, many noted it has room to grow and evolve into a more useful tool. Suggestions included letting taxpayers upload documents on My Account and create accounts or reset passwords without having to contact the call centre, as well as creating an app they can use on mobile devices.
With respect to Autofill my return, some attendees brought up problems that need to be fixed. For example, in Quebec, users have to manually input the provincial forms after the federal forms have been autofilled. And, although this online tool is widely appreciated, some attendees also thought there should be an option to file by phone.
Some attendees at advocate sessions mentioned issues with the computers that the CRA provides to volunteers, and how this technology should be upgraded to better serve client needs.
Theme C) Call centre wait times and hours need to improve, and there should be options for in-person services.
A common theme among attendees at all sessions was frustration with wait times for call centres. Long wait times were identified as a significant barrier to service, particularly due to the limited call centre hours. Attendees indicated that their calls were sometimes dropped while on hold.
There appeared to be a misunderstanding among some participants concerning the availability of a callback feature at the CRA. Although not yet implemented, some expressed a desire for this feature or looked forward to using it in the future to reduce how much time they spend on hold Footnote 2.
In addition, although a feature indicating how long callers can expect to remain on hold is currently available for both individual and business related enquiries attendees said that the CRA should tell people expected wait times Footnote 3 and better communicate the hours that the call centre is open.
Attendees at all sessions indicated a desire for in-person services with opportunities for face-to-face interaction with the CRA, to reduce the time it would take to receive services.
With respect to the CVITP volunteer help line, advocates expressed some frustration that they cannot access it after April 30, which is the end of tax season. The long wait times for the volunteer help line also posed challenges, particularly for clients who want to authorize an advocate. Often clients cannot stay with the advocate for the time is takes to connect to an agent and provide authorization.
Other consequences of long wait times include additional stress, the cascading effects on access to other services like employment insurance, and reduced windows of time to pay the CRA by the tax deadline.
Theme D) Provide better communication through a broader variety of channels.
Traditional media, television advertisements, and website resources were identified as communication channels that the CRA could use to improve its public relations and ensure that information reaches all Canadians. Better communication should be provided in a publicity campaign using a variety of channels.
Communication was also discussed in the context of My Account. Attendees discussed how My Account could be more user friendly if the CRA provided notifications about important dates and service updates and scams and let clients track information, such as if the CRA has received their documents and confirm progress on files.
Theme E) Pay more attention to security and combatting scams and proactive communications.
Attendees at all sessions indicated that they had been contacted by a person or organization impersonating the CRA and, as a result, were cautious when responding to any communication that appeared to be from the CRA. They stated that more education on how to confirm you are communicating with the real CRA is necessary, as well as ways to deal with suspected scams.
Although already in place, one attendee suggested integrating standard security practices used in the commercial sector, such as two-factor authentication.
3.1.3 Current Rating of Satisfaction
Attendees were asked to rate their level of service in the current relationship they have with the CRA on a scale of 1 to 10, with 1 meaning "significant room for improvement" and 10 meaning "I'm amazingly satisfied." The average response across all sessions was 6.7. Topic 2 discusses how the CRA can move the relationship towards being a 10.

Text description for satisfaction rating graph
- This graph is a bar chart that shows satisfaction rating that attendees have with their current relationship with the CRA. This chart is into ratings from 1 to 10. Of 142 respondents, the percentage that selected a rating of 1 is 0.7 percent, 0 percent selected 2, 1.4 percent selected 3, 3.5 percent selected 4, 10.5 percent selected 5, 23.8 percent selected 6, 34.3 percent selected 7, 20.3 percent selected 8, 5.6 percent selected 9, and 0 percent selected 10.
3.2 Topic 2: How do we get there? Our service journey into the future.
Attendees were asked to discuss their ideal service relationship with the CRA.
3.2.1 Question 2A – What does an ideal service relationship with the CRA look like?
Theme A) More education and communication on the CRA, taxes and program updates.
Attendees consistently expressed a desire to receive more information from the CRA on things like changes to the filing process, steps for signing up for services, and answers to common questions. Some attendees expressed a lack of awareness of new features, and many indicated they do not do their taxes themselves because they are not confident in their ability to do so correctly or they do not trust the Autofill my return feature. More education and proactive communication about tax-filing features and program updates, as well as resources like online tutorials, would enhance the service relationship with the CRA.
Further, the CRA would benefit from increasing communications about its mandate and how taxes are used to support society, as well as demonstrating it is working to improve taxpayer experiences.
Theme B) More options for interacting with agents.
Opportunities to interact with agents in a wider variety of ways was identified as key to service excellence at all sessions. Suggestions included online chats (also known as live chats), setting a time for a telephone meeting, assigning a case worker and file number for ongoing or complex issues, and creating opportunities for in-person interactions, such as kiosks in malls.
Attendees at the session in Moncton emphasized a desire to have bilingual agents who could speak with them in regional dialects like le chiac, rather than having to choose English or French.
Theme C) Make it a personalized experience.
Attendees at all sessions identified a more personalized and tailored experience as key to service excellence. Many expressed frustration with the need to reconfirm their identity several times when being transferred between agents at the call centre or having to repeatedly call for follow-up on ongoing or complex issues. The elements suggested for a personalized experience included being addressed by name, avoiding "transactional" interactions, and the need for the CRA to value clients' time more highly. The service provided by banks was often cited as a good example due to the personal experiences, and ability to speak to an agent in person.
Theme D) Agents work as case managers.
In nearly all sessions, service excellence was associated with the idea of agents working as case managers to taxpayers. This was suggested as a means of building a relationship between a taxpayer and agent, which would allow for continuity in interactions over time and increased personalization. For example, agents may provide helpful suggestions to clients such as tax credits and benefit eligibility, and can help them navigate the CRA system when there is an issue. One attendee discussed a positive interaction in the past where an agent called her to discuss deductions she had missed in filing her taxes. The attendee indicated this service model would be welcome.
The idea of agents acting as case managers also includes specialization for people in particular situations, such as seniors, first-time filers, those who have had a change in life situation such as a divorce, people with disabilities, and members of vulnerable populations.
There was frustration with the red tape for qualifying for assistance programs and the lack of clarity about what information is needed to qualify for assistance. Some attendees discussed how agents should act to lower these barriers and help people who need assistance to access services.
Theme E) Interaction and information throughout the year.
In three sessions, attendees discussed the desire to have interaction and information throughout the year, rather than just at tax time. Advocates mentioned this in the context of having limited access to services after the filing period.
Some attendees said it would be useful to receive updates throughout the year about relevant tax bracket information, such as an update when their tax bracket changes and how it might be impacted by working multiple jobs or on a commission based salary. These participants noted that Canadians employed under these kinds of work arrangements may benefit from receiving updates on their current account status for tax payments and contributions to registered accounts such as RRSPs and TFSAs.
Theme F) Integration among levels of government and government departments.
Issues with a lack of coordination among levels of government and government departments were identified by attendees at three sessions as a significant barrier to efficient, successful outcomes. When a client is transferred to a new agent or department within the CRA, it should be a seamless transfer, and the new agent should have access to all relevant information, such as recent conversation notes and case history, without needing to verify the client's identity. For example, attendees noted that errors in personal information are complicated to correct and require contacting many different departments.
Another suggestion put forward to improve integration was the harmonization of processes and terminology between provincial, territorial and federal governments.
Theme G) Balance response timelines for the CRA and taxpayers.
Attendees at three sessions noted that the CRA should make available a better system for communicating timelines such as deadlines for information requests and estimates for response times. A key element of this theme was the need for balance between the CRA's deadlines for taxpayers to respond to its requests and the time it takes the CRA to respond to taxpayers' requests. At present, the CRA often gives short deadlines for taxpayers but does not set any deadlines for itself to acknowledge or respond to taxpayers. This was viewed as unfair.
Theme H) Provide opportunities to give feedback to the CRA.
The ability for taxpayers to give the CRA feedback after an interaction were identified by attendees at four sessions as important to continually improving service. For example, filling out a satisfaction survey after a call centre interaction would help to improve service over time.
3.3 Topic 3: What does success look like?
Session participants were asked to describe characteristics of a good service relationship, based on their experiences so far with the CRA and other service-based organizations.
Following the discussion of these characteristics, attendees were asked to suggest tangible indicators of service excellence and improvement that the CRA could demonstrate within two years.
3.3.1 Question 3A – Describe characteristics of a good service relationship.
Theme A) Partnership mentality
Developing a relationship with taxpayers that is more like a partnership was seen by attendees at four sessions as an important way to drive more accurate tax filing and more amiable interactions between the CRA and taxpayers. The CRA should be a partner working with Canadians, rather than against them.
Attendees at advocate sessions added that the CRA should work to break down barriers such as language, fear of government agencies, fear of scammers, lack of education on tax processes, and should improve access to existing programs and benefits wherever possible.
Theme B) Transparency and Being Proactive
Attendees at four sessions indicated that the CRA should work towards increased levels of transparency. It should help Canadians to better understand the tax process, the length of the process and estimated timelines, and why certain information is required. The need for transparency also applies to communicating openly about what the CRA does and how the organization is changing for the better, which will help to build trust with Canadians. Attendees at five sessions emphasized the proactive role the CRA should have in educating Canadians on financial literacy and how the tax system works, reaching out to discuss potential deductions, and communicating upcoming changes.
Theme C) Empathy
At four sessions, attendees stated that empathy is key for service excellence, particularly in tax filing, as most tax filers are trying to do the right things but sometimes make mistakes during the complicated process. Working with clients to help them navigate the process and having empathy for unique, complex situations will help the CRA enhance a sense of partnership. Attendees at advocate sessions emphasized the importance of empathy, as many members of the vulnerable population are afraid of the government and the CRA. A variety of factors can contribute to this fear, for example, problems resulting from mental illness or experiences with police in other countries. Providing training for call centre agents in how to interact with empathy and awareness of diverse backgrounds was suggested.
Theme D) Security
With the recent prevalence of CRA-related scams, some attendees expressed distrust and uneasiness when dealing with the CRA. Having security systems in place and releasing information about combatting scams will help to build a foundation of trust.
Theme E) Flexibility
Flexibility was emphasized by attendees at three sessions. They stated that it is important to avoid ‘one size fits all' solutions to problems, as Canadians are all different and need help in different ways. This means the access to help should be offered in different ways too—in person, by telephone, online, and in print. Flexible ways to access service, such as hours outside of the workday, could contribute to better service outcomes, in addition to more agents working at peak times.
An element of flexibility raised by advocates was having more forgiveness on small tax amounts owing, such as those under $100.The effort involved in recovering these sums from vulnerable populations seems unfair to many.
3.3.2 Question 3B – Two years in the future, what tangible things has the CRA done to continue showing its commitment and shift in approach?
Theme A) More personalized customer service.
As discussed by attendees at all sessions, service excellence is primarily defined by personalized customer service. One particular action the CRA could take to achieve this, suggested by attendees many times, would be to assign a case worker and file number for individuals with a complex and ongoing issue. Creating a relationship between agents and clients would allow for more personal interaction and give agents a better understanding of the situation. It would also reduce processing times for clients by avoiding the need start at the beginning each time a client phones the CRA.
Another element of personalized customer service that was suggested several times would be to have dedicated specialized services for certain groups, like first-time filers, seniors, newcomers, and students, which may include dedicated call centres for each.
Theme B) Improved accessibility.
Opportunities for improved accessibility was a theme mentioned by attendees at all sessions. Suggestions included:
- longer call centre hours, more languages of service;
- more options of interaction;
- access to agents with specialized experience for certain situations; and
- more ways for seniors and newcomers to access CRA services.
One method to do so which was discussed at all sessions was access to in-person services, such as kiosks in malls or dedicated CRA service centres.
Attendees at advocate sessions indicated that technological innovations for volunteers in general could significantly improve accessibility. Their suggestions included video conferencing to establish identity, allowing users to upload more documents or access information online, and the ability to chat online (also known as live chats).
Theme C) Better access to information.
Suggestions on increasing access to information, which is a theme raised at five sessions, included creating more obvious links to online resources for help with tax filing and making sure call centre staff are consistently trained and helpful. Other suggestions were to provide online chats (also known as live chats) and tutorials, tailor tax guides for different types of taxpayers (such as first-time filers, seniors, newcomers, and students), and create a guide on how to file taxes for those recently deceased.
Information should also be provided about identifying scams and what to do about them, as well as how to know that you are communicating with the real CRA.
Theme D) Decreased processing times and call centre wait times.
Decreasing processing times and call centre wait times was emphasized by attendees at all sessions. Various changes, such as a wider variety of ways to interact with agents, extended call centre hours, and more opportunities for self-service online, were identified as key to achieving this goal. Attendees at advocate sessions indicated the impact of decreased call centre wait times, as a long wait time is a barrier to filing for many members of vulnerable populations.
Theme E) Increased education for young people and newcomers.
In five sessions, the CRA was identified as having a role to play in educating young Canadians and newcomers on how to file taxes correctly and how to access other services, such as My Account. This role could take the form of tailored tax guides, online webinars, or courses taught in schools. Some attendees indicated that education about filing taxes typically occurs at home from parents or other family members, but more standardized and broadly taught information should be incorporated into school curriculums to ensure that young Canadians are well equipped to file taxes as adults.
Theme F) Implementation of pre-filled forms to be verified by taxpayers.
At three sessions, the idea was put forward to elevate Autofill my return so that Canadians are essentially confirming their taxes instead of doing them. Attendees discussed current examples from countries where the government produces a declaration that each taxpayer validates rather than filling their own out return.
Theme G) Ongoing engagement with Canadians on service levels.
There was a desire at five sessions for more ongoing consultation with Canadians on how the CRA can continue to evolve. As part of a service mentality, listening to ‘customer' feedback is instrumental. The ability for taxpayers to offer quick feedback after each interaction with the CRA can contribute to continually improving service and finding opportunities for growth.
There was also interest in seeing the results of these consultations and learning about the changes that the CRA will make based on the feedback.
3.4 Session Evaluation
Each of the seven in-person sessions closed with participants completing a session evaluation, in the language of the session. A full summary of the session evaluations can be found in the Appendix B.
Overall, evaluations from participants at every session were positive, with the majority of attendees indicating that they "Strongly Agree" or "Somewhat Agree" with each of the evaluation statements. "Strongly Agree" and "Somewhat Agree" are used to measure overall agreement.
In particular, session evaluations across general population and advocate sessions found that:
- The vast majority of advocates (97%) and virtually all participants from the general population (100%) agreed the session was facilitated in a way that promoted open dialogue. Due to rounding, some figures may add up to more than 100%.
- The vast majority of participants (97%), from both the general population and advocates sessions respectively, agreed that they felt welcome and respected during consultation sessions.
- In general, both general population (83%) and advocate participants (93%) expressed a relatively high degree of confidence in the CRA's overall ability and commitment to improve services. Despite this, some participants from the general population (3%) and one in ten advocate participants said they lacked confidence in this regard.
- Approximately one in ten participants from both the general population (9%) and advocate sessions said they did not understand how their input would be used to influence service transformation initiatives at the CRA.
What We Heard: Online Consultation
4.1 Methodology
Providing participants with the flexibility to provide feedback on topics that relate to their interests is a best practice in public engagement and consultation. Each questionnaire was created as a stand-alone, as opposed to collective and linear experience, so that participants could complete questionnaires they felt were applicable. As a result, the completion rates for each questionnaire varied widely. The online consultation consisted of three questionnaires, each focusing on a core area of the service relationship: service experiences, service improvements or future direction. The quantitative data was compiled and analyzed, and the qualitative comments were reviewed and grouped together into themes in a similar method as the facilitated sessions.
The CRA promoted the online consultations through a series of press releases, correspondence to agency stakeholders, and social media posts issued during the consultation period. The promotional efforts used generated approximately 3,300 responses from Canadians. Session attendees were also given reminder cards, with information on the online consultation and the link to the web page, to take home and distribute, and were sent follow-up emails thanking them for their involvement and encouraging them to share the online consultation. Finally, CRA Outreach Officers were provided these products to share during ongoing outreach events and initiatives, and posters and reminder cards promoting the online consultations were available for stakeholders to distribute to their constituencies.
The online consultation allowed for greater participation in the overall project from a broader segment of the Canadian population.
There was no attempt to create a statistically significant level of responses based on geography or other demographic information during the promotion and recruitment for online participation.
4.2 Service Experience
The online questionnaire about service experience asked respondents for information about themselves as well as their interactions with the CRA. The interaction types were not specified and could have been associated with a variety of tax-related issues.
4.2.1 Participant demographics
The demographics shown here apply only to the respondents who completed the service experience questionnaire. The other two online questionnaires did not ask a similar question.
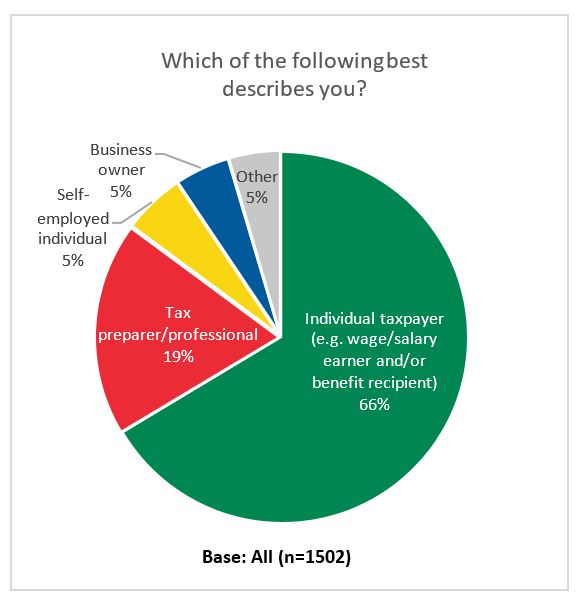
In this multiple choice question, the majority of respondents (66%) described themselves as an individual taxpayer (e.g. wage/salary earner and/or benefit recipient.) The 5% of respondents who listed themselves as "Other" included representatives from charitable and non-profit organizations, estate executors, and non- residents. It is possible that some respondents who identified themselves as tax preparers/professionals also fit into the individual taxpayer or self-employed/business owner categories.
Text description for participant demographics graph
- This graph is a pie chart shows the results of multiple-choice questions where respondents were asked to identify the demographic that best describes. The chart is divided into 5 parts. The green wedge titled individual taxpayer (e.g. wage/salary earner and/or benefit recipient) is 66 percent. The red wedge titled tax preparer/professional is 19 percent. The yellow wedge titled self-employed individual is 5 percent. The blue wedge titled business owner is 5 percent. The gray wedge titled other is 5 percent. 1502 respondents answered this question.
4.2.2 Interaction within the Last 12 Months
Text description for Interaction within the last 12 months graph
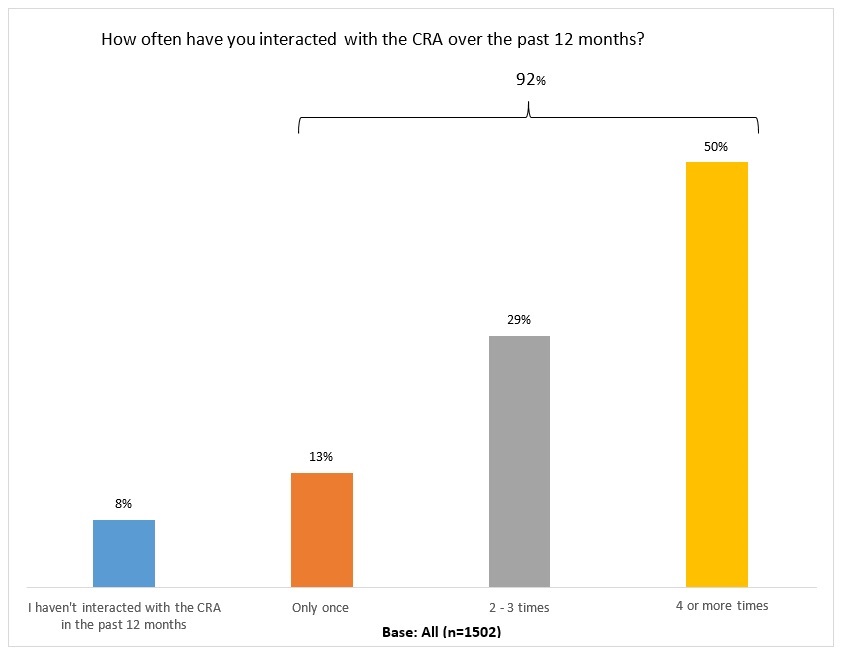
- This graph is a bar chart that shows how often respondents interacted with the CRA over the past 12 months. The chart is divided into 4 parts; the first bar is “I haven’t interacted with the CRA in the past 12 months” and has a value of 8 percent. The second bar is “Only once” and has a value of 13 percent. The third bar is “2-3 times” and has a value of 29 percent. The fourth bar is “4 or more times” and has a value of 50 percent. There is a black line over bar two, three and four, to signify that 92 percent of respondents had at least one interaction with the CRA. 1502 respondents answered this question.
Of the respondents, 92% had at least one or more interactions with the CRA in the past 12 months, while 8% reported they hadn't interacted with the CRA during this time.
4.2.3 Meeting the Needs of Canadians
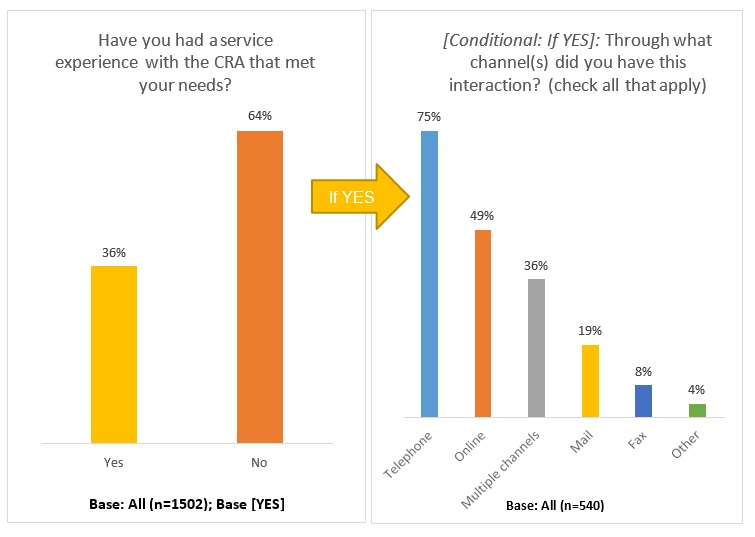
The remaining questions in the service experience questionnaire were a series of related questions on service experience. Respondents were first asked whether their interactions with the CRA had met their needs or not, through which channels these interactions had taken place, their level satisfaction with these interactions, and what worked well and what needed improvement. When asked whether they had a service experience with the CRA that met their needs, approximately 1/3 (36%) felt they had, with 75% of those interactions occurring over the telephone and 49% occurring online. Respondents were allowed to choose more than one interaction channel.
-
Text description for Service experience for needs met graph
- This graph is a bar chart that shows the percentage of respondents that have had a service experience with the CRA that met their needs. The yes bar is 36 percent and the no bar is 64 percent. 1502 respondents answered this question.
- Conditional to respondents selecting the answer yes, there is another chart on the right hand side that asks respondents through what channel(s) they had this interaction. The second chart is divided into 6 parts. The telephone bar is blue and is 75 percent, the online bar is orange and is 49 percent, the multiple channels bar is gray and is 36 percent, the mail bar is yellow and is 19 percent, the fax bar is dark blue and is 8 percent, the other bar is green and is 4 percent. 540 respondents answered this question.
Respondents were asked how they would rate the interaction that met their needs, on a scale of 1 (poor – shown in the below graph in red) to 10 (excellent – shown in the below graph in green). These interactions were ranked as positive, with 43% rating their experience as an 8 out of 10 or higher, and 60% ranking their experience as a 7 out of 10 or higher.
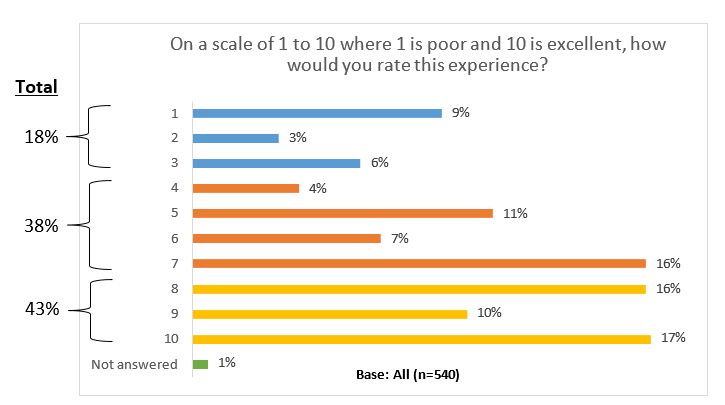
Text description for Service experience rating from 1 to 10 for needs met graph
- This graph is a line chart that shows results of a multiple-choice question where respondents were asked to rate their experience from the previous question. This chart is divided into 11 parts; the scale ranges from 1, meaning poor, to 10, meaning excellent, with an additional option not to answer. Line 1 is 9 percent, line 2 is 3 percent, line 3 is 6 percent, line 4 is 4 percent, line 5 is 11 percent, line 6 is 7 percent, line 7 is 16 percent, line 8 is 16 percent, line 9 is 10 percent, line 10 is 17 percent, and line not answered is 1 percent. Parts 1 to 3 are blue and make up 18 percent, parts 4 to 7 are orange and make up 38 percent, parts 8 to 10 are yellow and make up 43 percent, and not answered is green. 540 respondents answered this question.
Respondents provided feedback on the positive attributes of these interactions and suggested ways in which the CRA could improve their rating. Some examples of the latter were to provide personalized and proactive service, improve client interactions, and provide information and education.
Recognizing respondents may have had more than one experience with the CRA, they were also asked whether they had had an experience that did not meet their needs. Approximately four in five (83%) of respondents said yes, with over eight in ten (84%) of those interactions occurring over the telephone. The remaining 16% of respondents said "No" and 1% of respondents did not answer the question.
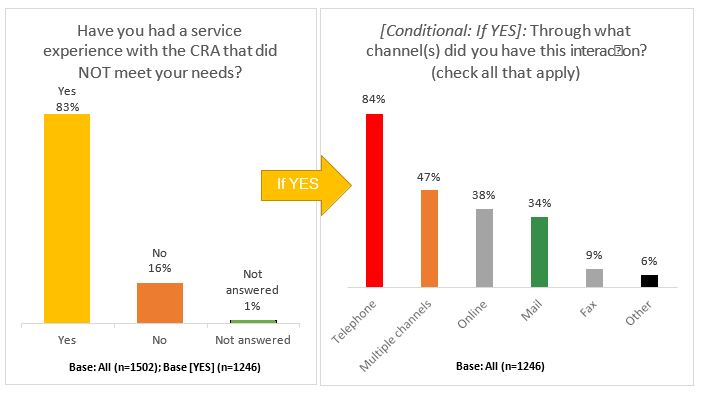
Text description for Service experience for needs not met graph
- This graph is a bar chart that shows the percentage of respondents that have had a service experience with the CRA that did not meet their needs. The chart is divided into 3 parts; The yes bar is 83 percent, the no bar is 16 percent and the not answered bar is 1 percent. 1502 respondents answered this question.
- Conditional to respondents selecting the answer yes, there is another chart on the right hand side that asks respondents through what channel(s) they had this interaction. The chart is divided into 6 parts. The telephone bar is red and is 84 percent, the multiple channels bar is orange and is 47 percent, the online bar is gray and is 38 percent, the mail bar is green and is 34 percent, the fax bar is also gray and is 9 percent, the other bar is black and is 6 percent. 1246 respondents answered this question.
Of the respondents who answered yes to this question, a total of 84% of respondents ranked their interactions as "poor" between 1 and 3.
For both questions about service experience, the majority of interactions reported were over the telephone. The results are summarized in the following graphs. Due to rounding the figures below add up to less than 100%.
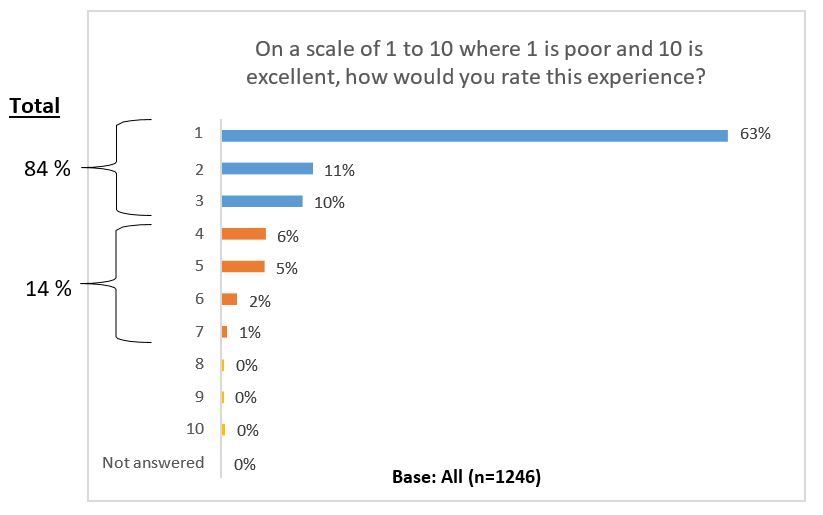
Text description for Service experience ratings from 1 to 10 for needs not met graph
- This graph is a line chart that shows results of a multiple-choice question where respondents were asked to rate their experience from the previous question. This chart is divided into 11 parts; the scale ranges from 1, meaning poor, to 10, meaning excellent, with an additional option not to answer. Line 1 is 63 percent, line 2 is 11 percent, line 3 is 10 percent, line 4 is 6 percent, line 5 is 5 percent, line 6 is 2 percent, line 7 is 1 percent, line 8 is 0 percent, line 9 is 0 percent, line 10 is 0 percent, and line not answered is 0 percent. Part 1 to 3 are blue and make up 84 percent, parts 4 to 7 are orange and make up 14 percent, parts 8 to 10 are yellow and not answered is green. 1246 respondents answered this question.
4.2.4 Open Responses
As part of the evaluation of service experience, respondents were asked open ended questions to describe what went well in the interactions that met their needs, what didn't go well in the interactions that did not meet their needs, and what needed improvement to reach a rating of 10 (excellent) in service experience.
Themes identified in the following sections (listed in order of frequency) include common responses to each question, examples of responses Footnote 4, and graphs showing what proportion of respondents discussed each theme in their feedback. Note that percentages do not add up to 100 because some responses were applicable to multiple themes, while other responses were not relevant Footnote 5.
4.2.4.1 What Went Well
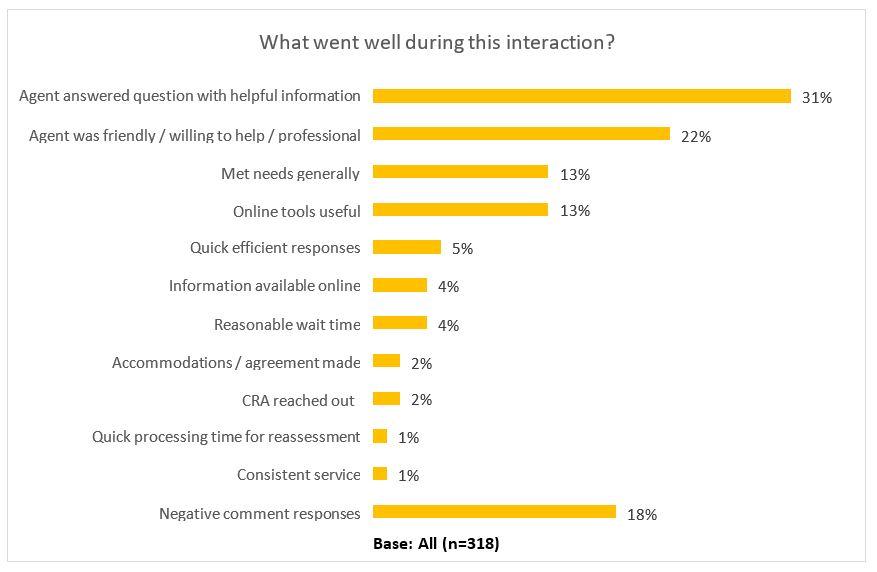
Text description for What Went Well graph
- This graph is a line chart that shows the results of a multiple-choice question where respondents were asked what went well with their previous interaction that met their needs. This chart is divided into 12 parts. The first line is titled agent answered question with helpful information and is 31 percent. The second line is titled agent was friendly/ willing to help/professional and is 22 percent. The third line is titled met needs generally and is 13 percent. The fourth line is titled online tools useful and is 13 percent. The fifth line is titled quick efficient responses and is 5 percent. The sixth line is titled information available online and is 4 percent. The seventh line is titled reasonable wait time and is 4 percent. The eighth line is titled accommodations/agreement made and is 2 percent. The ninth line is titled CRA reached out and is 2 percent. The tenth line is titled quick processing time for reassessment and is 1 percent. The eleventh line is consistent serve and is 1 percent. The twelfth line is negative comment responses and is 18 percent. 318 respondents answered this question.
318 online consultation respondents answered the question "What went well during this interaction?" after indicating that they had had an interaction that met their needs. Each theme identified in the graph is expanded upon below.
Theme A) Agent answered question with helpful information
About one third of respondents (31%) indicated that their needs were met because a CRA agent provided helpful information to their question or situation. Respondents were particularly satisfied with agents who were knowledgeable, took the time to guide them through their issue, and provided clear, direct answers. Some respondent quotes exemplifying this are as follows:
- "Every time I have had to call in to CRA over the past several years I have reached a great person. They give you a chance to explain your concerns or questions and then reply in a calm and informative manner."
- "Called CRA for questions as young first time file. Was able to get helpful answers to my questions and make me easier to complete my return."
However, some respondents had less enthusiastic statements like "some associates were very knowledgeable" or "I got lucky and had someone who knew what they were doing", indicating that helpful service was not always consistent among all agents.
Theme B) Agent was friendly / willing to help / professional
According to 22% of respondents, the character of agents contributed to positive experiences with the CRA for many callers. Respondents praised agents who were friendly, courteous, polite, cheerful, empathetic, respectful, and took extra time and effort to help. It was also appreciated when an agent would transfer to a senior agent if necessary, rather than dropping the call. Some examples of these responses are:
- "She [the agent] did a lot of digging and found a few mistakes I had made a year prior, explained them to me in laypeople's terms, and pointed me back in the right direction, all while being really friendly and respectful about my lack of knowledge. In short, she went the extra mile and I left the call feeling optimistic again."
- "She was knowledgeable, and her instructions were clear and easy to follow. She was very pleasant and did her best to go out of her way to help me."
Theme C) Met needs generally
There were roughly one in ten (13%) respondents who indicated that the CRA had met their needs generally, without indicating any further detail about why. Generally, these responses focused on how the agent was able to solve their problem without complications, such as:
- "I was able to achieve the outcome that I sought, i.e. transfer the credit sitting on my husband's tax account to my own tax account for full payment of my 2017 taxes."
- "Collection agent was polite and respectful and was flexible when making a payment arrangement."
- "[The] woman I spoke to was polite, cheerful, answered my questions clearly, and told me exactly what I should do to deal with my accidental over contribution to my RRSP."
- "Called CRA for questions as young first time [filer]. Was able to get helpful answers to my questions and make me easier to complete my return"
Theme D) Online tools useful
Online tools were viewed positively by about one in ten (13%) of respondents, particularly My Account, AutoFill, Express Notice of Assessment, and the ability to sign-in online using banking partners.
Respondents noted:
- "I am very pleased with My Account. It displays all the information I require to keep up to date with my finances concerning Revenue Canada."
- "Everything was clear and easy to use. I really appreciate the care that is put into improving these services to Canadians."
- "I could quickly find the things I needed and make requests online without calling in"
- "Fast and effective site and was able to access my information quickly"
Theme E) Quick and efficient response time
One in twenty (5%) participants expressed satisfaction with fast processing times and efficient actions taken by CRA employees. Example responses include:
- "It was easy, quick, and accurate."
- "I called in to ask about an unused RRSP contribution and was transferred to an expert who picked up the phone right away."
Other Themes
Various themes were discussed by less than 5% of respondents:
- Information easily available online
- Reasonable wait time on the phone line
- Satisfaction with accommodations and agreements made with agent for payment
- CRA reached out to them proactively to fix an issue
- Consistency in dealing with the same agent on file to continue a discussion
In addition to the above responses to the question "What went well during this interaction?", 18% of responses provided negative feedback which instead focused on "what did not go well?". Negative responses most frequently discussed the long wait times to speak to an agent on the phone, as well as being passed through several agents who were not able to help before finally having an issue resolved. Documents getting lost once submitted, long processing times, and aggressive auditors were also discussed in responses.
4.2.4.2 What Did Not Go Well
Text description for What Did Not Go Well graph
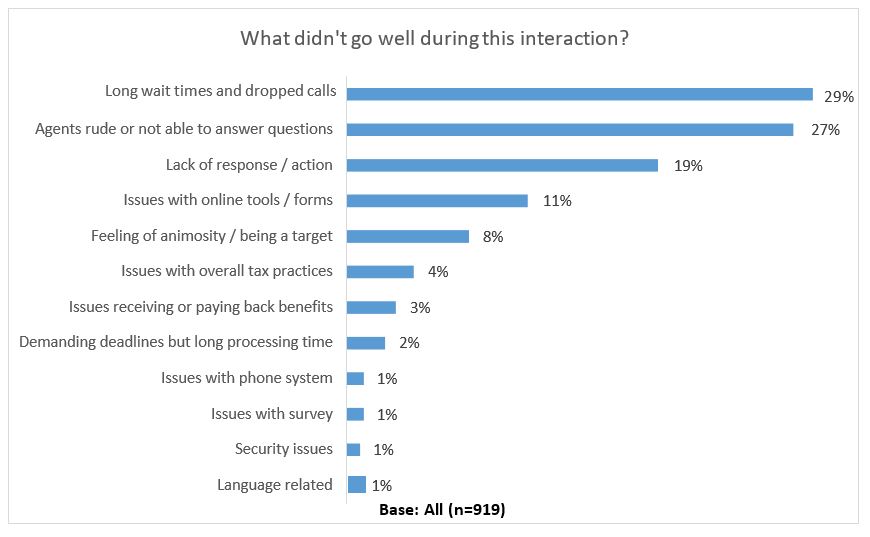
- This graph is a line chart that shows the results of a multiple-choice question where respondents were asked what didn’t go well with their previous interaction that did not meet their needs. This chart is divided into 12 parts. The first line is titled long wait times and dropped calls and is 29 percent. The second line is titled agents rude or not able to answer questions and is 27 percent. The third line is titled lack of response/action and is 19 percent. The fourth line is issues with online tools/forms and is 11 percent. The fifth line is titled feeling animosity/being a target and is 8 percent. The sixth line is titled issues with overall tax practices and is 4 percent. The seventh line is titled issues receiving or paying back benefits and is 3 percent. The eighth line is titled demanding deadlines but long processing time and is 2 percent. The ninth line is titled issues with phone system and is 1 percent. The tenth line is titled issues with survey and is 1 percent. The eleventh line is titled security issues and is 1 percent. The twelfth line is titled language related and is 1 percent. 919 respondents answered this question.
919 online consultation respondents answered the question "What didn't go well during this interaction?" after indicating that they had had an interaction that did not meet their needs.
Theme A) Long wait times and dropped calls
According to 29% of respondents, the most commonly discussed negative experiences were related to waiting on hold for long periods of time, often about 45 minutes and sometimes over an hour, as well as issues with calls dropping and being forced to start all over again on hold. Respondents described their experiences as such:
- "I waited one hour and thirty three minutes to speak with someone and one minute into the call he hung up on us."
- "I couldn't get through to even wait for an agent by phone for days. Then when I finally did, I waited 22 minutes and got dropped off the line. Called back again to 'lines are all full' message again."
- "I sat on hold for more than 45 minutes and then got a message saying that all agents were busy and to call back another time. I got this message five times a day for a week. I kept notes."
- "My concern is I waited almost an hour including being a dropped call and had to call back in that's way to long to wait for a "hold"."
- "The telephone wait times are ridiculous 20 to 30 minutes. We can't bill this time back to the client. Dealing with CRA is just a terrible experience."
Being asked to call again at a later time, rather than having the option to leave contact information to be called back, was viewed as poor customer service.
Further, many respondents indicated that the call centre hours, which coincide with standard office hours, were overly limiting and forced people to take time off work to be on hold with the CRA. Another issue raised with the phone system was the automated menu, which sometimes resulted in no option to speak to an agent at all. As one respondent stated: "I was not able to get a live person to talk to. All I got was a continuous loop of options that did not apply to me without an option to speak to an agent."
Theme B) Agents are considered rude or unhelpful
Another common theme amongst 27% of respondents was that their interaction with the CRA had not gone well because employees were rude or unhelpful. Many discussed agents being aggressive, unfriendly, indifferent, and lacking empathy. Examples of comments about agent conduct are as follows:
- "When I called in to find out the status of an adjustment request, the person that I talked to does not know the information. There is a limited amount of information that they can give me. And they don't offer any other solution except to wait."
- "No empathy, she could not have cared less about my concerns."
- "Documentation from Revenue Canada had an incorrect date of death for my 19 year old son. I wanted it corrected and the agent said the wrong date didn't make any difference. I knew he meant to my taxes, but the tone was dismissive. To a mother who had just lost her son it was horrible."
- "They were argumentative, aggressive and badgering."
- "When calling the CRA multiple times, I was told the wrong information by a few different CRA agents which ultimately made me need a reassessment. I can get new information with every phone call and most of the time that information is wrong."
- "Rude interaction. 'Putting me on hold' then hanging up."
- "Vague answers and misinformation provided by an unresponsive agent. Information provided also did not match information posted on CRA's website."
- "If you don't answer the questions fast enough, they accuse you of lying and not being you; not understanding that some people have comprehension issues."
Other responses discussed agents who were not willing or able to answer questions. Some comments raised issues of inconsistency, where different agents would give different answers to the same question. This was noted as causing mistrust of the CRA, and uncertainty over who to believe.
A lack of training in tax procedure was also identified as a problem. One response claimed: "Your telephone staff are extremely uneducated with anything concerning taxes." This indicates not only some gaps in knowledge held by agents, but a declining sense of trust and confidence in the CRA by members of the public.
Theme C) Lack of response / action
19% of respondents provided feedback regarding long processing times which gave them a sense that the CRA was failing to respond or act in a timely manner. Many discussed waiting several months for a file, such as a reassessment, to be assigned or reviewed. Several indicated that they had contacted their local Member of Parliament in order to have an outstanding issue with the CRA resolved. Example responses are as follows:
- "Poor response time to providing information to CRA. Over 6 months since information providing and still CRA has not got around to looking at it."
- "The employee did not know the answers to my question nor who I should contact to obtain the right information. I was given the run around and it took over 8 months to find out the information my husband and I needed."
- "Management would not provide information voluntarily. I had to file a request through Freedom of Information."
- "A request for further information was sent out over the summer months with something near a 30 day response time. Not acceptable considering people with summer holidays. It was a potentially significant tax liability and I was only lucky to return a couple days prior and prepare and submit the necessary documents."
A lack of action by the CRA was linked to financial consequences for many respondents, as interest would be charged during the waiting time between sending in documents/payments and having them processed. There were also concerns about not being able to track the status of documents, such as not knowing whether a faxed document had been received.
Theme D) Issues with online tools / forms
According to 11% of respondents, the most commonly raised issue regarding online tools and tax forms was accessing My Account, and the need to call the CRA or wait for a mailed code in order to access the online tool. In addition to security concerns, some respondents were also frustrated at the inconvenience of long wait times on hold with the call centre in order to access their online account. Respondent comments included:
- "Why in the world do I need to call a CRA agent after confirming my identity online with a bank login, SIN number and home address just to obtain a Netfile security code sent to a non- encrypted, insecure personal email address?"
- "I have not had access to my online account balance and statement of account for over one year. Telephone staff have been considerate but no one has been able to, or interested in, repairing my on line access."
- "Online process to file documents in support of a review does not allow you to search the status of the case or ask questions. The phone system makes it very hard to connect with the right person to ask questions or follow up status."
Theme E) Feeling of animosity / being a target
8% of respondents indicated that they felt like the CRA was adversarial and aggressive in its auditing and reassessment practices. For example, the following are experiences of respondents on this subject:
- "Auditor lied and filed a false assessment to intimidate me."
- "Almost two years of back and forth and a large bill for penalties resulting from delays that I had nothing to do with. I had to pay the bill in order not to incur further penalties. It felt like extortion. It was a terrible infuriating experience."
- "I was audited for the same issue 4 years in a row forcing me to prove every time that info was correct."
- "You need to realize that you are working with people, not numbers, or files. There does not seem to be any compassion in your agency."
These responses and others indicate that to some, the CRA has a poor reputation as an adversary to Canadians rather than a partner.
Other Themes
Various other themes emerged in the question "What didn't go well during this interaction?" from groups of responses under 5%, as follows:
- General issues with taxation policy/practice which were unrelated to CRA customer service
- Issues receiving or paying back benefits, including fighting for disability tax credits
- Frustration with demands by the CRA for submission of documents or other actions within a short timeline, but then being subject to seemingly endless periods of time for the CRA to take action. For example: "CRA is very eager to collect money back and applies penalties as quickly as they can. When a ruling is in your favour, letters, phone calls were not followed up for more than a year." This was also echoed in the in-person sessions.
- Concerns about security, including scams and a lack of two-factor authentication
- Difficulty understanding the English or French spoken by CRA agents
4.2.4.3 What Could Be Improved
Text description for What Could Be Improved graph
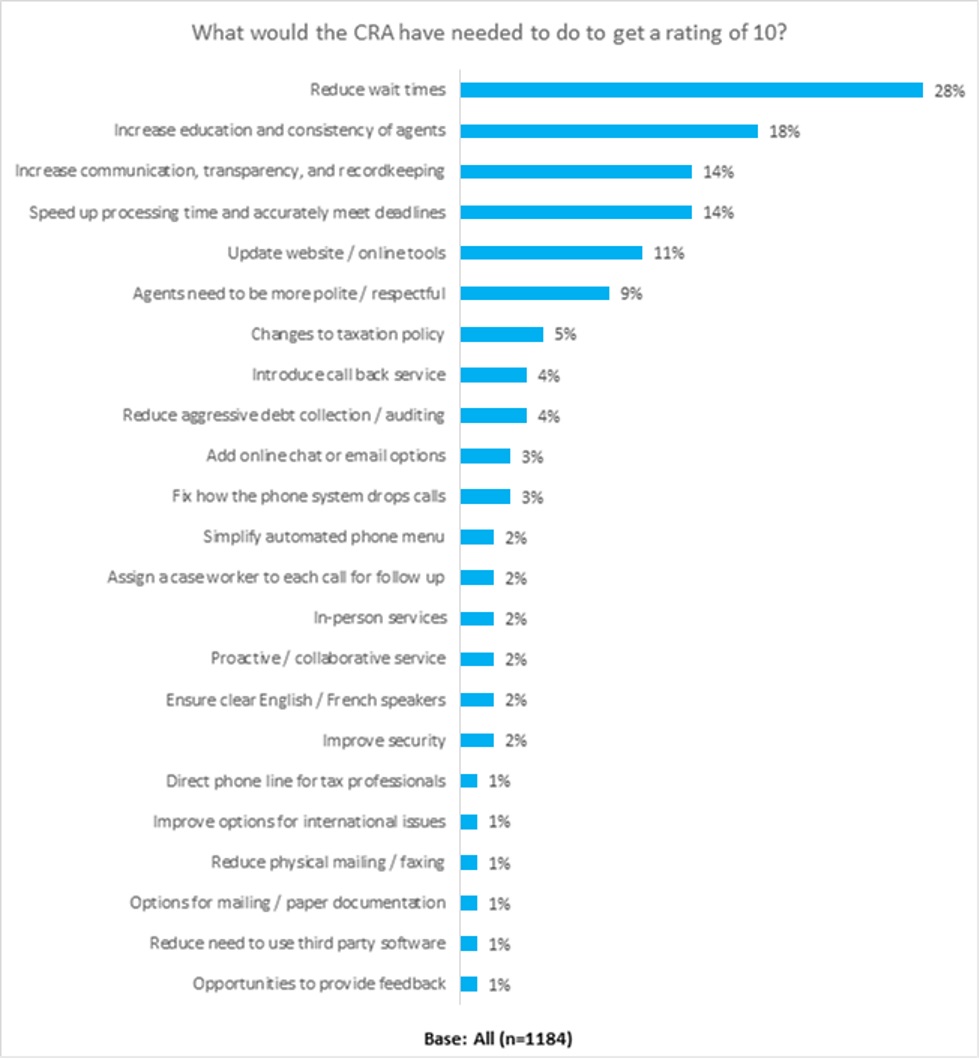
- This graph is a line chart that shows the results of a multiple-choice question where respondents were asked what they thought the CRA needed to do to get a rating of 10. This chart is divided into 23 parts. The first line is titled reduce wait times and is 28 percent. The second line is titled increase education and consistency of agents and is 18 percent. The third line is titled increase communication, transparency, and recordkeeping and is 14 percent. The fourth line is titled speed up processing time and accurately meet deadlines is 14 percent. The fifth line is titled update website/online tools and is 11 percent. The sixth line is titled agents need to be more polite/respectful and is 9 percent. The seventh line is titled changes to taxation policy and is 5 percent. The eighth line is titled introduce call back service and is 4 percent. The ninth is titled reduce aggressive debt collection/auditing and is 4 percent. The tenth line is titled add online chat or email options and is 3 percent. The eleventh line is titled fix how the phone system drops calls and is 3 percent. The twelfth line is titled simplify automated phone menu and is 2 percent. The thirteenth line is titled assign a case worker to each call for follow-up and is 2 percent. The fourteenth line is titled in-person services and is 2 percent. The fifteenth line is titled proactive/collaborative service and is 2 percent. The sixteenth line is titled ensure clear English/French speakers and is 2 percent. The seventeenth line is titled improve security and is 2 percent. The eighteenth line is titled direct phone line for tax professionals and is 1 percent. The nineteenth line is titled improve options for international issues and is 1 percent. The twentieth line is titled reduce physical mailing/faxing and is 1 percent. The twenty-first line is titled options for mailing/paper documentation and is 1 percent. The twenty-second line is titled reduce need to use third party and is 1 percent. The twenty-third line is titled opportunities to provide feedback and is 1 percent. 1184 respondents answered this question.
1,184 online consultation respondents answered the question "What would the CRA have needed to do to get a rating of 10?" after ranking their interaction less than 10 on a scale from 1 (poor) to 10 (excellent), whether their experience had met their needs or not. Each theme identified in the graph is expanded upon below.
Theme A) Reduce wait times
Nearly one third (28%) of respondents discussed how a reduction in wait times would improve their experience with the CRA. 5-10 minutes was often suggested as the maximum acceptable wait time, and in order to achieve this, respondents suggested hiring more agents for the call centre, providing more information online to prevent the need to call, extending call centre hours beyond the normal work day, and upgrading the phone system to handle a larger volume of calls. It was further requested that the phone system provide updates while on hold about expected wait times. Further, some suggested that a separate line be added for help with My Account service, such as obtaining a simple access code.
Example responses regarding wait times are as follows:
- "Have shorter wait times or estimated wait times. Be able to get in contact with the agent you were disconnect from. They take your phone number - they should be able to phone you back."
- "A more reasonable wait time. I, along with many other Canadians, don't often have the time to waste waiting on hold."
- "Add more call centre staff or provide a separate line for help with the "My Account" service."
- "Give tax preparers a dedicated line to CRA agents. Improve the call transfer system. Hire more agents to reduce wait times."
In addition to reduced wait times, 4% of all respondents expressed the desire to have a call back service introduced to the CRA. As stated in one response, "Provide a ‘call back' similar to what WestJet does. If there is a backup of calls at the CRA, provide the opportunity for citizens to leave a phone number and provide an estimated time when CRA will return the phone call."
Theme B) Increase education and consistency of agents
According to about 1 in 5 (18%) respondents, another frequent theme was the need for agents to be more highly trained in both customer service and tax law in order to more effectively serve Canadians. Some comments provided specific areas in which agents would benefit from training:
- The Income Tax Act
- Capital gains
- Disability tax credits
- Accessing security questions for My Account
- Claims for split pensions
- Escalation procedures for bringing complex issues to senior agents
It was also discussed by many respondents that it is important for training and education to be consistent among agents, so that all are capable of answering questions or knowing who to transfer to for higher- level expertise. For example, the experiences of some respondents are:
- "I got 3 different conflicting explanations of how to fix my problem when it could have easily been fixed weeks earlier had I known what to do."
- "Assure that agents are properly trained or that Tier 1 agents do not attempt to answer questions they are not qualified to answer."
- "Hire enough staff to provide appropriate phone support and train them! Give phone users a simple survey they can use to rate the helpfulness of the agent and use those ratings to evaluate whether some of these people should be on the phones to begin with or need more training."
- "If you are not able to appropriately answer the question the call should be transferred to a senior agent or a call back could be offered."
Further, some comments indicated that the CRA should hire agents who are tax preparers with more formal education in tax law.
Theme C) Increase communication, transparency, and recordkeeping
Issues with communication, transparency, and keeping track of records and taxpayer files were raised as a concern by about 14% of respondents. The following were suggested customer service improvements:
- Provide information proactively for each ongoing case, such as reasons for delays, so taxpayers do not need to call the CRA to obtain any information about the status of their issue
- Provide more up-to-date information online, such as TFSA contribution room
- Use simpler language in letters and online information, rather than technical tax law language
- Provide welcome packages for first time filers and newcomers, explaining the tax process with step-by-step instructions
- Provide notifications and records of electronic documents, faxes, and other communications being received
- Be clearer about options for specific situations, such as legal name changes and non-taxable on-reserve income for First Nations people
- Ensure that notices are received before garnishing an account
- Keep track of file numbers for each taxpayer and ensure that file numbers are on all documentation and provided to the taxpayer
Several responses further focused on the need for open communication between government departments and within the CRA. For example:
- "Allow all departments access to uploaded documents. When one department asks for certain documents make those documents transferable to another department."
- "Link your services such that information is used by and available for all parts of your organization. I've now submitted my divorce agreement five different times in the last 16 years. These things don't change! Do you not keep your own records?!"
- "Integrate all tax services so employees can fully inform citizens what they owe. Improve communication so people don't end up owing money they don't know about and racking up interest."
- "Notify people when you decide to charge them money, instead of letting the money owing sit for a few years and charging the innocent people interest."
Theme D) Speed up processing time and accurately meet deadlines
14% of respondents identified slow processing times as a significant barrier to having successful interactions with the CRA. One respondent stated that the "CRA should have published service standards, just as many other government service agencies do." This was echoed by others, who have experienced months-long wait times without updates on the status of their files.
Further, some expressed frustration at being charged interest during delays that were caused by the CRA. As one response stated, there should be "faster correction of errors and receipt of overpayments. Do not charge interest and penalties when CRA has made mistakes." One respondent indicated that Revenue Quebec provides a good example of fast service and responsive staff which may serve as a model for the CRA.
Theme E) Update website / online tools
11% of respondents identified various suggestions for updates to the website and online tools which would improve the service provided by the CRA. Technical issues were one area of discussion, such as ensuring that My Account works on all web browsers and providing online service 24/7.
Suggested improvements for the website and online tools include the following. Some of these services are already provided, but the lack of awareness suggests that the CRA needs to further communicate to taxpayers the services and products that are already being provided.
- Improvements to the search engine to provide more relevant results
- Ability to upload PDF files, have up-to-date benefit information, and update address information in My Account
- A record of submissions viewable within My Account
- Provide more information in email notifications about My Account, such as whether a notice requires action or is for information only
- Improve the charity registry search to work like a normal search engine
- Create a mobile-friendly app for My Account
- Enable first time filers to file online
- Make it easier to move between personal and business accounts online
Another area of focus was improving access to My Account, and not requiring a mailed security code or phone call to obtain access. Banks were frequently cited as an example, as in this respondent's comment: "Make online interactions as easy as online banking. The banks and credit unions do it, securely. You can, too!" In addition, several tax professionals using Rep a Client offered suggestions for improvement, including the ability to reallocate payments; see accounts, correspondence, and payment details; and upload more files such as pre-assessment documents.
Further, 3% of all respondents indicated a desire to add options for online chat and email communication rather than relying on the phone system. Two key reasons for this were the ability to have written records of answers and commitments, and the option to avoid being on hold on the phone.
Theme F) Agents need to be more polite / respectful
One in ten (9%) of respondents discussed the need to improve agent conduct due to negative experiences with agents in the past. Issues included impolite attitudes, a lack of empathy, and leaving the call before an issue is resolved. Customer care training was suggested to improve relationships between callers and agents. Some comments on this topic included:
- "Train your agents to interact more respectfully, and with sympathy."
- "Be more polite to people on the phone! If your job is over the phone you need to be more polite and talk to people like you care about their situation even if you have to fake it!"
- "Not all of agent are not respectful to customers. Some of them very good. May be agents need to be more respectful to customers and give more precise and logical responds."
This theme was also frequently discussed in the in-person sessions.
Other Themes
Various other themes which were discussed by less than 5% of respondents regarding areas for improvement are as follows:
- Changes to taxation policy/practice more generally, unrelated to CRA client service.
- Reduce aggressive debt collection / auditing practices, and instead work with Canadians to respectfully and professionally come to payment agreements.
- Fix how the phone system drops calls. Many respondents described previous issues of being dropped out of the hold queue after a long waiting period on hold.
- Simplify the automated phone menu – several responses described experiences being stuck in the automated phone menu without an option to speak to an agent. A suggested alternative would be to have simple options for different subject areas that lead to agents with expertise in that area.
- Assign a case worker to each call for follow-up discussions, so that the details of a file do not have to be re-explained with each call to the CRA.
- Restore in-person service desks across Canada.
- Encourage proactive and collaborative service, such as reaching out to Canadians with small issues that may cause a reassessment but can be caught and corrected without a formal process.
- Ensure agents clearly speak English or French.
- Improve security measures, such as adding two-factor authentication.
- Implement a secure line for tax professionals to speak to a qualified agent directly, rather than listening to information targeting the public and waiting on hold each time Footnote 6.
- Improve options for international issues, such as the ability to file online from abroad.
- Reduce reliance on faxing and physical mail, but provide options to have paper documentation for those who do not use online platforms.
- Reduce the need to use third party software to complete taxes.
- Ensure opportunities are available to provide feedback over time, such as surveys after each call
4.3 Service Improvements
The second questionnaire asked Canadians about their awareness and use of service improvements introduced by the CRA over the past couple of years, shown in the table below. Respondents were allowed to respond about all service improvements they were aware of.
Service Improvements Service Improvement Number of Responses Level of Awareness of Improvement Level of Past Use of this Service AutoFilling of information into tax forms 221 79% 82% Online Mail through My Account and MyCRA app 147 79% 77% Community Volunteer Income Tax Program (CVITP) 84 73% 13% ReFile service for adjusting previously filed tax returns 102 67% 62% Modernized Telephone Service 386 65% 90% Mailing Paper Tax Return Package to Homes 96 57% 42% Filing taxes over the telephone 87 56% 12% Express Notice of Assessment 120 54% 69% MyCRA smartphone app improvements 111 45% 42% Ability to pay taxes at Canada Post locations 85 38% 3% Tax filing services for northern residents 44 36% 0% The service with the lowest awareness rating was "Tax filing services for northern residents," with 44 responses. The service with the highest awareness rating was "Modernized Telephone Service," with 386 responses. The graph below summarizes the responses to the questions "Are you aware of this improvement?"; "Have you ever used this service?"; "Would you use this service again?"; and "Now that you are aware of this service, do you think you would use it in the future?" Respondents who answered "no" to "Are you aware of this improvement?" were directed to the last question, which was "Now that you are aware of this service do you think you would use it in the future?"
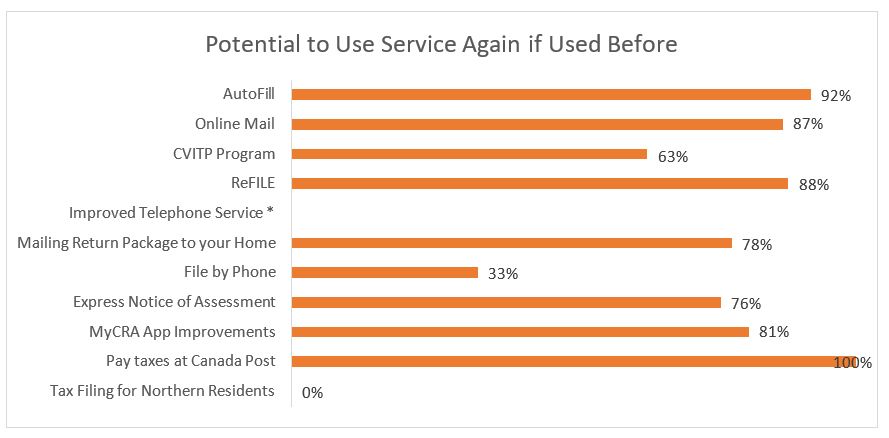
Text description for Potential to Use service again if used before graph
- This is a bar graph that shows the percent of respondents who would use a CRA service again. 92 percent would use AutoFill again. 87 percent would use Online Mail again. 63 percent would use the CVITP Program again. 88 percent would use ReFILE again. No respondents would use the improved telephone system. There is an note later in the document that explains this result. 78 percent would use the Mailing Return Package to your Home service again. 33 percent would use File by Phone again. 76 percent would use Express Notice of Assessment again. 81 percent would use the MyCRA App Improvements again. 100 percent would use Pay taxes at Canada Post again. No respondents would use Tax Filing for Northern Residents again.
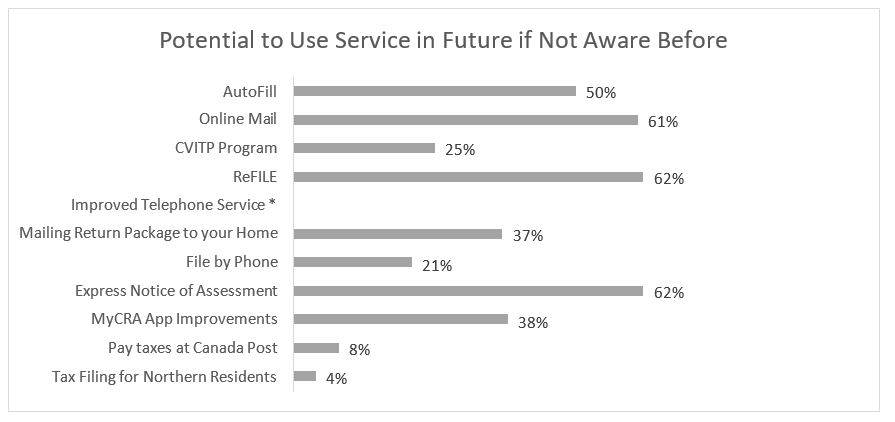
Text description for Potential to Use service again if not aware before graph
- This is a bar graph that shows the percent of respondents who would use a CRA service that they were not aware of before. 50 percent would use AutoFill. 61 percent would use Online Mail. 25 percent would use the CVITP Program. 62 percent would use ReFILE. No respondents would use the improved telephone system. There is an note later in the document that explains this result. 37 percent would use the Mailing Return Package to your Home service. 21 percent would use File by Phone. 62 percent would use Express Notice of Assessment. 38 percent would use the MyCRA App Improvements. 8 percent would use Pay taxes at Canada Post. 4 percent would use Tax Filing for Northern Residents.
Note in regards to graphs 12 et 13: Improved Telephone Service – respondents were not asked if they would use this service in the future, only if they have used it currently. 90% of those who were aware of the improvement are previous users.
The data on service improvements shows high rates of awareness for several improvements, including Autofill (79%), Online Mail through My Account (79%), and the CVITP (73%). Improved Telephone Service (90%), AutoFill (92%), and Online Mail (77%) ranked highest amongst respondents for services that had been used in the past. Respondents showed high rates of potential reuse of every service improvement except the File my return phone service, which several respondents noted as difficult to use and hard to adjust if mistakes are made, and Tax Filing for Northern Residents which a low number of respondents were aware of. There was also some concern that telephone filing may create an opportunity for scammers, and therefore there is a lower level of trust about sharing information over the phone.
The highest ranking for services that respondents were not previously aware of but would potentially use in the future included ReFile (62%), Online Mail (61%), and AutoFill (50%). Low rates for potential future use was recorded for several service improvements, including the CVITP, File my Return, tax filing for Northern residents, and paying taxes at Canada Post. With respect to the Canada Post service, a large number of respondents stated that they would not use this improvement simply because it did not apply to them, while the majority of the respondents indicated that they would not – or already have not – paid their taxes at Canada Post because of the additional fees involved.
4.4 Future Direction
The final questionnaire contained questions on what Canadians currently value most about the CRA; the communication channels that they would like the CRA to use; the CRA's future direction and commitment to improving service; and the Agency's goal of being "trusted, fair and helpful to all Canadians." There were 362 responses to this questionnaire.
4.4.1 Confidence in CRA Direction
Noticeably more respondents are not confident (43%) in the CRA's future direction than are either confident (28%) or neutral (29%).
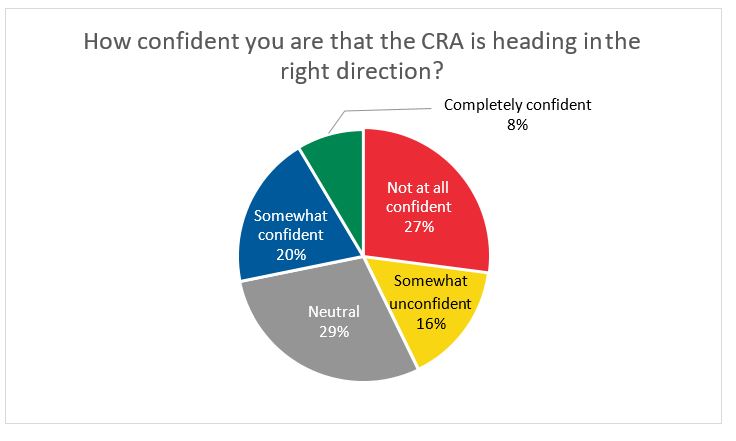
Text description for Confidence in CRA Direction graph
- This graph is a pie chart that shows the percentage of respondents who are confident that the CRA is heading in the right direction. The pie chart is divided into five parts. The green wedge is titles Completely confident and is 8 percent. The blue wedge is titled somewhat confident and is 2 percent. The grey wedge is titled Neutral and is 29 percent. The yellow wedge is titled Somewhat unconfident and is 16 percent. The red wedge is titled Not at all confident and is 27 percent.
4.4.2 Suggested Changes to show CRA’s commitment
After being asked about the CRA's future direction, respondents were asked to suggest other changes that would show the CRA's commitment to improving service. The majority of the responses (over 75%) fell into the four categories encountered in the in-person sessions:
- More personalized and proactive service
- Enhanced awareness, information, and education
- Enhanced accessibility
- Keeping up with the times
A prevalent message that also emerged was the concept that the CRA needs to be more "fair" to average taxpayers, particularly in relation to better enforcement of tax evasion and the feeling that the rich do not pay their fair share of taxes compared to other Canadians.
4.4.3 Preferred Communication Methods
In a multiple-choice question, respondents were asked to pick the top three channels they would like the CRA to use in communicating future changes and service improvements.
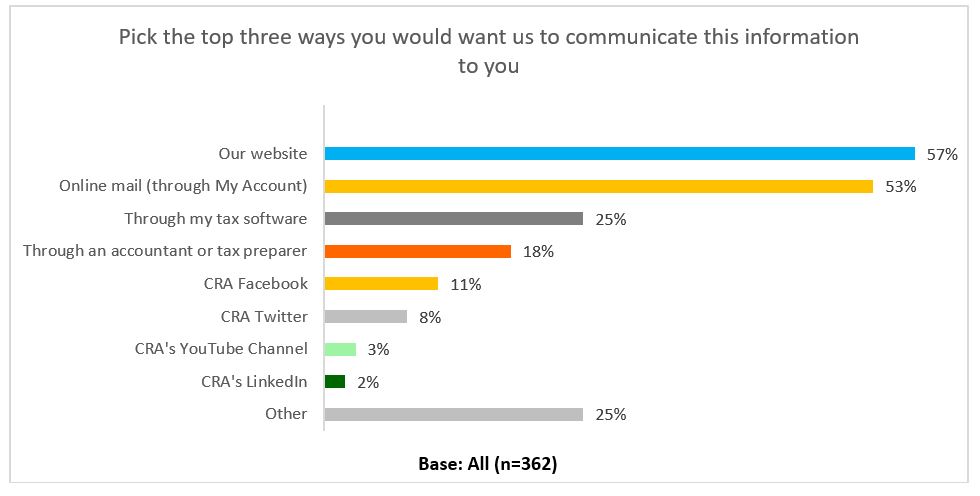
Text description for Preferred Communication Methods graph
- This is a bar graph showing results of a multiple-choice question where respondents were asked to pick the top three channels they would like the CRA to use in communicating future changes and service improvements. Of 362 respondents, 57 percent chose Our website. 53 percent chose Online mail (through My Account). 25 percent chose through my tax software. 18 percent chose through an accountant or tax preparer. 11 percent chose the CRA Facebook. 8 percent chose through CRA Twitter. 3 percent chose through the CRA’s YouTube channel. 2 percent chose through the CRA’s LinkedIn. 25 percent chose Other.
The majority chose online mail through My Account and the website. Suggestions for other communication channels included printed mailings, emails and news articles, as well as pop-up advertising on websites and popular social media channels.
It should be noted that, while social media ranked in the bottom half of communication channels, a common theme of the in-person sessions was that "one size does not fit all." This suggests that the CRA should not look to maximize a single or even a few channels; rather, it should continue to use a wide range of techniques that appeal to a wide range of Canadians and evolve with their needs.
4.4.4 Words Associated with CRA
When asked "what three words come to mind when you think of the Canada Revenue Agency?" the 318 respondents provided a wide range of responses, summarized in the following table. "Tax" and "slow" were the two most common words.
Words Associated with CRA What three words come to mind when you think of the Canada Revenue Agency? Responses tax 43 slow 32 incompetent 17 bureaucratic 16 difficult 15 inefficient 14 complicate(d) 14 frustrating 12 complex 10 unfair 9 money 9 inconsistent 8 uncaring 8 government 8 inaccessible 8 time 7 service 7 confusing 7 benefit 7 others 67 4.4.5 What Canadians Value Most About the CRA
As a follow-up to the previous question, respondents were then asked to list what they most value about the CRA. This question was not answered by 90 of the respondents, and 112 respondents included responses that were not related to valuing the CRA.
While approximately 20% of the responses listed areas that relate to the themes encountered in the in- person sessions, additional areas were highlighted, including:
- Positive interactions with CRA agents, including their professionalism, efficiency and accuracy
- The role taxes play in contributing to our country and the CRA's role in administering them
- Appreciation for how the CRA protects their private information
- The way that taxation is applied fairly to all Canadians
- The fact that the CRA is willing to change to improve service for Canadians
4.4.6 Ranking of the CRA Values
Respondents were asked to rank the three CRA values in order of importance to them, and the results are shown in the graph below.
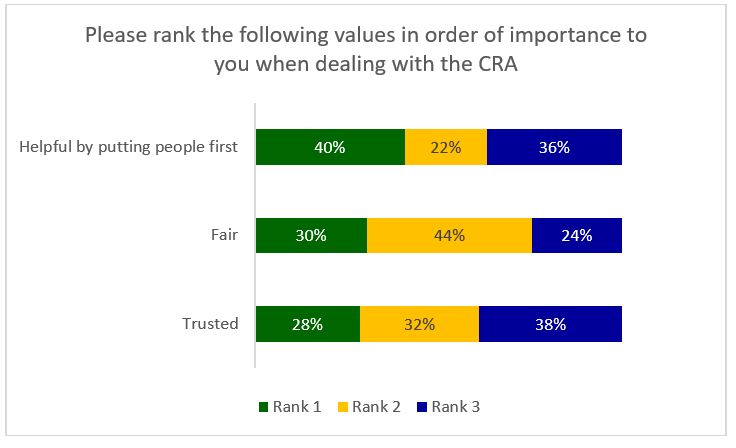
Text description for Ranking of the CRA Values graph
- Respondents were asked to rank the three CRA values in order of importance to them, and the results are shown in this graph. For the value “Helpful by putting people first”, 40 percent ranked it first, 22 percent ranked it second and 36 percent ranked it third. For the value “Fair”, 30 percent ranked it first, 44 percent ranked it second and 24 percent ranked it third. For the value “Trusted”, 28 percent ranked it first, 32 percent ranked it second and 38 percent ranked it third.
Being helpful was ranked highest, followed by fair and trusted. However, the rankings were close. Several respondents noted the linkage between the values, especially that being helpful and fair will help to build more trust.
4.4.7 Reaching CRA Goals
To close the online consultation, respondents were asked a series of questions on if they felt that the CRA had reached their goal of improving service:
- 71% of respondents felt that the CRA had not yet reached their service improvement goal, with another 15% unsure.
These respondents were then asked for input on what the CRA would need to do to reach their goals of being viewed as trusted, fair, and helpful by putting people first. Response rates for each of these questions ranged from 234 (trusted) to 216 (fair) to 126 (helpful by putting people first).
- Trusted: nearly half of respondents indicated that being viewed as trusted would require that their interactions with the CRA be consistent and accurate (24%) and that the CRA needs to show that it is being fair and helpful (21%) in these interactions. It was also felt by 19% that having more staff and training them more competently would help to improve their trust in the CRA.
- Fair: over a third (36%) of respondents felt that the CRA does not treat all Canadians fairly, with seemingly different rules applied to rich and poorer taxpayers, and that the CRA seems to view tax returns through the lens of "guilty until proven innocent" of fraud. Another 11% noted that improved consistency and accuracy in interactions would help the CRA to be viewed as fair. While some Canadians do not feel the CRA is fair, there were some respondents who felt that taxation is applied fairly to all Canadians
- Helpful by putting people first: over half of the respondents (52%) indicated that a key aspect of "putting people first" is valuing their time. Long call centre wait times, delays in receiving responses to questions, and a lack of trained staff to interact with once a connection is made, were frequently mentioned as examples of not putting people first. Another 20% noted that, by being fair, the CRA is also being helpful, and that consistency and accuracy in their interactions with CRA agents would help Canadians to spend less time on their taxes.
4.5 Themes Unique to Online Consultation Themes
The themes that emerged from the online consultation overlapped to a great extent with the themes we heard during the in-person sessions. However, the online data revealed a theme of accuracy and consistency that was not expressed by the in-person session attendees. This theme included the following elements:
Accuracy and Consistency
- Information provided by CRA representatives needs to be consistent and should take all applicable legislation into account
- Better explanations and justification for how tax calculations are made, and more confidence that these calculations are correct the first time (i.e. fewer recalculations and mistakes)
5.0 Next Steps
The CRA will share the results from the consultations and provide feedback on how the input will be used in the next phase of its transformation journey during Fall 2019. A series of short term changes will be undertaken in response to the concerns and aspirations expressed by Canadians throughout the public consultation process, as well as through other ongoing efforts to interact with the public (previously mentioned is Section 2.1 of this document). Broader systemic changes that will position the Agency to put people at the centre of everything it does will also be explored. All activities that the CRA is undertaking to improve services to Canadians will be described in the CRA's 2020-2021 Corporate Business Plan, which will be released in April 2020, though some may be announced earlier.
Appendix A – Participant Demographics (In-Person Sessions)
Note: Below are the demographics as self-reported by the 113 participants who attended sessions dedicated to the general public.
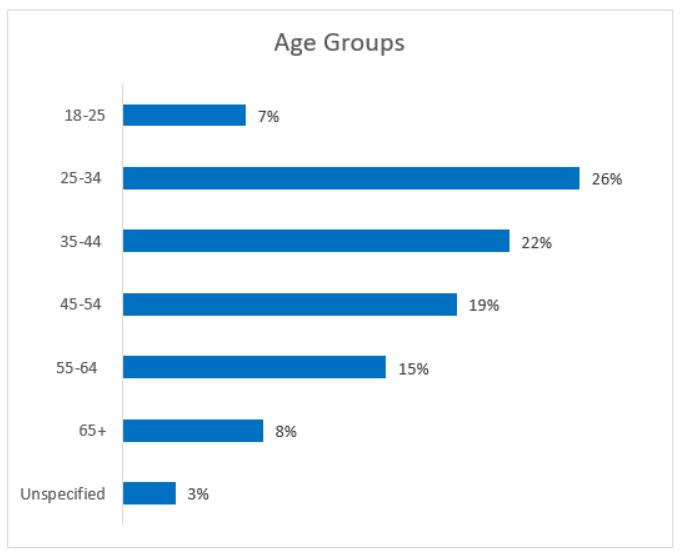
Text description for Age groups graph
- This bar graph shows the age groups of participants in the in-person sessions. 7 percent were between 18 and 25. 26 percent were between 25 and 34. 22 percent were between 35 and 44. 19 percent were between 45 and 54. 15 percent were between 55 and 64. 8 percent were over 65. 3 percent were unspecified.
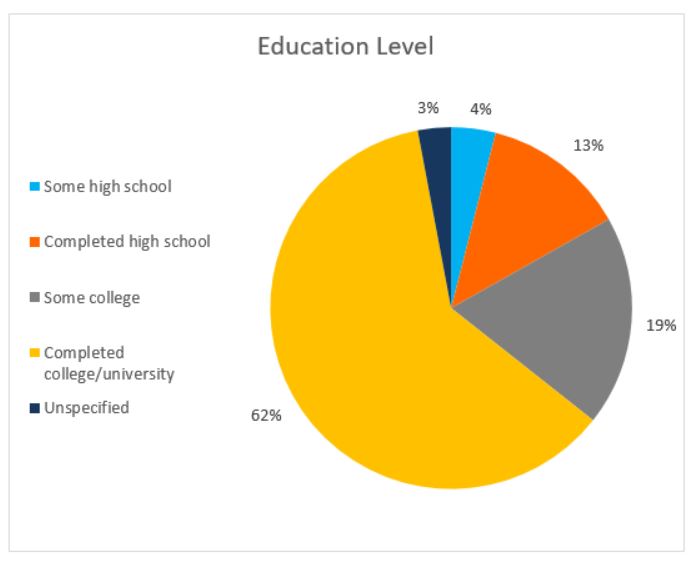
Text description for Education Level graph
- This graph is a pie chart that shows the education level of participants in the in-person sessions. The pie chart is divided into five parts. The yellow wedge is the largest and shows that 62 percent of participants completed college or university. The next largest wedge is grey and indicates that 19 percent have some college. The orange wedge shows that 13 percent completed high school. The light blue wedge shows that 4 percent have some high school. The dark blue wedge is the smallest and indicates that 3 percent were unspecified.
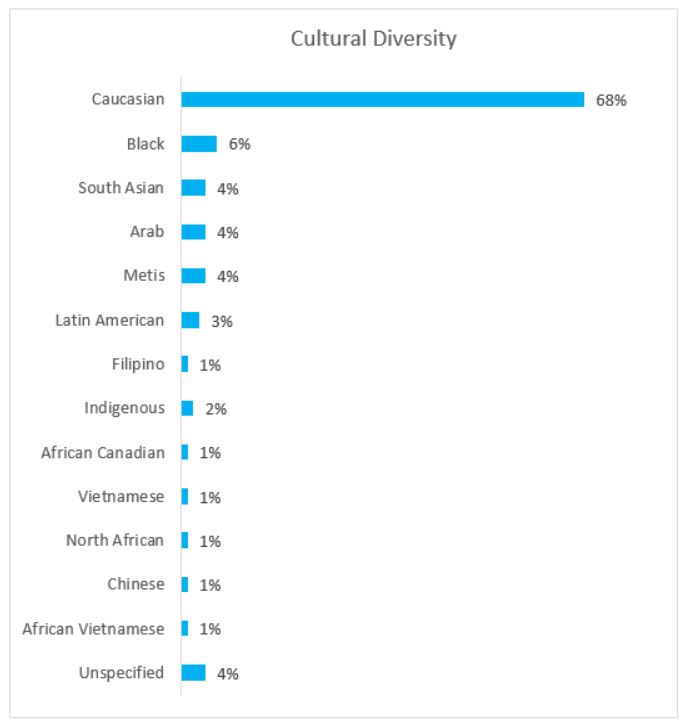
Text description for Cultural Diversity graph
- This bar graph is titled cultural diversity and shows the self-reported cultural affinity that participants in the in-person sessions expressed. 68 percent were Caucasian. 6 percent were Black. 4 percent were south Asian. 4 percent were Arab. 4 percent were Metis. 3 percent were Latin American. 1 percent was Filipino. 2 percent were Indigenous. 1 percent was African Canadian. 1 percent was Vietnamese. 1 percent was North African. 1 percent was Chinese. 1 percent was African Vietnamese. 4 percent were unspecified.
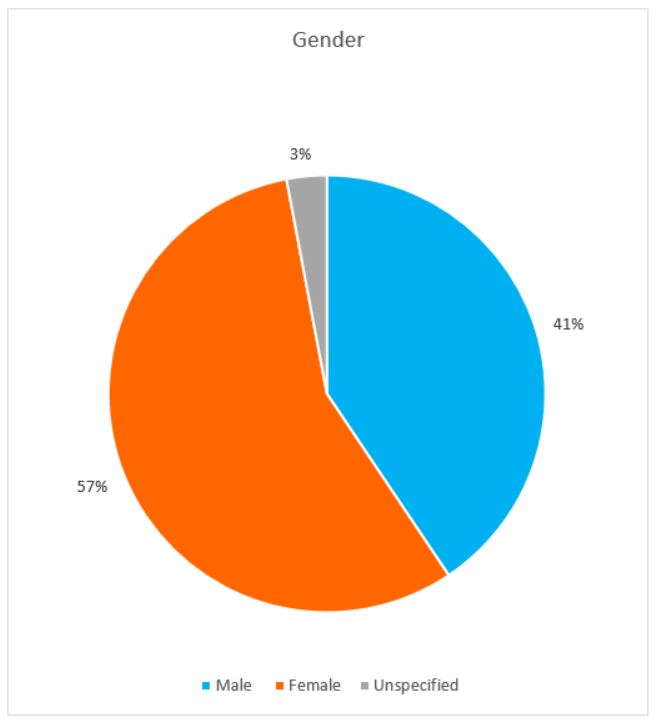
Text description for Gender graphs
- This graph is a pie chart that shows the gender of participants in the in-person sessions. The pie chart is divided into three parts. The orange wedge indicates that 57 percent were female. The blue wedge indicates that 41 percent were male. The grey wedge shows that 3 percent were unspecified.
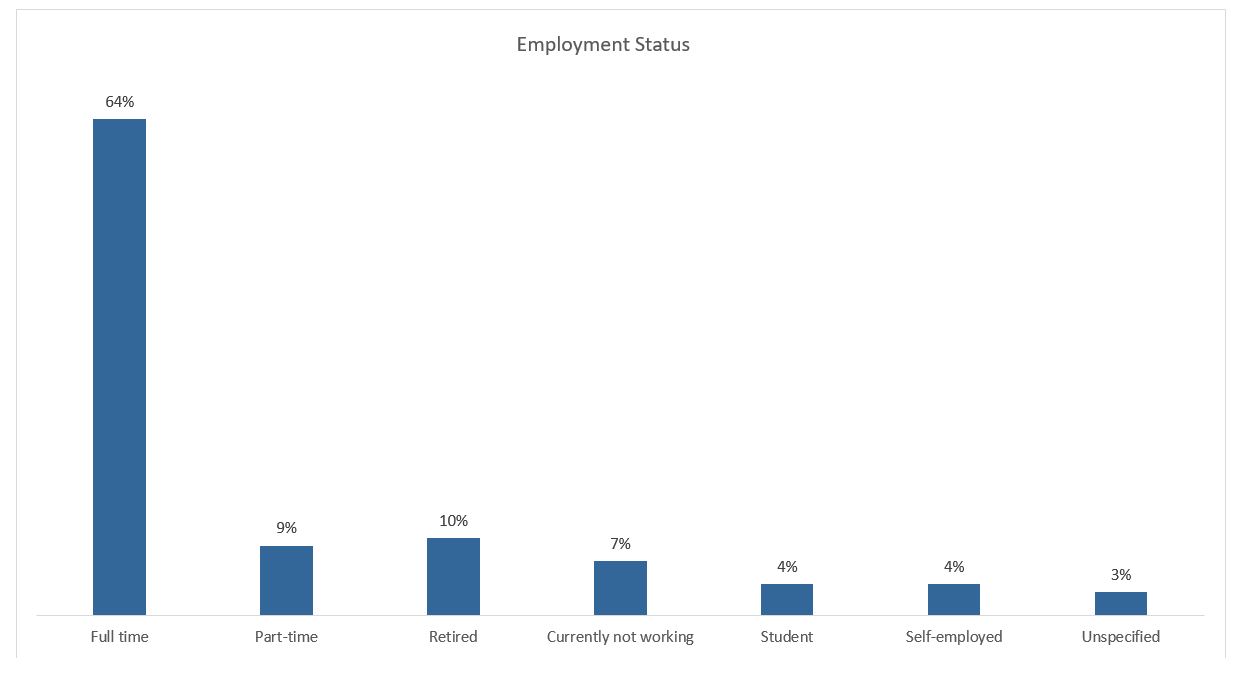
Text description for Employment Status graph
- This bar graph shows the employment status of participants in the in-person sessions. Reading from left to right: 64 percent were employed full time. 9 percent were employed part time. 10 percent were retired. 7 percent were currently not working. 4 percent were students. 4 percent were self-employed. 3 percent were unspecified.
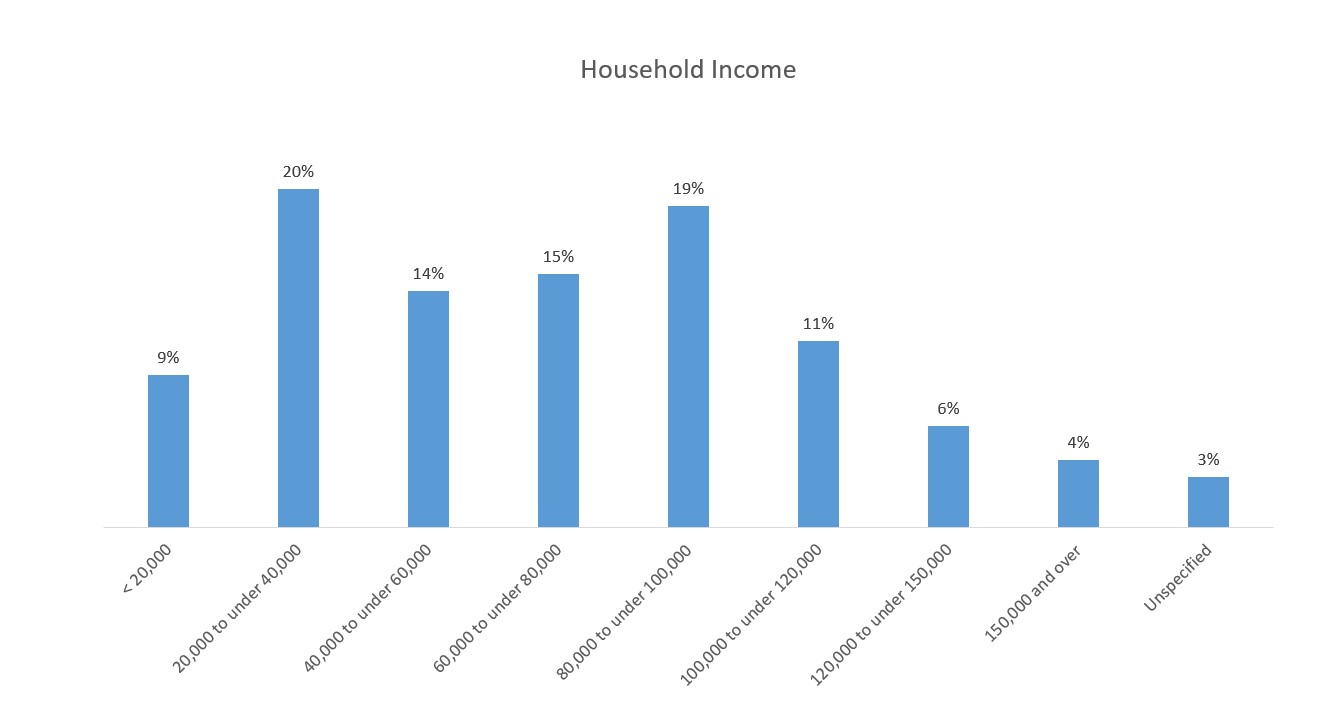
Text description for Household income graph
- This bar graph shows the household income of participants in the in-person sessions. Reading from left to right: 9 percent earned less than 20 thousand dollars. 20 percent earned between 20 thousand dollars and 40 thousand dollars. 14 percent earned between 40 thousand dollars and 60 thousand dollars. 15 percent earned between 60 thousand dollars and 80 thousand dollars. 19 percent earned between 80 thousand dollars and 100 thousand dollars. 11 percent earned between 100 thousand dollars and 120 thousand dollars. 6 percent earned between 120 thousand dollars and 150 thousand dollars. 4 percent earned over 150 thousand dollars. 3 percent were unspecified.
Appendix B – Summary of Participant Evaluations
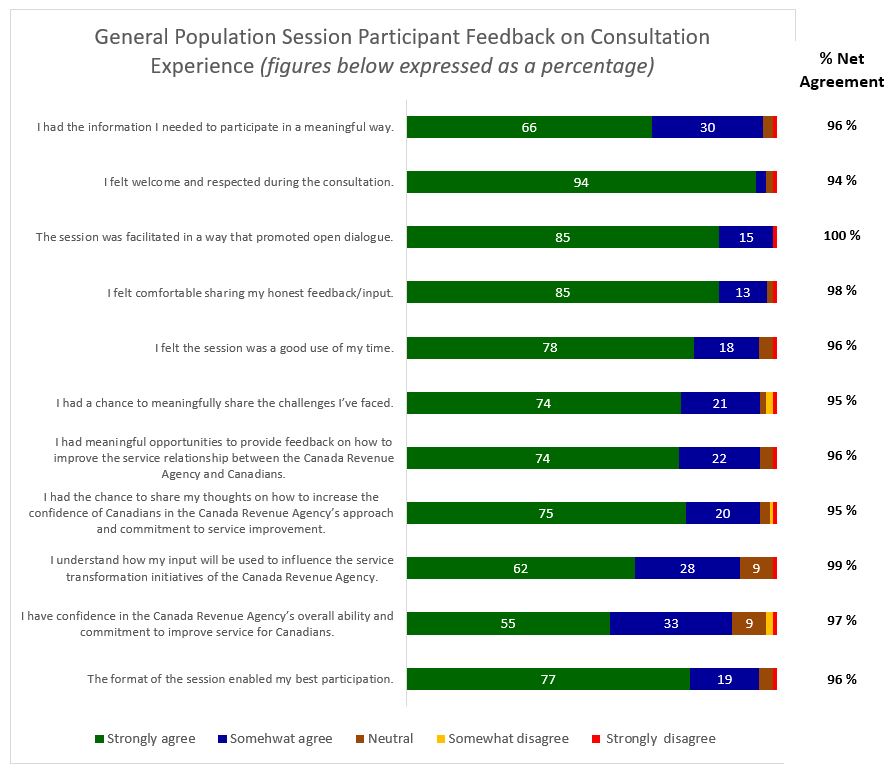
Text description for General Population Session Participant Feedback on Consultation Experience graph
- This chart expresses the results of the General Population Session Participant Feedback on Consultation Experience.
- For the statement, “I had the information I needed to participate in a meaningful way.” 66 percent strongly agreed. 30 percent somewhat agreed. The rest of the participants were either neutral or strongly disagreed. Overall, the net agreement with this statement was 96 percent.
- For the statement, “I felt welcome and respected during the consultation.” 94 percent strongly agreed. 30 percent somewhat agreed. The rest of the participants were either neutral or strongly disagreed. Overall, the net agreement with this statement was 94 percent.
- For the statement, “The session was facilitated in a way that promoted open dialogue.” 85 percent strongly agreed. 15 percent somewhat agreed. Overall, the net agreement with this statement was 100 percent.
- For the statement, “I felt comfortable sharing my honest feedback/input.” 85 percent strongly agreed. 13 percent somewhat agreed. The rest of the participants were either neutral or strongly disagreed. Overall, the net agreement with this statement was 98 percent.
- For the statement, “I felt the session was a good use of my time.” 78 percent strongly agreed. 18 percent somewhat agreed. The rest of the participants were either neutral, somewhat disagreed or strongly disagreed. Overall, the net agreement with this statement was 96 percent.
- For the statement, “I had a chance to meaningfully share the challenges I’ve faced.” 74 percent strongly agreed. 21 percent somewhat agreed. The rest of the participants were either neutral, somewhat disagreed or strongly disagreed. Overall, the net agreement with this statement was 95 percent.
- For the statement, “I had meaningful opportunities to provide feedback on how to improve the service relationship between the Canada Revenue Agency and Canadians.” 74 percent strongly agreed. 22 percent somewhat agreed. The rest of the participants were either neutral or strongly disagreed. Overall, the net agreement with this statement was 96 percent.
- For the statement, “I had the chance to share my thoughts on how to increase the confidence of Canadians in the Canada Revenue Agency’s approach and commitment to.” 75 percent strongly agreed. 20 percent somewhat agreed. The rest of the participants were either neutral, somewhat disagreed or strongly disagreed. Overall, the net agreement with this statement was 95 percent.
- For the statement, “I understand how my input will be used to influence the service transformation initiatives of the Canada Revenue Agency.” 62 percent strongly agreed. 28 percent somewhat agreed. 9 percent were neutral. The rest of the participants strongly disagreed. Overall, the net agreement with this statement was 99 percent.
- For the statement, “I have confidence in the Canada Revenue Agency’s overall ability and commitment to improve service for Canadians.” 55 percent strongly agreed. 33 percent somewhat agreed. 9 percent were neutral. The rest of the participants somewhat disagreed or strongly disagreed. Overall, the net agreement with this statement was 97 percent.
- For the statement, “The format of the session enabled my best participation” 77 percent strongly agreed. 19 percent somewhat agreed. The rest of the participants were either neutral or strongly disagreed. Overall, the net agreement with this statement was 96 percent.

Text description for General Population Session Participant Feedback on Pace of Discussion graph
- This chart expresses the how General Population Session Participants felt about the pace of discussion. 3 percent felt the pace was too fast. 96 percent felt the pace was just right. 1 percent felt the pace was too slow.
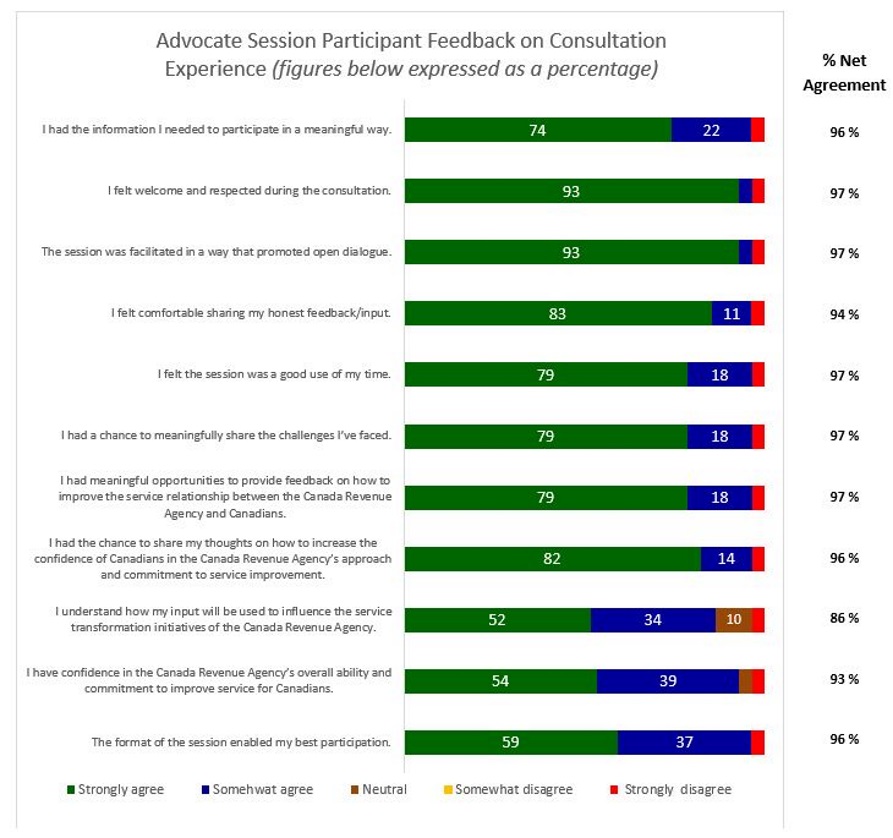
Text description for Advocate Session Participant Feedback on Consultation Experience graph
- This chart expresses the results of the Advocate Session Participant Feedback on Consultation Experience.
- For the statement, “I had the information I needed to participate in a meaningful way.” 74 percent strongly agreed. 22 percent somewhat agreed. The rest of the participants strongly disagreed. Overall, the net agreement with this statement was 96 percent.
- For the statement, “I felt welcome and respected during the consultation.” 93 percent strongly agreed. 4 percent somewhat agreed. The rest of the participants strongly disagreed. Overall, the net agreement with this statement was 97 percent.
- For the statement, “The session was facilitated in a way that promoted open dialogue.” 93 percent strongly agreed. 4 percent somewhat agreed. The rest of the participants strongly disagreed. Overall, the net agreement with this statement was 97 percent.
- For the statement, “I felt comfortable sharing my honest feedback/input.” 83 percent strongly agreed. 11 percent somewhat agreed. The rest of the participants strongly disagreed. Overall, the net agreement with this statement was 94 percent.
- For the statement, “I felt the session was a good use of my time.” 79 percent strongly agreed. 18 percent somewhat agreed. The rest of the participants strongly disagreed. Overall, the net agreement with this statement was 97 percent.
- For the statement, “I had a chance to meaningfully share the challenges I’ve faced.” 79 percent strongly agreed. 18 percent somewhat agreed The rest of the participants strongly disagreed. Overall, the net agreement with this statement was 97 percent.
- For the statement, “I had meaningful opportunities to provide feedback on how to improve the service relationship between the Canada Revenue Agency and Canadians.” 79 percent strongly agreed. 18 percent somewhat agreed. The rest of the participants strongly disagreed. Overall, the net agreement with this statement was 97 percent.
- For the statement, “I had the chance to share my thoughts on how to increase the confidence of Canadians in the Canada Revenue Agency’s approach and commitment to.” 82 percent strongly agreed. 14 percent somewhat agreed. The rest of the participants strongly disagreed. Overall, the net agreement with this statement was 96 percent.
- For the statement, “I understand how my input will be used to influence the service transformation initiatives of the Canada Revenue Agency.” 52 percent strongly agreed. 34 percent somewhat agreed. 10 percent were neutral. The rest of the participants strongly disagreed. Overall, the net agreement with this statement was 86 percent.
- For the statement, “I have confidence in the Canada Revenue Agency’s overall ability and commitment to improve service for Canadians.” 54 percent strongly agreed. 39 percent somewhat agreed. The rest of the participants were either neutral or strongly disagreed. Overall, the net agreement with this statement was 93 percent.
- For the statement, “The format of the session enabled my best participation” 59 percent strongly agreed. 37 percent somewhat agreed. The rest of the participants strongly disagreed. Overall, the net agreement with this statement was 96 percent.

Text description for Advocate Session Participant Feedback on Pace of Discussion graph
- This chart expresses the how Advocate Session Participants felt about the pace of discussion. 7 percent felt the pace was too fast. 93 percent felt the pace was just right.
Appendix C – Online Consultation Design
Serving Canadians Better - Online Consultation
About your service experience with the Canada Revenue Agency
Tell us about your experience with us.
1. Which of the following best describes you?
Individual taxpayer (e.g. wage/salary earner and/or benefit recipient)
Tax preparer/professional
Self-employed individual
Business owner
Other2. How often have you interacted with the CRA over the past 12 months?
I haven't interacted with the CRA
Only once
2 – 3 times
4 or more times3. Have you had a service experience with the CRA that met your needs?
Yes No (skip to 4)A. Through what channel(s) did you have this interaction? (check all that apply)
Online
Telephone
Mail
Fax
Other, please specifyB. On a scale of 1 – 10 where, 1 is poor and 10 is excellent, how would you rate this experience?
Poor - 1 2 3 4 5 6 7 8 9 10 - Excellent
C. What went well during this interaction? (90 word limit)
D. [If below 10] – What would we need to change or do to get a rating of 10? (90 word limit)
4.
Have you had a service experience with the CRA that did NOT meet your needs?
Yes No (go to submit button)A. Through what channel(s) did you have this interaction?
(check all that apply)Online Telephone
Mail Fax
Other, please specifyB. On a scale of 1 – 10 where, 1 is poor and 10 is excellent, how would you rate this experience?
Poor - 1 2 3 4 5 6 7 8 9 10 - Excellent
C. What didn’t go well in this interaction? (90 word limit)
D. [If below 10 – assumed all responses will be below 10 for this section] What would the CRA have needed to do to get a higher rating than you have given? (90 word limit)
Tell us what you think about our service improvements so far
1. We have made several changes at the CRA to improve service and we have heard that Canadians may not know about them. Please let us know which of the following services you know about. [For each service improvement, participants will be asked the following questions:
- Were you aware of this improvement?
Yes No I don't know - [If yes to 1a] Have you ever used this service?
Yes No I don't know - [If yes to 1b] Would you use it again?
Yes No I don't know - {only asked if no or I don't know in 1a] Now that you are aware of this service, do you think you would use it in the future?
Yes No I don't know
No, because it is not applicable to me - e) Do you have any feedback about this service? [Open-ended response]
- Tax forms that fill themselves out (almost!) – Many tax-filing software programs offer the CRA's Auto-fill my return. This secure service saves people time by filling in parts of their tax forms with the information the CRA has available at that time.
- Improved telephone service – Now when you call, you will hear an estimated wait time to speak with an agent. You can then decide to wait in the queue, call back later, or use our
- File your taxes over the phone with File My Return – Those who are eligible with a low or fixed income are invited to file their income tax and benefit returns through an automated phone service. File My Return is free, secure, and easy to use, with no paper forms to fill out or calculations to do.
- Community Volunteer Income Tax Program (CVITP) – If you have a modest income and a simple tax situation, a volunteer from the CVITP may be able to do your taxes for you for free.
- View transactions and pay balances with MyCRA app – This app lets you view and pay your account balance with your Visa® Debit, Debit MasterCard®, or Interac® Online debit card. You can also pay by pre-authorized debit, as well as at any Canada Post outlet for a fee by generating a quick response (QR) code.
- Pay taxes in person at Canada Post – You can pay your individual tax, benefits and credits repayments, and most business payments to the CRA in person with cash or a debit card at any Canada Post outlet for a fee.
- Online Mail – You can now get an email notification when certain mail is available to view in My Account and MyCRA mobile web app, or when there are important changes made to your account, such as an address or direct deposit update.
- ReFILE lets you adjust your return using your tax software – The ReFILE service lets you change your tax return after you receive your notice of assessment using your tax software.
- Mailing a paper Income Tax Package to your home – The CRA mails the new all-in-one 2018 Income Tax Package to Canadians who paper filed in the previous tax season.
- Tax filing services for Northern residents – As part of the Northern Service Improvement Strategy, three new CRA Northern Service Centres provide a year-round in-person presence to support individuals and businesses in Yukon, Northwest Territories, and Nunavut.
- Express Notice of Assessment (NOA) - If you file electronically, you will be able to view your NOA right after your return has been received and processed by the CRA.
Tell us about our future direction
1. Now that you may be aware of some of our changes, we want to know if you think we are moving in the right direction to improve service. A list and description of some of our service improvements can be viewed here.
Please rate on a scale of 1 to 5, where 1 is not at all confident and 5 is completely confident, how confident you are that the CRA is heading in the right direction
1
Not at all confident
2
3
Somewhat confident
4
5
Completely confident
What other changes (if any) should we consider to show our commitment to improving service? (90 word limit)
2. We want to keep you informed of the changes we are making to improve service at the CRA.
Pick the top 3 ways you would want us to communicate this information to you.
- Online mail (through My Account)
- Our website
- Through an accountant or tax preparer
- Through my tax software
- CRA Twitter
- CRA Facebook
- CRA’s YouTube Channel
- CRA’s LinkedIn
- Other, please specify
a) Are there any other ways in which you would want us to communicate with you? (30 word limit)
3. What three words come to mind when you think of the CRA? a)___________ b)___________ c)___________
4. What do you value most about the CRA? (90 word limit)
5. Our goal is for Canadians to see us as trusted, fair, and helpful by putting people first.
- Do you think we have reached our goal?
Yes No I don't know - [If no, or I don't know] What do you think we need to do to reach our goal for each of the following ?
- Trusted – [Open End Comment Box]
- Fair – [Open End Comment Box]
- Helpful by putting people first – [Open End Comment Box]
- Please rank the following values in order of importance to you when dealing with the CRA:
Fair
Trusted
Helpful by putting people first