
President of the Treasury Board’s Fees Report for the 2020-21 Fiscal Year
On this page

President’s message

President of the Treasury Board
On behalf of the Government of Canada, I am pleased to present the annual Fees Report, which consolidates information on government fees from the 2020–21 fiscal year. This report supports openness, transparency and accountability by providing Canadians with a government-wide view of fees charged by departments during this period.
This is the fourth report since the government modernized the way fees are charged to businesses and individuals through the Service Fees Act and the Directive on Charging and Special Financial Authorities. A key element of this modernized system is the requirement that all departments that charge fees provide detailed information on the fees and on their service standards. The result is greater transparency, improved oversight and more accountability to Parliament and Canadians.
This report includes new information on remissions (reimbursements) of fees, in whole or in part, to fee-payers. In 2020–21, eight departments had the authority to issue remissions under an authority other than the Service Fees Act. As of April 1, 2021, all departments with the authority to charge fees under the Service Fees Act have been required to remit a portion of the fee in cases where the service standard has not been met. Those remissions will be reported in next year’s report and will help keep departments accountable for meeting their service standards, leading to better service for those who pay fees.
I encourage you to read this report to learn how we are working to provide value to Canadians.
Original signed by
The Honourable Mona Fortier, P.C., M.P.
President of the Treasury Board
About this report
The Service Fees Act (SFA), which came into force on June 22, 2017, modernized the Government of Canada’s fee regime and established a solid foundation for departmentsFootnote 1, while providing fee payers with information on the level of service that they can expect.
The information in this report has been extracted from Departmental Fees Reports that were tabled under section 20 of the SFA and subsections 4.2.8 and 6.3 of the Treasury Board Directive on Charging and Special Financial Authorities. Departmental Fees Reports contain information about all fees that are under departmental authority, even if some or all of the fees were collected by another department. This report also outlines the various types of fee adjustments and authorities that allow departments to issue remissions.
Fees charged by departments under the Access to Information Act (ATIA) are subject to the SFA, but they are not included in Departmental Fees Reports. Information about each department’s fees for access to information for the 2020–21 fiscal year is reported and tabled in their department’s annual access to information report and posted on each department’s website. In order to carry out the duties related to the ATIA, departments listed in Schedules I, I.1 and II of the Financial Administration Act (FAA) collected $656,950 in revenue, incurred $83,525,510 in costs and waived $29,235 in fees. The Access to Information and Privacy Statistical Report for the 2020 to 2021 Fiscal Year can be found at Statistics on the Access to Information and Privacy Acts.
This consolidated report provides an overview of government-wide fees and has been broken down into the following sections:
- the Fees section provides information on the types of fees that are charged and the number of fees that were reported and tabled in Parliament
- the Revenue section provides information on total revenue from fees, along with highlights for the three revenue streams
- the Fee adjustments section summarizes the different mechanisms to adjust fees, including the SFA requirement for an automatic annual adjustment
- the Service standards and remissions section describes the purpose of a service standard, explains remissions and summarizes the types of authorities that exist, and the amount of remissions issued by department.
Fees
Under the Directive on Charging and Special Financial Authorities,all departments that charge fees must produce a fees report, regardless of whether they are exempt from the SFA.
The Government of Canada has three mechanisms for departments to set fees for the provision of a service, the provision of the use of a facility, the conferral by the means of a licence, permit or other authorization of a right or privilege, or for a provision of a product, and for recovery, in whole or in part, of costs that are incurred in relation to a regulatory scheme:
-
Fees set by contract: Ministers have the authority to enter into contracts, which are usually negotiated between the Minister and an individual or an organization, and which cover fees and other terms and conditions. In some cases, that authority may also be provided by an act of Parliament.
Example: services provided to a foreign government to implement a Canadian regulatory model
-
Fees set by market rate or auction: The authority to set these fees is pursuant to an act of Parliament or regulation, and the Minister, department or Governor in Council has no control over the fee amount.
Example: auction of a licence to the highest bidder that meets the pre‑established regulatory requirements
-
Fees set by act, regulation or fees notice: An act of Parliament delegates the fee-setting authority to a department, Minister or Governor in Council.
Example: a fixed fee for the review of an application for a licence to operate in Canada
A total of 39,349 fees set by act, regulation or fees notice were reported and tabled in Parliament by departments in the 2020–21 fiscal year (compared to 38,792 such fees in the 2019–20 fiscal year). During the 2020–21 fiscal year, 519 new fees were introduced, 389 fees were eliminated and 3,523 fees were under review. Table 1 highlights the 10 departments that charge the most fees set by act, regulation or fees notice, and provides a total of such fees for all other departments. The fees below reflect the individual fees that departments have the authority to charge.
| Rank | Department | Number of fees | Percentage of total revenue generated by fees set by act, regulation or fees notice (%)table 1 note * |
|---|---|---|---|
| 1 | National Film Board | 30,032 | >0.01 |
| 2 | Parks Canada | 3,622 | 3.05 |
| 3 | Transport Canada | 2,279 | 1.03 |
| 4 | Canadian Food Inspection Agency | 852 | 2.22 |
| 5 | Innovation, Science and Economic Development Canada | 520 | 24.81 |
| 6 | Fisheries and Oceans Canada | 482 | 3.41 |
| 7 | National Research Council Canada | 258 | 0.13 |
| 8 | Natural Resources Canada | 230 | 0.19 |
| 9 | Health Canada | 221 | 8.62 |
| 10 | Canadian Nuclear Safety Commission | 165 | 4.88 |
| N/A | All other departments (24) | 688 | 51.66 |
| Total | 39,349 | 100.00 | |
Table 1 Notes
|
|||
Revenue
When fees are collected from fee payers, they are treated as revenue by the Government of Canada. As mentioned in the Fees section, there are three types of fees that generate revenue.
In the spirit of open and transparent fee management, departments must disclose lump‑sum amounts for fees set by contract and fees set by market rate or auction, and provide greater detail for fees set by act, regulation or fees notice.
In the 2020–21 fiscal year, the Government of Canada collected approximately $5.6 billion in fees:
- fees set by contract made up 57.02% of the fees collected
- fees set by market rate or auction made up 1.24% of the fees collected
- fees set by act, regulation or fees notice made up 41.74% of the fees collected
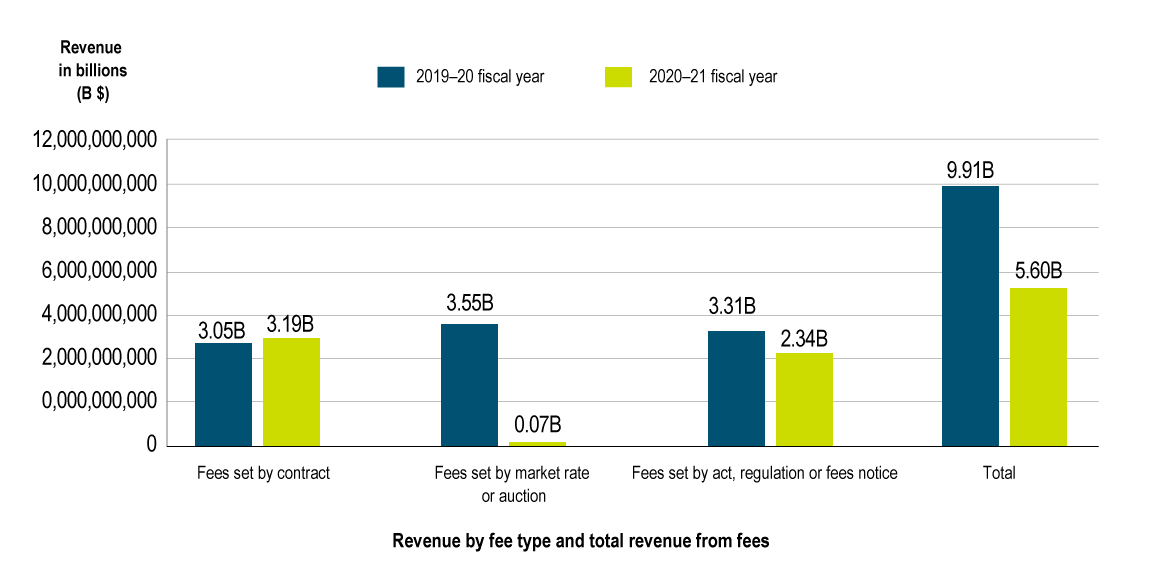
Figure 1 - Text version
| 2019–20 fiscal year | 2020–21 fiscal year | |
|---|---|---|
| Fees set by contract | 3,046,354,160 | 3,193,291,576 |
| Fees set by market rate or auction | 3,553,637,911 | 69,608,380 |
| Fees set by act, regulation or fees notice | 3,308,130,020 | 2,337,650,388 |
| Total | 9,908,122,091 | 5,600,550,344 |
Figure 1 Notes
|
||
Fees set by contract
Table 2 highlights the top 10 departments by revenue generated by fees set by contract during the 2020–21 fiscal year.
| Rank | Department | 2020-21 revenue ($) | Percentage of total revenue (%)table 2 note * |
|---|---|---|---|
| 1 | Royal Canadian Mounted Police | 2,485,497,936 | 77.83 |
| 2 | Public Services and Procurement Canada | 229,550,502 | 7.19 |
| 3 | Canada Revenue Agency | 131,401,652 | 4.11 |
| 4 | National Research Council Canada | 131,310,686 | 4.11 |
| 5 | Environment and Climate Change Canada | 71,567,539 | 2.24 |
| 6 | Global Affairs Canada | 42,070,069 | 1.32 |
| 7 | Parks Canada | 30,858,345 | 0.97 |
| 8 | Statistics Canada | 22,135,093 | 0.69 |
| 9 | National Defence | 17,960,609 | 0.56 |
| 10 | Natural Resources Canada | 13,155,063 | 0.41 |
| N/A | All other departments (15) | 17,784,082 | 0.56 |
| Total | 3,193,291,576 | 100.00 | |
Table 2 Notes
|
|||
During the 2019–20 fiscal year, $3,046,354,160 in fees set by contract were collected by the Government of Canada, whereas in the 2020–21 fiscal year, $3,193,291,576 in such fees were collected, which represents an increase of $146,937,416 (4.82%).
Fees set by market rate or auction
Table 3 lists the three departments that reported revenue generated by fees set by market rate or auction during the 2020–21 fiscal year.
| Rank | Department | 2020-21 revenue ($) | Percentage of total revenue (%)table 3 note * |
|---|---|---|---|
| 1 | Innovation, Science and Economic Development CanadaFootnote 2 | 40,962,956 | 58.85 |
| 2 | Public Services and Procurement Canada | 23,165,831 | 33.28 |
| 3 | National Research Council Canada | 5,479,593 | 7.87 |
| Total | 69,608,380 | 100.00 | |
Table 3 Notes
|
|||
In the 2020–21 fiscal year, these three departments reported a total revenue of $69,608,380 in fees set by market rate or auction, which is $3,484,029,531 (98.04%) less than the $3,553,637,911 that was reported in the 2019–20 fiscal year.
Fees set by act, regulation or fees notice
In the 2020–21 fiscal year, the Government of Canada collected $2,337,716,072 in revenue from fees set by act, regulation or fees notice. This represents a decrease of $970,413,948 (29.33%) compared to the 2019–20 fiscal year.
Table 4 highlights:
- the top 10 departments by revenue generated by fees set by act, regulation or fees notice during the 2020–21 fiscal year, which accounted for 88.96% of all revenue collected
- the variances from the 2019–20 fiscal year to the 2020–21 fiscal year
| Rank | Department | 2019-20 revenue ($) | 2020-21 revenue ($)table 4 note * | Variance in revenue from 2019-20 to 2020-21 ($) | Percentage variance from 2019-20 to 2020-21 (%) | Percentage of total 2020-21 revenue (%)table 4 note * |
|---|---|---|---|---|---|---|
| 1 | Innovation, Science and Economic Development Canada | 585,900,964 | 579,965,204 | -5,935,760 | -1.01 | 24.81 |
| 2 | Immigration, Refugees and Citizenship Canada | 1,347,919,501 | 527,688,691 | -820,230,810 | -60.85 | 22.57 |
| 3 | Health Canada | 178,300,057 | 201,488,969 | 23,188,912 | 13.01 | 8.62 |
| 4 | Office of the Superintendent of Financial Institutions | 178,078,609 | 189,079,559 | 11,000,950 | 6.18 | 8.09 |
| 5 | Canadian Radio-television and Telecommunications Commission | 188,871,192 | 122,351,386 | -66,519,806 | -35.22 | 5.23 |
| 6 | Canada Energy Regulator | 107,301,775 | 115,741,450 | 8,439,675 | 7.87 | 4.95 |
| 7 | Canadian Nuclear Safety Commission | 118,472,534 | 114,005,416 | -4,467,118 | -3.77 | 4.88 |
| 8 | Fisheries and Oceans Canada | 90,048,967 | 79,807,345 | -10,241,622 | -11.37 | 3.41 |
| 9 | Canadian Grain Commission | 60,384,688 | 78,267,744 | 17,883,057 | 29.62 | 3.35 |
| 10 | Parks Canada | 125,804,252 | 71,223,743 | -54,580,509 | -43.39 | 3.05 |
| Subtotal | 2,981,082,539 | 2,079,619,508 | -901,463,031 | -0.30 | 88.96 | |
| N/A | All other departments (24) | 327,047,481 | 258,096,564 | -68,950,917 | -0.21 | 11.04 |
| Total | 3,308,130,020 | 2,337,716,072 | -970,413,948 | -0.29 | 100.00 | |
Table 4 Notes
|
||||||
The following are variance explanations provided by the top 10 revenue-generating departments.
1. Innovation, Science and Economic Development
Innovation, Science and Economic Development’s (ISED) Fees Report reflects seven fee groupings:
- Competition and Law Enforcement
- Federal Incorporation
- Insolvency
- Intellectual Property
- Spectrum and Telecommunications
- Support and Financing for Small Business
- Trade Measurement
Except for Spectrum and Telecommunications, which experienced an increase in revenue, the remaining fee groupings saw a decrease in revenue compared to the previous year.
ISED revenues decreased for a number of fees, mainly due to reductions in mergers and insolvencies filed, as well as reductions to trademark and new loan registrations as a result of the COVID‑19 pandemic and related economic downturn in certain industries.
2. Immigration, Refugees and Citizenship Canada
Air travel and border measures were implemented to protect the health and safety of Canadians by restricting discretionary international travel in 2020 and 2021. These restrictions led to a decrease in revenue across all business lines.
3. Health Canada
The variance is the result of a $44-million increase in drugs and medical devices revenues offset by a $21-million decrease in cannabis revenues. The $44-million increase in drugs and medical devices revenues is due to the Fees in Respect of Drugs and Medical Devices Order that came into effect on April 1, 2020, where fees will be increasing substantially until the 2023–24 fiscal year. The decrease in cannabis revenues of $21 million is due to the Order Amending the Cannabis Fees Order (Extension of Deadline for Payment of 2020–2021 Annual Fee) that deferred the annual fee payment due date from September 30, 2020, to March 31, 2021. Only revenues received by March 31, 2021, are being reported in 2020–21. The remaining outstanding revenues will be reported in 2021–22.
4. Office of the Superintendent of Financial Institutions
Fee revenue is adjusted each year to fully recover actual costs; therefore, the variance was mainly driven by an increase in the Office of the Superintendent of Financial Institutions’ operating costs. Although the total number of assessments remained stable, the cost per individual assessment increased.
5. Canadian Radio-television and Telecommunications Commission
The significant decrease in fee revenue for the Canadian Radio-television and Telecommunications Commission when compared to 2019–20 is due to remission orders.
In response to the crisis caused by the COVID‑19 global pandemic, two remission orders were granted pursuant to subsection 23(2.1) of the FAA in 2020–21 to provide support to the broadcasting industry and to Canada’s broadcasting system:
- P.C. 2020-0338 granted a remission of the Part I broadcasting licence fees paid or payable by all licensees under paragraph 3(a) of the Broadcasting Licence Fee Regulations, 1997, in respect of the 2020–21 fiscal year
- P.C. 2020-1060 granted a remission of the Part I broadcasting licence fees paid or payable to eligible local television and radio stations under the Broadcasting Licence Fee Regulations, 1997, in respect of the 2020–21 fiscal year
6. Canada Energy Regulator
The Canada Energy Regulator (CER) is funded through parliamentary appropriations. The Government of Canada recovers approximately 99% of the appropriations from the industry that the CER regulates. All collections from cost recovery invoices are deposited to the account of the Receiver General for Canada credited to the Consolidated Revenue Fund. The process is regulated by the National Energy Board Cost Recovery Regulations. Revenues reflected are based on the actual costs incurred in that year. The increase is mainly due to increased costs associated with the SAP implementation project and information and technology hardware updates, offset by decreased costs associated with travel as a result of COVID‑19 pandemic restrictions.
7. Canadian Nuclear Safety Commission
The decrease in revenue is attributable to a decrease in cost recovery due largely to reduced spending on travel, temporary personnel, and professional services as a consequence of adapting to a remote workplace and pandemic limitations.
8. Fisheries and Oceans Canada
The decrease in revenue collected is largely apparent in the Canadian Coast Guard fees due to a decrease in vessel traffic in 2020–21 as a result of the COVID‑19 pandemic. There was also a decrease in the sale of certain paper charts under Canadian Hydrographic Services, as some charts are now available in a digital format free of charge.
9. Canadian Grain Commission
The Canadian Grain Commission’s revenue is largely determined by two specific fees (Official Inspection of Ships and Official Weighing of Ships). The fees charged are driven by overall tonnage inspected and weighed by the organization. Overall tonnage of grain is variable from year to year.
In 2020–21, the Canadian Grain Commission provided official inspection and weighing for approximately 50.3 million tonnes of grain. In 2019–20, the Canadian Grain Commission provided official inspection and weighing for approximately 38.6 million tonnes of grain.
This increase, of approximately 11.6 million metric tonnes of grain, is the primary reason for the increase in revenue from 2019–20 to 2020–21.
10. Parks Canada
In spring 2020, Parks Canada temporarily suspended visitor access and services across the country for several weeks while it adapted its operations and services to minimize the risks of COVID‑19 to visitors and employees. Services resumed in June 2020 at a reduced number of locations and with a reduced number of visitor experiences. This temporary suspension of services, the reduced visitor offer, and changes in travel patterns arising from the public health restrictions required to flatten the curve of the COVID‑19 pandemic led to reduced visitor revenues for Parks Canada in 2020–21.
Fee adjustments
-
In this section
Prior to the coming into force of the SFA in 2017, certain fees set by act, regulation or fees notice had periodic adjustments to keep up with inflationary increases; however, a considerable number of fees did not have any mechanism to keep pace with the impact of inflation on the cumulative cost of delivering the service or product.
In order to ensure that departments are able to keep up with inflation for delivering services, the SFA introduced an automatic annual adjustment. All fees set by act, regulation or fees notice are subject to this annual adjustment by default.
In certain circumstances, some fees are not subject to the annual adjustment set out in the SFA, as another act of Parliament prescribes a periodic adjustment, or they are exempt from the SFA. Furthermore, if a fee is considered to be a low-materiality fee, according to the Low-Materiality Fees Regulations, the SFA’s annual adjustment is not applicable.
Service Fees Act annual adjustment
Subsection 17(1) of the SFA requires responsible authorities to adjust their applicable fees each fiscal year by the percentage change over 12 months in the April All-items Consumer Price Index (CPI) for Canada, as published by Statistics Canada.
The 2020–21 Departmental Fees Reports include a CPI adjustment, based on the CPI for April 2019, of 2.0% for applicable fees.
Periodic adjustment
A periodic fee adjustment is made pursuant to an act of Parliament or regulation and is applied according to an established frequency, based on a specific rate, formula or other factor, other than the adjustment rate set out in subsection 17(1) of the SFA.
Service standards and remissions
-
In this section
In order to improve services to fee payers, the SFA requires that applicable fees have an established service standard. A service standard is a public commitment to provide a service in a way that is measurable and relevant to the fee payers under normal circumstances.
Additionally, to ensure accountability, the SFA introduced the requirement to remit. A remission is a partial or full return of a fee to a fee payer when a department deems that the relevant service standard was not met.
The requirement to remit under the SFA took effect on April 1, 2021. Departments will be reporting on remissions issued pursuant to the SFA for the first time in their 2021–22 Departmental Fees Reports, which will be published during the 2022–23 fiscal year.
Service standards
The Low-Materiality Fees Regulations established criteria that define what low-materiality fees are, and which fees are not required by the SFA to establish service standards in order to provide a more cost-effective way for departments to administer low-materiality fees.
Table 5 provides a breakdown of the 39,349 fees and their requirements with respect to service standards, outlining which ones are subject to sections 4 to 7 of the SFA and which ones are not applicable.
| Fee type and applicable | Number of feestable 5 note * |
|---|---|
| Fees subject to the SFA that require a service standard | 4,370 |
| Fees subject to the SFA that are not required to have a service standard (the fee is for the provision of a product or the recovery, in whole or in part, of costs that are incurred in relation to a regulatory scheme or the fee is set by contract; refer to subsection 3(1) and 3(2)(a) of the SFA) | 31,609 |
| Fees subject to the SFA that have obtained an exemption based on section 22 of the SFA and the Low-Materiality Fees Regulations | 3,182 |
| Fees not subject to the SFA according to other enabling legislation | 188 |
| Total | 39,349 |
Table 5 Notes
|
|
Of the 4,370 fees that require service standards according to the SFA, departments reported that, as of March 31, 2021, 2,556 fees had existing service standards. Departments continue to work toward establishing service standards for their remaining fees to comply with the SFA. For departments that charge fees set by act, regulation or fees notice, information about service standards and corresponding performance results can be found in the “Details on each fee set by act, regulation or fees notice” section of their Departmental Fees Reports.
Remissions
The SFA requires departments to remit the portion of a fee that they consider appropriate to an affected fee payer when a service standard has been deemed not met. Furthermore, departments must issue the remission before July 1 of the following fiscal year.
Departments must develop policies to determine whether a service standard has been met and how much of a fee will be remitted to a fee payer, according to the Directive on Charging and Special Financial Authorities. The departmental remission policy and procedures were to be available to the public on April 1, 2021.
Other Treasury Board policies and directives may require fees to have an established service standard; however, those fees may not be subject to remissions under the SFA because they have qualified for a non-application of certain sections of the SFA.
The 2020–21 Departmental Fees Reports include remissions issued under departments’ enabling legislation or the FAA. They do not include remissions issued under the authority of the SFA. Departments will be reporting on remissions issued under the SFA for the first time in their 2021–22 Departmental Fees Reports, which will be published during the 2022–23 fiscal year.
Authorities to remit
With regard to fees, there are different authorities that allow departments to remit fees under different circumstances. The following are the various authorities that exist.
Authority to remit pursuant to the Service Fees Act
Subsection 7(2) of the SFA provides the authority to remit the appropriate portion of a fee only when a service standard in relation to that fee has been deemed not met. The remission is to be made in accordance with the Treasury Board Directive on Charging and Special Financial Authorities and the departmental remission policy.
Authority to remit pursuant to the Financial Administration Act
Departments may submit a Treasury Board submission to the Governor in Council in order to obtain an authority to remit via the FAA. If granted, the authority may be provided for a specific fee or for a designated period. This type of authority is sought to remit on a matter that may be other than the authority provided by the SFA (that is, for service standards that were deemed not met).
Authority to remit pursuant to other acts of Parliament
Certain departments have received an authority to remit fees via their enabling act or acts and may remit depending on the context and the wording in the act and related regulations, which may be for reasons other than a service standard that was deemed not met.
Remissions issued
Table 6 provides information on the eight departments that had the authority to issue remissions in 2020–21 from an authority other than the SFA. Because remission requirements under the SFA took effect only on April 1, 2021, those remissions will be reported for the first time, as applicable, in the President of the Treasury Board’s Fees Report for the 2021–22 Fiscal Year, which will be published in 2023.
| Rank | Department | Remissions issued ($) | Percentage of revenue from fees set by act, regulation, fees notice, auction and market rate (%)table 6 note * |
|---|---|---|---|
| 1 | Canadian Radio-television and Telecommunications Commission | 68,820,713 | 2.86 |
| 2 | Department of Justice Canada | 4,561,281 | 0.19 |
| 3 | Employment and Social Development Canada | 2,777,000 | 0.12 |
| 4 | Canada Energy Regulator | 1,241,925 | 0.05 |
| 5 | Canadian Food Inspection Agency | 1,169,347 | 0.05 |
| 6 | Health Canada | 190,252 | 0.01 |
| 7 | Immigration, Refugees and Citizenship Canada | 24,050 | >0.01 |
| 8 | National Film Board | 3,513 | >0.01 |
| Total | 78,788,081 | 3.27 | |
Table 6 Notes
|
|||
Appendix: links to departmental fees reports for the 2020–21 fiscal year
Listed below are links to the Departmental Fees Reports for the 2020–21 fiscal year. Each report contains information on specific departmental fee regimes, including:
- financial information regarding the total costs of, total revenues generated by and any remissions of:
- fees set by contract
- fees set by market rate or auction
- fees set by act, regulation or fees notice
- for each fee, detailed information about:
- the date that the fee was introduced and last amended, if applicable
- the dollar amount of the fee in the 2020–21 fiscal year
- the adjusted dollar amount of fees for the 2022–23 fiscal year, if applicable
- service standards, if applicable
- performance results against these standards
Links to Departmental Fees Reports for the 2020–21 fiscal year:
Institutions - A to Z Menu:
A B C D E F G H I J K L M N O P Q R S T U V W X Y ZInstitutions starting with the letter A
Institutions starting with the letter C
- Canada Border Services Agency
- Canada Energy Regulator
- Canada School of Public Service
- Canada Revenue Agency
- Canadian Food Inspection Agency
- Canadian Grain Commission
- Canadian Heritage
- Canadian Nuclear Safety Commission
- Canadian Radio‑television and Telecommunications Commission
- Canadian Space Agency
- Crown‑Indigenous Relations and Northern Affairs Canada
Institutions starting with the letter D
Institutions starting with the letter E
Institutions starting with the letter F
Institutions starting with the letter G
Institutions starting with the letter H
Institutions starting with the letter I
Institutions starting with the letter L
Institutions starting with the letter N
Institutions starting with the letter O
Institutions starting with the letter P
Institutions starting with the letter R
Institutions starting with the letter S
Institutions starting with the letter T
© Her Majesty the Queen in Right of Canada, represented by the President of the Treasury Board, 2022,
ISSN: 2562 413X