
President of the Treasury Board’s Fees Report for the 2022–2023 Fiscal Year
On this page
President’s message

President of the Treasury Board
On behalf of the Government of Canada, I am presenting the President of the Treasury Board’s Fees Report for the 2022–23 Fiscal Year.
All levels of governments can charge fees to offset the cost of providing a service or a good, such as parking, access to national and provincial parks and campsites, licences and permits.
The Government of Canada is committed to the responsible management of, and transparent reporting on, its activities including the fees it charges.
Through the Service Fees Act and the Directive on Charging and Special Financial Authorities, departments with the authority to charge fees are required to table annual reports in Parliament.
These reports include information on the number and types of fees charged, as well as departments’ total revenue, information on fee adjustments and on service standards and total remissions issued, where applicable, within a particular fiscal year.
This annual Fees Report provides Parliament and Canadians with a consolidated, government-wide view of fees charged by departments and agencies during the 2022–23 fiscal year.
I invite you to read this report to learn more about how the government is providing value for Canadians.
Original signed by
The Honourable Anita Anand, P.C., M.P.
President of the Treasury Board
About this report
The Service Fees Act (SFA), which came into force on June 22, 2017, modernized the Government of Canada’s fee regime and established a solid foundation for departments,Footnote 1 while providing fee payers with information on the level of service that they can expect.
The information in this report has been extracted from Departmental Fees Reports that were tabled under section 20 of the SFA and subsections 4.2.8Footnote 2 and 6.3 of the Treasury Board Directive on Charging and Special Financial Authorities. Departmental Fees Reports contain information about all fees that are under departmental authority, even if some or all of the fees were collected by another department. This report also outlines the various types of fee adjustments and authorities that allow departments to issue remissions.
Fees charged by departments under the Access to Information Act (ATIA) are no longer subject to the SFA. Information about each department’s fees for access to information is reported and tabled in its annual access to information report and posted on each department’s website. The Access to Information and Privacy Statistical Report can be found at Statistics on the Access to Information and Privacy Acts.
This consolidated report provides an overview of government-wide fees and is broken down into the following sections:
- the Fees section provides information on the types of fees that are charged and the number of fees that were reported and tabled in Parliament
- the Revenue section provides information on total revenue from fees, along with highlights for the three revenue streams
- the Fee adjustments section summarizes the different mechanisms for adjusting fees, including the SFA requirement for an automatic annual adjustment
- the Service standards and remissions section describes the purpose of a service standard, explains remissions and the types of authorities that exist, and provides a breakdown of the remissions issued by departments
Fees
Under the Directive on Charging and Special Financial Authorities, all departments that charge fees must produce a fees report, regardless of whether they are exempt from the SFA.
The Government of Canada has three mechanisms for departments to set fees for the provision of a service, the provision of the use of a facility, the conferral by the means of a licence, permit or other authorization of a right or privilege, the provision of a product, or the provision of a regulatory process:
- Fees set by contract: Ministers have the authority to enter into contracts, which are usually negotiated between the Minister and an individual or an organization, and which cover fees and other terms and conditions. In some cases, that authority may also be provided by an act of Parliament.
Example: services provided under a cost-sharing arrangement with other orders of government - Fees set by market rate or auction: The authority to set these fees is pursuant to an act of Parliament or regulation, and the Minister, department or Governor in Council has no control over the fee amount.
Example: auction of a licence to the highest bidder that meets the pre-established regulatory requirements - Fees set by act, regulation or fees notice: An act of Parliament delegates the fee-setting authority to a department, Minister or Governor in Council.
Example: a fixed fee for the review of an application for a licence to operate in Canada
A total of 37,674 fees set by act, regulation or fees notice were reported in Parliament by departments in the 2022–23 fiscal year (compared to 38,741 such fees in the 2021–22 fiscal year). During the 2022–23 fiscal year, 1,115 new fees were introduced, 2,185 fees were eliminated, and 4,770 fees were under review. Table 1 shows, for the 10 departments that had the most fees set by act, regulation or fees notice, the number of fees each department had the authority to charge and the percentage of total revenue these fees represent. It also provides a total of such fees for all other departments.
| Rank | Department | Number of fees | Percentage of total revenue generated by fees set by act, regulation or fees noticeFootnote * Footnote † |
|---|---|---|---|
| 1 | National Film Board | 30,071 | < 0.01 |
| 2 | Transport Canada | 2,242 | 0.73 |
| 3 | Parks Canada | 1,878 | 3.58 |
| 4 | Canadian Food Inspection Agency | 845 | 1.28 |
| 5 | Innovation, Science and Economic Development Canada | 539 | 15.22 |
| 6 | Fisheries and Oceans Canada | 525 | 2.20 |
| 7 | National Research Council Canada | 225 | 0.08 |
| 8 | Health Canada | 222 | 6.57 |
| 9 | Natural Resources Canada | 212 | 0.13 |
| 10 | Canadian Heritage | 181 | 0.19 |
| Other | All other departments (24) | 735 | 70.01 |
| Total | 37,674 | 100.00 | |
Revenue
In this section
When fees are collected from fee payers, they are treated as revenue by the Government of Canada. As mentioned in the Fees section, there are three types of fees.
In the spirit of open and transparent fee management, departments must:
- disclose lump‑sum amounts for fees set by contract and fees set by market rate or auction
- provide greater detail for fees set by act, regulation or fees notice.
In the 2022–23 fiscal year, the Government of Canada collected approximately $7.92 billion in fees:
- fees set by contract made up 47% of the fees collected
- fees set by market rate or auction made up 1% of the fees collected
- fees set by act, regulation or fees notice made up 52% of the fees collected
Figure 1 shows the revenue generated in fiscal years 2021–22 and 2022–23, by fee type.
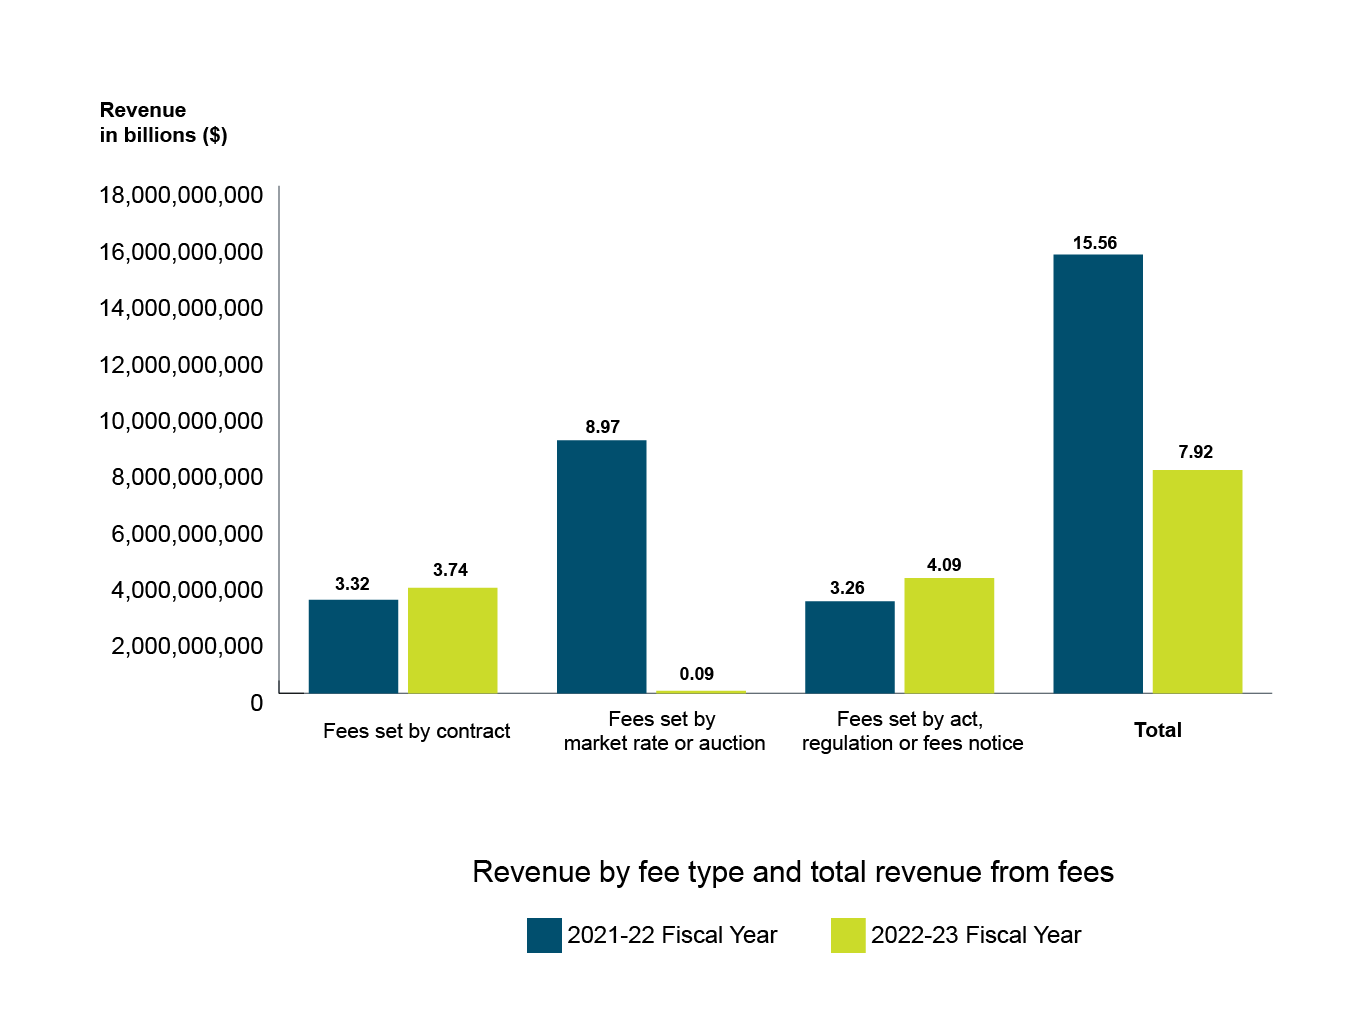
Figure 1 - Text version
| 2021-22 fiscal year | 2022-23 fiscal year | |
|---|---|---|
| Fees set by contract | 3,323,805,564 | 3,742,444,802 |
| Fees set by market rate or auction | 8,975,791,196 | 88,944,160 |
| Fees set by act, regulation or fees notice | 3,268,326,066 | 4,088,454,931 |
| Total | 15,567,922,826 | 7,919,843,893 |
Fees set by contract
Table 2 shows, for the 2022–23 fiscal year, the 10 departments that had the most revenue generated by fees set by contract and the total revenue generated by these fees for all other departments.
| Rank | Department | 2022–23 revenue ($) Footnote † | Percentage of total revenueFootnote * Footnote † |
|---|---|---|---|
| 1 | Royal Canadian Mounted Police | 2,865,487,019 | 76.57 |
| 2 | Public Services and Procurement Canada | 252,874,307 | 6.76 |
| 3 | Canada Revenue Agency | 222,796,917 | 5.95 |
| 4 | National Research Council Canada | 157,654,057 | 4.21 |
| 5 | Environment and Climate Change Canada | 74,488,576 | 1.99 |
| 6 | Global Affairs Canada | 48,397,669 | 1.29 |
| 7 | Parks Canada | 38,781,172 | 1.04 |
| 8 | Statistics Canada | 28,419,264 | 0.76 |
| 9 | National Defence | 17,355,390 | 0.46 |
| 10 | Natural Resources Canada | 14,786,562 | 0.39 |
| Other | All other departments (16) | 21,403,866 | 0.58 |
| Total | 3,742,444,802 | 100.00 | |
In the 2021–22 fiscal year, the Government of Canada collected $3,323,805,565 in fees set by contract, whereas in the 2022–23 fiscal year, $3,742,444,802 in such fees were collected, which represents an increase of $418,639,237 (12.59%).
Fees set by market rate or auction
Table 3 lists the two departments that reported revenue generated by fees set by market rate or auction during the 2022–23 fiscal year.
| Rank | Department | 2022–23 revenue ($) | Percentage of total revenueFootnote * |
|---|---|---|---|
| 1 | Innovation, Science and Economic Development Canada |
70,149,656 | 78.88 |
| 2 | Public Services and Procurement Canada |
18,794,504 | 21.12 |
| Total | 88,944,160 | 100.00 | |
In the 2022–23 fiscal year, these two departments reported total revenue of $88,944,160 in fees set by market rate or auction, which is $8,886,847,036 (99%) less than the $8,975,791,196 that was reported in the 2021–22 fiscal year. The decrease from last year is due to revenue generated from spectrum licenses auctions in 2021-22 of $8.9B that were not repeated this year.
Fees set by act, regulation or fees notice
In the 2022–23 fiscal year, the Government of Canada collected $4,088,454,931 in revenue from fees set by act, regulation or fees notice. This represents an increase of $820,128,866 (25.09%) from the 2021–22 fiscal year.
Table 4 highlights, for fees set by act, regulation or fees notice:
- the top 10 departments for revenue generated during the 2022–23 fiscal year, which accounted for 92% of all revenue collected
- the consolidated data for all other departments
- the variances between the last two fiscal years
| Rank | Department | 2021–22 revenue ($) | 2022–23 revenue ($) Footnote † | Variance in revenue from 2021–22 to 2022–23 ($) Footnote † | Percentage of total revenue generated in 2022–23 Footnote † |
|---|---|---|---|---|---|
| 1 | Immigration, Refugees and Citizenship Canada | 1,213,343,168 | 1,796,519,929 | 583,176,761 | 43.94 |
| 2 | Innovation, Science and Economic Development Canada | 589,373,911 | 622,149,750 | 32,775,839 | 15.22 |
| 3 | Health Canada | 274,128,683 | 268,369,104 | -5,759,579 | 6.56 |
| 4 | Office of the Superintendent of Financial Institutions | 199,287,068 | 227,171,224 | 27,884,156 | 5.55 |
| 5 | Canadian Radio-television and Telecommunications Commission | 195,084,125 | 208,551,017 | 13,466,892 | 5.10 |
| 6 | Parks Canada | 112,536,807 | 146,576,536 | 34,039,729 | 3.59 |
| 7 | Employment and Social Development Canada | 80,596,000 | 138,274,900 | 57,678,900 | 3.38 |
| 8 | Canada Energy Regulator | 122,702,575 | 129,229,306 | 6,526,731 | 3.16 |
| 9 | Canadian Nuclear Safety Commission | 115,634,774 | 126,474,024 | 10,839,250 | 3.09 |
| 10 | Fisheries and Oceans Canada | 78,051,476 | 90,287,681 | 12,236,205 | 2.21 |
| Subtotal | 2,980,738,587 | 3,753,603,471 | 772,864,884 | 91.80 | |
| Other | All other departments (23) | 287,587,479 | 334,851,460 | 47,263,981 | 8.20 |
| Total | 3,268,326,066 | 4,088,454,931 | 820,128,865 | 100.00 | |
Following are explanations of the variances indicated in Table 4, as provided by the departments.
1. Immigration, Refugees and Citizenship Canada
The increase in Immigration, Refugees and Citizenship Canada’s (IRCC’s) revenues in immigration service fees in 2022–23 is mainly attributable to:
- the resumption of its normal operations following the COVID‑19 pandemic
- increased processing to reduce the inventory of unprocessed applications accumulated during the pandemic
In 2022–23, IRCC exceeded its pre-pandemic levels of activity, with notable increases in its passport and citizenship program. The lifting of travel restrictions related to the pandemic resulted in a significantly higher demand for travel documents in 2022–23. In addition, efforts made by IRCC’s citizenship program to significantly reduce the inventory backlogs created during the pandemic positively impacted IRCC’s revenues.
2. Innovation, Science and Economic Development Canada
Innovation, Science and Economic Development Canada’s (ISED’s) fees report reflects seven fee groupings:
- Competition Law Enforcement and Promotion
- Federal Incorporation
- Insolvency
- Intellectual Property
- Spectrum and Telecommunications
- Support and Financing for Small Business
- Trade Measurement
In 2022–23, ISED revenues increased by 6% from the previous year, mostly due to increased volume related to higher capacity and productivity ($13.5 million) and an increase in reissuance of radio/spectrum licences as a result of last year increase in licences ($12.8 million).
In addition, growing concerns over a possible recession in 2022–23 resulted in decreased merger requests (-$2.6 million) and an increase of new loans registration fees ($9 million).
3. Health Canada
Cannabis revenues were higher in 2021–22 compared to 2022–23 due to an extension in the deadline for paying the annual fee. This reduction in cannabis revenues in 2022–23 was partially offset by fee increases under the Fees in Respect of Drugs and Medical Devices Order.
4. Office of the Superintendent of Financial Institutions
The Office of the Superintendent of Financial Institutions (OSFI) adjusts fees each year to fully recover its actual costs, so any variance in OSFI’s fees revenue is mainly due to increases in its operating costs. Although OSFI’s total number of assessments remained stable, the cost per individual assessment increased in 2022–23.
5. Canadian Radio-television and Telecommunications Commission
The Canadian Radio-television and Telecommunications Commission’s (CRTC’s) estimated total regulatory costs for telecommunications-related activities increased in 2022–23. As these are an input to the formula used to determine fees, this resulted in an increase in fees charged to the industry in 2022–23 and largely accounts for the difference between the CRTC’s revenues for 2021–22 and 2022–23.
6. Parks Canada
Parks Canada service levels have varied nationwide following the COVID‑19 pandemic. Travel within Canada has increased in 2022–23, but it has not returned to pre-pandemic levels, and the tourism industry is still recovering.
7. Employment and Social Development Canada
In April 2022, the Government of Canada introduced the Temporary Foreign Worker Program Workforce Solutions Road Map to help employers deal with shortages in the labour market in many sectors and occupations. The introduction of facilitative measures under the road map, alongside tight labour market conditions, led to a significant increase in 2022–23 in the number of Labour Market Impact Assessments processed by the department, resulting in higher fee revenues.
8. Canada Energy Regulator
The Canada Energy Regulator is funded through parliamentary appropriations. The Government of Canada recovers the majority of these appropriations from the regulated industry. Revenues are deposited to the account of the Receiver General for Canada and credited to the Consolidated Revenue Fund. This process is regulated by the National Energy Board Cost Recovery Regulations. Revenues shown are based on the actual costs incurred in the fiscal year.
9. Canadian Nuclear Safety Commission
The Canadian Nuclear Safety Commission’s higher revenue in 2022–23 was because of higher cost recovery, due mainly to increases in the cost of living, including increased salaries and expenses.
10. Fisheries and Oceans Canada
Fisheries and Oceans Canada’s increase in revenue in 2022–23 compared to the previous fiscal year is mostly due to an increase in the Fisheries management - Licensing Fee, Icebreaking, Dredging and marine navigation services compared to last year's figures. The variation is seen as a normal part of business and can be partly explained by changes in quota allocations, fishery closures, other events, and to a post COVID-19 pandemic increase in the use of services.
Fee adjustments
In this section
Before 2017, when the SFA came into force, certain fees set by act, regulation or fees notice had periodic adjustments to keep up with inflationary increases; however, many fees had no mechanism for keeping pace with the impact of inflation on the cumulative cost of delivering the service or product.
To make sure departments can keep up with inflation for delivering services, the SFA introduced an automatic annual adjustment. All fees set by act, regulation or fees notice are subject to this annual adjustment by default.
Certain fees are not subject to the annual adjustment set out in the SFA because another act of Parliament prescribes a periodic adjustment, or because they are exempt from the SFA. Fees that are considered to be low-materiality fees under the Low-Materiality Fees Regulations are also not subject to the SFA’s annual adjustment.
Service Fees Act annual adjustment
Subsection 17(1) of the SFA requires responsible authorities to adjust their applicable fees each fiscal year by the percentage change over 12 months in the April Consumer Price Index (CPI) for all items for Canada, as published by Statistics Canada.
The 2022–23 Departmental Fees Reports include a CPI adjustment, based on the CPI for April 2021 of 3.4% for applicable fees.
Periodic adjustment
A periodic fee adjustment is made pursuant to an act of Parliament or a regulation and is applied according to an established frequency, based on a specific rate, formula or other factor, other than the adjustment rate set out in subsection 17(1) of the SFA.
Service standards and remissions
In this section
To improve services to fee payers, the SFA requires that applicable fees have an established service standard. A service standard is a public commitment to provide a service in a way that is measurable and relevant to fee payers under normal circumstances.
To ensure accountability, the SFA introduced the requirement to remit on April 1, 2021. A remission is a partial or full return of a fee to a fee payer when a department deems that the relevant service standard was not met.
Service standards
The Low-Materiality Fees Regulations establish criteria that define what low-materiality fees are and which fees are not required by the SFA to establish service standards to provide a more cost-effective way for departments to administer low-materiality fees.
Table 5 shows the number of fees set by act, regulation or fees notice in 2022–23, broken down by the legislation to which they are subject and whether a service standard applies.
| Breakdown of fees | Number of feesFootnote * |
|---|---|
| Fees subject to sections 4 to 7 of the SFA that require a service standard | 3,692 |
| Fees subject to sections 4 to 7 of the SFA that are not required to have a service standard (the fee is for the provision of a product, the fee is set by contract, or the person or body that fixes the fee does so by fixing a manner for determining the amount of the fee over which the person or body has no control; refer to section 3 of the SFA) | 1,183 |
| Fees subject to sections 4 to 7 of the SFA that are considered to be low-materiality pursuant to section 22 of the SFA and the Low-Materiality Fees Regulations and that therefore do not have service standards | 32,610 |
| Fees not subject to the SFA and that may have service standards under other instruments | 189 |
| Total | 37,674 |
Of the 3,692 fees that require service standards under the SFA, departments reported that, as of March 31, 2023, 3,129 fees had existing service standards. Departments continue to work toward establishing service standards for their remaining fees to comply with the SFA. For departments that charge fees set by act, regulation or fees notice, information about service standards and corresponding performance results can be found in the “Details on each fee set by act, regulation or fees notice” section of their Departmental Fees Reports.
Remissions
The SFA requires departments to remit the portion of a fee that they consider appropriate to an affected fee payer when a service standard has been deemed not met. Departments must issue the remission before July 1 of the following fiscal year, in accordance with their remission policy.
Departments are required to develop policies and procedures to determine whether a service standard has been met and how much of a fee will be remitted to a fee payer when a service standard is deemed not met, according to the Directive on Charging and Special Financial Authorities. Departmental remission policy and procedures must be available to the public.
Other Treasury Board policies and directives may require fees to have an established service standard; however, those fees may not be subject to remissions under the SFA because they may have qualified for a non-application of certain sections of the SFA.
Authorities to remit
With regard to fees, three authorities allow departments to remit fees under different circumstances. They are as follows.
Authority to remit pursuant to the Service Fees Act
Subsection 7(2) of the SFA provides the authority to remit the appropriate portion of a fee only when a service standard in relation to that fee has been deemed not met. The remission is to be made in accordance with the Treasury Board Directive on Charging and Special Financial Authorities and the departmental remission policy.
Authority to remit pursuant to the Financial Administration Act
Departments may submit a Treasury Board submission to the Governor in Council in order to obtain an authority to remit pursuant to the Financial Administration Act. If granted, the authority may be provided for a specific fee or for a designated period. This type of authority is sought for matters other than the authority provided by the SFA. In other words, it could be for reasons other than a service standard that was deemed not met.
Authority to remit pursuant to other acts of Parliament
Certain departments have received an authority to remit fees pursuant to their enabling act or acts and may remit depending on the context and the wording in the act and related regulations, which may be for reasons other than a service standard that was deemed not met.
The 2022–23 Departmental Fees Reports include remissions issued under departments’ enabling legislation, the Financial Administration Act or remissions issued under the authority of the SFA.
Remissions issued
Table 6 shows the 10 departments that had the largest reported amounts in remissions issued in 2022–23 and total remissions issued by all other departments. The amounts include remissions from the authority delegated pursuant to the Service Fees Act, Financial Administration Act and other acts of Parliament.
Appendix: links to Departmental Fees Reports for the 2022–23 fiscal year
Listed below are links to the Departmental Fees Reports for the 2022–23 fiscal year. Each report contains information on specific departmental fee regimes, including:
- financial information about the total costs, total revenues generated by and any remissions of:
- fees set by contract
- fees set by market rate or auction
- fees set by act, regulation or fees notice
- for each fee set by act, regulation or fees notice, detailed information about:
- the date the fee was introduced and last amended, if applicable
- the dollar amount of the fee in the 2022–23 fiscal year
- the adjusted dollar amount of fees for the 2024–25 fiscal year, if applicable
- service standards, if applicable
- performance results against these standards
- total remissions issued for the fee, if applicable
Links to Departmental Fees Reports for the 2022–23 fiscal year:
- Agriculture and Agri‑Food Canada
- Canada Border Services Agency
- Canada Energy Regulator
- Canada School of Public Service
- Canada Revenue Agency
- Canadian Food Inspection Agency
- Canadian Grain Commission
- Canadian Heritage
- Canadian Nuclear Safety Commission
- Canadian Radio‑television and Telecommunications Commission
- Canadian Space Agency
- Crown‑Indigenous Relations and Northern Affairs Canada
- Department of Justice Canada
- Employment and Social Development Canada
- Environment and Climate Change Canada
- Financial Consumer Agency of Canada
- Fisheries and Oceans Canada
- Global Affairs Canada
- Health Canada
- Immigration, Refugees and Citizenship Canada
- Impact Assessment Agency of Canada
- Indigenous Services Canada
- Innovation, Science and Economic Development Canada
- Library and Archives Canada
- National Defence
- National Film Board
- National Research Council Canada
- Natural Resources Canada
- Office of the Auditor General of Canada
- Office of the Governor General’s Secretary
- Office of the Superintendent of Financial Institutions Canada
- Parks Canada
- Parole Board of Canada
- Privy Council Office
- Public Health Agency of Canada
- Public Services and Procurement Canada
- Royal Canadian Mounted Police
- Shared Services Canada
- Statistics Canada
- The National Battlefields Commission
- Transport Canada