
Report on the Public Service Pension Plan for the Fiscal Year Ended March 31, 2019
Erratum
Subsequent to its tabling in Parliament and online publication, the following corrections were made to the Report on the Public Service Pension Plan for Fiscal Year Ended March 31, 2019:
- In the Average pension paid section, the data for 2019 was erroneous and has since been corrected.
- In Statistical table 1.2 – Average annual amount of pension benefits paid to retired members, the data for average annual amount of pension benefits in 2019 was erroneous and has since been corrected.
- In Statistical table 2.1 – Pensions that became payable, the data for average annual pension benefits that became payable in 2019 was erroneous and has since been corrected.
These changes do not affect the rest of the information contained in the report.
On this page
- Message from the President of the Treasury Board
- Message from the Chief Human Resources Officer
- Overview
- Fiscal year at a glance
- Plan benefits
- Plan financial status
- Membership demographics
- Roles and responsibilities
- Further information
- Statistical tables
- Account transaction statements
- Glossary
- Financial statements

Her Excellency the Right Honourable Julie Payette, C.C., C.M.M., C.O.M., C.Q., C.D.
Governor General of Canada
Excellency:
I have the honour of submitting to Your Excellency the Report on the Public Service Pension Plan for the Fiscal Year Ended March 31, 2019.
Respectfully,
Original signed by
The Honourable Jean-Yves Duclos, P.C., M.P.
President of the Treasury Board
Message from the President of the Treasury Board
One of our top priorities is to ensure the federal government recruits and retains talented people to create a strong and resilient public service that will serve Canadians well.

The Treasury Board of Canada Secretariat is pleased to present the Report on the Public Service Pension Plan for the Fiscal Year Ended March 31, 2019. The purpose of this report is to inform members, parliamentarians, and Canadians of the status of the plan and its management for the 2018–19 fiscal year. I hope you will enjoy this year’s new format, which reflects the Government of Canada’s efforts to make the information easier to understand and more accessible to Canadians.
The Treasury Board of Canada Secretariat oversees the management of the plan by providing strategic leadership, governance and administrative oversight to help ensure its integrity.
Budget 2019 announced the Government’s intention to introduce legislation to increase the surplus limit that applies to public sector pension plans in order to help minimize the risk of future funding deficiencies. In 2019, we delivered on this commitment by making amendments to the Public Service Superannuation Act to increase the surplus limit of the Public Service Pension Fund. This change will ensure that the pension plan remains sustainable and continues to deliver equitable and relevant benefits to members in a cost-effective manner.
I would like to take this opportunity to thank federal public servants for their commitment, dedication, and ongoing contribution to our world-class public service in which all Canadians can take pride.
Original signed by
The Honourable Jean-Yves Duclos, P.C., M.P.
President of the Treasury Board
Message from the Chief Human Resources Officer
As Chief Human Resources Officer, part of my role is to ensure the Treasury Board of Canada Secretariat fulfills its obligation to provide oversight of the public service pension plan.

As Chief Human Resources Officer, at the Treasury Board of Canada Secretariat, I am committed to taking steps to improve our oversight and the funding governance of the public service pension plan.
In this past year, we have continued to modernize our systems, tools and practices to meet the needs and expectations of plan members. Members’ use of online tools and information continues to grow, as evidenced by the more than 4.2 million page views on the Government of Canada’s pension and benefits website. We will continue to improve access to pertinent pension information for members and stakeholders.
The Treasury Board of Canada Secretariat continues to ensure that the public service pension plan provides fair, appropriate and affordable benefits, and remains sustainable. A notable example is the strong financial position of the pension plan, with $123.1 billion in net assets available for benefits compared to $100.5 billion in funded pension obligations for service accrued after April 1, 2000.
I would like to acknowledge the commitment and dedication of all those involved in the effective delivery of the public service pension plan, including its administrator, Public Services and Procurement Canada. I look forward to continued collaboration among all our partners with the shared objective of maintaining a strong and viable pension plan for members.
Original signed by
Nancy Chahwan
Chief Human Resources Officer
Overview
About this report
This report provides information on the public service pension plan for the fiscal year ended March 31, 2019.Footnote 1 It is prepared and tabled in Parliament in accordance with section 46 of the Public Service Superannuation Act.
As required under section 45 of the Public Service Superannuation Regulations, the report includes the plan’s annual financial statements, which are prepared in accordance with the Government of Canada’s stated accounting policies for the pension plan.
About the plan
The public service pension plan is a defined benefit pension plan that is funded by contributions from active plan members and from the Government of Canada.
Plan members consist of active members (full-time and part-time employees of the federal public service, those of certain public service corporations and those of the territorial governments), retired members, survivors and deferred annuitants.
As of March 31, 2019, the plan served 631,870 members.
Fiscal year at a glance
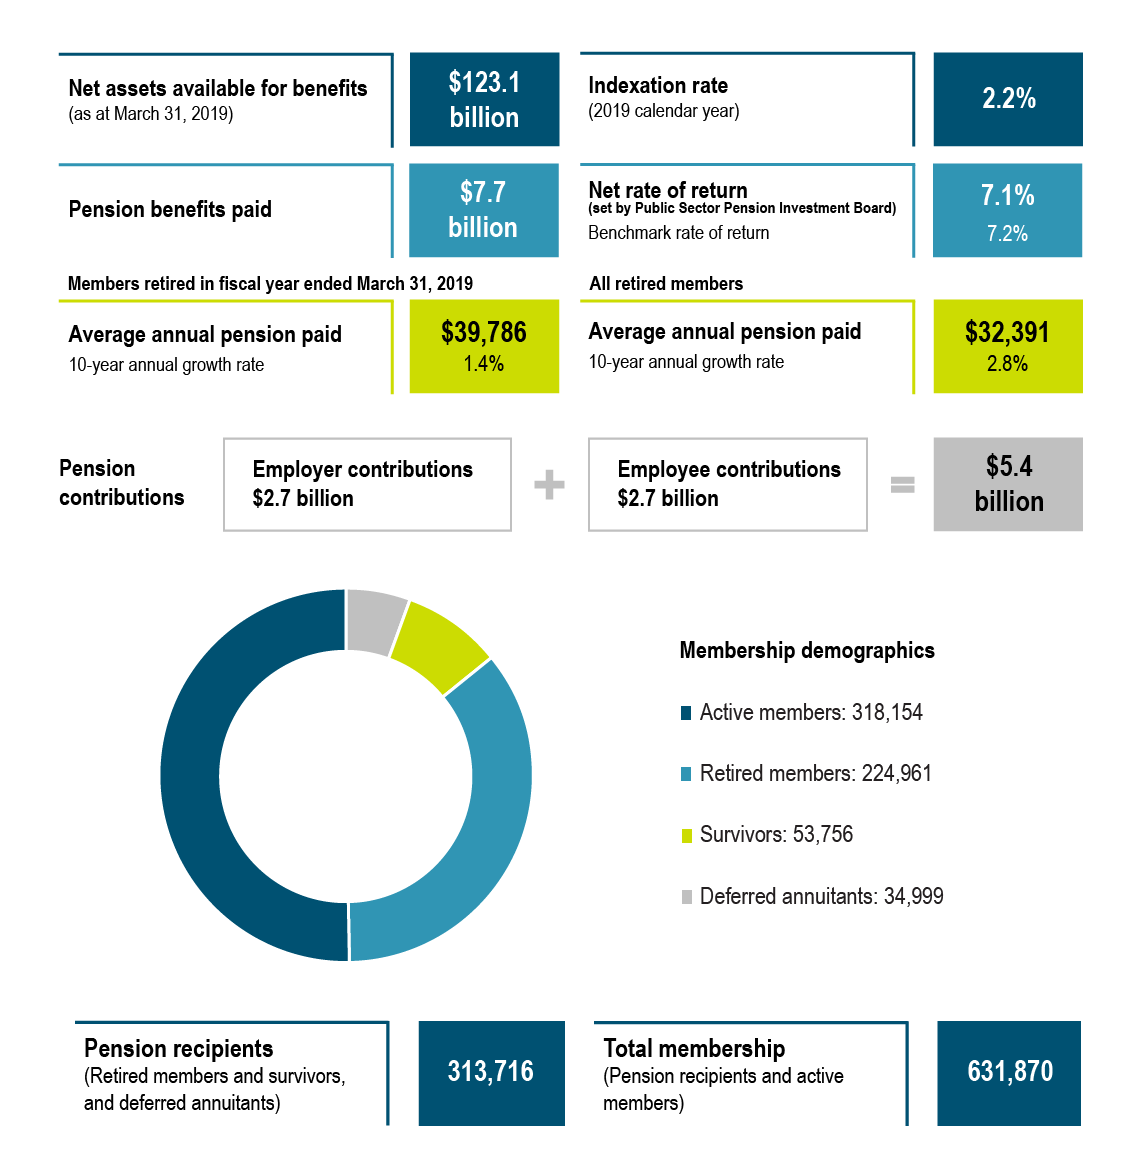
Fiscal year at a glance - Text version
Net assets available for benefits (as at March 31, 2019): $123.1 billion
Indexation rate (2019 calendar year): 2.2%
Pension benefits paid: $7.7 billion
Net rate of return (set by Public Sector Pension Investment Board): 7.1%
Benchmark rate of return: 7.2%
Members retired in fiscal year ended March 31, 2019
Average annual pension paid: $39,786
10-year annual growth rate: 1.4%
All retired members
Average annual pension paid: $32,391
10-year annual growth rate: 2.8%
Pension contributions
Employer contributions: $2.7 billion
Employee contributions: $2.7 billion
Total: $5.4 billion
| Membership type | Number of members 2019 |
|---|---|
| Active members | 318,154 |
| Retired members | 224,961 |
| Survivors | 53,756 |
| Deferred annuitants | 34,999 |
| Total | 631,870 |
Pension recipients (Retired members and survivors, and deferred annuitants): 313,716
Total membership (Pension recipients and active members) : 631,870
Plan benefits
-
In this section
Benefit formula
The benefits a plan member receives are based on the member’s years of pensionable service, to a maximum of 35 years, and are calculated using a formula set out in the Public Service Superannuation Act. Benefits are not based on the financial status of the plan.
The basic benefit formula is 2% per year of pensionable service multiplied by the average salary for the highest‑paid 5 consecutive years of service (see Figure 1). The formula coordinates benefits paid under the public service pension plan with those paid under the Canada Pension Plan and under the Québec Pension Plan.
Benefits paid under the plan, which include immediate pensions, deferred pensions, annual allowances, disability retirement benefits and survivor benefits, are indexed annually to take into account the cost of living, which is based on increases in the Consumer Price Index. In calendar year 2019, the indexation rate was 2.2% (1.6%Footnote 2 in 2018).
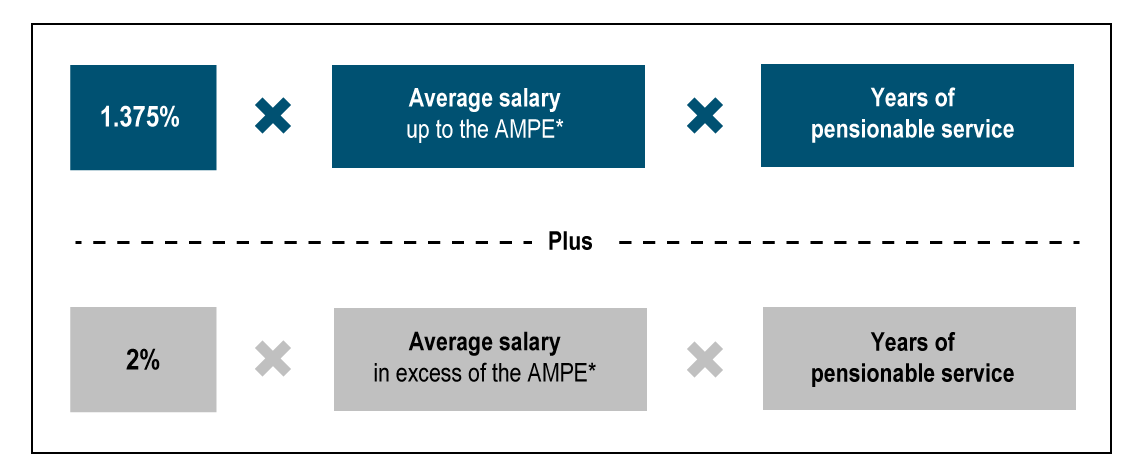
* Note: AMPE (average maximum pensionable earnings) is the average of the yearly maximum pensionable earnings set by the Canada Pension Plan or the Québec Pension Plan for the year in which a member retires and the 4 preceding years.
Survivor and death benefits
In addition to the pension benefits already mentioned, the plan includes benefits for a member’s survivors in the event of the member’s death.
If a vested member dies, the eligible survivor and children are entitled to the following:
- Survivor benefit: A monthly allowance equal to half of the member’s unreduced pension, payable immediately to the eligible survivor for the rest of the survivor’s life.
- Child allowance: A monthly allowance equal to 10% of the member’s unreduced pension (20% of the member’s unreduced pension if the member has no eligible survivor). The amount is payable until age 18, or until age 25 if the child is a full‑time student. The maximum allowance for all children is 40% of the member’s pension, or 80% if there are dependent children but no spouse eligible for a survivor benefit.
- Supplementary death benefit: A lump-sum benefit equal to twice the member’s annual salary, rounded-up to the nearest $1,000, payable to the designated beneficiary or to the estate. Coverage decreases by 10% each year starting at age 66 to a minimum of $10,000 by age 75. If the member is still employed in the public service after age 65, minimum coverage is the greater of $10,000 or one third of his or her annual salary.
If the member has no eligible survivor or children, the designated beneficiary of the supplementary death benefit or the estate will receive an amount equal to the greater of the return of contributions with interest or 5 years of pension payments less any payments already received.
If a member dies before they are vested, contributions with interest are refunded to any eligible survivor or children, or to the designated beneficiary or the estate if the member has no eligible survivors.
Benefits paid
In fiscal year ended March 31, 2019, $7.7 billion in benefits were paid ($7.4 billion in the previous fiscal year).
Figure 2 shows total benefits paid to plan members and survivors for each of the past 10 years. The average annual growth rate in this period was 5.1%.
Fiscal year ended March 31 (billions)
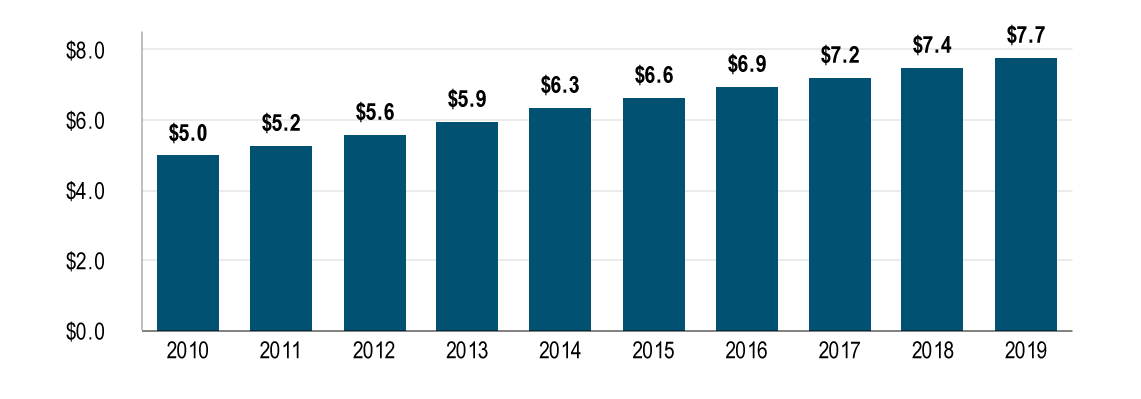
Figure 2 - Text version
| Year | Total benefit payments |
|---|---|
| 2010 | $5.0 |
| 2011 | $5.2 |
| 2012 | $5.6 |
| 2013 | $5.9 |
| 2014 | $6.3 |
| 2015 | $6.6 |
| 2016 | $6.9 |
| 2017 | $7.2 |
| 2018 | $7.4 |
| 2019 | $7.7 |
Note: Due to rounding, total benefits paid for fiscal year ended March 31, 2019, does not match the total presented in Figure 3.
Of the total benefits paid in fiscal year ended March 31, 2019, approximately $7.0 billion ($6.7 billion in the previous fiscal year) was paid to retired plan members, including those who retired on grounds of disability.
The remainder, approximately $0.8 billion (no change from previous fiscal year), was paid to survivors, including children and students.
Fiscal year ended March 31, 2019
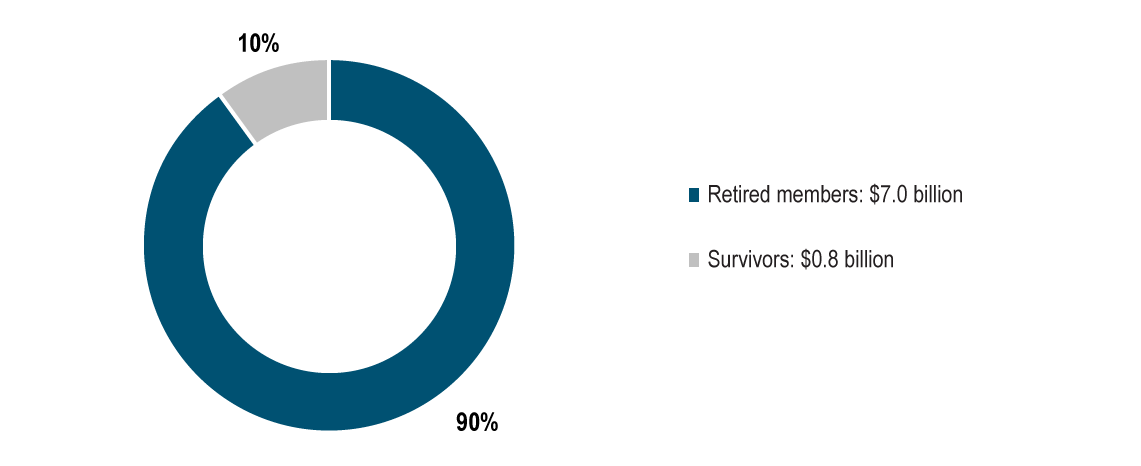
Figure 3 - Text version
| Benefit payments ($ billions) | Percent | |
|---|---|---|
| Retired members | 7.0 | 90% |
| Survivors | 0.8 | 10% |
During fiscal year ended March 31, 2019, 9,621 plan members retired (13,090 in the previous fiscal year). The type of benefit a member may receive when they leave the public service depends on their age and years of pensionable service (see Table 1).
| Year | Immediate pension | Disability retirement benefit | Deferred pension | Annual allowance | Total |
|---|---|---|---|---|---|
| 2019 | 7,181 | 650 | 358 | 1,432 | 9,621 |
| 2018 | 7,641 | 446 | 3,725 | 1,278 | 13,090 |
| 2017 | 6,821 | 501 | 532 | 1,468 | 9,322 |
Average pension paid
The average annual pension paid to members who retired in fiscal year ended March 31, 2019, was $39,786 ($35,558 in the previous fiscal year).
The average annual pension paid to all retired members in fiscal year ended March 31, 2019, was $32,391 ($31,628 in the previous fiscal year).
As at March 31, 2019, the average annual growth rate over 10 years for average pension paid was:
- 1.4% for newly retired members
- 2.8% for all retired members
Fiscal year ended March 31
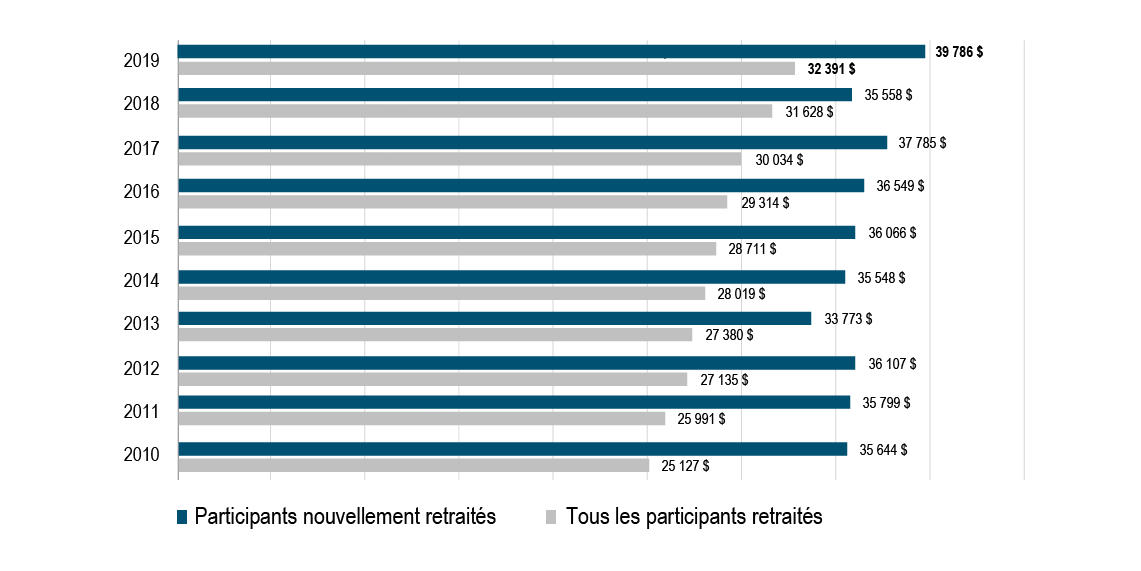
Figure 4 - Text version
| Year | All retired members | Newly retired members |
|---|---|---|
| 2010 | $25,127 | $35,644 |
| 2011 | $25,991 | $35,799 |
| 2012 | $27,135 | $36,107 |
| 2013 | $27,380 | $33,773 |
| 2014 | $28,019 | $35,548 |
| 2015 | $28,711 | $36,066 |
| 2016 | $29,314 | $36,549 |
| 2017 | $30,034 | $37,785 |
| 2018 | $31,628 | $35,558 |
| 2019 | $32,391 | $39,786 |
Plan financial status
Net assets available for benefits
As at March 31, 2019, the net assets available for benefits were $123.1 billion ($112.3 billion in the previous fiscal year). These net assets mainly consist of net investments managed by the Public Sector Pension Investment Board (PSPIB) on behalf of the plan (see Figure 5).
Fiscal year ended March 31 (billions)
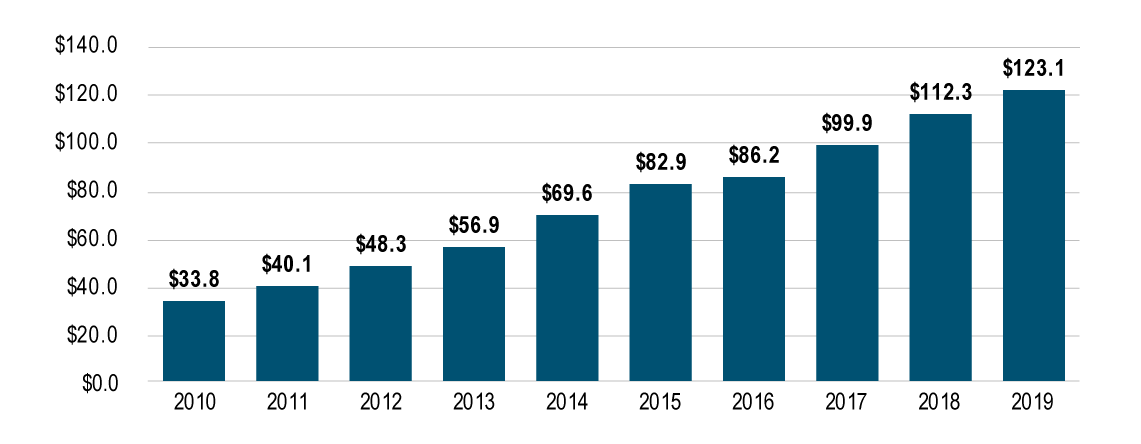
Figure 5 - Text version
| Year | Net assets available for benefits |
|---|---|
| 2010 | $33.8 |
| 2011 | $40.1 |
| 2012 | $48.3 |
| 2013 | $56.9 |
| 2014 | $69.6 |
| 2015 | $82.9 |
| 2016 | $86.2 |
| 2017 | $99.9 |
| 2018 | $112.3 |
| 2019 | $123.1 |
As at March 31, 2019, the 10-year average annual growth rate of net assets available for benefits was 17.0%.
Pension obligations
The Office of the Chief Actuary performs an actuarial valuation for accounting purposes each year to determine the amount of pension obligations. The economic assumptions used in the annual actuarial valuation represent management’s best estimates.
Pension obligations measure in today’s dollars the amount of benefits that will be paid to members in the future. The actuary uses various projections such as life expectancy, retirement age, future rates of return on investments, and other variables to estimate the pension obligations.
As at March 31, 2019, pension obligations were $217.6 billion ($207.6 billion in the previous fiscal year) (see Figure 6).
Fiscal year ended March 31 (billions)
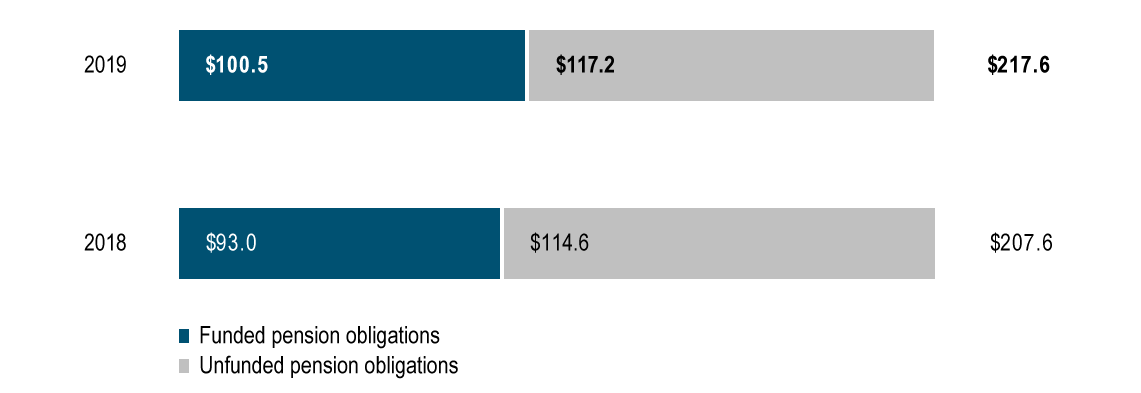
Figure 6 - Text version
| 2018 | 2019 | |
|---|---|---|
| Funded pension obligations | $93.0 | $100.5 |
| Unfunded pension obligations | $114.6 | $117.2 |
| Total | $207.6 | $217.6 |
Funded pension obligations relate to pension benefits accrued through pensionable service after March 31, 2000, and are funded from employee and employer contributions, special payments, and investment returns earned by the PSPIB.
Unfunded pension obligations relate to pension benefits accrued through pensionable service before April 1, 2000, where separate invested funds were not set aside to provide for payment of pension benefits.
See Notes 13 and 14 of the Financial Statements for additional information.
Net assets available for benefits versus funded pension obligations (after April 1, 2000)
Table 2 shows that net assets available for benefits were greater than funded pension obligations for the last 3 years.
| Year | Net assets available for benefits | Funded pension obligations (after April 1, 2000) |
|---|---|---|
| 2019 | $123.1 | $100.5 |
| 2018 | $112.3 | $93.0 |
| 2017 | $99.9 | $87.4 |
Cumulative net contribution transfers to PSPIB and investment returns
Investment returns are an important element of plan funding. Since April 1, 2000, the plan has made investments by making regular net contribution transfers to the PSPIB. These transfers are net of benefit payments and administration costs. As the plan matures, the proportion of assets that come from investment returns is expected to continue growing. Since 2018, the cumulative net investment returns earned by the PSPIB have exceeded the cumulative net contribution transfers sent to the PSPIB for investment (see Figure 7).
Fiscal year ended March 31 (billions)
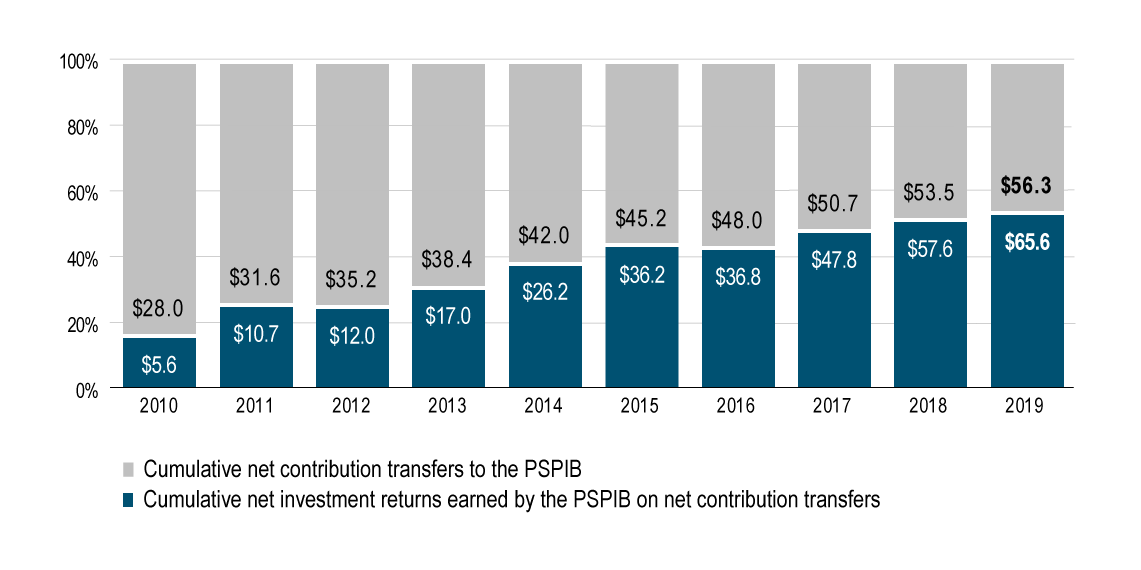
Figure 7 - Text version
| Year | Cumulative net investment returns earned by the PSPIB on net contribution transfers | Cumulative net contribution transfers to the PSPIB |
|---|---|---|
| 2010 | $5.6 | $28.0 |
| 2011 | $10.7 | $31.6 |
| 2012 | $12.0 | $35.2 |
| 2013 | $17.0 | $38.4 |
| 2014 | $26.2 | $42.0 |
| 2015 | $36.2 | $45.2 |
| 2016 | $36.8 | $48.0 |
| 2017 | $47.8 | $50.7 |
| 2018 | $57.6 | $53.5 |
| 2019 | $65.6 | $56.3 |
Source: PSPIB annual reports, 2010 to 2019
| Cumulative net contribution transfers | Cumulative net investment returns earned on net contribution transfers |
|---|---|
| 46.2% | 53.8% |
Investment returns
For the year ended March 31, 2019, the PSPIB reported a net rate of return of 7.1% (9.8% in the previous fiscal year), compared with a benchmark rate of return of 7.2% (8.7% in the previous fiscal year) (see Figure 8).
Fiscal year ended March 31
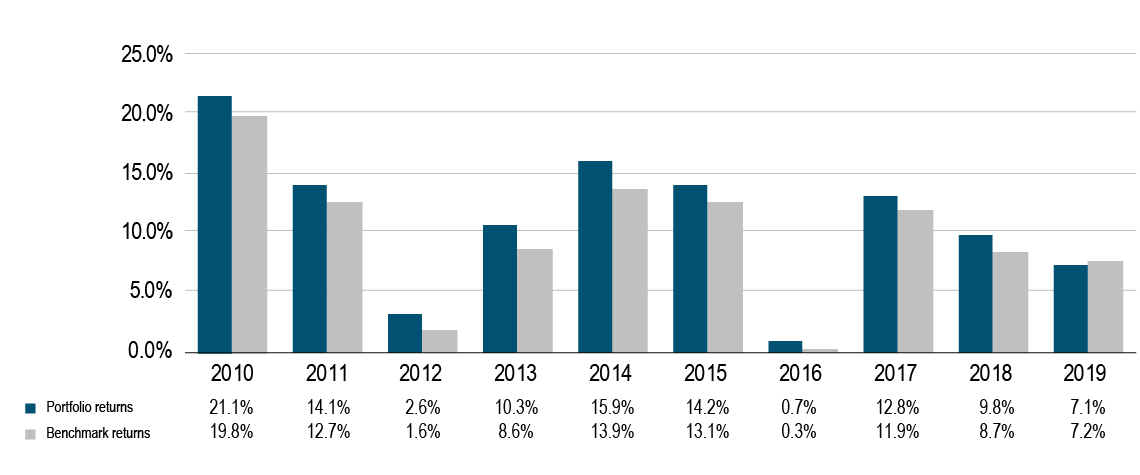
Figure 8 - Text version
| Year | Portfolio returns | Benchmark returns |
|---|---|---|
| 2010 | 21.1% | 19.8% |
| 2011 | 14.1% | 12.7% |
| 2012 | 2.6% | 1.6% |
| 2013 | 10.3% | 8.6% |
| 2014 | 15.9% | 13.9% |
| 2015 | 14.2% | 13.1% |
| 2016 | 0.7% | 0.3% |
| 2017 | 12.8% | 11.9% |
| 2018 | 9.8% | 8.7% |
| 2019 | 7.1% | 7.2% |
Source: PSPIB annual reports, 2010 to 2019
Over the past 10 years, the PSPIB has achieved a net annualized rate of return of 10.7%, compared with the return objective of 5.8% set by the Government of Canada.
Investment portfolio: targets and actual
In accordance with the PSPIB’s investment framework, assets held by the PSPIB are invested with long-term investment portfolio targets by asset class.
Figures 9 and 10 show the target asset allocation and the asset mix.
For fiscal year ended March 31, 2019
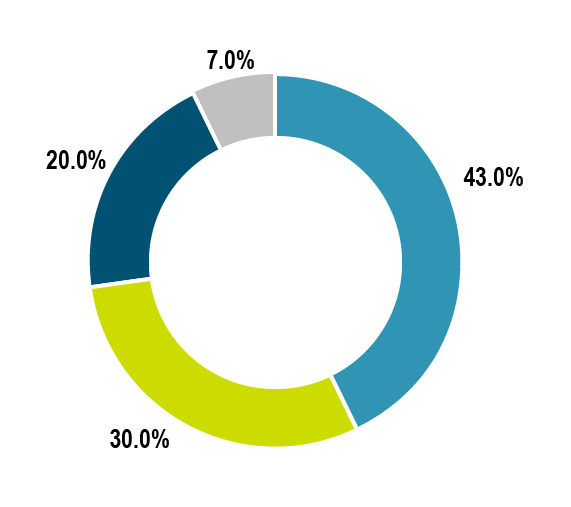

Figure 9 - Text version
PSPIB target asset allocation
For fiscal year ended March 31, 2019
Equity (public market and private equities): 43.0%
Real assets (real estate, infrastructure and natural resources): 30.0%
Government fixed income (fixed income, cash and cash equivalents): 20.0%
Credit (private debt): 7.0%
As at March 31, 2019
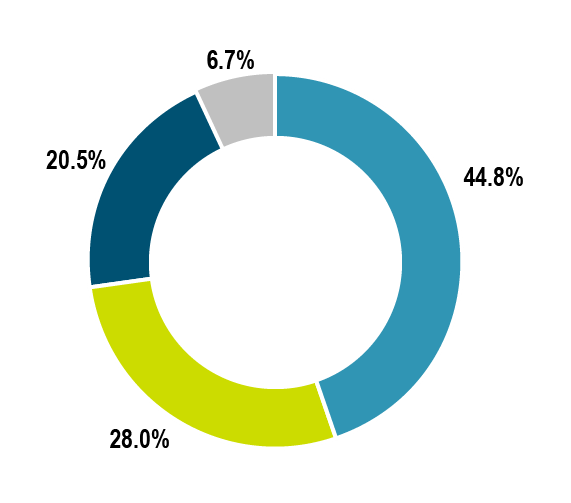
Figure 10 - Text version
PSPIB asset mix
As at March 31, 2019
Equity (public market and private equities): 44.8%
Real assets (real estate, infrastructure and natural resources): 28.0%
Government fixed income (fixed income, cash and cash equivalents): 20.5%
Credit (private debt): 6.7%
Contributions
Plan benefits are funded through compulsory contributions from the employer and from active plan members, as well as from investment earnings. To ensure the sustainability of the plan, contributions are at a 50:50 employer‑employee balanced cost-sharing ratio.Footnote 3
Employee contributions are a percentage of their salary collected through payroll deductions. Total contributions received for the year ended March 31, 2019, totalled $5.4 billion ($4.6 billion in the previous fiscal year).
Figure 11 shows employee and employer contributions for 2015 to 2019. Amounts include both current and past service (for example, service buybacks and pension transfers).
Fiscal year ended March 31 (billions)
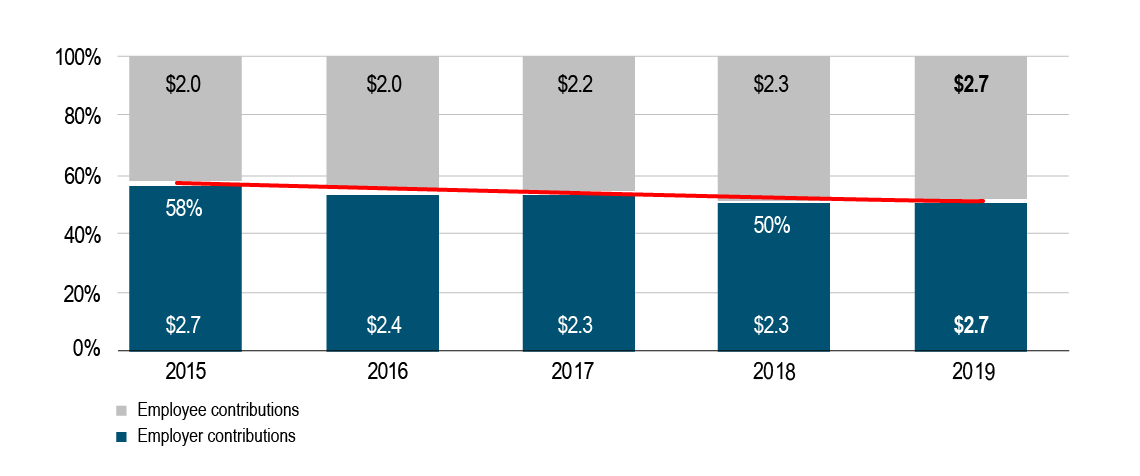
Figure 11 - Text version
| Year | Employer contributions | Employee contributions |
|---|---|---|
| 2015 | $2.7 | $2.0 |
| 2016 | $2.4 | $2.0 |
| 2017 | $2.3 | $2.2 |
| 2018 | $2.3 | $2.3 |
| 2019 | $2.7 | $2.7 |
As at March 31, 2019, the 5-year average annual growth rate of combined employer and employee contributions was 3.5%.
Pension transfer agreements
The plan has pension transfer agreements with other levels of government, universities and private sector employers. Plan members may increase their pensionable service by requesting a pension transfer of service accrued after March 31, 2000 (see Figure 12).
Fiscal year ended March 31 (millions)
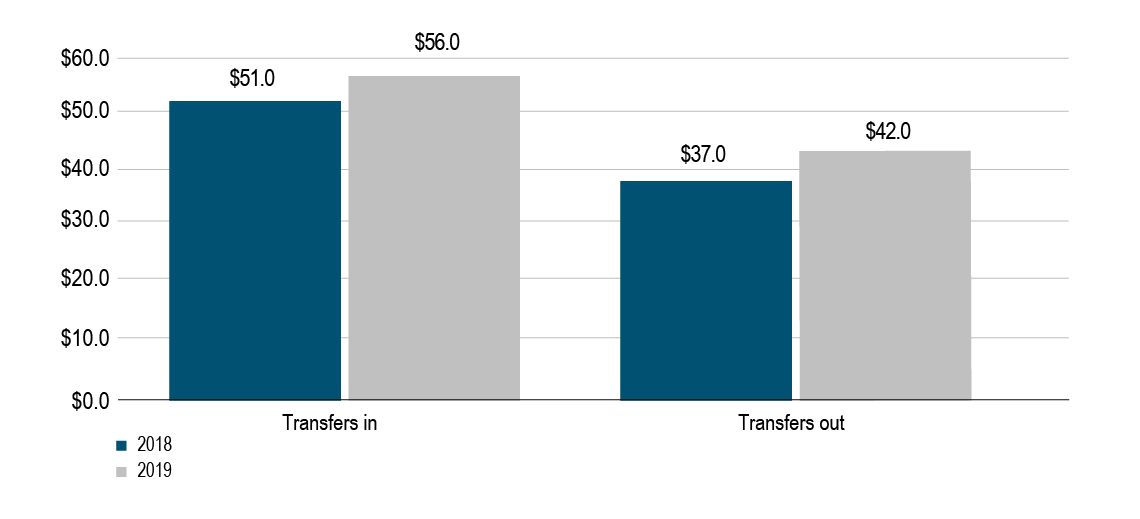
Figure 12 - Text version
| 2019 | 2018 | |
|---|---|---|
| Transfers in | $56.0 | $51.0 |
| Transfers out | $42.0 | $37.0 |
Expenses
Administrative expenses
As per legislation, pension-related administrative expenses of the following government organizations may be charged to the plan:
- Treasury Board of Canada Secretariat
- Public Services and Procurement Canada
- Health Canada
- Office of the Chief Actuary
The PSPIB’s administrative expenses are also charged to the plan.
Figure 13 presents the administrative expenses charged to the plan each year for the past 10 years, as shared between government organizations and the PSPIB.
Government organizations’ administrative expenses have remained stable over the past 4 years.
The PSPIB’s administrative expenses have increased as a result of the growth in the number of employees and investments in technology and initiatives underway as part of its strategic plan.
Fiscal year ended March 31 (millions)
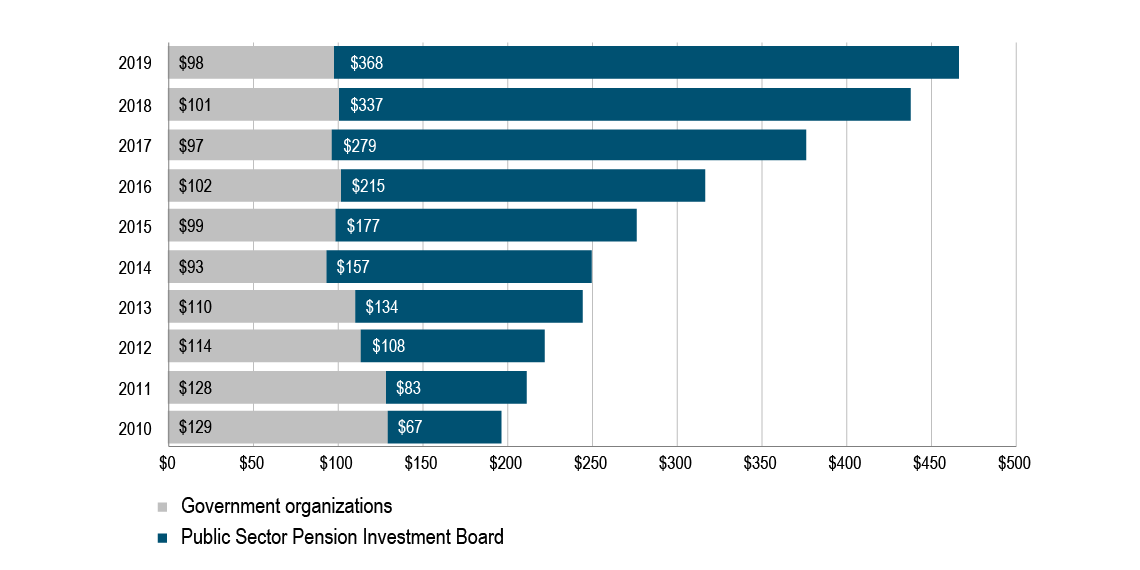
Figure 13 - Text version
| Year | Government organizations | Public Sector Pension Investment Board |
|---|---|---|
| 2010 | $129 | $67 |
| 2011 | $128 | $83 |
| 2012 | $114 | $108 |
| 2013 | $110 | $134 |
| 2014 | $93 | $157 |
| 2015 | $99 | $177 |
| 2016 | $102 | $215 |
| 2017 | $97 | $279 |
| 2018 | $101 | $337 |
| 2019 | $98 | $368 |
See Note 20 of the financial statements for more details on administrative expenses.
In addition to administrative expenses, the PSPIB also incurs costs in relation to its investment activities, see Note 19 for information on investment-related expenses.
Membership demographics
Number of active and retired members
As at March 31, 2019, plan membership was as follows:
- 318,154 active members (303,483 in the previous fiscal year)
- 224,961 retired members (222,169 in the previous fiscal year)
Figure 14 shows the number of active members and the number of retired members for 2010 to 2019.
Table 4 shows the average annual growth rate over 10 years for active and retired members.
Fiscal year ended March 31 (thousands)
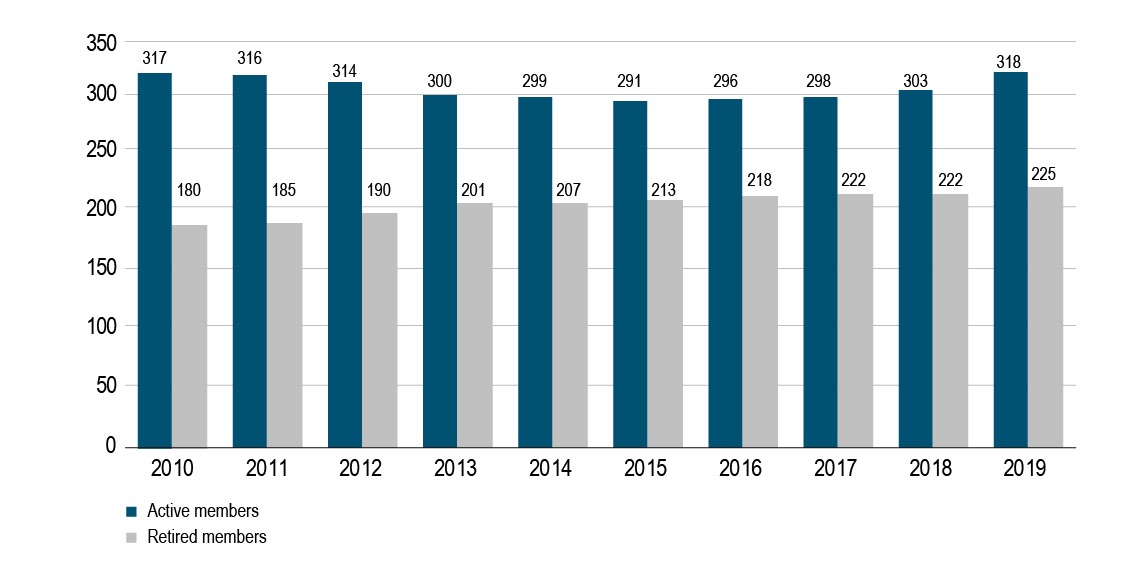
Figure 14 - Text version
| Year | Active members | Retired members |
|---|---|---|
| 2010 | 317 | 180 |
| 2011 | 316 | 185 |
| 2012 | 314 | 190 |
| 2013 | 300 | 201 |
| 2014 | 299 | 207 |
| 2015 | 291 | 213 |
| 2016 | 296 | 218 |
| 2017 | 298 | 222 |
| 2018 | 303 | 222 |
| 2019 | 318 | 225 |
| Active members | Retired members |
|---|---|
| 0.3% | 2.5% |
Membership type
Plan members are classified as one of the following: active members, retired members, survivors or deferred annuitants.
Fiscal year ended March 31
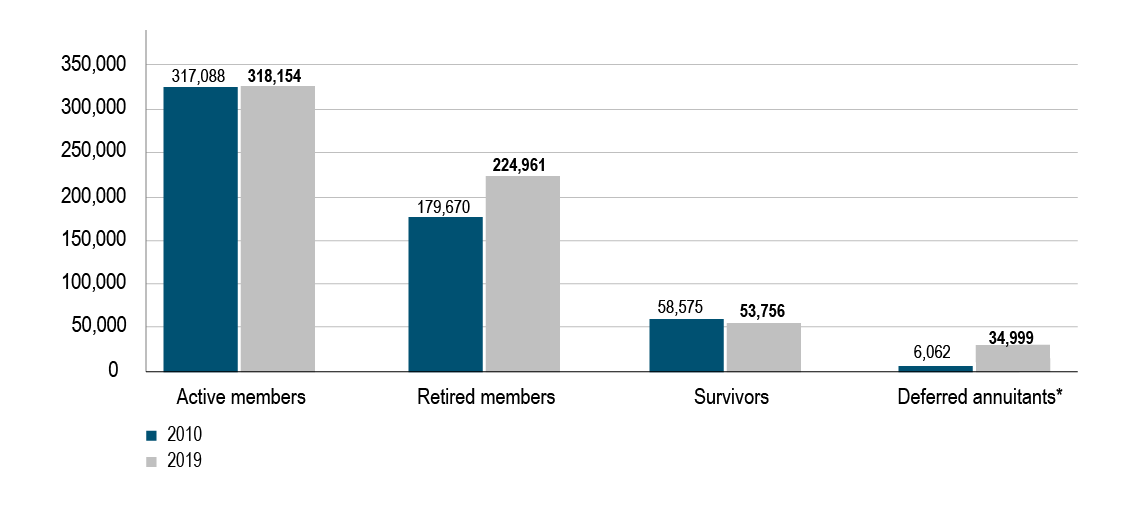
Figure 15 - Text version
| Membership type | Number of Members 2010 |
Number of Members 2019 |
|---|---|---|
| Active members | 317,088 | 318,154 |
| Retired members | 179,670 | 224,961 |
| Survivors | 58,575 | 53,756 |
| Deferred annuitants* | 6,062 | 34,999 |
| Total | 561,395 | 631,870 |
* Note: The figure for 2010 represents the number of new deferred annuitants only; these are plan members who left the public service and opted for a deferred pension during the previous fiscal year. The figure for 2019 represents the total number of deferred annuitants.
Active members by age group
Figure 16 shows active membership in 2010 and 2019, by age group.
Fiscal year ended March 31
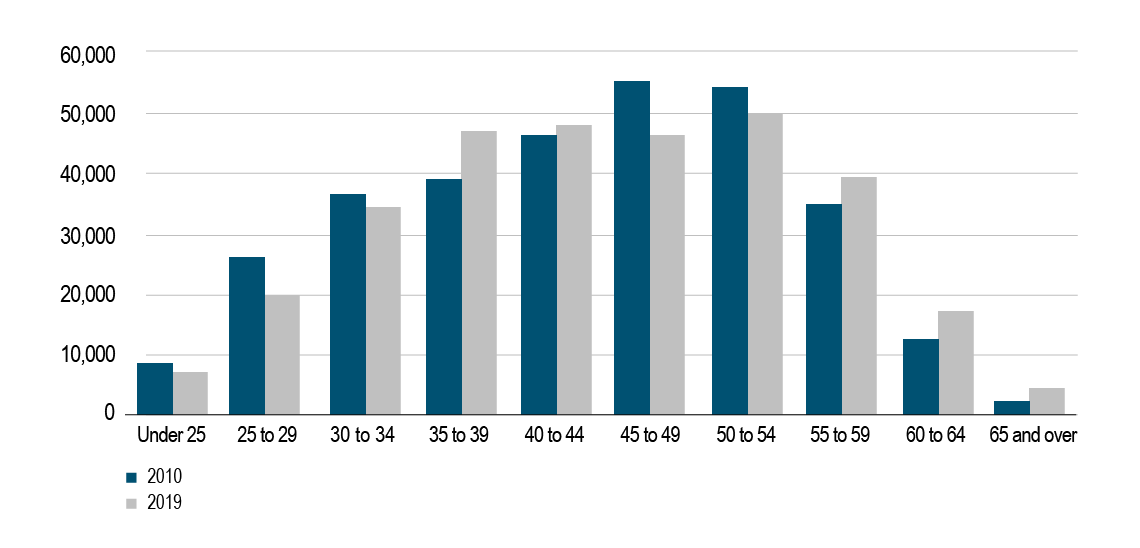
Figure 16 - Text version
| Age group | Total active members | |
|---|---|---|
| 2010 | 2019 | |
| Under 25 | 8,014 | 6,729 |
| 25 to 29 | 26,800 | 20,281 |
| 30 to 34 | 37,350 | 35,542 |
| 35 to 39 | 39,429 | 46,291 |
| 40 to 44 | 45,602 | 47,938 |
| 45 to 49 | 55,161 | 46,842 |
| 50 to 54 | 55,011 | 51,606 |
| 55 to 59 | 34,918 | 39,586 |
| 60 to 64 | 12,347 | 17,393 |
| 65 and over | 2,456 | 5,946 |
| Total | 317,088 | 318,154 |
Note: The breakdown of members by age group was estimated by applying a pro rata methodology using data from the Actuarial Report on the Pension Plan for the Public Service of Canada. Data for 2010 was obtained from the actuarial report as at March 31, 2008, and data for 2019 was obtained from the actuarial report as at March 31, 2017.
Roles and responsibilities
The President of the Treasury Board has overall responsibility for the plan. The President’s responsibilities include making sure that the plan is adequately funded to pay for members’ benefits.
In carrying out these responsibilities, the President is supported by:
- the Treasury Board of Canada Secretariat, the administrative arm of the Treasury Board, which:
- develops policy for the funding, design and governance of the plan
- provides strategic direction, program advice and interpretation
- develops legislation
- communicates with plan members
- liaises with plan stakeholders
- the Office of the Chief Actuary, which determines the plan’s funding requirements and provides advice and actuarial services
- the Public Sector Pension Investment Board (PSPIB), which manages the plan’s investments
- Public Services and Procurement Canada, which handles the day-to-day administration of the plan
- the Public Service Pension Advisory Committee, which includes employer, active and retired plan member representatives, and which advises the President of the Treasury Board on matters relating to the administration, design and funding of the plan
Further information
Additional information on the plan is available online:
Statistical tables
-
In this section
- Statistical table 1. Pensions and survivor benefits paid
- Statistical table 2. Pensions and survivor benefits that became payable
- Statistical table 3. Unreduced pensions, immediate pensions by age group
- Statistical table 4. Reduced pensions (annual allowances) and lump sum payments that became payable
- Statistical table 5. Changes in number of active members, retired members and survivors
- Statistical table 6. Number of transfer‑value payments by years of pensionable service and age at termination
- Statistical table 7. Supplementary death benefit: Number of participants and number of benefits paid
Statistical table 1. Pensions and survivor benefits paid
| Year | PensionsStatistical table 1.1 note 1 | Survivor benefitsStatistical table 1.1 note 2 | Total |
|---|---|---|---|
| 2019 | 224,961 | 53,756 | 278,717 |
| 2018 | 222,169 | 54,115 | 276,284 |
| 2017 | 221,673 | 55,123 | 276,796 |
Statistical table 1.1 Notes
|
|||
| Year | Averages | Male | Female | Overall |
|---|---|---|---|---|
| 2019 | Annual amount | $36,669 | $27,665 | $32,391 |
| Age | 72.1 | 69.0 | 70.6 | |
| Pensionable service (years) | 25.9 | 23.1 | 24.6 | |
| 2018 | Annual amount | $36,273 | $27,121 | $31,628 |
| Age | 71.8 | 68.7 | 70.2 | |
| Pensionable service (years) | 25.9 | 23.1 | 24.6 | |
| 2017 | Annual amount | $34,015 | $25,351 | $30,034 |
| Age | 71.66 | 68.63 | 70.27 | |
| Pensionable service (years) | 25.39 | 23.07 | 24.32 | |
Statistical table 1.2 Notes
|
||||
| Year | Averages | Spouse or common‑law partner | Children | Students |
|---|---|---|---|---|
| 2019 | Annual amount | $15,213 | $2,441 | $4,012 |
| Age | 81.1 | 13.0 | 21.8 | |
| Pensionable service (years) | 22.6 | 13.6 | 20.4 | |
| 2018 | Annual amount | $14,391 | $2,302 | $3,952 |
| Age | 79.8 | 12.8 | 21.5 | |
| Pensionable service (years) | 22.5 | 13.0 | 19.8 | |
| 2017 | Annual amount | $14,245 | $2,165 | $3,376 |
| Age | 81.2 | 12.6 | 21.6 | |
| Pensionable service (years) | 22.5 | 12.4 | 17.9 | |
Statistical table 1.3 Notes
|
||||
Statistical table 2. Pensions and survivor benefits that became payable
| Year | Male | Female | Total | Total amount paid | Average pension |
|---|---|---|---|---|---|
| 2019 | 4,165 | 5,456 | 9,621 | $380,373,686 | $39,786 |
| 2018 | 6,065 | 7,025 | 13,090 | $465,451,113 | $35,558 |
| 2017 | 4,046 | 5,276 | 9,322 | $352,228,283 | $37,785 |
Statistical table 2.1 Notes
|
|||||
| Year | Spouse or common-law partner | Children and students | Total | ||
|---|---|---|---|---|---|
| 2019 | 2,841 | 225 | 3,066 | ||
| 2018 | 2,636 | 98 | 2,734 | ||
| 2017 | 2,432 | 129 | 2,561 | ||
Statistical table 2.2 Notes
|
|||||
| Year | Total amount paid | Spouse or common-law partner average benefits | Children and students average benefits |
|---|---|---|---|
| 2019 | $51,858,227 | $17,990 | $3,331 |
| 2018 | $44,604,440 | $16,796 | $3,378 |
| 2017 | $42,135,714 | $17,157 | $3,180 |
Statistical table 3. Unreduced pensions, immediate pensionsStatistical table 3.1 note 1 by age group
| Year | 50 to 54Statistical table 3.1 note 2 | 55 | 56 | 57 | 58 | 59 | 60 |
|---|---|---|---|---|---|---|---|
| 2019 | 91 | 666 | 389 | 272 | 319 | 494 | 1,216 |
| 2018 | 49 | 913 | 499 | 373 | 384 | 318 | 1,712 |
| 2017 | 54 | 1,124 | 487 | 422 | 372 | 313 | 1,145 |
| Year | 61 | 62 | 63 | 64 | 65 | 66 and over | Total |
|---|---|---|---|---|---|---|---|
| 2019 | 723 | 508 | 444 | 414 | 516 | 1,129 | 7,181 |
| 2018 | 636 | 470 | 407 | 390 | 472 | 1,018 | 7,641 |
| 2017 | 522 | 450 | 388 | 300 | 414 | 830 | 6,821 |
Statistical table 3.1 Notes
|
|||||||
| Year | Average age | Male | Female | Average unreduced pension | Male | Female |
|---|---|---|---|---|---|---|
| 2019 | 62.1 | 62.6 | 61.7 | $42,013 | $47,116 | $39,827 |
| 2018 | 60.8 | 61.3 | 60.4 | $42,623 | $44,817 | $38,925 |
| 2017 | 60.0 | 60.9 | 59.9 | $41,832 | $41,293 | $42,295 |
| Year | Male | Female | Total |
|---|---|---|---|
| 2019 | 153 | 205 | 358 |
| 2018 | 2,124 | 1,601 | 3,725 |
| 2017 | 212 | 320 | 532 |
Statistical table 4. Reduced pensions (annual allowances) and lump‑sum payments that became payable
| Year | Male | Female | Total | Average allowance |
|---|---|---|---|---|
| 2019 | 569 | 863 | 1,432 | $37,723 |
| 2018 | 444 | 834 | 1,278 | $35,010 |
| 2017 | 541 | 927 | 1,468 | $32,912 |
Statistical table 4.1 Notes
|
||||
| Year | Number | Amount |
|---|---|---|
| 2019 | 7,088 | $418,562,804 |
| 2018 | 6,549 | $340,990,108 |
| 2017 | 10,330 | $392,483,005 |
Statistical table 4.2 Notes
|
||
Statistical table 5. Changes in number of active members, retired members and survivors
| Male | Female | Total | |
|---|---|---|---|
| Number of active members (as at March 31, 2018) | 133,831 | 169,652 | 303,483 |
| Additions | 16,722 | 22,058 | 38,780 |
| DeletionsStatistical table 5.1 note 1 | 11,148 | 12,961 | 24,109 |
| AdjustmentsStatistical table 5.1 note 2 | 6 | -6 | 0 |
| Number of active members (as at March 31, 2019) | 139,411 | 178,743 | 318,154 |
Statistical table 5.1 Notes
|
|||
| Male | Female | Total | |
|---|---|---|---|
| Number of retired members (as at March 31, 2018) | 118,210 | 103,959 | 222,169 |
| Additions | 4,165 | 5,456 | 9,621 |
| Deletions | 4,310 | 2,519 | 6,829 |
| Number of retired members (as at March 31, 2019) | 118,065 | 106,896 | 224,961 |
| Male | Female | Total | |
|---|---|---|---|
| Number of survivors receiving benefits (as at March 31, 2018) | 6,677 | 46,403 | 53,080 |
| Additions | 567 | 2,274 | 2,841 |
| Deletions | 340 | 2,911 | 3,251 |
| AdjustmentsStatistical table 5.3 note 1 | 0 | 1 | 1 |
| Number of survivors receiving benefits (as at March 31, 2019) | 6,904 | 45,767 | 52,671 |
Statistical table 5.3 Notes
|
|||
| Male | Female | Total | |
|---|---|---|---|
| Number of children and students receiving benefits (as at March 31, 2018) | 488 | 547 | 1,035 |
| Additions | 105 | 120 | 225 |
| Deletions | 75 | 100 | 175 |
| Number of children and students receiving benefits (as at March 31, 2019) | 518 | 567 | 1,085 |
Statistical table 6. Number of transfer‑value payments by years of pensionable service and age at termination
| Years of pensionable service | Age at termination | ||||||
|---|---|---|---|---|---|---|---|
| Under 30 | 30 to 34 | 35 to 39 | 40 to 44 | 45 to 49 | 50 to 55 | Total | |
| Under 5 | 211 | 158 | 119 | 82 | 71 | 64 | 705 |
| 5 to 9 | 55 | 185 | 182 | 128 | 83 | 26 | 659 |
| 10 to 14 | 2 | 48 | 111 | 151 | 100 | 29 | 441 |
| 15 to 19 | 0 | 0 | 24 | 102 | 109 | 40 | 275 |
| 20 to 24 | 0 | 0 | 2 | 8 | 29 | 24 | 63 |
| 25 to 29 | 0 | 0 | 0 | 2 | 19 | 22 | 43 |
| 30 to 35 | 0 | 0 | 0 | 0 | 3 | 7 | 10 |
| Overall total | 268 | 391 | 438 | 473 | 414 | 212 | 2,196 |
| Total female | 131 | 192 | 239 | 263 | 227 | 129 | 1,181 |
| Total male | 137 | 199 | 199 | 210 | 187 | 83 | 1,015 |
Statistical table 7. Supplementary death benefit: Number of participants and number of benefits paid
| Year | Male | Female | Total |
|---|---|---|---|
| 2019 | 138,348 | 177,604 | 315,952 |
| 2018 | 132,291 | 169,940 | 302,231 |
| 2017 | 129,784 | 166,240 | 296,024 |
Statistical table 7.1 Notes
|
|||
| Year | Male | Female | Total |
|---|---|---|---|
| 2019 | 98,223 | 90,328 | 188,551 |
| 2018 | 97,698 | 86,914 | 184,612 |
| 2017 | 97,480 | 83,495 | 180,975 |
Statistical table 7.2 Notes
|
|||
| Year | Male | Female | Total | Amount paid |
|---|---|---|---|---|
| 2019 | 3,030 | 1,497 | 4,527 | $185,503,518 |
| 2018 | 3,038 | 1,481 | 4,519 | $181,302,900 |
| 2017 | 2,685 | 1,178 | 3,863 | $170,188,781 |
Account transaction statements
Public Service Superannuation Account
Before April 2000, all pension transactions accumulated in relation to the pension plan were accounted for, and recorded in, the Public Service Superannuation Account in the Public Accounts of Canada.
The Public Service Superannuation Account does not consist of investments such as cash or marketable securities. It is used to record transactions such as contributions, benefit payments, interest, administrative expenses and other charges that pertain to service accrued before April 1, 2000.
The interest is credited quarterly at rates calculated as though the net cash flows were invested quarterly in 20-year Government of Canada bonds issued at prescribed rates and held to maturity.
| 2019 | 2018 | |
|---|---|---|
| Opening balance (A) | $92,536,360,415 | $94,209,273,550 |
| Receipts and other credits | ||
| Employee contributions | ||
Government employees |
$970,947 | $1,315,935 |
Retired employees |
$4,560,109 | $6,815,848 |
Public service corporation employees |
$102,235 | $173,134 |
| Employer contributions | ||
Government |
$4,597,075 | $6,835,107 |
Public service corporations |
$30,348 | $242,136 |
| Actuarial adjustment | $3,107,000,000 | $0 |
| Transfers from other pension plans | $811,542 | $166,299 |
| Interest | $3,592,782,645 | $3,829,428,464 |
| Other | $655 | $0 |
| Total receipts and other credits (B) | $6,710,855,556 | $3,844,976,923 |
| Payments and other charges | ||
| Pensions | $5,455,468,734 | $5,413,342,616 |
| Minimum benefits | $14,876,476 | $15,545,715 |
| Pension division payments | $16,527,961 | $17,052,340 |
| Pension transfer value payments | $10,226,553 | $13,257,051 |
| Return of contributions | ||
Government employees |
$158,122 | $317,101 |
Public service corporation employees |
$0 | $19,162 |
| Transfers to other pension plans | $3,567,649 | $3,460,193 |
| Administrative expenses | $46,206,677 | $54,895,880 |
| Total payments and other charges (C) | $5,547,032,172 | $5,517,890,058 |
| Receipts less payments (B − C) = (D) | $1,163,823,384 | $(1,672,913,135) |
| Closing balance (A + D) | $93,700,183,799 | $92,536,360,415 |
|
|
||
Public Service Pension Fund
All pension transactions related to service accrued since April 1, 2000, are recorded in the Public Service Pension Fund in the Public Accounts of Canada. An amount equal to contributions in excess of benefit payments and government organizations’ administrative expenses is transferred regularly to the PSPIB for investment. The balance in the Public Service Pension Fund at year‑end represents net contributions transferable to the PSPIB.
The treatment of any actuarial surplus or deficit in the fund is outlined in the financial statements of the public service pension plan, which are included in this report.
The Public Service Superannuation Act requires that any actuarial deficit be dealt with by transferring equal instalments to the pension fund over a period of up to 15 years, starting in the year in which the actuarial report is tabled in Parliament.
| 2019 | 2018 | |
|---|---|---|
| Opening balance (A) | $314,775,347 | $322,529,984 |
| Receipts and other credits | ||
| Employee contributions | ||
Government employees |
$2,376,806,578 | $2,169,100,496 |
Retired employees |
$51,260,689 | $45,516,546 |
Public service corporation employees |
$199,311,621 | $199,435,058 |
| Employer contributions | ||
Government |
$2,375,589,814 | $2,175,183,716 |
Public service corporations |
$194,603,113 | $196,270,115 |
| Actuarial adjustment | $0 | $340,000,000 |
| Transfers from other pension plans | $56,599,226 | $50,661,941 |
| Total receipts and other credits (B) | $5,254,171,041 | $5,176,167,872 |
| Payments and other charges | ||
| Annuities | $2,255,301,448 | $2,001,624,358 |
| Minimum benefits | $18,908,212 | $15,266,575 |
| Pension division payments | $41,588,334 | $36,665,209 |
| Pension transfer value payments | $287,919,644 | $218,599,278 |
| Return of contributions | ||
Government employees |
$11,147,567 | $10,757,037 |
Public service corporation employees |
$4,576,716 | $3,886,809 |
| Transfers to other pension plans | $42,850,913 | $36,975,930 |
| Administrative expenses | $51,730,323 | $45,960,045 |
| Total payments and other charges (C) | $2,714,023,157 | $2,369,735,241 |
| Receipts less payments (B − C) | $2,540,147,884 | $2,806,432,631 |
| Transfers to PSPIB (D) | $(2,838,324,652) | $(2,814,187,268) |
| Closing balance (A + B − C + D) | $16,598,579 | $314,775,347 |
|
|
||
Retirement Compensation Arrangements
Supplementary benefits for certain federal public service employees are provided under the Retirement Compensation Arrangements Regulations, No. 1, Parts I and II (public service portion), and the Retirement Compensation Arrangements Regulations, No. 2 (Early Retirement Incentive Program). These regulations were established under the Special Retirement Arrangements Act for the purpose of paying benefits and established the Retirement Compensation Arrangements for the payment of benefits.
Transactions pertaining to Retirement Compensation Arrangement No. 1 and Retirement Compensation Arrangement No. 2, such as contributions,Footnote 4 benefits and interest credits, are recorded in the Retirement Compensation Arrangements Account in the Public Accounts of Canada. The Retirement Compensation Arrangements Account is credited with interest quarterly at the same rates as those credited to the Public Service Superannuation Account.
The Retirement Compensation Arrangements Account is registered with the Canada Revenue Agency, and a transfer is made annually between the Retirement Compensation Arrangements Account and the Canada Revenue Agency either to remit a 50% refundable tax for the net contributions and interest credits or to be credited a reimbursement based on the net benefit payments.
Any actuarial shortfalls found between the balance and the actuarial liabilities in the Retirement Compensation Arrangements Account are credited to the Retirement Compensation Arrangements Account in equal instalments over a period of up to 15 years. These adjustments are based on triennial actuarial valuations.
Retirement Compensation Arrangement No. 1
| 2019 | 2018 | |
|---|---|---|
| Opening balance (A) | $1,241,175,803 | $1,193,245,711 |
| Receipts and other credits | ||
| Employee contributions | ||
Government employees |
$10,658,710 | $8,980,064 |
Retired employees |
$549,149 | $569,949 |
Public service corporation employees |
$2,363,356 | $2,374,935 |
| Employer contributions | ||
Government |
$33,859,345 | $67,312,931 |
Public service corporations |
$7,602,054 | $17,247,731 |
| Transfers from other pension plans | $55,091 | $356 |
| Interest | $48,511,115 | $50,240,945 |
| Total receipts and other credits (B) | $103,598,820 | $146,726,911 |
| Payments and other charges | ||
| Annuities | $49,076,877 | $45,045,351 |
| Minimum benefits | $165,060 | $39 |
| Pension division payments | $891,847 | $271,948 |
| Pension transfer value payments | $865,081 | $634,514 |
| Return of contributions | ||
Government employees |
$3,271 | $69,079 |
Public service corporation employees |
$18,322 | $7,769 |
| Transfers to other pension plans | $238,368 | $1,038,273 |
| Refundable tax | $27,876,968 | $51,729,846 |
| Total payments and other charges (C) | $79,135,794 | $98,796,819 |
| Receipts less payments (B − C) = (D) | $24,463,026 | $47,930,092 |
| Closing balance (A + D) | $1,265,638,829 | $1,241,175,803 |
|
|
||
Retirement Compensation Arrangement No. 2
| 2019 | 2018 | |
|---|---|---|
| Opening balance (A) | $688,734,759 | $717,522,186 |
| Receipts and other credits | ||
| Government interest | $26,271,701 | $28,510,933 |
| Total receipts and other credits (B) | $26,271,701 | $28,510,933 |
| Payments and other charges | ||
| Annuities | $84,797,589 | $84,757,461 |
| Refundable tax | $(28,921,208) | $(27,459,101) |
| Total payments and other charges (C) | $55,876,381 | $57,298,360 |
| Receipts less payments (B − C) = (D) | $(29,604,680) | $(28,787,427) |
| Closing balance (A + D) | $659,130,079 | $688,734,759 |
|
|
||
Supplementary death benefit
| 2019 | 2018 | |
|---|---|---|
| Opening balance (A) | $3,714,705,845 | $3,626,907,397 |
| Receipts and other credits | ||
| Contributions | ||
Employees (government and public service corporation) |
$109,099,985 | $102,889,773 |
| Government | ||
General |
$12,016,107 | $11,899,531 |
Single premium for $10,000 benefit |
$3,131,353 | $3,058,443 |
Public service corporations |
$1,569,400 | $1,514,931 |
| Interest | $144,845,552 | $149,738,670 |
| Total receipts and other credits (B) | $270,662,397 | $269,101,348 |
| Payments and other charges | ||
| Benefit payments | ||
Generaltable 29 note 1 |
$143,784,511 | $142,436,539 |
$10,000 benefittable 29 note 2 |
$41,310,237 | $38,508,525 |
Other death benefit payments |
$408,770 | $357,836 |
| Total payments and other charges (C) | $185,503,518 | $181,302,900 |
| Receipts less payments (B − C) = (D) | $85,158,879 | $87,798,448 |
| Closing balance (A + D) | $3,799,864,724 | $3,714,705,845 |
Table 29 Notes
|
||
Glossary
- actuarial valuation
- An actuarial analysis that provides information on the financial condition of a pension plan.
- administrative expenses
- Expenses by government departments for the administration of the public service pension plan and for operating expenses incurred by the Public Sector Pension Investment Board to invest pension assets. Investment management fees are either paid directly by the Public Sector Pension Investment Board or offset against distributions received from the investments.
- annual allowance
- An annual benefit available to public service pension plan members who have more than 2 years of pensionable service, who retire before age 60 (Group 1) or before age 65 (Group 2), and who are not entitled to an immediate annuity. This benefit is a reduced pension that takes into account the early payment of a retirement pension. The earliest it becomes payable is at age 50 (Group 1) or at age 55 (Group 2).
- benchmark rate of return
- A standard against which rates of return can be measured, such as stock and bond market indexes developed by stock exchanges and investment managers.
- Canada Pension Plan
- A mandatory earnings‑related pension plan, implemented on January 1, 1966, to provide basic retirement income to Canadians who work in all the provinces and territories except Quebec, which runs its own pension plan (see Québec Pension Plan).
- child
- For the purposes of the public service pension plan, a dependant who may be entitled to a children’s allowance under the public service pension plan in the event of a plan member’s death. To be eligible for an allowance, a child must be under 18 years of age. Children between 18 and 25 may receive allowances if they are enrolled in school or another educational institution full-time and have attended continuously since the age of 18 or the date of the member’s death, whichever occurs later.
- Consumer Price Index
- A measure of price changes published by Statistics Canada on a monthly basis. The Consumer Price Index measures the retail prices of about 300 goods and services, including food, housing, transportation, clothing and recreation. The index is weighted, meaning that it gives greater importance to price changes for some products than others (for example, more to housing than to entertainment), in an effort to reflect typical spending patterns. Increases in the Consumer Price Index are also referred to as “cost‑of‑living increases.”
- defined benefit pension plan
- A type of pension plan that offers eligible members a certain level of pension, which is usually based on their salary and years of service.
- disability
- A physical or mental impairment that prevents an individual from engaging in any employment for which the individual is reasonably suited by virtue of his or her education, training or experience and that can reasonably be expected to last for the rest of the individual’s life.
- Group 1
- Members of the public service pension plan who were participating in the plan on or before December 31, 2012.
- Group 2
- Members of the public service pension plan who began participating in the plan on or after January 1, 2013.
- immediate annuity
- An annual benefit payable to public service plan members who retire at any time after reaching age 60 (Group 1) or age 65 (Group 2) and have at least 2 years of pensionable service, or after reaching age 55 (Group 1) or age 60 (Group 2) and have at least 30 years of pensionable service. An immediate annuity is also payable at any age to plan members who have at least 2 years of pensionable service and are retiring because of disability.
- indexation
- The automatic adjustment of pensions in pay or accrued pension benefits (deferred annuities) in accordance with changes in the Consumer Price Index.
- minimum benefit
- A benefit that is equal to the payment of a public service pension plan member’s basic pension for a period of 5 years. If the plan member or his or her eligible surviving spouse or children have not received, in total, pension payments equal to 5 times the amount of the plan member’s annual basic pension, the balance in the form of a lump-sum amount becomes payable to his or her designated beneficiary for the supplementary death benefit or, if there is no beneficiary, to his or her estate.
- net assets available for benefits
- Assets that include receivables and other assets, and the fair value of the assets held by the Public Sector Pension Investment Board on behalf of the pension plan, net of Public Sector Pension Investment Board liabilities.
- pensionable service
- Periods of service credited to a member of the public service pension plan. This service includes any complete or partial periods of purchased service (for example, service buyback).
- Public Sector Pension Investment Board
- A Crown corporation established on April 1, 2000, under the Public Sector Pension Investment Board Act. The corporation’s mandate is to invest in capital markets the amounts transferred to it since April 1, 2000, by the Government of Canada with respect to the public service pension plan. The Public Sector Pension Investment Board operates under the commercial name of PSP Investments. Both names are used interchangeably throughout this report.
- Québec Pension Plan
- A pension plan similar to the Canada Pension Plan that covers individuals working in the province of Quebec. It is administered by Retraite Québec.
- return of contributions
- A benefit that is available to contributors who leave the public service with less than 2 years of pensionable service under the public service pension plan. It consists of their contributions plus interest, if applicable.
- service buyback
- A legally binding agreement to purchase a period of past service to increase a member’s pensionable service under the federal public service pension plan. Past service can include eligible periods of employment, either in the public service or with another employer. Members can elect to purchase any eligible past service before they terminate employment.
- Supplementary death benefit
- A decreasing life insurance benefit equal to twice the annual salary of a public service plan member. Coverage decreases by 10% per year starting at age 66. A minimum amount of coverage ($10,000) is provided at no cost to the plan member at age 65 for plan members entitled to an immediate annuity or an annual allowance payable within 30 days after termination of employment in the public service. This minimum coverage is maintained for life.
- survivor
- The person who, at the time of plan member’s death, was married to the plan member before his or her retirement, or was cohabiting with the plan member in a conjugal relationship before retirement and for at least one year before the date of death.
- survivor benefit
- A pension benefit paid to the survivor of a plan member who has died.
- transfer agreement
- An agreement negotiated between the Government of Canada and an eligible employer to provide portability of accrued pension credits from one pension plan to another.
- transfer value
- A benefit option available to public service pension plan members who leave the public service before age 50 (Group 1) or before age 55 (Group 2) with at least 2 years of pensionable service. This benefit is the actuarial value of the plan member’s accrued pension benefits. It must be transferred to another registered pension plan, to a retirement savings vehicle, or to a financial institution to purchase an annuity.
- vested member
- An employee who has at least 2 years of pensionable service, in other words, who has been a member of the public service pension plan for an uninterrupted period of 2 years.
- year’s maximum pensionable earnings
- The maximum earnings on which contributions can be made to the Canada Pension Plan and the Québec Pension Plan during the year.
Financial statements of the public service pension plan for the fiscal year ended
Statement of responsibility
Responsibility for the integrity and fairness of the financial statements of the public service pension plan (the pension plan) rests with Public Services and Procurement Canada (PSPC) and the Treasury Board of Canada Secretariat (the Secretariat). The Secretariat carries out responsibilities in respect of the overall management of the pension plan, while PSPC is responsible for the day‑to‑day administration of the pension plan and for maintaining the books of accounts.
PSPC and the Secretariat have prepared the financial statements of the pension plan for the year ended March 31, 2019, in accordance with the stated accounting policies set out in Note 2 of the financial statements, which are based on Canadian accounting standards for pension plans. The presentation and results using the stated accounting policies do not result in any significant differences from Canadian accounting standards for pension plans. The financial statements include management’s best estimates and judgments where appropriate.
To fulfill its accounting and reporting responsibilities, PSPC has developed and maintains books, records, internal controls, and management practices designed to provide reasonable assurance as to the reliability of the financial information and to ensure that transactions are in accordance with the Public Service Superannuation Act (PSSA) and regulations, as well as the Financial Administration Act (FAA) and regulations.
Additional information, as required, is obtained from the Public Sector Pension Investment Board (PSPIB). PSPIB maintains its own records and systems of internal control to account for the funds managed on behalf of the pension plan in accordance with the Public Sector Pension Investment Board Act, regulations and by-laws.
These statements have been audited by the Auditor General of Canada, the independent auditor for the Government of Canada.
Approved by:
Bill Matthews
Deputy Minister
Public Services and Procurement Canada
Original signed
Peter Wallace
Secretary of the Treasury Board
Treasury Board of Canada Secretariat
Original signed
Independent Auditor’s report
To the President of the Treasury Board and the Minister of Public Services and Procurement
Report on the Audit of the Financial Statements
Opinion
We have audited the financial statements of the public service pension plan (the pension plan), which comprise the statement of financial position as at 31 March 2019, and the statement of changes in net assets available for benefits and statement of changes in pension obligations for the year then ended, and notes to the financial statements, including a summary of significant accounting policies.
In our opinion, the accompanying financial statements present fairly, in all material respects, the financial position of the pension plan as at 31 March 2019, and the changes in its net assets available for benefits and changes in its pension obligations for the year then ended in accordance with Canadian accounting standards for pension plans.
Basis for Opinion
We conducted our audit in accordance with Canadian generally accepted auditing standards. Our responsibilities under those standards are further described in the Auditor’s Responsibilities for the Audit of the Financial Statements section of our report. We are independent of the pension plan in accordance with the ethical requirements that are relevant to our audit of the financial statements in Canada, and we have fulfilled our other ethical responsibilities in accordance with these requirements. We believe that the audit evidence we have obtained is sufficient and appropriate to provide a basis for our opinion.
Responsibilities of Management and Those Charged with Governance for the Financial Statements
Management is responsible for the preparation and fair presentation of the financial statements in accordance with the stated accounting policies set out in Note 2 of the financial statements, which are based on Canadian accounting standards for pension plans, and for such internal control as management determines is necessary to enable the preparation of financial statements that are free from material misstatement, whether due to fraud or error.
In preparing the financial statements, management is responsible for assessing the pension plan’s ability to continue as a going concern, disclosing, as applicable, matters related to going concern and using the going concern basis of accounting unless management either intends to liquidate the pension plan or to cease operations, or has no realistic alternative but to do so.
Those charged with governance are responsible for overseeing the pension plan’s financial reporting process.
Auditor’s Responsibilities for the Audit of the Financial Statements
Our objectives are to obtain reasonable assurance about whether the financial statements as a whole are free from material misstatement, whether due to fraud or error, and to issue an auditor’s report that includes our opinion. Reasonable assurance is a high level of assurance, but is not a guarantee that an audit conducted in accordance with Canadian generally accepted auditing standards will always detect a material misstatement when it exists. Misstatements can arise from fraud or error and are considered material if, individually or in the aggregate, they could reasonably be expected to influence the economic decisions of users taken on the basis of these financial statements.
As part of an audit in accordance with Canadian generally accepted auditing standards, we exercise professional judgment and maintain professional skepticism throughout the audit. We also:
- Identify and assess the risks of material misstatement of the financial statements, whether due to fraud or error, design and perform audit procedures responsive to those risks, and obtain audit evidence that is sufficient and appropriate to provide a basis for our opinion. The risk of not detecting a material misstatement resulting from fraud is higher than for one resulting from error, as fraud may involve collusion, forgery, intentional omissions, misrepresentations, or the override of internal control.
- Obtain an understanding of internal control relevant to the audit in order to design audit procedures that are appropriate in the circumstances, but not for the purpose of expressing an opinion on the effectiveness of the pension plan’s internal control.
- Evaluate the appropriateness of accounting policies used and the reasonableness of accounting estimates and related disclosures made by management.
- Conclude on the appropriateness of management’s use of the going concern basis of accounting and, based on the audit evidence obtained, whether a material uncertainty exists related to events or conditions that may cast significant doubt on the pension plan’s ability to continue as a going concern. If we conclude that a material uncertainty exists, we are required to draw attention in our auditor’s report to the related disclosures in the financial statements or, if such disclosures are inadequate, to modify our opinion. Our conclusions are based on the audit evidence obtained up to the date of our auditor’s report. However, future events or conditions may cause the pension plan to cease to continue as a going concern.
- Evaluate the overall presentation, structure and content of the financial statements, including the disclosures, and whether the financial statements represent the underlying transactions and events in a manner that achieves fair presentation.
- Obtain sufficient appropriate audit evidence regarding the financial information of the entities or business activities within the pension plan to express an opinion on the financial statements. We are responsible for the direction, supervision, and performance of the group audit. We remain solely responsible for our audit opinion.
We communicate with those charged with governance regarding, among other matters, the planned scope and timing of the audit and significant audit findings, including any significant deficiencies in internal control that we identify during our audit.
Report on Compliance with Specified Authorities
Opinion
In conjunction with the audit of the financial statements, we have audited transactions of the public service pension plan coming to our notice for compliance with specified authorities. The specified authorities against which compliance was audited are the Public Service Superannuation Act and regulations, the Public Sector Pension Investment Board Act and regulations, and the by-laws of the Public Sector Pension Investment Board.
In our opinion, the transactions of the public service pension plan that came to our notice during the audit of the financial statements have complied, in all material respects, with the specified authorities referred to above.
Responsibilities of Management for Compliance with Specified Authorities
Management is responsible for the public service pension plan’s compliance with the specified authorities named above, and for such internal control as management determines is necessary to enable the public service pension plan to comply with the specified authorities.
Auditor’s Responsibilities for the Audit of Compliance with Specified Authorities
Our audit responsibilities include planning and performing procedures to provide an audit opinion and reporting on whether the transactions coming to our notice during the audit of the financial statements are in compliance with the specified authorities referred to above.
Mélanie Cabana, CPA, CA
Principal for the Interim Auditor General of Canada
Ottawa, Canada
16 January 2020
Financial statements
| As at | As at | |
|---|---|---|
| Assets | ||
|
Public Service Pension Fund (Note 4)
|
$17 | $315 |
|
Investments (Note 5)
|
144,624 | 129,877 |
|
Contributions receivable
|
||
|
From plan members (Note 8)
|
585 | 483 |
|
From employers (Note 8)
|
509 | 412 |
|
Other assets (Note 9)
|
140 | 165 |
| Total assets | $145,875 | $131,252 |
| Liabilities | ||
|
Investment-related liabilities (Note 5)
|
$12,298 | $9,928 |
|
Accounts payable and other liabilities
|
232 | 199 |
| 10,260 | 8,849 | |
| Net assets available for benefits | $123,085 | $112,276 |
| Pension obligations | ||
|
Funded (Note 13)
|
$100,467 | $93,030 |
| 117,159 | 114,603 | |
| Total pension obligations | $217,626 | $207,633 |
| Deficit to be financed by the Government of Canada (Note 14) | $(94,541) | $(95,357) |
|
Commitments (Note 24) The accompanying notes are an integral part of these financial statements. |
||
| 2019 | 2018 | |
|---|---|---|
| Net assets available for benefits, beginning of year | $112,276 | $99,861 |
| Increase in net assets available for benefits | ||
|
Investment income, excluding changes in fair values of investment assets and investment liabilities (Note 15)
|
3,861 | 2,994 |
|
Changes in fair values of investment assets and investment liabilities, realized and unrealized gains and losses (Note 15)
|
5,098 | 7,567 |
|
Contributions
|
||
|
From plan members (Note 16)
|
2,729 | 2,314 |
|
From employers (Note 16)
|
2,668 | 2,275 |
|
Actuarial adjustment (Note 17)
|
0 | 340 |
|
Transfers from other pension plans
|
56 | 51 |
| Total increase in net assets available for benefits | $14,412 | $15,541 |
| Decrease in net assets available for benefits | ||
|
Benefits paid with respect to service after (Note 18)
|
$2,274 | $2,017 |
|
Refunds and transfers (Note 18)
|
388 | 307 |
|
Investment-related expenses (Note 19)
|
521 | 419 |
|
Administrative expenses (Note 20)
|
420 | 383 |
| Total decrease in net assets available for benefits | $3,603 | $3,126 |
| Net increase in net assets available for benefits | $10,809 | $12,415 |
| Net assets available for benefits, end of year | $123,085 | $112,276 |
|
The accompanying notes are an integral part of these financial statements. |
||
| 2019 Funded |
2019 Unfunded |
2019 Total |
2018 Funded |
2018 Unfunded |
2018 Total |
|
|---|---|---|---|---|---|---|
| Pension obligations, beginning of year | $93,030 | $114,603 | $207,633 | $87,407 | $117,330 | $204,737 |
| Increase in pension obligations | ||||||
|
Interest on pension obligations
|
4,706 | 2,449 | 7,155 | 4,256 | 2,509 | 6,765 |
|
Benefits earned
|
4,843 | 0 | 4,843 | 4,823 | 0 | 4,823 |
|
Experience losses (gains)table 25 note 1 (Note 13)
|
122 | 310 | 432 | (12) | 1,022 | 1,010 |
|
Changes in actuarial assumptions: losses (gains)table 25 note 1 (Note 13)
|
532 | 5,354 | 5,886 | (1,125) | (740) | (1,865) |
|
Transfers from other pension plans
|
56 | 1 | 57 | 51 | 0 | 51 |
| Total increase in pension obligations | $10,259 | $8,114 | $18,373 | $7,993 | $2,791 | $10,784 |
| Decrease in pension obligations | ||||||
|
Benefits paid (Note 18)
|
$2,274 | $5,471 | $7,745 | $2,017 | $5,429 | $7,446 |
|
Refunds and transfers (Note 18)
|
388 | 31 | 419 | 307 | 34 | 341 |
| 52 | 46 | 98 | 46 | 55 | 101 | |
|
Pension plan curtailment gains (Note 13)
|
108 | 10 | 118 | 0 | 0 | 0 |
| Total decrease in pension obligations | $2,822 | $5,558 | $8,380 | $2,370 | $5,518 | $7,888 |
| Net increase (decrease) in pension obligations | $7,437 | $2,556 | $9,993 | $5,623 | $(2,727) | $2,896 |
| Pension obligations, end of year | $100,467 | $117,159 | $217,626 | $93,030 | $114,603 | $207,633 |
Table 25 Notes
The accompanying notes are an integral part of these financial statements. |
||||||
Notes to the financial statements
For the fiscal year ended (Canadian $)
1. Description of the public service pension plan
The public service pension plan (the pension plan), governed by the Public Service Superannuation Act (PSSA), provides pension benefits for federal public service employees. While the PSSA has been in effect since January 1, 1954, federal legislation has been providing pensions for public servants since 1870.
The main provisions of the pension plan are summarized below.
(A) General
The pension plan is a contributory defined benefit plan covering substantially all of the full-time and part-time employees of the federal public service, as well as certain public service corporations as defined in the PSSA, and territorial governments. Membership in the pension plan is compulsory for all eligible employees.
The Government of Canada (the government) is the sole sponsor of the pension plan. The President of the Treasury Board is the Minister responsible for the PSSA. The Treasury Board of Canada Secretariat (the Secretariat) is responsible for the management of the pension plan while Public Services and Procurement Canada (PSPC) provides the day-to-day administration of the pension plan and maintains the books of accounts. The Office of the Chief Actuary (OCA), an independent unit within the Office of the Superintendent of Financial Institutions (OSFI), performs periodic actuarial valuations of the pension plan.
Until April 1, 2000, separate invested funds were not set aside to provide for payment of pension benefits. Instead, transactions relating to the pension plan were recorded in the Public Service Superannuation Account (superannuation account) created by legislation in the accounts of Canada. Pursuant to the PSSA, as amended by the Public Sector Pension Investment Board Act, transactions relating to service since April 1, 2000, are now recorded in the Public Service Pension Fund (pension fund). An amount equal to contributions in excess of benefit payments and administrative costs is transferred regularly to the Public Sector Pension Investment Board (PSPIB) for investment. PSPIB is a Crown corporation whose statutory objectives are to manage the funds transferred to it for investment and to maximize investment returns without undue risk of loss, having regard to the funding, policies and requirements of the three main public sector pension plans (public service, Royal Canadian Mounted Police (RCMP) and Canadian Forces).
(B) Funding policy
The pension plan is funded from plan member and employer contributions, and from investment earnings. For the fiscal year, public service employees who were members of the pension plan on or before December 31, 2012 (Group 1) contributed 9.83% (9.47% in 2018) for the first 9 months and 9.56% (9.83% in 2018) for the last 3 months of pensionable earnings up to the maximum covered by the Canada Pension Plan (CPP) or Québec Pension Plan (QPP); and 12.13% (11.68% in 2018) for the first 9 months and 11.78% (12.13% in 2018) for the last 3 months of pensionable earnings above that maximum.
The contribution rates for public service employees joining the pension plan on or after January 1, 2013 (Group 2) was set at 8.77% (8.39% in 2018) for the first 9 months and 8.68% (8.77% in 2018) for the last 3 months of pensionable earnings up to the maximum covered by the CPP and QPP; and 10.46% (9.94% in 2018) for the first 9 months and 10.18% (10.46% in 2018) for the last 3 months of pensionable earnings above that maximum. The government’s contribution is made monthly to provide for the cost (net of plan member contributions) of the benefits that have accrued in respect of that month at a rate determined by the President of the Treasury Board. The contribution rates are determined based on actuarial valuations for funding purposes, which are normally performed triennially.
The PSSA provides that all pension obligations arising from the pension plan be met by the government. The PSSA requires that any actuarial deficit in the pension fund be dealt with by transferring equal instalments to the pension fund over a period of up to 15 years, commencing in the year in which the actuarial report is tabled in Parliament. The PSSA also allows any surplus to be lowered by reducing employer and pension plan member contributions. In addition, if there is an amount considered to be a non-permitted surplus (refer to PSSA section 44.4(5) for the definition of non-permitted surplus) related to the pension fund, no further government pension contributions are permitted while pension plan member contributions under the pension fund may be reduced and amounts managed by PSPIB may be transferred to the government’s Consolidated Revenue Fund (CRF).
(C) Benefits
The pension plan provides pension benefits based on the number of years of pensionable service up to a maximum of 35 years. Benefits are determined by a formula set out in the legislation; they are not based on the financial status of the pension plan. The basic benefit formula is 2% per year of pensionable service multiplied by the average of the 5 consecutive years of highest paid service. To reflect the Income Tax Act restrictions on registered pension plan benefits, separate retirement compensation arrangements (RCAs) have been implemented to provide benefits that exceed the limits established in the Income Tax Act. Since the RCAs are covered by separate legislation, their account balances in the accounts of Canada are not consolidated in these financial statements; however, condensed information is presented in Note 22.
Pension benefits are coordinated with the CPP and QPP, and the resulting pension reduction factor for pension plan members reaching age 65, or earlier if totally and permanently disabled, has been lowered from a level of 0.7% for those turning age 65 in calendar year 2007 or earlier and to 0.625% for those turning age 65 in calendar year 2012 and later. Also, benefits are fully indexed to the increase in the Consumer Price Index.
Other benefits include survivor pensions, minimum benefits in the event of death, unreduced early retirement pensions, and disability pensions.
2. Significant accounting policies
The significant accounting policies that have been applied in the preparation of these financial statements are summarized below.
(A) Basis of presentation
These financial statements present information on the pension plan on a going-concern basis. They are prepared to assist plan members and others in reviewing the activities of the pension plan for the year, not to portray the funding requirements of the pension plan.
These financial statements are prepared in Canadian dollars, the plan’s functional currency, in accordance with the accounting policies stated below, which are based on Canadian accounting standards for pension plans in Part IV of the Chartered Professional Accountants (CPA) Canada Handbook (Section 4600). Section 4600 provides specific accounting guidance on investments and pension obligations. For accounting policies that do not relate to either investments or pension obligations, the plan complies with International Financial Reporting Standards (IFRS) in Part I of the CPA Canada Handbook. To the extent that IFRS in Part I are inconsistent with Section 4600, Section 4600 takes precedence. The presentation and results using the stated accounting policies do not result in any significant differences from Canadian accounting standards for pension plans.
PSPIB is a Crown corporation whose statutory objectives are to manage the funds transferred to it for investment and to maximize investment returns without undue risk of loss. PSPIB qualifies as an investment entity as defined under IFRS 10 Consolidated Financial Statements and forms part of the pension plan reporting entity. Pursuant to Section 4600, PSPIB’s subsidiaries that are formed to hold investments or those that provide PSPIB with services that relate to its investment activities are consolidated since these entities are not considered investment assets. PSPIB’s investment in subsidiaries, associates, and joint ventures that are considered investment assets are measured at fair value in accordance with Section 4600. Financial liabilities are also measured at fair value in accordance with Section 4600.
The financial statements for the year ended March 31, 2019, were authorized for issue by the signatories on January 16, 2020.
(B) Interests in other entities
Management, through the activities of PSPIB, assesses control, joint control and significant influence with respect to the investees disclosed in Note 6 as follows:
(I) Control and significant influence
It is determined that PSPIB has control over an investee when it is exposed, or has rights, to variable returns from its investment in an entity and has the ability to affect those returns through its power over the investee.
In certain cases, PSPIB does not have control over an investee but has the power to participate in the financial and operating policy decisions of the investee. In such cases, PSPIB determines that it has significant influence over the investee.
In the context of control or significant influence, power over an investee is obtained through voting rights conveyed by PSPIB’s ownership interest, other contractual arrangements, or a combination thereof.
(II) Joint control
It is determined that PSPIB is party to a joint venture arrangement when it has joint control over an investee and has rights to the net assets of the investee. Joint control is established through a contractual arrangement which requires the unanimous consent of the parties sharing control for the activities that significantly affect the returns of the arrangement.
Generally, decision making regarding such activities is governed through voting rights conveyed by the ownership interest of each party. In certain cases, it is governed solely through contractual arrangements or in conjunction with the ownership interest of each party.
(C) Financial instruments
(I) Classification
Financial assets representing investments are managed, together with related financial liabilities, according to the entity’s business model to maximize the rate of return. The performance of such financial instruments is evaluated on a fair value basis and they are classified at fair value through profit or loss (FVTPL). They are described in detail in Note 5(A).
Borrowings, as described under Note 10, are financial liabilities that are designated to be measured at FVTPL since they are part of the portfolios of investments that are managed together and whose performance is evaluated on a fair value basis.
(II) Recognition
Financial assets and financial liabilities are recorded at the date upon which PSPIB becomes a party to the associated contractual provisions. In the case of traded financial assets, they are recorded as of the trade date.
(III) Initial and subsequent measurement
All financial assets and financial liabilities are recorded in the statement of financial position at fair value and continue to be measured as such on a recurring basis. After initial measurement, subsequent changes in the fair value of financial assets and financial liabilities classified at FVTPL are recorded in the statement of changes in net assets available for benefits.
(IV) Derecognition
A financial asset (or, where applicable, a part thereof) is derecognized when the following conditions are met:
- The rights to receive cash flows from the asset have expired, or
- PSPIB has transferred its rights to receive cash flows from the asset or has assumed an obligation to pay the received cash flows to a third party,
and - PSPIB has transferred substantially all the risks and rewards of the asset, or
- In cases where PSPIB has neither transferred nor retained substantially all the risks and rewards of the asset, it has transferred control of the asset.
A financial liability is derecognized when the obligation under the liability is discharged, cancelled or expired.
(D) Determination of fair value
Fair value is the price that would be received to sell an asset or paid to transfer a liability in an orderly transaction between market participants at the measurement date.
At initial recognition, PSPIB evaluates the facts and circumstances related to a transaction to confirm that the transaction price represents the fair value of an asset or a liability. At each subsequent reporting date, market prices are used to determine fair value where an active market exists (such as a recognized securities exchange), as they reflect actual and regularly occurring market transactions on an arm’s length basis. If quoted market prices are not available, then fair value is estimated using valuation techniques based on inputs existing at the end of the reporting period that are derived from observable market data.
Valuation techniques are generally applied to investments in private markets, alternative investments, over-the-counter (OTC) derivatives and certain fixed income securities. The values derived from applying these techniques are impacted by the choice of valuation model and the underlying assumptions made concerning factors such as the amounts and timing of future cash flows, discount rates, volatility and credit risk. In certain cases, such assumptions are not supported by market observable data.
The determination of fair value of all financial assets and financial liabilities is described in Note 5.
(E) Foreign currency translation
Foreign currency transactions during the period, including purchases and sales of securities, income and expenses, are translated at the rate of exchange prevailing on the date of the transaction.
Monetary assets and liabilities that are denominated in foreign currencies are translated at the functional currency rate of exchange prevailing at the end of the reporting period.
Foreign currency transaction gains and losses on all monetary assets and liabilities are included in investment income.
(F) Securities lending and securities borrowing and related collateral
PSPIB participates in securities lending and borrowing programs whereby it lends and borrows securities in order to enhance portfolio returns. Lending and borrowing transactions including related collateral under such programs do not transfer the risks or rewards of ownership of the securities to the counterparty. Consequently, PSPIB does not derecognize securities lent or pledged as collateral, or recognize securities borrowed or received as collateral. Cash collateral received is recognized as described in Note 5(A)(IX).
The securities lending and borrowing programs require collateral in cash, high-quality debt instruments or securities. Collateral transactions are conducted under terms that are usual and customary in standard securities lending and borrowing programs. PSPIB and its counterparties are authorized to sell, repledge or otherwise use collateral held. The same securities or equivalent securities must be returned to the counterparty at the end of the contract, unless an event of default occurs.
(G) Securities sold under repurchase agreements and purchased under reverse repurchase agreements and related collateral
PSPIB is party to repurchase and reverse repurchase agreements. Such agreements involve the sale of securities by one counterparty with a simultaneous agreement to repurchase such securities at a specified price and at a specified future date.
Securities sold or purchased under the repurchase and reverse repurchase agreements respectively, including related collateral, are not derecognized or recognized as all risks and rewards of ownership related to such securities are not transferred. As such, in the case where PSPIB is the counterparty selling securities under such agreements, all income (loss) related to such securities continues to be reported in investment income and obligations to repurchase the securities sold are accounted for as investment-related liabilities.
The difference between the fair value of the securities sold and the repurchase price is recorded as interest expense within investment-related expenses. In the case where PSPIB is the counterparty purchasing securities under such agreements, no income (loss) related to such securities is recognized and obligations to resell the securities are accounted for as investment-related receivables. The difference between the fair value of the securities purchased and resale price is recorded in investment income.
Transactions under repurchase and reverse repurchase agreements involve pledging collateral consisting of cash or securities deemed acceptable by the counterparties. Collateral transactions are conducted under terms that are usual and customary in standard repurchase arrangements. Such terms require the relevant counterparty to pledge additional collateral based on the changes in the fair value of the existing collateral pledged as well as the related securities sold or purchased. The counterparties are authorized to sell, repledge or otherwise use collateral held. The securities pledged as collateral must be returned to the relevant counterparty at the end of the contract, unless an event of default occurs.
(H) Offsetting of financial instruments
Financial assets and financial liabilities are offset with the net amount reported in the statement of financial position only if PSPIB has a current legally enforceable right to offset the recognized amounts and the intent to settle on a net basis, or to realize the assets and settle the liabilities simultaneously.
(I) Pension obligations
The present value of accrued pension benefits is calculated using the projected benefit method prorated on service, based on management’s best estimate of streamed expected rates of return on invested funds for funded pension benefits, and the government’s cost of borrowing derived from the yields on the actual zero-coupon yield curve for Government of Canada bonds, which reflect the timing of the expected future cash flows for unfunded pension benefits.
(J) Investment income
Investment income is made up of interest, dividends, gains (losses) on the disposal of financial assets and financial liabilities as well as gains (losses) which reflect the change in unrealized appreciation (depreciation) of financial assets held and financial liabilities outstanding at the end of the reporting period. Interest is recognized, on a consistent basis, using the prescribed rates until maturity. Dividends are recognized when the right to receive them has been obtained, generally on the ex-dividend date.
(K) Contributions
Contributions for current service are recorded in the year in which the related payroll costs are incurred. Contributions for past service that are receivable over a period in excess of 1 year are recorded at the estimated net present value of the contributions to be received.
(L) Benefits earned, benefits paid, and refunds and transfers
Benefits earned are accrued as employees render pensionable services.
The funded and unfunded benefits paid are recognized as a reduction of pension obligations when the payments are made. The funded benefits paid are recognized as a reduction of net assets available for benefits when the payments are made.
Benefit payments, refunds to former members and transfer payments to other plans are recorded in the period in which they are paid.
(M) Investment-related expenses
Investment-related expenses are made up of interest expense, as described Note 5(A)(VII), transaction costs, external investment management fees and other (net).
Transaction costs are incremental costs directly attributable to the acquisition, due diligence, issue, or disposal of a financial asset or financial liability, and they are expensed as incurred.
External investment management fees are directly attributable to the external management of assets on behalf of PSPIB. These fees are paid directly by PSPIB and comprise base fees accrued as a percentage of the fair value of the assets managed externally and performance fees accrued as a function of various performance indicators. This excludes amounts not paid directly by PSPIB for certain pooled fund investments classified under alternative investments and for investments in private markets as outlined in Note 19.
(N) Significant accounting judgments, estimates and assumptions
In preparing the financial statements, management makes certain judgments, estimates and assumptions that can affect the amounts reported therein. Significant judgments include those related to the determination of the investment entity status of PSPIB as described in Note 2(A).
Management also makes estimates and assumptions in the measurement, risk assessment and related disclosures surrounding investments in private markets, certain fixed income securities and the pension obligations.
The main assumptions made by management regarding measurement of financial instruments are outlined in Note 5(C)(III)), and those regarding the assessment of risk are outlined in Note 7.
The pension obligations are actuarially determined and the actual experience may differ significantly from the assumptions used in the calculation of the pension obligations. The significant actuarial assumptions used in measuring the pension obligations are found in Note 13.
Although estimates and assumptions reflect management’s best judgment, actual results may differ from such estimates due to the uncertainties involved in using them.
3. Current and future changes in accounting standards
(A) Current accounting standards
IAS 28: Investments in Associates and Joint Ventures
IAS 28: Investments in Associates and Joint Ventures was amended, effective for annual periods beginning on or after January 1, 2018, to add a clarification that serves to elaborate and clarify that the election to measure investees at fair value is available on an investment by investment basis and is not an election that must be applied consistently to the measurement of all associates and joint ventures. Amendments have been applied as of April 1, 2018, and there was no impact on the financial statements.
IFRS 9: Financial Instruments
In 2014, the International Accounting Standards Board (IASB) completed its project to replace IAS 39 Financial Instruments: Recognition and Measurement with IFRS 9: Financial Instruments. The Standard includes requirements for recognition, derecognition, classification and measurement of financial assets and liabilities, as well as impairment and hedge accounting. IFRS 9: Financial Instruments is effective for annual periods beginning on or after January 1, 2018, with early application permitted.
IFRS 9: Financial Instruments (2014) was early adopted for the year ended March 31, 2016. Significant accounting policies as they relate to recognition, derecognition, classification and measurement of financial assets and liabilities in connection with IFRS 9: Financial Instruments are described in Note 2(C). There is no impact from the requirements relating to impairment and hedge accounting.
(B) Future accounting standards
Management has determined that there is no material impact on the financial statements arising from new standards, amendments and interpretations that have been issued by the IASB, but that are not yet effective.
4. Public Service Pension Fund
The government has a statutory obligation to pay benefits relating to the pension plan. This pension obligation is to plan members and their beneficiaries.
In 1999, the pension legislation was amended to allow the government to invest funds in order to provide for the pension obligations. This legislation created the PSPIB to manage and invest amounts that are transferred regularly to it from the CRF related to service since April 1, 2000. The transactions are recorded in the Public Service Pension Fund. The Public Service Pension Fund is merely a flow through account. At year-end, the balance in the Public Service Pension Fund represents net contributions transferable to PSPIB. PSPIB investment assets and investment-related liabilities are reflected directly in the pension plan’s financial statements.
In order for the government to track the transactions related to contributions, benefit payments, interest and transfers, the government established the superannuation account in the accounts of Canada for service prior to April 1, 2000. The superannuation account has no capacity to pay pensions and is not considered an asset of the pension plan. All cash receipts and disbursements go to or come from the CRF. The details of the transactions of the superannuation account are provided in Note 21.
5. Financial assets and financial liabilities
(A) Classes of financial assets and financial liabilities
Financial assets and financial liabilities are aggregated in the following table, in classes that reflect their respective exposure as well as investment sectors. Their fair values were as follows as at March 31 ($ millions):
| 2019 | 2018 | |
|---|---|---|
| Investments | ||
| Public markets | ||
Canadian equity |
$2,466 | $3,093 |
Foreign equity |
23,562 | 25,148 |
| Private markets | ||
Real estate |
20,450 | 19,372 |
Private equity |
14,704 | 11,804 |
Infrastructure |
14,605 | 12,949 |
Natural resources |
5,460 | 3,875 |
| Fixed income | ||
Cash and money market securities |
8,650 | 8,256 |
Government and corporate bonds |
19,075 | 16,411 |
Inflation-linked bonds |
10,185 | 8,967 |
Private debt securities |
11,368 | 10,252 |
| Alternative investments | 7,295 | 6,349 |
| Total investments | $137,820 | $126,476 |
| Investment-related assets | ||
Amounts receivable from pending trades |
$855 | $809 |
Interest receivable |
362 | 305 |
Dividends receivable |
104 | 97 |
Securities purchased under reverse repurchase agreements |
4,338 | 1,355 |
Derivative-related assets |
1,145 | 835 |
| Total investment-related assets | $6,804 | $3,401 |
| Investments representing financial assets at FVTPL | $144,624 | $129,877 |
| Investment-related liabilities | ||
Amounts payable from pending trades |
$(695) | $(845) |
Interest payable |
(50) | (41) |
Securities sold short |
(4,577) | (4,774) |
Collateral payable |
(2,188) | (2,593) |
Securities sold under repurchase agreements |
(4,089) | (417) |
Derivative-related liabilities |
(699) | (1,258) |
| Investment-related liabilities representing financial liabilities at FVTPL | $(12,298) | $(9,928) |
| Borrowings | ||
Capital market debt financing |
$(10,260) | $(8,849) |
| Borrowings representing financial liabilities designated at FVTPL | $(10,260) | $(8,849) |
| Net investments | $122,066 | $111,100 |
(I) Public markets
Public markets consist of Canadian and foreign investments in the following securities: common shares, American depository receipts, global depository receipts, participation notes, preferred shares, income trust units, exchange-traded funds units, pooled funds units, and securities convertible into common shares of publicly listed issuers.
Valuation techniques
Direct investments in Canadian and foreign equities are measured at fair value using quoted prices in active markets and are based on the most representative price within the bid‑ask spread.
In the case of investments in pooled funds, fair value is measured using unit values obtained from each of the funds’ administrators, which are derived from the fair value of the underlying investments in each pooled fund. PSPIB reviews the fair value received, and where necessary, the impact of restrictions on the sale or redemption of such investments is taken into consideration.
(II) Private markets
Private markets consist of investments in real estate, private equity, infrastructure and natural resources.
Real estate investments are comprised of direct equity positions in various private entities, fund investments, as well as properties in the real estate sector. Real estate investments focus on partnerships, companies and properties operating mainly in the retirement and residential, office, retail and industrial sectors, as well as private funds invested in real estate assets. Real estate investments are presented net of all third-party financing.
Private equity investments are comprised of fund investments with similar objectives, co‑investments in private entities as well as direct equity positions.
Infrastructure investments are comprised of direct equity positions, fund investments and co‑investments in various private entities. Infrastructure investments focus on entities engaged in the management, ownership or operation of assets in energy, transportation and other regulated businesses. Infrastructure investments are presented net of all third‑party financing.
Natural resources investments are comprised of direct equity positions, fund investments and co‑investments in various private entities. Natural resources investments focus on entities engaged in the management, ownership or operation of assets in timberlands, agriculture and upstream oil and gas. Natural resources investments are presented net of all third‑party financing.
Valuation techniques
The process for fair value measurement of private markets investments is described in Note 5(C)(II) and the valuation techniques together with the significant inputs used are described in Note 5(C)(III).
(III) Fixed income
Fixed income consists of cash and money market securities, government and corporate bonds, inflation-linked bonds and private debt securities.
Cash and money market securities include instruments having a maximum term to maturity of 1 year, such as treasury bills, certificates of deposit and bankers’ acceptances. A portion of such instruments has maturities of 90 days or less and is held to meet short term financial commitments. Such instruments are readily convertible into known amounts of cash and have an insignificant risk of change in value.
Government and corporate bonds include Canadian and foreign, federal, provincial, territorial and municipal bonds, floating rate notes, asset-backed term notes and mortgage-backed securities. Inflation-linked bonds are fixed income securities that earn inflation‑adjusted returns.
Private debt securities are fixed income securities of private companies held directly or through private funds. Such debt securities take the form of senior debt, mezzanine and distressed debt and primary and secondary investments in leveraged loans. Private debt securities also include third‑party loans such as junior and senior debts, construction loans, bridge loans, income‑participating loans, as well as other structured finance products in the real estate sector.
Valuation techniques
Treasury bills are valued based on prices obtained from third-party pricing sources. Such prices are determined using the most representative price within a spread of dealer quotations. Certificates of deposit and bankers’ acceptances are recorded at cost plus accrued interest, which approximates their fair value given their short-term nature.
Fair values of government and most corporate bonds, inflation-linked bonds and mortgage-backed securities are based on prices obtained from third-party pricing sources. Such prices are determined using either an appropriate interest rate curve with a spread associated with the credit quality of the issuer or other generally accepted pricing methodologies.
The fair values of certain corporate bonds, private debt securities and asset-backed term notes are determined using valuation techniques. Such techniques, together with the significant inputs used, are described in Note 5(C)(III).
The fair value measurement of fund investments included as part of private debt securities is described in Note 5(C)(II).
(IV) Alternative investments
Alternative investments consist mainly of units of funds that hold a mix of equity, fixed income and derivative instruments as well as hedge funds.
Valuation techniques
The fair value of these investments is determined based on the fair values reported by the funds’ administrators or general partners and reflects the fair value of the underlying equity, fixed income or derivative instruments, as applicable. PSPIB reviews the fair value received and, where necessary, the impact of restrictions on the sale or redemption of such investments is taken into consideration.
(V) Amounts receivable and payable from pending trades
Amounts receivable from pending trades consist of proceeds on sales of investments, excluding derivative financial instruments, which have been traded but remain unsettled at the end of the reporting period.
Amounts payable from pending trades consist of the cost of purchases of investments, excluding derivative financial instruments, which have been traded but remain unsettled at the end of the reporting period.
Valuation techniques
The fair value of amounts receivable and payable from pending trades reflects the value at which their underlying original sale or purchase transactions were undertaken.
(VI) Interest and dividends receivable
Interest and dividends are recorded at the amounts expected to be received at the end of the reporting period, which due to their short-term maturity, approximates fair value.
(VII) Interest payable
With respect to the borrowings described in Note 5(A)(XI), interest is accrued at the amount expected to be paid at the end of the reporting period, which approximates fair value.
(VIII) Securities sold short
Securities sold short reflect PSPIB’s obligation to purchase securities pursuant to short selling transactions. In such transactions, PSPIB sells securities it does not own with an obligation to purchase similar securities on the market to cover its position.
Valuation techniques
Using quoted market prices that are based on the most representative price within the bid‑ask spread, the fair value of securities sold short is measured using the same method as the similar long positions presented within public markets and fixed income.
(IX) Collateral payable
As part of securities lending and certain OTC derivative transactions, cash collateral is received and reinvested by PSPIB. PSPIB recognizes cash collateral received with a corresponding payable. The payable balance reflects the obligation of the transferee to return cash collateral to the transferor at the end of the transaction in the absence of an event of default by the transferor.
(X) Securities sold under repurchase agreements and purchased under reverse repurchase agreements
As described in Note 2(G), PSPIB is party to repurchase and reverse repurchase agreements.
Valuation techniques
Obligations to repurchase or resell the securities sold or purchased under such agreements are recorded at cost plus accrued interest, which due to their short-term maturity, approximates fair value.
(XI) Borrowings under the capital market debt program
PSPIB’s capital market debt program is described in Note 10(B).
Valuation techniques
Short-term promissory notes are recorded at cost plus accrued interest, which due to their short‑term maturity, approximates fair value. The fair value of PSPIB’s medium‑term notes is based on prices that are obtained from third-party pricing sources. Such prices are determined using an interest rate curve with a spread consistent with PSPIB’s credit quality.
(B) Derivative-related assets and liabilities
Derivative financial instruments are financial contracts that are settled at a future date. The value of such instruments is derived from changes in the value of the underlying assets, interest or exchange rates. Derivative financial instruments do not, typically, require an initial net investment. In certain cases, they require an initial net investment that is less than what would be required to hold the underlying position directly. Derivative financial instruments can be listed or traded OTC. OTC instruments consist of those that are bilaterally negotiated and settled, and those that are cleared (OTC-cleared) by a central clearing party (CCP).
PSPIB uses derivative financial instruments to enhance returns or to replicate investments synthetically. Derivatives are also used to reduce the risk associated with existing investments.
PSPIB uses the following types of derivative financial instruments:
(I) Swaps
Swaps are transactions whereby two counterparties exchange cash flow streams with each other based on predetermined conditions that include a notional amount and a term. Swaps are used to increase returns or to adjust exposures of certain assets without directly purchasing or selling the underlying assets.
(II) Futures
Futures are standardized contracts to take or make delivery of an asset (buy or sell) at a predefined price and predefined future date. Futures are used to adjust exposures to specified assets without directly purchasing or selling the underlying assets.
(III) Forwards
Forwards are contracts involving the sale by one party and the purchase by another party of a predefined amount of an underlying instrument, at a predefined price and at a predefined date in the future. Forwards are used to adjust exposures to specified assets without directly purchasing or selling the underlying assets.
(IV) Options
Options are contracts where the seller gives the purchaser the right, but not the obligation, to buy or sell a given amount of an underlying security, index, commodity, currency, interest rate, credit or other financial instrument, at an agreed-upon price stipulated in advance, either at a determined date or at any time before the predefined maturity date.
(V) Warrants and rights
Warrants are options to purchase an underlying asset which is in the form of a transferable security and which can be listed on an exchange or traded OTC.
Rights are securities giving shareholders entitlement to purchase new shares issued by a corporation at a predetermined price (normally less than the current market price) in proportion to the number of shares already owned. Rights are issued only for a short period of time, after which they expire.
Valuation techniques
(i) Determination of fair value of derivative financial instruments
Listed derivative financial instruments are recorded at fair value using quoted market prices that are based on the most representative price within the bid-ask spread. OTC-cleared derivatives are recorded at fair value using prices obtained from the CCP. OTC derivatives are valued using appropriate valuation techniques such as discounted cash flows. These techniques use significant inputs that are observable in the market such as current market yields.
(ii) Notional values and fair values of derivative-related assets and liabilities
Notional values of derivative financial instruments are not recorded as assets or liabilities as they represent the face amount of the contract. Except for credit derivatives, notional values do not represent the potential gain or loss associated with the market or credit risk of such transactions disclosed below. Rather, they serve as the basis upon which the cash flows and the fair value of the contracts are determined.
The following table summarizes the derivatives portfolio as at March 31 ($ millions):
| 2019 | 2018 | |||||
|---|---|---|---|---|---|---|
| Notional value | Fair value | Notional value | Fair value | |||
| Assets | Liabilities | Assets | Liabilities | |||
| Equity and commodity derivatives | ||||||
Listed: Futures |
$2,528 | $0 | $0 | $2,754 | $0 | $0 |
Listed: Warrants and rights |
1 | 1 | 0 | 2 | 2 | 0 |
Listed: Options: Purchased |
3,724 | 124 | 0 | 7,684 | 183 | 0 |
Written |
3,350 | 0 | (57) | 5,238 | 0 | (104) |
OTC |
||||||
Swaps |
19,009 | 465 | (137) | 19,430 | 105 | (471) |
Options: Purchased |
488 | 17 | 0 | 1,106 | 32 | 0 |
Written |
393 | 0 | (23) | 619 | 0 | (23) |
| Currency derivatives | ||||||
Listed: Futures |
219 | 0 | 0 | 87 | 0 | 0 |
OTC |
||||||
Forwards |
14,441 | 85 | (38) | 20,140 | 144 | (304) |
Swaps |
4,787 | 13 | (26) | 2,180 | 1 | (41) |
Options: Purchased |
4,679 | 38 | 0 | 6,007 | 42 | 0 |
Written |
4,282 | 0 | (35) | 6,171 | 0 | (36) |
| Interest rate derivatives | ||||||
Listed: Futures |
8,102 | 0 | 0 | 10,595 | 0 | 0 |
Listed: Options: Purchased |
34,811 | 25 | 0 | 35,942 | 13 | 0 |
Written |
31,916 | 0 | (20) | 31,087 | 0 | (11) |
OTC |
||||||
Forwards |
431 | 7 | (12) | 0 | 0 | 0 |
Swaps |
18,573 | 178 | (192) | 10,594 | 127 | (105) |
Options: Purchased |
39,273 | 191 | 0 | 36,217 | 181 | 0 |
Written |
37,162 | 0 | (152) | 37,889 | 0 | (152) |
OTC‑cleared |
||||||
Swaps |
40,536 | 0 | 0 | 47,297 | 0 | 0 |
| Credit derivatives | ||||||
OTC |
||||||
Credit default swaps: Purchased |
486 | 0 | (7) | 902 | 0 | (11) |
Writtentable 30 note 1 |
66 | 1 | 0 | 171 | 2 | 0 |
Options: Purchased |
0 | 0 | 0 | 468 | 3 | 0 |
OTC-cleared |
||||||
Credit default swaps: Purchased |
596 | 0 | 0 | 900 | 0 | 0 |
Writtentable 30 note 1 |
0 | 0 | 0 | 437 | 0 | 0 |
| Total | $1,145 | $(699) | $835 | $(1,258) | ||
Table 30 Notes
|
||||||
Total derivative-related assets and liabilities as at March 31 are comprised of ($ millions):
| 2019 | 2018 | |||||
|---|---|---|---|---|---|---|
| Notional value | Fair value | Notional value | Fair value | |||
| Assets | Liabilities | Assets | Liabilities | |||
| Listed derivatives | $84,651 | $150 | $(77) | $93,389 | $198 | $(115) |
| OTC derivatives | 144,070 | 995 | (622) | 141,894 | 637 | (1,143) |
| OTC-cleared derivatives | 41,132 | 0 | 0 | 48,634 | 0 | 0 |
| Total | $1,145 | $(699) | $835 | $(1,258) | ||
The terms to maturity based on the notional value for the derivatives were as follows as at March 31 ($ millions):
| 2019 | 2018 | |
|---|---|---|
| Less than 3 months | $68,548 | $91,422 |
| 3 to 12 months | 118,146 | 87,057 |
| Over 1 year | 83,159 | 105,438 |
(C) Fair value hierarchy
(I) Classification
Financial assets and financial liabilities described under Note 5(A) are classified within the fair value hierarchy, described as follows, based on the lowest level of input that is significant to the fair value measurement as a whole.
- Level 1 inputs are quoted prices (unadjusted) in active markets for identical assets or liabilities that PSPIB can access at the end of the reporting period.
- Level 2 inputs are inputs other than quoted prices included within Level 1 that are observable for the asset or the liability, either directly or indirectly. Level 2 inputs include:
- (i) quoted prices for similar assets or liabilities in active markets.
- (ii) quoted prices for identical or similar assets or liabilities in markets that are not active.
- (iii) inputs other than quoted prices that are observable for the asset or liability.
- (iv) market-corroborated inputs.
- Level 3 inputs are unobservable inputs for the asset or liability that are used within model-based techniques. They reflect PSPIB’s assessment of the assumptions that market participants would use in pricing the assets or liabilities.
The classification within the levels of the hierarchy is established at the time of the initial determination of fair value of the asset or liability and reviewed at the end of each reporting period. PSPIB determines whether a transfer between levels has occurred and recognizes such transfer at the beginning of the reporting period.
The following table shows the fair value of financial assets and financial liabilities as at March 31, 2019, classified within the fair value hierarchy ($ millions):
| Level 1 | Level 2 | Level 3 | Total fair value | |
|---|---|---|---|---|
| Investments | ||||
| Public markets | ||||
Canadian equity |
$1,795 | $626 | $45 | $2,466 |
Foreign equity |
20,761 | 1,584 | 1,217 | 23,562 |
| Private markets | ||||
Real estate |
0 | 0 | 20,450 | 20,450 |
Private equity |
0 | 0 | 14,704 | 14,704 |
Infrastructure |
0 | 0 | 14,605 | 14,605 |
Natural resources |
0 | 0 | 5,460 | 5,460 |
| Fixed income | ||||
Cash and money market securities |
0 | 8,650 | 0 | 8,650 |
Government and corporate bonds |
0 | 19,047 | 28 | 19,075 |
Inflation-linked bonds |
0 | 10,185 | 0 | 10,185 |
Private debt securities |
0 | 0 | 11,368 | 11,368 |
| Alternative investments | 0 | 1,543 | 5,752 | 7,295 |
| Total investments | $22,556 | $41,635 | $73,629 | $137,820 |
| Investment-related assets | ||||
Amounts receivable from pending trades |
$0 | $855 | $0 | $855 |
Interest receivable |
0 | 362 | 0 | 362 |
Dividends receivable |
0 | 104 | 0 | 104 |
Securities purchased under reverse repurchase agreements |
0 | 4,338 | 0 | 4,338 |
Derivative-related assets |
94 | 1,051 | 0 | 1,145 |
| Total investment-related assets | $94 | $6,710 | $0 | $6,804 |
| Investments representing financial assets at FVTPL | $22,650 | $48,345 | $73,629 | $144,624 |
| Investment-related liabilities | ||||
Amounts payable from pending trades |
$0 | $(695) | $0 | $(695) |
Interest payable |
0 | (50) | 0 | (50) |
Securities sold short |
(2,848) | (1,729) | 0 | (4,577) |
Collateral payable |
0 | (2,188) | 0 | (2,188) |
Securities sold under repurchase agreements |
0 | (4,089) | 0 | (4,089) |
Derivative-related liabilities |
(77) | (622) | 0 | (699) |
| Investment-related liabilities representing financial liabilities at FVTPL | $(2,925) | $(9,373) | $0 | $(12,298) |
| Borrowings | ||||
Capital market debt financing |
$0 | $(10,260) | $0 | $(10,260) |
| Borrowings representing financial liabilities designated at FVTPL | $0 | $(10,260) | $0 | $(10,260) |
| Net investments | $19,725 | $28,712 | $73,629 | $122,066 |
The following table shows the fair value of financial assets and financial liabilities as at March 31, 2018, classified within the fair value hierarchy ($ millions):
| Level 1 | Level 2 | Level 3 | Total fair value | |
|---|---|---|---|---|
| Investments | ||||
| Public markets | ||||
Canadian equity |
$2,467 | $626 | $0 | $3,093 |
Foreign equity |
21,432 | 2,342 | 1,374 | 25,148 |
| Private markets | ||||
Real estate |
0 | 0 | 19,372 | 19,372 |
Private equity |
0 | 0 | 11,804 | 11,804 |
Infrastructure |
0 | 0 | 12,949 | 12,949 |
Natural resources |
0 | 0 | 3,875 | 3,875 |
| Fixed income | ||||
Cash and money market securities |
0 | 8,256 | 0 | 8,256 |
Government and corporate bonds |
0 | 16,284 | 127 | 16,411 |
Inflation-linked bonds |
0 | 8,967 | 0 | 8,967 |
Private debt securities |
0 | 0 | 10,252 | 10,252 |
| Alternative investments | 0 | 1,211 | 5,138 | 6,349 |
| Total investments | $23,899 | $37,686 | $64,891 | $126,476 |
| Investment-related assets | ||||
Amounts receivable from pending trades |
$0 | $809 | $0 | $809 |
Interest receivable |
0 | 305 | 0 | 305 |
Dividends receivable |
0 | 97 | 0 | 97 |
Securities purchased under reverse repurchase agreements |
0 | 1,355 | 0 | 1,355 |
Derivative-related assets |
145 | 690 | 0 | 835 |
| Total investment-related assets | $145 | $3,256 | $0 | $3,401 |
| Investments representing financial assets at FVTPL | $24,044 | $40,942 | $64,891 | $129,877 |
| Investment-related liabilities | ||||
Amounts payable from pending trades |
$0 | $(845) | $0 | $(845) |
Interest payable |
0 | (41) | 0 | (41) |
Securities sold short |
(3,679) | (1,095) | 0 | (4,774) |
Collateral payable |
0 | (2,593) | 0 | (2,593) |
Securities sold under repurchase agreements |
0 | (417) | 0 | (417) |
Derivative-related liabilities |
(115) | (1,143) | 0 | (1,258) |
| Investment-related liabilities representing financial liabilities at FVTPL | $(3,794) | $(6,134) | $0 | $(9,928) |
| Borrowings | ||||
Capital market debt financing |
$0 | $(8,849) | $0 | $(8,849) |
| Borrowings representing financial liabilities designated at FVTPL | $0 | $(8,849) | $0 | $(8,849) |
| Net investments | $20,250 | $25,959 | $64,891 | $111,100 |
There were no significant transfers between Level 1 and Level 2 during the year ended March 31, 2019.
During the year ended March 31, 2018, listed equity securities with a fair value of $31 million, classified as Level 2 as at March 31, 2017, were transferred to Level 1 as a result of trading restrictions having expired.
(II) Process for Level 3 fair value determination
The valuation process is monitored and governed by an internal valuation committee (VC). This committee is responsible for overseeing all aspects of fair value determination. This includes establishing valuation methodologies and procedures for each type of investment and ensuring they are complied with. Valuation methodologies established are based on widely recognized practices that are consistent with professional appraisal standards. Such standards include, among others, the International Private Equity and Venture Capital Valuation Guidelines, the Canadian Uniform Standards of Professional Appraisal Practice and the Uniform Standards of Professional Appraisal Practice in the United States of America.
The fair value of investments classified as Level 3 is determined at least annually. Quarterly, the fair value is reviewed and adjusted, as appropriate, to reflect the impact of any significant market or investment-specific events or circumstances. For each investment, the relevant valuation methodology is applied consistently over time as appropriate in the prevailing circumstances. The appropriateness of significant changes in valuation methodologies is reviewed by the VC.
In cases where the services of third-party appraisers are used, PSPIB ensures their independence and that valuation methods used are consistent with professional appraisal standards outlined above. In validating the work performed by appraisers, PSPIB ensures that the assumptions used correspond to financial information and forecasts of the underlying investment.
With respect to fund investments classified as Level 3, the annual fair value is generally determined based on audited financial statements received from the fund’s general partner. In certain cases fair value is obtained from information provided by the fund’s administrators and is reviewed by PSPIB to ensure reasonableness and adherence to acceptable industry valuation methods. Where necessary, the impact of restrictions on the sale or redemption of such investments is taken into consideration in determining fair value.
(III) Level 3 significant inputs
The following table outlines key information with respect to significant inputs related to financial assets and financial liabilities categorized within Level 3 as at March 31, 2019:
| Financial assets and financial liabilities | Type of investment | Fair value ($ millions) | Significant valuation techniques | Significant unobservable inputs | Range (weighted average) |
|---|---|---|---|---|---|
| Public markets | |||||
Canadian equity |
Direct investments | $45 | Net asset value method (NAV)table 31 note 1 | n/a | n/a |
Foreign equity |
Direct investments | $1,217 | NAVtable 31 note 1 | n/a | n/a |
| Private markets | |||||
Real estate |
Direct and co‑investments | $19,117 | Discounted cash flow (DCF) | Discount ratetable 31 note 2 table 31 note 3 | 4.10% to 20.00% (7.55%) |
| Terminal capitalization ratetable 31 note 2 table 31 note 3 | 4.25% to 10.25% (5.92%) | ||||
| Direct capitalization | Capitalization ratetable 31 note 2 table 31 note 4 | 2.50% to 8.98% (5.57%) | |||
| Stabilized occupancy ratetable 31 note 4 table 31 note 5 | 93.00% to 100.00% (98.22%) | ||||
| Sales comparison approach | Price per square foottable 31 note 4 table 31 note 5 | $0.95 to $2,057.93 ($281.99) | |||
| NAVtable 31 note 1 | n/a | n/a | |||
| Transaction price | n/a | n/a | |||
| Fund investments | $1,333 | NAVtable 31 note 1 | n/a | n/a | |
Other private markets |
Direct and co‑investments | $24,556 | DCF | Discount ratetable 31 note 2 | 6.00% to 12.50% (8.79%) |
| Market comparables | n/a | n/a | |||
| NAVtable 31 note 1 | n/a | n/a | |||
| Transaction price | n/a | n/a | |||
| Fund investments | $10,213 | NAVtable 31 note 1 | n/a | n/a | |
| Fixed income | |||||
Corporate bonds |
Convertible bonds | $21 | DCF | Discount ratetable 31 note 2 | 52.50% |
| Asset-backed term notes | $7 | Third-party pricingtable 31 note 1 | n/a | n/a | |
Private debt securities |
Direct and co‑investments | $7,846 | DCF | Discount ratetable 31 note 2 | 5.54% to 18.76% (9.77%) |
| NAVtable 31 note 1 | n/a | n/a | |||
| Transaction price | n/a | n/a | |||
| Fund investments | $3,522 | NAVtable 31 note 1 | n/a | n/a | |
| Alternative investments | Fund investments | $5,752 | NAVtable 31 note 1 | n/a | n/a |
| Total | $73,629 | ||||
Table 31 Notes
|
|||||
The following table outlines key information with respect to significant inputs related to financial assets and financial liabilities categorized within Level 3 as at March 31, 2018:
| Financial assets and financial liabilities | Type of investment | Fair value ($ millions) | Significant valuation techniques | Significant unobservable inputs | Range (weighted average) |
|---|---|---|---|---|---|
| Public markets | |||||
Foreign equity |
Direct investments | $1,374 | Net asset value method (NAV)table 32 note 1 | n/a | n/a |
| Private markets | |||||
Real estate |
Direct and co‑investments | $18,178 | Discounted cash flow (DCF) | Discount ratetable 32 note 2 table 32 note 3 | 5.00% to 22.10% (7.94%) |
| Terminal capitalization ratetable 32 note 2 table 32 note 3 | 4.25% to 9.75% (5.92%) | ||||
| Direct capitalization | Capitalization ratetable 32 note 2 table 32 note 3 | 2.75% to 9.09% (5.30%) | |||
| Stabilized occupancy rate table 32 note 4 table 32 note 5 | 94.00% to 100.00% (98.29%) | ||||
| Sales comparison approach | Price per square foottable 32 note 4 table 32 note 5 | $27.50 to $1,107.92 ($90.83) | |||
| NAVtable 32 note 1 | n/a | n/a | |||
| Transaction price | n/a | n/a | |||
| Fund investments | $1,194 | NAVtable 32 note 1 | n/a | n/a | |
Other private markets |
Direct and co‑investments | $19,756 | DCF | Discount ratetable 32 note 2 | 6.00% to 12.70% (8.94%) |
| Market comparables | n/a | n/a | |||
| NAVtable 32 note 1 | n/a | n/a | |||
| Transaction price | n/a | n/a | |||
| Fund investments | $8,872 | NAVtable 32 note 1 | n/a | n/a | |
| Fixed income | |||||
Corporate bonds |
Convertible bonds | $119 | DCF | Discount ratetable 32 note 2 | 4.70% to 10.00% (7.40%) |
| Asset-backed term notes | $8 | Third-party pricingtable 32 note 1 | n/a | n/a | |
Private debt securities |
Direct and co‑investments | $7,374 | DCF | Discount ratetable 32 note 2 | 5.90% to 17.25% (9.79%) |
| NAVtable 32 note 1 | n/a | n/a | |||
| Transaction price | n/a | n/a | |||
| Fund investments | $2,878 | NAVtable 32 note 1 | n/a | n/a | |
| Alternative investments | Fund investments | $5,138 | NAVtable 32 note 1 | n/a | n/a |
| Total | $64,891 | ||||
Table 32 Notes
|
|||||
(IV) Level 3 reconciliation
The following table shows a reconciliation of all movements related to financial assets and financial liabilities categorized within Level 3 for the year ended March 31, 2019 ($ millions):
| Opening balance | Purchases | Sales | Settlements | Realized gains | Unrealized gains (losses)table 33 note 1 | Transfer out of Level 3 | Closing balance | |
|---|---|---|---|---|---|---|---|---|
| Public markets | $1,374 | $403 | $(490) | $0 | $312 | $(337) | $0 | $1,262 |
| Private markets | 48,000 | 10,804 | (6,882) | 0 | 1,379 | 1,982 | (64) | 55,219 |
| Fixed income | 10,379 | 4,205 | (3,272) | (43) | 110 | 17 | 0 | 11,396 |
| Alternative investments | 5,138 | 639 | (401) | 0 | 32 | 344 | 0 | 5,752 |
| Derivative-related receivables/ payables (net) | 0 | 0 | 0 | 0 | 0 | 0 | 0 | 0 |
| Total | $64,891 | $16,051 | $(11,045) | $(43) | $1,833 | $2,006 | $(64) | $73,629 |
Table 33 Notes
|
||||||||
As at March 31, 2018, a private market investment was classified under Level 3 as its fair value was determined based on significant unobservable inputs. During the year ended March 31, 2019, the investment was transferred to Level 1 as the related securities became publicly traded.
The following table shows a reconciliation of all movements related to financial assets and financial liabilities categorized within Level 3 for the year ended March 31, 2018 ($ millions):
| Opening balance | Purchases | Sales | Settlements | Realized gains | Unrealized gainstable 34 note 1 | Transfer out of Level 3 | Closing balance | |
|---|---|---|---|---|---|---|---|---|
| Public markets | $215 | $477 | $(42) | $0 | $5 | $719 | $0 | $1,374 |
| Private markets | 40,242 | 7,138 | (3,256) | 0 | 808 | 3,077 | (9) | 48,000 |
| Fixed income | 6,844 | 5,675 | (2,325) | (19) | 158 | 46 | 0 | 10,379 |
| Alternative investments | 4,712 | 970 | (679) | 0 | 58 | 77 | 0 | 5,138 |
| Derivative-related receivables/ payables (net) | 0 | 13 | 0 | (13) | 0 | 0 | 0 | 0 |
| Total | $52,013 | $14,273 | $(6,302) | $(32) | $1,029 | $3,919 | $(9) | $64,891 |
Table 34 Notes
|
||||||||
As at March 31, 2017, a private market investment was classified under Level 3 as its fair value was determined based on significant unobservable inputs. During the year ended March 31, 2018, the investment was transferred to Level 2 as the related securities became publicly traded. The securities held by PSPIB are unregistered and can only be sold upon their registration.
(V) Level 3 sensitivity analysis
In the course of measuring fair value of financial instruments classified as Level 3, valuation techniques used incorporate assumptions that are based on non-observable data. Significant assumptions used for each asset class are described in Note 5(C)(III). Although such assumptions reflect PSPIB’s best judgment, the use of reasonably possible alternative assumptions could yield different fair value measures representing, at a minimum, a 3% increase and 3% decrease as at March 31, 2019 (3% increase and 3% decrease as at March 31, 2018) in the fair value of financial instruments categorized as Level 3. This excludes fund investments where a sensitivity analysis is not possible given the underlying assumptions used are not available to PSPIB. In the case of fund investments, the fair value is determined as indicated in Note 5(C)(II).
(D) Collateral pledged and received
PSPIB is party to agreements that involve pledging and holding collateral, as outlined in Notes 2(F), 2(G) and 7(B)(I). The following table illustrates the fair values of the pension plan’s allocated collateral, as well as the securities under the lending and borrowing programs and the securities under the repurchase and reverse repurchase agreements as at March 31 ($ millions):
| 2019 | 2018 | |
|---|---|---|
| Securities lending and borrowing | ||
Securities lent |
$5,805 | $8,385 |
Collateral heldtable 35 note 1 |
6,118 | 8,923 |
Securities borrowed |
2,849 | 3,705 |
Collateral pledgedtable 35 note 2 |
2,936 | 3,835 |
| Securities repurchase and reverse repurchase agreements | ||
Securities sold under repurchase agreements |
4,116 | 424 |
Collateral pledged |
4,106 | 424 |
Securities purchased under reverse repurchase agreements |
4,361 | 1,367 |
Collateral heldtable 35 note 3 |
4,354 | 1,362 |
| Derivatives contracts | ||
Collateral pledged |
665 | 1,291 |
Collateral heldtable 35 note 4 |
404 | 2 |
Table 35 Notes
|
||
6. Interest in other entities
(A) Subsidiaries, joint ventures and associates
In the normal course of business, investments in private markets are commonly held through investment entity subsidiaries formed by PSPIB. As at March 31, 2019, 108 investment entity subsidiaries were incorporated in North America, 17 in Europe, 11 in Oceania, 4 in Central and South America, 1 in Africa and 1 in Asia (103 in North America, 23 in Europe, 11 in Oceania, 4 in Central and South America, 1 in Africa and 1 in Asia as at March 31, 2018).
In addition, PSPIB controlled 81 investees directly or through its investment entity subsidiaries as at March 31, 2019 (80 investees as at March 31, 2018).
The following tables present, in descending order, the most significant investees held directly or indirectly by PSPIB where it has control, joint control or significant influence.
As at March 31, 2019:
| Entity’s name | Principal place of business | Ownership interest held by PSPIB (%) | Relationship to PSPIB |
|---|---|---|---|
| AviAlliance GmbH | Europe | 100 | Controlled investee |
| Revera Inc. | North America | 100 | Controlled investee |
| Kaingaroa Timberlands Ltd. | Oceania | 56 | Jointly controlled investee |
| Roadis Transportation B.V. | Global | 100 | Controlled investee |
| FirstLight Power Resources Holding Inc. | North America | 100 | Controlled investee |
| SEGRO European Logistics Partnership S.a.r.l. | Europe | 50 | Jointly controlled investee |
| Forth Ports Limited. | Europe | 51 | Jointly controlled investee |
| TDF S.A.S. | Europe | 22 | Associate |
| Roccapina Fund, L.P. | North America | 100 | Controlled investee |
| Big Box Properties | North America | 49 | Jointly controlled investee |
As at March 31, 2018:
| Entity’s name | Principal place of business | Ownership interest held by PSPIB (%) | Relationship to PSPIB |
|---|---|---|---|
| Revera Inc. | North America | 100 | Controlled investee |
| AviAlliance GmbH | Europe | 100 | Controlled investee |
| Kaingaroa Timberlands Ltd. | Oceania | 56 | Jointly controlled investee |
| Roadis Transportation B.V. | Global | 100 | Controlled investee |
| SEGRO European Logistics Partnership S.a.r.l. | Europe | 50 | Jointly controlled investee |
| FirstLight Power Resources Holding Inc. | North America | 100 | Controlled investee |
| Roccapina Fund, L.P. | North America | 100 | Controlled investee |
| TDF S.A.S. | Europe | 22 | Associate |
| Cubico Sustainable Investments Limited | Global | 50 | Jointly controlled investee |
| Big Box Properties | North America | 49 | Jointly controlled investee |
In addition to the above, PSPIB holds wholly owned subsidiaries that solely provide it with services that relate to its investment activities. Such services consist of investment management and financing of private market investments within the context of PSPIB’s capital market debt program described in Note 10(B).
(B) Structured entities
PSPIB holds interests in partnerships and funds mainly in the context of its investments in private markets. Given their nature, such entities commonly have the characteristics of a structured entity as defined by IFRS. These entities are held as investments and do not expose PSPIB to additional risks or returns compared to interests held in non-structured entities.
Information regarding structured entities is included, as applicable, within disclosures of investment risk management under Note 7, guarantees and indemnities under Note 23 and commitments under Note 24.
7. Investment risk management
PSPIB is required to act in the best interests of the contributors and beneficiaries under the pension plan and for maximizing returns without undue risk of loss. In pursuit of this objective, PSPIB established an Enterprise Risk Management Policy (ERM Policy). The ERM Policy provides a framework for identifying, evaluating, managing, mitigating, monitoring and reporting the investment and non-investment risks to which PSPIB is exposed.
As part of the overall ERM policy, the objective of the Investment Risk Management Policy (IRM Policy) is to support the management of risk inherent to the investment decision making process. The IRM Policy outlines a framework detailing how investment activities should comply with PSPIB’s risk philosophy and align with the tolerance and limits of its risk appetite. The IRM Policy also supplements the Statement of Investment Policies, Standards and Procedures (SIP&P), whose objective is to effectively manage investment risks related to the implementation of PSPIB’s various investment strategies. Investment risks include market, credit and liquidity risks.
(A) Market risk
Market risk is the risk that the value of an investment will fluctuate as a result of an adverse financial outcome due to changes in the factors that drive the value, such as changes in market prices, changes caused by factors specific to the individual investment, volatility in share and commodity prices, interest rate, foreign exchange or other factors affecting similar securities traded in the market.
(I) Measurement of market risk
The absolute annualized volatility of the total portfolio is used as the primary measure of market risk. The absolute volatility is a statistical measure of the size of changes in investment returns of a given investment or portfolio of investments. It is used to illustrate the potential loss of value in an investment or portfolio of investments as a result of fluctuations in market prices.
PSPIB uses 7 years’ worth of market returns scaled to a 12-month holding period to calculate the absolute volatility. For investments that are not actively traded, the calculation of the absolute volatility uses securities with similar risk attributes as a proxy.
The absolute volatility is statistically valid under normal market conditions and does not specifically consider losses from severe market events. It also assumes that the future will behave in a pattern similar to the past. Consequently, if future market conditions differ significantly from those of the past, potential losses may differ from those originally estimated.
The following table shows the absolute volatility of the total portfolio expressed as a percentage of net investments as at March 31:
| 2019 (%) |
2018 (%) |
|
|---|---|---|
| Absolute volatility | 7.3 | 7.2 |
Stress testing
Although the absolute volatility is a widely accepted risk measure, it is complemented by other risk measurement methodologies that provide greater insight on market risk. PSPIB uses stress testing and scenario analysis to examine the impact on financial results of abnormally large movements in risk factors. Such techniques are used to test a portfolio’s sensitivity to various risk factors and key model assumptions. These methods also use historically stressed periods to evaluate how a current portfolio reacts under such circumstances. Stress testing and scenario analysis are also deployed to assess new product performance.
(II) Interest rate risk
Interest rate risk refers to the risk that fluctuations in interest rates will directly affect the fair value of the pension plan’s net asset values.
The terms to maturity of the classes of financial instruments, outlined in Note 5(A), with the most significant exposure to interest rate risk were as follows as at March 31, 2019 ($ millions):
| Less than 1 year | 1 to 5 years | 5 to 10 years | Over 10 years | Other | Total | |
|---|---|---|---|---|---|---|
| Cash and money market securities | $0 | $0 | $0 | $0 | $8,650table 36 note 1 | $8,650 |
| Government and corporate bonds | 866 | 8,804 | 4,373 | 3,555 | 1,477table 36 note 2 | 19,075 |
| Inflation-linked bonds | 0 | 1,663 | 5,689 | 2,833 | 0 | 10,185 |
| Private debt securities | 61 | 1,853 | 4,366 | 1,514 | 3,574table 36 note 3 | 11,368 |
| Total fixed income | $927 | $12,320 | $14,428 | $7,902 | $13,701 | $49,278 |
Table 36 Notes
|
||||||
The terms to maturity of the classes of financial instruments, outlined in Note 5(A), with the most significant exposure to interest rate risk were as follows as at March 31, 2018 ($ millions):
| Less than 1 year | 1 to 5 years | 5 to 10 years | Over 10 years | Other | Total | |
|---|---|---|---|---|---|---|
| Cash and money market securities | $0 | $0 | $0 | $0 | $8,256table 37 note 1 | $8,256 |
| Government and corporate bonds | 2,537 | 6,007 | 3,787 | 2,487 | 1,593table 37 note 2 | 16,411 |
| Inflation-linked bonds | 0 | 2,977 | 3,201 | 2,789 | 0 | 8,967 |
| Private debt securities | 2 | 1,034 | 5,079 | 1,119 | 3,018table 37 note 3 | 10,252 |
| Total fixed income | $2,539 | $10,018 | $12,067 | $6,395 | $12,867 | $43,886 |
Table 37 Notes
|
||||||
All equity investments within Canadian equity, foreign equity, real estate, private equity, infrastructure and natural resources amounted to $81,247 million as at March 31, 2019 ($76,241 million as at March 31, 2018) do not have specified terms to maturity nor are they significantly exposed to interest rate risk.
Alternative investments described in Note 5(A)(IV), which amounted to $7,295 million as at March 31, 2019 ($6,349 million as at March 31, 2018), also have no specified terms to maturity. Certain of these investments, as well as reverse repurchase agreements and derivative contracts described in Notes 5(A)(X) and 5(B), respectively, are subject to interest rate risk exposures. These exposures are reflected in the absolute volatility calculation described in Note 7(A)(I).
The terms to maturity of PSPIB’s capital market debt financing are disclosed in Note 10(B).
(III) Foreign currency risk
PSPIB is exposed to currency risk through holding of investments that is, direct and indirect holdings of securities, units in pooled funds and units in limited partnerships or, investment-related liabilities in various currencies. Fluctuations in the relative value of the Canadian dollar against these foreign currencies can result in a positive or a negative effect on the fair value of the investments. To mitigate this risk, PSPIB may take, through foreign forward contracts or cross currency swaps, positions in foreign currencies.
The underlying foreign currency exposures of net investments for the pension plan were as follows as at March 31 ($ millions):
| 2019 | 2018 | |||
|---|---|---|---|---|
| Currency | Fair value | % of total | Fair value | % of total |
| US dollar | $63,350 | 63.6 | $59,778 | 68.4 |
| Euro | 14,841 | 14.9 | 8,856 | 10.1 |
| British pound | 5,754 | 5.8 | 2,143 | 2.5 |
| Australian dollar | 2,191 | 2.2 | 1,914 | 2.2 |
| Japanese yen | 2,020 | 2.0 | 2,579 | 3.0 |
| Hong Kong dollar | 1,873 | 1.9 | 1,739 | 2.0 |
| Mexican peso | 1,751 | 1.8 | 1,420 | 1.6 |
| Brazilian real | 1,164 | 1.2 | 1,565 | 1.8 |
| Indian rupee | 1,159 | 1.2 | 999 | 1.1 |
| South Korean won | 960 | 1.0 | 1,895 | 2.2 |
| Swiss franc | 668 | 0.7 | 579 | 0.7 |
| New Taiwan dollar | 667 | 0.7 | 747 | 0.9 |
| Others | 3,122 | 3.0 | 3,151 | 3.5 |
| Total | $99,520 | 100.0 | $87,365 | 100.0 |
As at March 31, 2019, PSPIB and its investment entity subsidiaries also had commitments, denominated in foreign currencies of $15,699 million for the pension plan (US$9,923 million, €1,442 million, £75 million, 16 million South African rands, 2 million Brazilian reals, 9,849 million Colombian pesos, 1,927 million Mexican pesos and 12 million Australian dollars) which were not included in the foreign currency exposure table above.
As at March 31, 2018, PSPIB and its investment entity subsidiaries also had commitments, denominated in foreign currencies of $16,964 million for the pension plan (US$10,645 million, €1,844 million, £130 million, 16 million South African rands, 9,836 million Colombian pesos and 1,045 million Mexican pesos) which were not included in the foreign currency exposure table above.
(B) Credit risk
PSPIB is exposed to credit risk, which is the risk of non-performance of a debtor on whom PSPIB relies to fulfill contractual or financial obligations. That is, the risk that the issuer of a debt security or that the counterparty to a derivative contract, to a securities lending and borrowing transaction or to securities purchased under reverse repurchase agreements, is unable to meet its financial obligations.
Credit risk encompasses the risk of a deterioration of creditworthiness and the relevant concentration risk. Credit risk monitoring entails an evaluation of the credit quality of each issuer and counterparty that transacts with PSPIB. To perform this evaluation for public issuers and counterparties, PSPIB relies on four recognized credit rating agencies. A minimum of two credit ratings are used to classify each security. If the agencies disagree as to a security’s credit quality, PSPIB uses the lowest of the available ratings. For private issuers, PSPIB assigns internal credit ratings to issuers and measures the combined risk profile against set targets. To assign risk ratings to issuers, PSPIB uses methodologies comparable to those used by recognized rating agencies.
As at March 31, 2019, the pension plan’s maximum exposure to credit risk amounted to $54 billion ($46 billion as at March 31, 2018). This amount is presented before collateral held and netting arrangements that do not qualify for offsetting under IFRS. The maximum credit exposure excludes guarantees disclosed in Note 23 as well as investments in funds classified as alternative investments in a Note 5(A). Such funds hold fixed income securities among other types of instruments.
To monitor the evolution of credit risk, PSPIB periodically produces a concentration report by credit rating of credit-sensitive securities. The concentration of credit risk by credit rating was as follows as at March 31:
| Credit rating | 2019 (%) |
2018 (%) |
|---|---|---|
| AAA to AA | 48.4 | 51.2 |
| A | 23.6 | 20.9 |
| BBB | 2.3 | 2.5 |
| BB or below | 25.1 | 24.4 |
| No ratingtable 38 note 1 | 0.6 | 1.0 |
| Total | 100.0 | 100.0 |
Table 38 Notes
|
||
(I) Counterparty risk
Counterparty risk represents the credit risk from current and potential exposure related to transactions involving derivative contracts, securities lending and borrowing as well as securities repurchase and reverse repurchase agreements. In order to minimize counterparty risk, PSPIB requires that counterparties provide adequate collateral and meet its credit rating requirements. PSPIB frequently monitors the credit rating of its counterparties as determined by recognized credit rating agencies. With respect to derivative contracts, PSPIB has the ability to terminate all trades with most counterparties whose credit rating is downgraded below its requirements.
For OTC derivatives, PSPIB’s policy also requires the use of the International Swaps and Derivatives Association (ISDA) Master Agreement with all counterparties to derivative contracts. The ISDA Master Agreement provides the contractual framework within which dealing activities across a full range of OTC products are conducted. In the case of OTC-cleared derivatives, trading activities are regulated between parties under terms that are customary to such transactions.
As a credit mitigation technique, the ISDA Master Agreement contractually binds counterparties to close-out netting provisions in the case of default by one of the counterparties. Additionally, the Credit Support Annex (CSA) to the ISDA Master Agreement enables PSPIB to realize any collateral placed with it in the case of default of the counterparty. The CSA also requires PSPIB to contribute further collateral when requested. All collateral transactions under the CSA are in cash, high-quality debt instruments or securities. The CSA also regulates the exchange of collateral when the credit exposure to a counterparty exceeds a predetermined threshold. Counterparties are generally authorized to sell, repledge or otherwise use collateral held. Similarly, in the case of OTC-cleared derivatives, collateral is required in cash, high quality debt instruments or securities and can be sold, repledged or otherwise used. PSPIB does not sell, repledge or otherwise use any collateral held in the form of securities but does reinvest all cash collateral, with respect to derivative contracts.
With respect to transactions involving securities lending and borrowing agreements as well as securities repurchase and reverse repurchase agreements, collateral requirements are in place to mitigate counterparty risk. Notes 2(F) and 2(G) describe collateral requirements in securities lending and borrowing programs as well as securities repurchase and reverse repurchase agreements.
Information in connection with collateral pledged by PSPIB and its counterparties is disclosed in Note 5(D).
In the case of the securities lending program, PSPIB’s exposure to counterparty risk is further mitigated as the custodian of the securities lent assumes the risk that a counterparty will be unable to meet its obligations associated with the collateral requirements.
PSPIB is responsible for counterparty risk monitoring and mitigation as well as maintaining a comprehensive, disciplined, and enterprise-wide process for tracking and managing counterparty risk. As such, PSPIB measures counterparty risk on an ongoing basis, evaluates and tracks the creditworthiness of current counterparties and mitigates counterparty risk through collateral management.
(II) Offsetting
PSPIB is subject to ISDA Master Agreements in relation to its OTC derivative financial instruments as described. Such agreements contain close-out netting provisions applicable only in the case of default. In certain cases, such agreements also allow for offsetting. In cases where the conditions for offsetting were met, financial instruments have been presented net in the statement of financial position. Securities repurchase and reverse repurchase agreements, described in Notes 2(G) and 5(D) are subject to similar arrangements however they are not offset as the conditions for offsetting are not met.
The following tables present the financial assets and liabilities described above ($ millions):
Financial assets
| Gross amount of recognized financial assets | Less: gross amount of recognized financial liabilities set off | Net amount of financial assets presented in the statement of financial position | Less: related amounts not set off in the statement of financial position | Net | ||
|---|---|---|---|---|---|---|
| Recognized financial liabilities | Collateral held and not recognized | |||||
| As at March 31, 2019 | ||||||
| Reverse repurchase agreements | $4,338 | $0 | $4,338table 39 note 1 | $2,823 | $1,514 | $1 |
| OTC-derivatives | 999 | 4 | 995table 39 note 2 | 553 | 388 | 54 |
| Total | $5,337 | $4 | $5,333 | $3,376 | $1,902 | $55 |
| As at March 31, 2018 | ||||||
| Reverse repurchase agreements | $1,355 | $0 | $1,355table 39 note 1 | $360 | $995 | $0 |
| OTC-derivatives | 666 | 29 | 637table 39 note 2 | 632 | 1 | 4 |
| Total | $2,021 | $29 | $1,992 | $992 | $996 | $4 |
Table 39 Notes
|
||||||
Financial liabilities
| Gross amount of recognized financial liabilities | Less: gross amount of recognized financial assets set off | Net amount of financial liabilities presented in the statement of financial position | Less: related amounts not set off in the statement of financial position | Net | ||
|---|---|---|---|---|---|---|
| Recognized financial assets | Collateral pledged and not derecognized | |||||
| As at March 31, 2019 | ||||||
| Repurchase agreements | $4,089 | $0 | $4,089table 40 note 1 | $2,823 | $1,265 | $1 |
| OTC-derivatives | 626 | 4 | 622table 40 note 2 | 549 | 68 | 5 |
| Collateral payable | 5 | 0 | 5 | 4 | 0 | 1 |
| Total | $4,720 | $4 | $4,716 | $3,376 | $1,333 | $7 |
| As at March 31, 2018 | ||||||
| Repurchase agreements | $417 | $0 | $417table 40 note 1 | $360 | $57 | $0 |
| OTC-derivatives | 1,172 | 29 | 1,143table 40 note 2 | 631 | 511 | 1 |
| Collateral payable | 2 | 0 | 2table 40 note 3 | 1 | 0 | 1 |
| Total | $1,591 | $29 | $1,562 | $992 | $568 | $2 |
Table 40 Notes
|
||||||
(C) Liquidity risk
Liquidity risk corresponds to the risk that PSPIB will not be able to meet its financial obligations on a timely basis, with sufficient and readily available cash resources. PSPIB’s cash position is monitored on a daily basis. In general, investments in cash, money market securities, floating rate notes, bonds and public equities are expected to be highly liquid as they will be invested in securities that are actively traded. PSPIB utilizes appropriate measures and controls to monitor liquidity risk in order to ensure that there is sufficient liquidity to meet financial obligations as they come due. A liquidity report taking into consideration future forecasted cash flows is prepared and presented to PSPIB’s senior management on a weekly basis. This ensures that sufficient cash reserves are available to meet forecasted cash outflows. Additionally, sufficient sources of liquidity are maintained for deployment in case of market disruption.
PSPIB has the ability to raise additional capital through the use of its capital market debt program. This program allows PSPIB to issue short-term promissory notes and medium-term notes. Note 10(B) provides additional information on the usage of the capital market debt program. Furthermore, PSPIB maintains credit facilities for general corporate purposes. Note 10(A) provides additional information with respect to such credit facilities.
The terms to maturity of the notional amount of derivatives are disclosed in Note 5(B).
Financial liabilities
The following tables present the fair value of non-derivative-related financial liabilities as well as derivative-related financial instruments, aggregated according to their maturities as at March 31, 2019 ($ millions) and excluding the impact of guarantees and indemnities disclosed in Note 23:
| Less than 3 months | 3 to 12 months | Over 1 year | Total | |
|---|---|---|---|---|
| Non-derivative-related financial liabilitiestable 41 note 1 | ||||
| Amounts payable from pending trades | $(695) | $0 | $0 | $(695) |
| Interest payable | (48) | (2) | 0 | (50) |
| Securities sold short | (4,577) | 0 | 0 | (4,577) |
| Collateral payable | (2,188) | 0 | 0 | (2,188) |
| Securities sold under repurchase agreements | (4,089) | 0 | 0 | (4,089) |
| Capital market debt financing | (3,441) | (1,545) | (5,274) | (10,260) |
| Trade payable and other liabilities | (52) | (89) | (91) | (232) |
| Total | $(15,090) | $(1,636) | $(5,365) | $(22,091) |
Table 41 Notes
|
||||
| Less than 3 months | 3 to 12 months | Over 1 year | Total | |
|---|---|---|---|---|
| Derivative-related financial instruments | ||||
| Derivative-related assets | 479 | 403 | 263 | 1,145 |
| Derivative-related liabilitiestable 42 note 1 | (171) | (254) | (274) | (699) |
| Total | $308 | $149 | $(11) | $446 |
Table 42 Notes
|
||||
The following tables present the fair value of non-derivative-related financial liabilities as well as derivative-related financial instruments, aggregated according to their maturities as at March 31, 2018 ($ millions) and excluding the impact of guarantees and indemnities disclosed in Note 23:
| Less than 3 months | 3 to 12 months | Over 1 year | Total | |
|---|---|---|---|---|
| Non-derivative-related financial liabilitiestable 43 note 1 | ||||
| Amounts payable from pending trades | $(845) | $0 | $0 | $(845) |
| Interest payable | (39) | (2) | 0 | (41) |
| Securities sold short | (4,774) | 0 | 0 | (4,774) |
| Collateral payable | (2,593) | 0 | 0 | (2,593) |
| Securities sold under repurchase agreements | (417) | 0 | 0 | (417) |
| Capital market debt financing | (3,434) | (1,153) | (4,262) | (8,849) |
| Trade payable and other liabilities | (126) | 0 | (73) | (199) |
| Total | $(12,228) | $(1,155) | $(4,335) | $(17,718) |
Table 43 Notes
|
||||
| Less than 3 months | 3 to 12 months | Over 1 year | Total | |
|---|---|---|---|---|
| Derivative-related financial instruments | ||||
| Derivative-related assets | 363 | 175 | 297 | 835 |
| Derivative-related liabilitiestable 43a note 1 | (601) | (346) | (311) | (1,258) |
| Total | $(238) | $(171) | $(14) | $(423) |
Table 43a Notes
|
||||
8. Contributions receivable
The contributions receivable as at March 31 are as follows ($ millions):
| 2019 | 2018 | |
|---|---|---|
| Contributions receivable from plan members for past service | $476 | $364 |
| Other contributions receivable from plan members | 109 | 119 |
| Total contributions receivable from plan members | $585 | $483 |
| Contributions receivable from employers for past service | $400 | $291 |
| Other contributions receivable from employers | 109 | 121 |
| Total contributions receivable from employers | $509 | $412 |
| Total contributions receivable | $1,094 | $895 |
9. Other assets
The costs of operation of PSPIB are charged to the four plans for which PSPIB provides investment services, namely, the public service pension plan, the Canadian Forces pension plan, the Reserve Force pension plan and the Royal Canadian Mounted Police pension plan. PSPIB allocates the direct costs of investment activities, such as external investment management fees and custodial fees that are included in each pension plan’s administrative expenses, based upon the net investments of each pension plan at the time the expense was incurred.
In 2019, 72.6% of PSPIB’s costs of operation were allocated to the public service pension plan (72.6% in 2018). These costs are included as administrative expenses and are disclosed in Note 20. Expenses are paid by PSPIB by way of advances from the public service pension plan, which are reimbursed by the three other pension plans on a quarterly basis.
The other assets as at March 31 are as follows ($ millions):
| 2019 | 2018 | |
|---|---|---|
| Share of expenses receivable from: | ||
Canadian Forces Pension Plan |
$0 | $24 |
Royal Canadian Mounted Police Pension Plan |
0 | 9 |
Reserve Force Pension Plan |
0 | 1 |
| Subtotal | $0 | $34 |
| Other | 140 | 131 |
| Total other assets | $140 | $165 |
10. Borrowings
(A) Credit facilities
PSPIB maintains a revolving credit facility in the amount of $2 billion and a demand line of credit in the amount of $1 billion (together “the credit facilities”).
The credit facilities are for general corporate purposes and are available in either Canadian or US currencies. Subject to customary terms and conditions, these credit facilities are available at variable interest rates such as the prime rate and the US base rate.
These credit facilities were not drawn upon as at March 31, 2019, and March 31, 2018.
(B) Capital market debt financing
PSPIB’s capital market debt program consists of the private placement of short-term promissory notes as well as medium-term notes issued by PSP Capital Inc., a wholly owned subsidiary of PSPIB. The capital raised is primarily used to finance private market investments. It is unconditionally and irrevocably guaranteed by PSPIB in accordance with its corporate leverage policy.
The maximum amount authorized by PSPIB’s Board of Directors for the capital market debt program is 10% of the net investments plus all recourse debt outstanding of PSPIB at the time of commitment to issuance. Under this limit, the short-term promissory note component cannot exceed $12 billion for issuances in Canada and the United States combined.
PSPIB’s capital market debt financing was in compliance with the limits authorized by PSPIB’s Board of Directors during the years ended March 31, 2019, and March 31, 2018.
The following outlines the terms as well as the fair value of the notes issued under the capital market debt program allocated to the pension plan as at March 31 ($ millions):
| 2019 | 2018 | |||
|---|---|---|---|---|
| Capital amounts payable at maturity | Fair value | Capital amounts payable at maturity | Fair value | |
| Short-term Canadian dollar promissory notes, bearing interest between 1.79% and 2.20% and maturing within 56 and 365 days of issuance (between 1.16% and 1.85%, maturing within 26 and 364 days as at March 31, 2018) | $474 | $471 | $688 | $685 |
| Short-term US dollar promissory notes, bearing interest between 2.45% and 2.84% and maturing within 21 and 365 days of issuance (between 1.39% and 2.17%, maturing within 28 and 365 days as at March 31, 2018) | 4,540 | 4,515 | 3,911 | 3,902 |
| Medium-term notes Series 5, bearing interest of 3.03% per annum and maturing on October 22, 2020 | 688 | 702 | 726 | 742 |
| Medium-term notes Series 7, bearing interest of 3.29% per annum and maturing on April 4, 2024 | 685 | 724 | 715 | 744 |
| Medium-term notes Series 8, bearing interest of 1.34% per annum and maturing on August 18, 2021 | 908 | 900 | 907 | 881 |
| Medium-term notes Series 9, bearing interest of 2.09% per annum and maturing on November 22, 2023 | 727 | 729 | 700 | 686 |
| Medium-term notes Series 10, bearing interest of 1.73% per annum and maturing on June 21, 2022 | 1,272 | 1,265 | 1,241 | 1,209 |
| Medium-term notes Series 11, bearing interest of 3.00% per annum and maturing on November 5, 2025 | 908 | 954 | 0 | 0 |
| Total | $10,202 | $10,260 | $8,888 | $8,849 |
Unrealized losses in connection with borrowings amounted to $137 million for the year ended March 31, 2019 (unrealized gains of $137 million for the year ended March 31, 2018).
Interest expense, for the years ended March 31, was as follows ($ millions):
| 2019 | 2018 | |
|---|---|---|
| Short-term promissory notes | $109 | $56 |
| Medium-term notes | 104 | 84 |
| Total | $213 | $140 |
(C) Reconciliation of liabilities arising from financing activities
The following provides a reconciliation of liabilities arising from financing activities, including both changes arising from cash and non-cash changes for the year ended March 31, 2019 ($ millions):
| Non-cash changes | Closing balance | |||||
|---|---|---|---|---|---|---|
| Opening balance | Proceeds from borrowings | Repayment of borrowings | Foreign exchange losses | Fair valuetable 44 note 1 losses | ||
| Capital market debt financing | $8,849 | $24,490 | $(23,225) | $17 | $129 | $10,260 |
| Credit facilities | 0 | 0 | 0 | 0 | 0 | 0 |
| Borrowings | $8,849 | $24,490 | $(23,225) | $17 | $129 | $10,260 |
Table 44 Notes
|
||||||
The following provides a reconciliation of liabilities arising from financing activities, including both changes arising from cash and non-cash changes for the year ended March 31, 2018 ($ millions):
| Non-cash changes | Closing balance | |||||
|---|---|---|---|---|---|---|
| Opening balance | Proceeds from borrowings | Repayment of borrowings | Foreign exchange gains | Fair valuetable 45 note 1 gains | ||
| Capital market debt financing | $7,846 | $19,807 | $(18,664) | $(27) | $(113) | $8,849 |
| Credit facilities | 0 | 25 | (25) | 0 | 0 | 0 |
| Borrowings | $7,846 | $19,832 | $(18,689) | $(27) | $(113) | $8,849 |
Table 45 Notes
|
||||||
11. Related party transactions
(A) Certain investees
Transactions between PSPIB and its unconsolidated subsidiaries, jointly controlled investees and associates or subsidiaries of such entities are related party transactions. PSPIB enters into investment transactions with such related parties in the normal course of its business, more specifically, as part of private markets and certain fixed income investments described under Note 5(A) as well as guarantees, indemnities and commitments described under Notes 23 and 24, respectively. Since balances in connection with all investment transactions are measured at FVTPL, those transactions undertaken with related parties have the same impact on net assets available for benefits as those with unrelated parties.
Transactions between PSPIB and its consolidated subsidiaries as well as related balances are eliminated upon consolidation and, therefore, are not disclosed in this note.
(B) Government-related entities
Since PSPIB is a Crown corporation, it is considered to be a government-related entity. Other entities that are controlled, jointly controlled or significantly influenced by the government are also considered government-related entities.
PSPIB may enter into investment transactions with government-related entities in the normal course of its business, more specifically, as part of private markets and certain fixed income investments described under Note 5(A). Such investment transactions are carried out on terms that are equivalent to those that may prevail in transactions with unrelated parties and are subject to the same internal processes. In this respect, transactions with such related parties have the same impact on the net assets available for benefits as those with unrelated parties. Consequently, management is availing itself of the exemption under IAS 24 Related Parties from making specific disclosures on transactions and balances with such government-related entities.
12. Capital management
PSPIB manages the pension plan’s investments. PSPIB’s investment objectives are:
- To invest fund transfers in the best interests of the beneficiaries and contributors under the PSSA. The funds received are invested with a view of achieving a maximum rate of return, without undue risk of loss, having regard to the funding, policies and requirements of the pension plan under the PSSA and the ability of the pension plan to meet its financial obligations. The funds are also invested in accordance with PSPIB’s Investment Risk Management policy which is outlined in Note 7.
- To maintain an appropriate credit rating to achieve access to the capital markets at the lowest cost of capital. Through PSP Capital Inc. and its leverage policies, PSPIB has the ability to raise capital by issuing short-term promissory notes and medium-term notes. Note 10(B) provides information on the capital market debt financing and Note 7(C) provides information on PSPIB’s liquidity.
The pension plan’s capital consists of the actuarial funding surplus or deficit determined regularly by the actuarial funding valuation prepared by the OCA. The purpose of this actuarial valuation is to determine the financial position of the pension plan by testing its ability to meet obligations to current plan members and their survivors. Using various assumptions, the OCA projects the future pension benefits to estimate the current value of the pension obligations on a funding basis, which is compared with the sum of: the investment assets held by PSPIB (net of investment-related liabilities and borrowings), including their projected earnings; and the discounted value of future plan member and government contributions, including future earnings on contributions. The result of this comparison is either an actuarial surplus or an actuarial deficit.
It is government policy that the obligations pertaining to service before April 1, 2000, are unfunded and are paid as they become due. For the obligations pertaining to service since April 1, 2000, the objective of managing the capital position of the pension plan is to ensure that the investments held by PSPIB are sufficient to meet the related future pension obligations.
13. Pension obligations
The OCA performs an actuarial valuation for accounting purposes as at March 31 of each fiscal year to measure and report the pension obligations, and to attribute the costs of the benefits to the period using the projected benefit method prorated on service. The actuarial valuation is based on the most recent triennial actuarial valuation for funding purposes in regards to the majority of the demographic assumptions. The other assumptions underlying the valuation are based on management’s best estimates of expected long-term experience and short-term forecasts. The assumptions include estimates of discount rates, future inflation, returns on investments, general wage increases, workforce composition, retirement rates and mortality rates.
The discount rates used to measure the present value of the accrued pension benefits are as follows:
- for funded pension benefits, the streamed expected rates of return on invested funds; and
- for unfunded pension benefits, the government’s cost of borrowing derived from the yields on the actual zero-coupon yield curve for Government of Canada bonds which reflect the timing of the expected future cash flows.
The principal actuarial assumptions used in measuring the pension obligations were as follows as at March 31:
| 2019 (%) |
2018 (%) |
|
|---|---|---|
| Discount rates | ||
Funded pension benefitstable 46 note 1 |
5.8 | 5.8 |
Unfunded pension benefitstable 46 note 2 |
1.8 | 2.2 |
| Long-term rate of inflation | 2.0 | 2.0 |
| Long-term general wage increase | 2.6 | 2.6 |
Table 46 Notes
|
||
For the year ended March 31, 2019, the pension plan recorded net losses of $6.3 billion (net gains of $0.9 billion in 2018) related to losses due to changes in actuarial assumptions of $5.9 billion (gains of $1.9 billion in 2018) and experience losses of $0.4 billion (experience losses of $1.0 billion in 2018).
Pension plan curtailment
In 2019, former employees of Atomic Energy of Canada Limited working at Canadian Nuclear Laboratories ceased active participation in the pension plan. The impact of this pension plan curtailment was a one-time past service cost reduction of $118 million, reducing the pension obligations for the funded and unfunded portions of the pension plan.
14. Deficit to be financed by the Government of Canada
The financial statement deficit does not impact the benefit payments to plan members because the government has a statutory obligation to pay the pension benefits it sponsors. Pursuant to pension legislation, the transactions for funded and unfunded pension benefits are tracked in the pension accounts in the accounts of Canada.
(A) Funded pension benefits
The pension plan is financed from employee and employer contributions, as well as from investment earnings. Funded pension benefits relate to post-March 2000 service that falls within the Income Tax Act limits, as an amount equal to contributions less benefit payments and other charges is invested by PSPIB. Funded pension benefits also include pre-2000 service purchased since April 1, 2000.
(B) Unfunded pension benefits
Unfunded pension benefits related to pre-April 2000 service are tracked in the pension plan superannuation account since no separate invested funds are maintained for this account (see Note 21). Employee and employer contributions for unfunded pension benefits are part of the CRF.
15. Investment income
The investment income of the pension plan is presented for each major class of financial assets and liabilities and is comprised of two categories: interest and dividends, and net unrealized and realized gains (losses). This presentation reflects the substance of the investment income generated by the underlying investments, whether directly held by PSPIB or by its investment entity subsidiaries.
The investment income of the pension plan is comprised of the following for the years ended March 31 ($ millions):
| 2019 | 2018 | |||||
|---|---|---|---|---|---|---|
| Interest and dividends | Change in fair valuetable 47 note 1 | Total investment income | Interest and dividends | Change in fair valuetable 47 note 1 | Total investment income | |
| Public markets | $769 | $(197)table 47 note 2 | $572 | $678 | $3,336table 47 note 2 | $4,014 |
| Private markets | ||||||
Real estate |
533 | 822table 47 note 2 | 1,355 | 444 | 1,564table 47 note 2 | 2,008 |
Private equity |
358 | 1,668table 47 note 2 | 2,026 | 173 | 866table 47 note 2 | 1,039 |
Infrastructure |
416 | 482table 47 note 2 | 898 | 361 | 1,361table 47 note 2 | 1,722 |
Natural resources |
168 | 311table 47 note 2 | 479 | 151 | 186table 47 note 2 | 337 |
| Fixed income | 1,594 | 1,070table 47 note 2 | 2,664 | 1,176 | (82)table 47 note 2 | 1,094 |
| Alternative investments | 6 | 384 | 390 | 5 | 162 | 167 |
| Total before giving effect to investment-related assets and liabilities | $3,844 | $4,540 | $8,384 | $2,988 | $7,393 | $10,381 |
| Investment-related assets and liabilities | $17 | $831 | $848 | $6 | $(53) | $(47) |
| Capital market debt financing | $0 | $(273) | $(273) | $0 | $227 | $227 |
| Investment income | $3,861 | $5,098 | $8,959 | $2,994 | $7,567 | $10,561 |
Table 47 Notes
|
||||||
16. Contributions
The contributions related to funded benefits for the years ended March 31 are as follows ($ millions):
| 2019 | 2018 | |
|---|---|---|
| From plan members | ||
Current service contributions |
$2,397 | $2,214 |
Past service contributions |
332 | 100 |
| Total plan member contributions | $2,729 | $2,314 |
| From employers | ||
Current service contributions |
$2,414 | $2,232 |
Past service contributions |
254 | 43 |
| Total employer contributions | $2,668 | $2,275 |
| Total plan member and employer contributions | $5,397 | $4,589 |
17. Actuarial adjustment
The PSSA requires that any actuarial deficit be dealt with by transferring equal instalments to the pension fund over a period of up to 15 years, commencing in the year in which the actuarial report is tabled in Parliament.
No actuarial adjustment payment was made to the pension fund in the fiscal year ended March 31, 2019 ($340 million in 2018) based on the triennial actuarial valuation of the pension plan as at March 31, 2017, that was tabled in Parliament on November 2, 2018. The next triennial actuarial valuation of the pension plan as at March 31, 2020, is expected to be tabled in Parliament in 2021.
18. Benefit payments and refunds and transfers
(A) Benefit payments
The value of benefit payments for funded benefits, for the years ended March 31, is as follows ($ millions):
| 2019 | 2018 | |
|---|---|---|
| Retirement benefit payments | $2,063 | $1,820 |
| Disability benefit pension payments | 192 | 182 |
| Death benefit paymentstable 48 note 1 | 19 | 15 |
| Total benefit payments | $2,274 | $2,017 |
Table 48 Notes
|
||
(B) Refunds and transfers
The value of refunds and transfers for funded benefits, for the years ended March 31, is as follows ($ millions):
| 2019 | 2018 | |
|---|---|---|
| Payments with respect to division of pension benefits | $42 | $37 |
| Returns of contributions and transfer value payments | 304 | 233 |
| Transfers to other pension plans | 42 | 37 |
| Total refunds and transfers | $388 | $307 |
19. Investment-related expenses
Investment-related expenses allocated to the pension plan are comprised of the following for the years ended March 31 ($ millions):
| 2019 | 2018 | |
|---|---|---|
| Interest expense | $244 | $155 |
| Transaction costs | 93 | 101 |
| External investment management feestable 49 note 1 | 20 | 29 |
| Other (net)table 49 note 2 | 164 | 134 |
| Total | $521 | $419 |
Table 49 Notes
|
||
20. Administrative expenses
The legislation provides for administrative expenses to be charged to the pension plan. The Treasury Board approves the administrative expenses chargeable to the plan.
PSPC, as the day-to-day administrator, recovers from the pension plan administrative expenses for the activities directly attributable to its administration. These costs include salaries and benefits, systems maintenance and development, accommodation, and other operating costs of administering the pension plan within the department.
The Secretariat, as the program manager of the pension plan, provides policy interpretation support, information to plan members, financing and funding services and support to the Pension Advisory Committee, and charges its administrative costs to the pension plan.
Health Canada is reimbursed for the costs related to medical examinations required for members that elect to purchase prior service and for members who retire on medical grounds under the pension plan. These costs are included in the Secretariat’s operations and maintenance costs charged to the pension plan.
The OCA provides actuarial valuation services. The costs related to these services are charged to the pension plan.
PSPIB charges plan-related administrative expenses such as salaries and employee benefits, operations and maintenance, professional and consulting fees, and other operating fees to the pension plan. The allocation methodology of the costs of operation of PSPIB is outlined in Note 9.
Administrative expenses, for the years ended March 31, consist of the following ($ millions):
| 2019 | 2018 | |
|---|---|---|
| PSPC | ||
Salaries and employee benefits |
$61 | $63 |
Professional and consulting fees |
13 | 14 |
Operations and maintenance |
11 | 10 |
Other |
6 | 7 |
| Total | $91 | $94 |
| The Secretariat | ||
Salaries and employee benefits |
$4 | $4 |
Operations and maintenance |
2 | 2 |
| Total | $6 | $6 |
| OCA | ||
Actuarial fees |
$1 | $1 |
| Total for government departments (included in the service cost) | $98 | $101 |
| PSPIB | ||
Salaries and employee benefits |
$211 | $190 |
Operations and maintenance |
74 | 65 |
Professional and consulting fees |
56 | 52 |
Other |
27 | 30 |
| Total | $368 | $337 |
| Total administrative expensestable 50 note 1 | $466 | $438 |
Table 50 Notes
|
||
21. Superannuation account
A separate superannuation account has been established in the accounts of Canada in accordance with the PSSA and is not consolidated in the pension plan financial statements. In order for the government to track transactions made through the CRF, the superannuation account records contributions, benefit payments, interest and transfers that pertain to service before April 1, 2000. The superannuation account does not contain separate invested funds; rather, it is credited with notional interest as though net cash flows were invested quarterly in 20-year Government of Canada bonds issued at prescribed rates and held to maturity.
The following summarizes the financial position of the superannuation account and contributions receivable for service before April 1, 2000, as at March 31 ($ millions):
| 2019 | 2018 | |
|---|---|---|
| Balance of account | ||
Superannuation account |
$93,700 | $92,536 |
Contributions receivable from plan members for past service |
16 | 17 |
Contributions receivable from employers for past service |
14 | 16 |
| Subtotal | $93,730 | $92,569 |
| Pension obligationstable 51 note 1 | $117,159 | $114,603 |
| Shortfall of the balance of the account over the pension obligations | $(23,429) | $(22,034) |
Table 51 Notes
|
||
The PSSA requires that any actuarial shortfall resulting from a lower balance in the superannuation account than the actuarial liability, based on the actuarial valuation for funding purposes, be addressed by increasing the superannuation account in equal instalments over a period of up to 15 years.
The PSSA also allows the surplus, based on the actuarial valuation for funding purposes, to be reduced by decreasing the superannuation account over a period of up to 15 years; however, if the balance of the superannuation account exceeds 110% of the amount required to meet the cost of the benefits payable, the surplus amount must be reduced by decreasing the superannuation account annually over a period of up to 15 years.
For the year ended March 31, 2019, an adjustment of $3,107 million was made to the superannuation account (no adjustment in 2018) to cover actuarial deficiencies.
The following summarizes the transactions in the superannuation account for unfunded pension benefits for the years ended March 31 ($ millions):
| 2019 | 2018 | |
|---|---|---|
| Opening balance | $92,536 | $94,209 |
| Increase | ||
Contributions by plan members |
$6 | $8 |
Contributions by employers |
5 | 7 |
Actuarial adjustment |
3,107 | 0 |
Interest income |
3,593 | 3,830 |
Transfers from other pension plans |
1 | 0 |
| Total increase | $6,712 | $3,845 |
| Decrease | ||
Benefits paid |
$5,471 | $5,429 |
Refunds and transfers |
31 | 34 |
Administrative expenses |
46 | 55 |
| Total decrease | $5,548 | $5,518 |
| Closing balance | $93,700 | $92,536 |
22. Retirement compensation arrangements
Retirement compensation arrangements (RCAs) have been established under the authority of the Special Retirement Arrangements Act to provide supplementary pension benefits to certain plan members. Since these arrangements are covered by separate legislation, the balance of the RCAs and the related pension obligations are not consolidated in the financial statements of the pension plan.
RCA No. 1 provides for benefits in excess of those permitted under the Income Tax Act restrictions for registered pension plans.
RCA No. 2 provides pension benefits to federal public service employees who were declared surplus as a result of a 3-year Early Retirement Incentive program that ended on March 31, 1998. The cost of RCA No. 2 is assumed entirely by the government.
Pursuant to the legislation, transactions pertaining to both RCA No. 1 and RCA No. 2, such as contributions, benefits, and interest credits, are recorded in the RCA accounts, which are maintained in the accounts of Canada. The legislation also requires that the RCA accounts be credited with interest quarterly at the same rates as those credited to the Superannuation Account.
The RCAs are registered with the Canada Revenue Agency (CRA), and a transfer is made annually between the RCA accounts and the CRA either to remit a 50% refundable tax in respect of the net contributions and interest credits or to be credited a reimbursement based on the net benefit payments.
The following summarizes the financial position of RCA No. 1 and RCA No. 2 as at March 31 ($ millions):
| 2019 | 2018 | |
|---|---|---|
| Balance of the accounts | ||
RCA accounts |
$1,925 | $1,930 |
Refundable tax receivable |
1,937 | 1,938 |
Contributions receivable from plan members for past service |
1 | 1 |
Contributions receivable from employers for past service |
1 | 0 |
| Subtotal | $3,864 | $3,869 |
| Pension obligations | $3,833 | $3,597 |
| Excess of the balance of the accounts over the pension obligations | $31 | $272 |
The actuarial assumptions used to value the pension obligations pertaining to the RCA accounts are consistent in all respects with those used for the superannuation account.
The following summarizes the transactions in RCA No. 1 and RCA No. 2 for the years ended March 31 ($ millions):
| 2019 | 2018 | |
|---|---|---|
| Opening balance | $3,869 | $3,865 |
| Increase | ||
Contributions by plan members |
$14 | $12 |
Contributions by employers |
41 | 84 |
Interest income |
75 | 78 |
Net change in contributions receivable for past service |
1 | (38) |
Increase in refundable tax receivable |
(1) | 23 |
| Total increase | $130 | $159 |
| Decrease | ||
Benefits paid |
$134 | $130 |
Refunds and transfers |
2 | 2 |
Refundable tax remittance |
(1) | 23 |
| Total decrease | $135 | $155 |
| Closing balance | $3,864 | $3,869 |
Actuarial shortfalls found between the balance in the RCA accounts and the actuarial liabilities are credited to the RCA accounts in equal instalments over a period of up to 15 years. Adjustments to fund deficiencies are based on triennial actuarial valuations. For the year ended March 31, 2019, no adjustment was made to RCA No. 1 (no adjustment in 2018), and no adjustment was made to RCA No. 2 (no adjustment in 2018) to cover actuarial deficiencies.
23. Guarantees and indemnities
PSPIB provides indemnification to its directors, its officers, its vice-presidents and to certain PSPIB representatives who are asked to serve on boards of directors (or like bodies) or investment advisory boards (or like bodies) of entities in which PSPIB or its investment entity subsidiaries have made an investment or have a financial interest. As a result, but subject to the Public Service Pension Investment Board Act, PSPIB may be required to indemnify these representatives for costs incurred, such as claims, actions or litigation in connection with the exercise of their duties, unless the liability of such a representative relates to a failure to act honestly and in good faith. To date, PSPIB has not received any claims or made any payment for such indemnities.
In certain cases, PSPIB also provides indemnification to third parties in the normal course of business. As a result, PSPIB may be required to indemnify such third parties in connection with the performance of their contractual obligations. To date, PSPIB has not received any claims nor made any payments for such indemnities.
PSPIB unconditionally and irrevocably guarantees all credit facilities, as well as short-term promissory notes and medium-term notes issued by PSP Capital Inc., as described in Note 10.
In certain investment transactions, PSPIB and its investment entity subsidiaries provided guarantees, indemnifications or issued letters of credit to third parties, the most significant of which are as follows:
- As at March 31, 2019, and March 31, 2018, PSPIB and its investment entity subsidiaries agreed to guarantee and, in some cases, provide indemnification for the performance of certain investees under contractual agreements. The majority of these arrangements are borrowing arrangements. In the event a default occurs under such agreements, which is of limited recourse in certain cases, PSPIB or its investment entity subsidiaries could assume obligations of up to $2,602 million as at March 31, 2019 ($2,550 million as at March 31, 2018), of which $1,891 million has been allocated to the pension plan ($1,851 million as at March 31, 2018) plus applicable interest and other related costs. The arrangements mature between July 2019 and November 2029 as of March 31, 2019 (between November 2018 and November 2029 as of March 31, 2018).
- Additionally, PSPIB and its investment entity subsidiaries issued letters of credit totalling $54 million as at March 31, 2019 ($53 million as at March 31, 2018), of which $39 million has been allocated to the pension plan ($38 million as at March 31, 2018) in relation to investment transactions.
24. Commitments
PSPIB and its investment entity subsidiaries have committed to enter into investment transactions, which will be funded over the next several years in accordance with agreed terms and conditions. The portion of PSPIB’s commitments that would be assumed by the pension plan is as follows as at March 31 ($ millions):
| 2019 | 2018 | |
|---|---|---|
| Foreign equity | $0 | $3 |
| Real estate | 1,774 | 1,664 |
| Private equity | 7,482 | 8,231 |
| Infrastructure | 1,943 | 2,815 |
| Natural resources | 304 | 332 |
| Private debt securities | 3,009 | 2,727 |
| Alternative investments | 1,507 | 1,620 |
| Total | $16,019 | $17,392 |
Funding in connection with the above commitments can be called upon at various dates extending until 2035 as at March 31, 2019 (until 2035 as at March 31, 2018).
© Her Majesty the Queen in Right of Canada, represented by the President of the Treasury Board, 2020,
ISSN: 2291-4285