
Employment Insurance Monitoring and Assessment Report for the fiscal year beginning April 1, 2017 and ending March 31, 2018
Chapter 2 - 6 Employment Insurance special benefits
From: Employment and Social Development Canada
2.6. Employment Insurance special benefits
EI special benefits provide temporary income support to eligible insured employees or self-employed persons (including fishers) who are unable to work due to specific life circumstances. These circumstances include sickness; pregnancy; and caregiving for a newborn, a newly adopted child, a critically ill family member or a gravely ill family member with significant risk of death.
To qualify for EI special benefits, insured employees must have accumulated a minimum of 600 hours of insurable employment during their qualifying period, meet the eligibility criteria of the specific special benefits being claimed, and experience a reduction in their normal weekly earnings by over 40%. Self-employed persons may qualify if they opted into the EI program at least one full year prior to claiming benefits, have self-employment earnings that meet the minimum self-employment eligibility thresholdFootnote 79 in the calendar year preceding the claim, and meet the other eligibility criteria specific to the special benefits being claimed.
Subsection 2.6.1 provides a summary overview of special benefits in terms of the number of new claims established, the amount paid and the level of benefits. The following subsections examine the EI special benefits one by one. Subsection 2.6.2 discusses maternity and parental benefits. Sickness benefits are introduced in subsection 2.6.3. Subsections 2.6.4, 2.6.5 and 2.6.6 examine compassionate care benefits, the family caregiver benefit for adults and the family caregiver benefit for childrenFootnote 80, respectively. Finally, subsection 2.6.7 looks at the use of special benefits by self-employed persons who have opted into the EI program.
For the purpose of this section, EI special benefit claims refer to EI claims for which at least one dollar of special benefits was paid.Footnote 81 With regards to subsections 2.6.2 to 2.6.6, for each type of EI special benefits, claims for which at least one dollar corresponding to the type of benefits in question was paid are considered.
2.6.1 Employment Insurance special benefit claims overview
In FY1718, there were about 597,100 new special benefit claims established, which represents a 6.0% increase over the previous fiscal year (see Table 44) and the seventh consecutive year-over-year increase. Two thirds of those special benefit claims included sickness benefits (69.0%), while 33.2% and 28.7% included parental and maternity benefits respectively. Other types of special benefits were paid less frequently. About 1.8% of all special benefit claims included compassionate care benefits and 0.8% included family caregiver benefits for children. Family caregiver benefits for adults, which became available on December 3, 2017, were included in 0.4% of all special benefit claims.
| Type of benefits | Number of claims | Amount paid ($ millions) | ||||
|---|---|---|---|---|---|---|
| FY1617 | FY1718 | Change (%) | FY1617 | FY1718 | Change (%) | |
| Maternity | 170,330 | 171,470 | +0.7% | $1,137.3 | $1,150.3 | +1.1% |
| Parental | 195,960 | 198,050 | +1.1% | $2,705.1 | $2,778.1 | +2.7% |
| Sickness | 378,700 | 411,870 | +8.8% | $1,567.4 | $1,712.0 | +9.2% |
| Compassionate care | 10,193 | 11,010 | +8.0% | $54.1 | $61.1 | +12.8% |
| Family caregiver for adults | N/A | 2,635 | N/A | N/A | $7.7 | N/A |
| Family caregiver for children | 4,238r | 4,903 | +15.7% | $26.6r | $30.3 | +14.3% |
| Canada | 563,380 | 597,090 | +6.0% | $5,490.5r | $5,739.5 | +4.5% |
- Note: Data may not add up to the total due to rounding. Percentage change is based on unrounded numbers. Includes all claims for which at least $1 in EI special benefits was paid. New claims established by benefit type may not sum as claimants can receive multiple benefit types on a single claim.
- r Revised data.
- Source: Employment and Social Development Canada, Employment Insurance (EI) administrative data. Data on maternity, parental and sickness benefits are based on a 10% sample of EI administrative data, whereas data on compassionate care benefits, family caregiver benefits for adults and family caregiver benefits for children are based on a 100% sample.
Family caregiver benefits for children experienced the largest percentage change with a 15.7% hike in new claims over FY1617, followed by sickness benefits (+8.8%) and compassionate care benefits (+8.0%). The number of maternity and parental claims slightly increased by 0.7% and 1.1%, respectively.
The total amount of special benefits paid increased by 4.5% over the previous year, totaling $5.7 billion for FY1718. Amounts paid went up for all types of special benefits.
Like previous years, almost two thirds of special benefit claims (64.4%) were established by women, and they received the larger part of the amount paid in special benefits (81.2%), mostly because they received the majority of parental benefits and because only women can access maternity benefits.
By age, claimants between the ages of 25 and 39 years old established almost half (48.0%) of new special benefit claims and received the largest share of total special benefits paid (70.3%). They also received 89.3% and 88.1% of the total amounts paid for maternity and parental benefits respectively. Claimants aged 40 years old and over received a higher proportion of the amounts paid in sickness benefits (63.8%) and in compassionate care benefits (79.0%).
Except for extended parental benefits, which are paid out at a lower rate than other types of special benefits (see sub-section 2.6.2), the average weekly benefit rate for new special benefit claims established in FY1718 jumped 1.8% from the previous fiscal year, to reach $440. The share of special benefit claims for which the maximum weekly benefit rate was paid was 41.7%, an increase of 1.0 percentage points compared to FY1617.
Employment Insurance special benefits and firms
According to 2016 tax data —the most recent microdata available when writing this report—there were just under 197,300 firms (16.4% of all firms in 2016) associated with the establishment of an EI special benefit claim as a claimant’s current or most recent employer (see Table 45). This is an increase of 3.6% from the previous year.
| Firm size | Number of firms | Employment distribution** (% Share) |
EI claimant*** (% Share) |
|
|---|---|---|---|---|
| All firms | Firms with at least one employee receiving EI special benefits | |||
| Small | 1,086,990 | 114,200 | 21.7% | 18.6% |
| Small-medium | 93,840 | 64,830 | 19.7% | 21.6% |
| Medium-large | 15,770 | 15,040 | 15.9% | 18.1% |
| Large | 3,210 | 3,190 | 42.6% | 41.7% |
| Canada | 1,199,810 | 197,250 | 100.0% | 100.0% |
- * The categories of firm size reflect those found in Business Dynamics in Canada, a Statistics Canada publication. Small-sized firms are defined as those that employ 1 to 19 employees. Small-to-medium-sized firms employ 20 to 99 employees. Medium-to-large sized firms employ 100 to 499 employees. Large-sized firms employ 500 employees or more.
- **The number of workers in a firm is the number of individuals with employment income in that firm, as indicated on a T4 form. The number of workers is adjusted so that each individual in the labour force is only counted once and individuals who work for more than one firm are taken into account. For example, if an employee earned $25,000 in firm 1 and $25,000 in firm 2, then he or she was recorded as 0.5 employees at the first firm and 0.5 employees at the second firm.
- *** These are based on the number of people receiving EI special benefits in 2016.
- Sources: Employment and Social Development Canada, Employment Insurance (EI) administrative data. Data are based on a 100% sample of EI data. Canada Revenue Agency (CRA) administrative data. CRA data are based on a 100% sample.
The distribution of the workforce and EI special benefit claimants is roughly similar by size of employer, unlike EI regular benefits for which larger firms are under-represented (see section 2.2). In the case of special benefits, the largest difference between employee and claimant distributions was observed in small-sized firms, but only at a difference of 3.1 percentage points. Whereas workforce adjustment issues during a difficult business or economic context may offer some explanation of the higher relative use of EI regular benefits among small firms, the use of EI special benefits more likely relates to the demographic profile of the workforce, individual circumstances, and the nature of the work in the industry.
2.6.2 Employment Insurance maternity and parental benefits
EI maternity benefits are available to eligible biological mothers who cannot work because they are pregnant or have recently given birth. EI maternity claimants need to meet the eligibility requirements for EI special benefits in terms of insurable hours of employment or earnings (see section 2.6), and provide the Commission with a signed statement attesting to their pregnancy and their expected or actual date of delivery.Footnote 82 Qualified claimants may receive up to 15 weeks of maternity benefits per benefit period. Benefits can begin to be paid twelve weeks prior to the expected date of birth and can end as late as 17 weeks after the child’s actual birth date.Footnote 83
EI parental benefits are available to parents who take a leave from work to care for a newborn or recently adopted child or children. To be eligible for parental benefits, applicants must meet the eligibility requirements for EI special benefits in terms of hours of insurable employment or earnings and provide a signed certificate certifying the child’s date of birth or the date of the child’s placement in their home for an adoption. Parents whose children were born or placed for adoption on December 3, 2017, or later must choose between receiving standard parental benefits or extended parental benefits. Before this date, only standard parental benefits were available.
- Standard parental benefits provide up to 35 weeks of benefits paid over a maximum of 12 months according to a benefit rate of 55% of weekly insurable earnings, up to a maximum of $543 in 2017 and $547 in 2018.
- Extended parental benefits provide parents with up to 61 weeks of benefits paid over a maximum of 18 months. The benefit rate is 33% of weekly insurable earnings, up to a maximum of $326 in 2017 and $328 in 2018.
Parents must select an option before benefit payments begin, and this choice is final once parental benefits have been paid out. In the context of both options, parents are authorized to share benefits and they can use them at the same time or at different times. When parental benefits are shared by both parents, only a single waiting period needs to be served.
It should be noted that the maternity and parental benefits offered under the EI program are available across Canada with the exception of Quebec. For parents who reside in Quebec, the Quebec Parental Insurance Plan (QPIP) has provided benefits to salaried workers and self-employed persons who are eligible to take maternity, paternity, parental, or adoption leave since January 1, 2006.
EI parental sharing benefit
In Budget 2018, the government committed to offering additional weeks of parental benefits to eligible parents, when those benefits are shared. The goal is to encourage all parents, including fathers, to take leave when a new child comes into the family and to promote a more equal division of responsibilities relating to the education of their children. This measure was implemented on March 17, 2019. As a result, it was not in effect during the period examined by this report. Under this measure:
- Parents who share standard parental benefits are eligible to 5 additional weeks of benefits, for a total of 40 weeks. No parent is eligible to receive more than 35 weeks of standard parental benefits.
- Parents who share extended parental benefits are able to obtain 8 additional weeks of benefits, for a total of 69 weeks. No parent is eligible to receive more than 61 weeks of extended parental benefits.
This measure is offered to parents eligible to the program, including biological and adoptive parents, same-sex and opposite-sex parents, whose children are born or placed for adoption on March 17, 2019, or later and who agree to share parental benefits.
Employment Insurance maternity and parental benefits : coverage and accessibility
According to the 2017 Employment Insurance Coverage Survey (EICS), 221,100 recent mothers (those with a child aged 12 months or less) living outside Quebec had insurable employment in 2017, which represents 74.6% of all recent mothers. Among those recent mothers with insurable employment, 87.2% reported having received maternity or parental benefits, which represents a slight decrease of 1.6 percentage points from the previous year (88.8%) (see Chart 33).
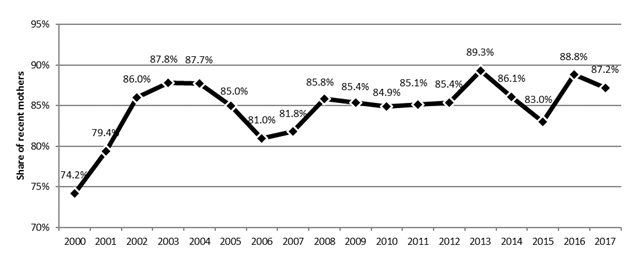
Chart 33 – Text version
| Share of recent mothers | |
|---|---|
| 2000 | 74.2% |
| 2001 | 79.4% |
| 2002 | 86.0% |
| 2003 | 87.8% |
| 2004 | 87.7% |
| 2005 | 85.0% |
| 2006 | 81.0% |
| 2007 | 81.8% |
| 2008 | 85.8% |
| 2009 | 85.4% |
| 2010 | 84.9% |
| 2011 | 85.1% |
| 2012 | 85.4% |
| 2013 | 89.3% |
| 2014 | 86.1% |
| 2015 | 83.0% |
| 2016 | 88.8% |
| 2017 | 87.2% |
- Source: Statistics Canada, Employment Insurance Coverage Survey, 2000 to 2017
According to EICS data, the proportion of spouses of recent mothers living outside Quebec who received or intended to claim EI parental benefits went from 12.9% in 2016 to 11.9% in 2017. In Quebec, a larger share of spouses of recent mothers received parental benefits or intended to receive them (81.2%), which may be largely due to the paternity benefits paid specifically to fathers as part of QPIP.
Access to maternity and parental benefits and coverage
According to 2017 EICS data, the share of recent mothers with insurable employment in Quebec who received maternity or parental benefits under QPIP (97.1%) is greater than that of persons having received EI maternity or parental benefits in other regions of Canada (87.2%). This situation can be explained by several factors, most notably the mandatory participation of self-employed persons under QPIP in comparison to the voluntary participation in the EI program and the lower eligibility requirement based on earnings under QPIP ($2,000).
Employment Insurance maternity claims, amount paid and level of benefits
In FY1718, there were almost 171,500 new EI maternity claims established, which represented a modest increase of 0.7% over the previous fiscal year (see Table 46). In most provinces and territories, the number of new maternity claims established stayed relatively unchanged.
| Number of claims | Amount paid ($ millions) | |||||
|---|---|---|---|---|---|---|
| FY1617 | FY1718 | Change (%) | FY1617 | FY1718 | Change (%) | |
| Province or territory | ||||||
| Newfoundland and Labrador | 2,750 | 2,730 | -0.7% | $18.5 | $17.8 | -3.8% |
| Prince Edward Island | 1,030 | 900 | -12.6% | $6.2 | $6.5 | +4.8% |
| Nova Scotia | 5,000 | 5,060 | +1.2% | $32.0 | $31.4 | -1.8% |
| New Brunswick | 4,130 | 4,180 | +1.2% | $27.9 | $25.1 | -10.2% |
| Quebec | N/A | N/A | N/A | N/A | N/A | N/A |
| Ontario | 83,770 | 83,920 | +0.2% | $556.9 | $566.4 | +1.7% |
| Manitoba | 8,150 | 8,610 | +5.6% | $51.5 | $55.4 | +7.5% |
| Saskatchewan | 7,760 | 8,330 | +7.3% | $53.0 | $55.4 | +4.5% |
| Alberta | 30,580 | 29,470 | -3.6% | $212.9 | $206.2 | -3.1% |
| British Columbia | 26,340 | 27,430 | +4.1% | $172.6 | $179.9 | +4.2% |
| Yukon | 280 | 240 | -14.3% | $2.0 | $1.9 | -8.4% |
| Northwest Territories | 320 | 300 | -6.3% | $2.5 | $2.3 | -9.2% |
| Nunavut | 220 | 300 | +36.4% | $1.3 | $2.1 | +58.2% |
| Age category | ||||||
| 24 years old and under | 15,470 | 15,080 | -2.5% | $77.4 | $76.1 | -1.6% |
| 25 to 39 years old | 148,720 | 149,440 | +0.5% | $1,017.9 | $1,027.1 | +0.9% |
| 40 years old and over | 6,140 | 6,950 | +13.2% | $41.9 | $47.1 | +12.3% |
| Canada | 170,330 | 171,470 | +0.7% | $1,137.3 | $1,150.3 | +1.1% |
- Note: Data may not add up to the total due to rounding. Percentage change is based on unrounded numbers. Includes claims for which at least $1 of EI maternity benefits was paid.
- Source: Employment and Social Development Canada, Employment Insurance (EI) administrative data. Data are based on a 10% sample of EI administrative data.
Women between 25 and 39 years old established 87.2% of new maternity claims during the reporting period, while women aged 24 years old and younger and those aged 40 years old and over represented 8.8% and 4.1% of new claims, respectively. While the number of new claims established by mothers aged 25 to 39 years old remained roughly the same, the number for mothers aged 40 years old and over reported a large increase (+13.2%) compared to the previous year.
The total amount paid out in maternity benefits was almost 1.2 billion dollars for FY1718, an increase of 1.1% compared to the previous fiscal year. The provinces and territories that reported an increase in the number of maternity claims established tended to have higher maternity benefit amounts compared to FY1617, except for some of the Atlantic provinces. Similarly, women over 40 years old who represented the group with the biggest increase in the number of claims, also recorded the largest growth in maternity benefit payments.
Maternity benefits are frequently combined in the same claim with other types of benefits, particularly parental and sickness benefits, with 98.5% of all EI maternity claims completed during the reporting fiscal year including some other type of EI benefits (see subsection 2.1.2).
The average weekly maternity benefit rate increased by 1.6% to $454 in FY1718. Half (49.6%) of claimants received the maximum weekly benefit rate. On average, the highest weekly maternity benefit rate was for claims established in the Yukon ($518) and the Northwest Territories ($499) and by mothers aged 40 years old and over ($480).
Employment Insurance parental benefits, amount paid and level of benefits
The total number of new parental claims established increased by 1.1% over the previous year to reach 198,050 in FY1718 (see Table 47). Less than 1.0% of these parental claims came from adoptive parents (about 1,500). Manitoba, Saskatchewan, and British Columbia had the highest increase in new claims established.
| Number of claims | Amount paid ($ millions) | |||||
|---|---|---|---|---|---|---|
| FY1617 | FY1718 | Change (%) | FY1617 | FY1718 | Change (%) | |
| Type of parental benefits | ||||||
| Standard | N/A | 189,350 | N/A | N/A | $2,777.1 | N/A |
| Extended | N/A | 8,700 | N/A | N/A | $1.0 | N/A |
| Province or territory | ||||||
| Newfoundland and Labrador | 2,930 | 2,790 | -4.8% | $42.0 | $42.6 | +1.4% |
| Prince Edward Island | 1,130 | 1,000 | -11.5% | $14.4 | $15.1 | +4.8% |
| Nova Scotia | 5,970 | 5,830 | -2.3% | $79.4 | $77.1 | -2.9% |
| New Brunswick | 4,580 | 4,710 | +2.8% | $62.5 | $59.8 | -4.4% |
| Quebec | N/A | N/A | N/A | $N/A | N/A | N/A |
| Ontario | 98,370 | 97,880 | -0.5% | $1,328.0 | $1,375.4 | +3.6% |
| Manitoba | 9,440 | 10,050 | +6.5% | $126.1 | $131.0 | +3.9% |
| Saskatchewan | 8,720 | 9,290 | +6.5% | $127.8 | $133.6 | +4.5% |
| Alberta | 33,480 | 33,130 | -1.0% | $501.7 | $495.3 | -1.3% |
| British Columbia | 30,340 | 32,250 | +6.3% | $409.5 | $433.4 | +5.8% |
| Yukon | 330 | 310 | -6.1% | $4.2 | $5.0 | +19.4% |
| Northwest Territories | 390 | 430 | +10.3% | $6.6 | $5.7 | -12.9% |
| Nunavut | 280 | 380 | +35.7% | $2.8 | $4.1 | +48.0% |
| Gender | ||||||
| Men | 29,490 | 30,850 | +4.6% | $233.7 | $252.4 | +8.0% |
| Women | 166,470 | 167,200 | +0.4% | $2,471.4 | $2,525.7 | +2.2% |
| Age category | ||||||
| 24 years old and under | 15,840 | 15,420 | -2.7% | $177.8 | $176.1 | -1.0% |
| 25 to 39 years old | 168,670 | 170,170 | +0.9% | $2,389.0 | $2,448.6 | +2.5% |
| 40 years old and over | 11,450 | 12,460 | +8.8% | $138.3 | $153.5 | +11.0% |
| Canada | 195,960 | 198,050 | +1.1% | $2,705.1 | $2,778.1 | +2.7% |
- Note: Data may not add up to the total due to rounding. Percentage change is based on unrounded numbers. Includes claims for which at least $1 of EI parental benefits was paid.
- Source: Employment and Social Development Canada, Employment Insurance (EI) administrative data. Data are based on a 10% sample of EI administrative data.
Parents of children born or placed for adoption on or after December 3, 2017, could choose to receive extended parental benefits (up to 61 weeks of payable benefits over a maximum of 18 months). Before December 3, 2017, only standard parental benefits were available. Over the course of the period covered by this report during which extended parental benefits were offered (the last 17 weeks of FY1718), almost 8,700 extended parental claims were established, representing 4.4% of all established parental claims. This number is relatively low and may be explained by the short period in FY1718 during which parents could receive extended parental benefits, and by the fact that maternity benefits (up to 15 weeks) are normally paid out before parental benefits after the birth of a child. By contrast, about 189,400 claims for standard parental benefits were established over the entire course of FY1718.
As in the past, women established the vast majority of parental claims (84.4%) in FY1718. However, men registered a higher increase in the number of claims (+4.6%) than women (+0.4%).
The amount paid in EI parental benefits increased by 2.7% compared to FY1617, totalling $2.8 billion in FY1718. All provinces and territories, except Nova Scotia, New Brunswick, Alberta and the Northwest Territories, observed an increase in their respective amounts paid in parental benefits compared to the previous year.
The payments paid out in extended parental benefits totalled one million dollars in FY1718, which represents a smaller portion of the total amount paid in parental benefits (0.04%) than the proportion of extended parental claims among all parental claims established (4.4%). This may be explained, in part, by the lower benefit rate of extended parental benefits (33% of weekly insurable earnings compared to 55%) and by the short period during which extended parental benefits could be paid out during FY1718.
As with new claims, the majority of the total amount of parental benefits was paid to women (90.9%). Men and women experienced an annual increase in their total amount paid in parental benefits—by 8.0% and 2.2%, respectively. By age, claimants aged 40 years old and over posted the largest increase (+11.0%) relative to the previous year.
As stated above, weekly parental benefit rates are calculated differently depending on whether the claimant is receiving standard or extended parental benefits.Footnote 84
The average weekly standard parental benefit rate reached $464, a 1.5% increase in comparison to the previous year. More than half (53.8%) of claimants received the maximum weekly standard parental benefit rate. On average, the weekly benefit rate was higher for standard parental claims established in the Yukon ($520), by men ($507) and by claimants aged 40 years old and over ($493).
The average weekly extended parental benefit rate was $286 in FY1718. Almost half (48.4%) of claimants received the maximum weekly extended parental benefit rate. On average, men ($310) and claimants aged 40 years old and over ($315) received the highest weekly benefit rate for extended parental claims.
Duration of Employment Insurance maternity and parental benefits
As observed during previous fiscal years, claimants used almost all of the EI maternity and parental weeks to which they were entitled. For the vast majority (92.8%) of maternity claims completed over FY1718, mothers received benefits during the 15 weeks available to them. The average duration of completed maternity claims was 14.7 weeks during the reporting period.
In the case of parental benefits, very few claims for extended parental benefits were completed in FY1718. Consequently, only standard parental claims are included in the results for the duration of parental benefits.
Statistics on standard parental claims completed during the reporting period show that when weeks of benefits were shared, women received an average of 22.8 weeks, whereas men received 10.4 weeks (see Chart 34). The average duration of standard parental claims on a family basis was 33.2 weeks for parents who decided to share the benefits (see Table 48). For parents who did not share the available weeks of benefits, the average duration of standard parental benefits was 33.0 weeks for claims that were completed in FY1718.
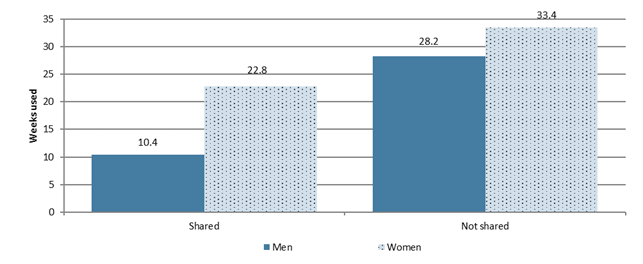
Chart 34 – Text version
| FY1718 | |
|---|---|
| Men (shared) | 10.4 |
| Women (shared) | 22.8 |
| Men (not shared) | 28.2 |
| Women (not shared) | 33.4 |
- Source: Employment and Social Development Canada, Employment Insurance (EI) administrative data. Data are based on a 10% sample of EI administrative data
| Type of benefits | FY1314 | FY1415 | FY1516 | FY1617 | FY1718P |
|---|---|---|---|---|---|
| Maternity | 14.6 | 14.6 | 14.6 | 14.6 | 14.7 |
| Standard parental, per family | |||||
| Shared | 32.9 | 33.5 | 33.2 | 33.2r | 33.2 |
| Not shared | 32.9 | 33.0 | 32.9 | 33.0r | 33.0 |
| Combined maternity and standard parental benefits, per family (Share of total entitlement used) | 47.5 (95.0%) |
47.7 (95.4%) |
47.6 (95.1%) |
47.6 (95.3%)r |
47.7 (95.4%) |
- Note: Completed claims include those that are terminated and those that are dormant and remained inactive as of August the following fiscal year. Shares of entitlement used are based on unrounded numbers.
- P Preliminary estimates.
- r Revised data.
- Source: Employment and Social Development Canada, Employment Insurance (EI) administrative data. Data are based on a 10% sample of EI administrative data.
Based on completed claims, the combined number of weeks of EI maternity and standard parental benefits used by families was an average of 47.7 weeks on a family basis or 95.4% of the 50 weeks of maternity and standard parental benefits to which they were entitled (see Table 48). Of these 47.7 weeks, 33.0 were paid in parental benefits and 14.7 were paid in maternity benefits.
2.6.3 Employment Insurance sickness benefits
EI sickness benefits are paid over a maximum period of 15 weeks to qualified people who are unable to work because of illness, injury or quarantine, but would otherwise be available to work. The exact maximum duration of benefits to which a sickness claimant is entitled depends on the recommendations from their physician or an approved medical practitioner. With job protection through the Canada Labour Code and the provincial and territorial statutes under labour law, EI sickness benefits allow claimants to recover while conserving their attachment to the labour market.
To be eligible for EI sickness benefits, claimants need to meet the eligibility requirements for EI special benefits in terms of hours of insurable employment or earnings (see section 2.6) and provide the Commission with a medical certificate signed by an attending doctor or approved medical practitioner.
Premium Reduction Program
Employers who offer short-term disability plans to their employees that are at least equivalent to the EI sickness benefits and that meet certain requirements stipulated in the Employment Insurance Act and Employment Insurance Regulations can register their plans with the Employment Insurance Commission to obtain a lower EI premium rate than the regular employer rate through the Premium Reduction Program (PRP).
More information on the effect on premiums and number of firms affected can be found in section 2.7.
Employment Insurance sickness claims, amount paid and level of benefits
Over FY1718, there were 411,900 new sickness claims established, which represented a 8.8% hike over FY1617 and the greatest annual increase over the last five fiscal years. The number of sickness claims established went up in all provinces and territories (see Table 49).
| Number of claims | Amount paid ($ millions) | |||||
|---|---|---|---|---|---|---|
| FY1617 | FY1718 | Change (%) | FY1617 | FY1718 | Change (%) | |
| Province or territory | ||||||
| Newfoundland and Labrador | 10,140 | 11,070 | +9.2% | $45.1 | $49.0 | +8.6% |
| Prince Edward Island | 6,000 | 6,100 | +1.7% | $20.2 | $21.1 | +4.7% |
| Nova Scotia | 19,070 | 21,060 | +10.4% | $74.0 | $79.0 | +6.8% |
| New Brunswick | 24,830 | 29,440 | +18.6% | $92.7 | $103.7 | +11.8% |
| Quebec | 119,210 | 131,510 | +10.3% | $428.8 | $490.2 | +14.3% |
| Ontario | 105,010 | 111,480 | +6.2% | $461.8 | $502.3 | +8.8% |
| Manitoba | 9,970 | 11,250 | +12.8% | $43.7 | $47.3 | +8.3% |
| Saskatchewan | 7,060 | 7,670 | +8.6% | $35.4 | $34.6 | -2.1% |
| Alberta | 26,520 | 27,750 | +4.6% | $138.2 | $138.3 | +0.1% |
| British Columbia | 50,170 | 53,710 | +7.1% | $223.9 | $242.3 | +8.2% |
| Yukon | 420 | 450 | +7.1% | $2.1 | $1.9 | -9.5% |
| Northwest Territories | 200 | 250 | +25.0% | $0.9 | $1.5 | +57.7% |
| Nunavut | 100 | 130 | +30.0% | $0.7 | $0.9 | +28.6% |
| Gender | ||||||
| Men | 163,870 | 179,810 | +9.7% | $745.5 | $797.0 | +6.9% |
| Women | 214,830 | 232,060 | +8.0% | $821.9 | $915.0 | +11.3% |
| Age category | ||||||
| 24 years old and under | 28,710 | 29,990 | +4.5% | $91.5 | $98.6 | +7.8% |
| 25 to 44 years old | 156,530 | 171,670 | +9.7% | $635.0 | $693.5 | +9.2% |
| 45 to 54 years old | 90,600 | 96,350 | +6.3% | $396.9 | $425.7 | +7.3% |
| 55 years old and over | 102,860 | 113,860 | +10.7% | $444.0 | $494.3 | +11.3% |
| Canada | 378,700 | 411,870 | +8.8% | $1,567.4 | $1,712.0 | +9.2% |
- Note: Data may not add up to the total due to rounding. Percentage change is based on unrounded numbers. Includes claims for which at least $1 of EI sickness benefits was paid.
- Source: Employment and Social Development Canada, Employment Insurance (EI) administrative data. Data are based on a 10% sample of EI administrative
As in the past, a larger share of new EI sickness claims were established by women (56.3%) than men (43.7%). However, both men and women recorded annual increases in the number of sickness claims of +9.7% and +8.0%, respectively.
Claimants aged 25 to 44 years old established the largest share of new sickness claims in FY1718. Relative to their representation in the national workforce, people aged 24 years old and under were underrepresented among claimants having established sickness claims, while people aged 55 years old and over were overrepresented (see Chart 35).Footnote 85
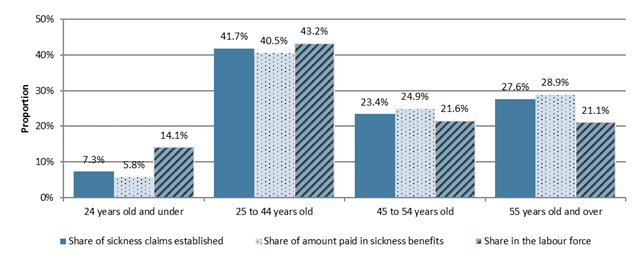
Chart 35 – Text version
| Share of sickness claims established | Share of amount paid in sickness benefits | Share in the labour force | |
|---|---|---|---|
| 24 years old and under | 7.3% | 5.8% | 14.1% |
| 25 to 44 years old | 41.7% | 40.5% | 43.2% |
| 45 to 54 years old | 23.4% | 24.9% | 21.6% |
| 55 years old and over | 27.6% | 28.9% | 21.1% |
- Note: Includes claims for which at least $1 of EI sickness benefits was paid.
- Sources: Employment and Social Development Canada, Employment Insurance (EI) administrative data. Data are based on a 10% sample of EI administrative data. Statistics Canada, Labour Force Survey, CANSIM table 14-10-0017-01.
The total amount paid in sickness benefits went up 9.2% compared to the previous year to $1.7 billion during FY1718. The majority of provinces and territories, with the exception of Saskatchewan and Yukon, recorded an increase in their total amount paid in sickness benefits (see Table 49).
As with new claims, women received a slighter larger share of the amount paid in sickness benefits than men, 53.4% and 46.6%, respectively. Women also experienced a bigger annual increase in the amount received than men.
In terms of age, the results observed are similar to those regarding the number of claims. Claimants aged 55 years old and over received a larger share of the total amount of payments for sickness benefits than their weight in the labour force, while claimants aged 24 years old and younger received a smaller share (see Chart 35).
By industry, the goods-producing industries were overrepresented among EI sickness claims and total benefits paid as they accounted for 26.7% of new EI sickness claims and 28.3% of sickness benefits paid while they represented 21.1% of workers (see Table 50).
| Industry | Number of claims ‘000s (Percentage share) |
Amount paid ($ millions) (Percentage share) |
Employment ‘000s (Percentage share) |
|---|---|---|---|
| Goods-producing industries | 110.0 (26.7%) |
$484.7 (28.3%) |
3,904.0 (21.1%) |
| Agriculture, forestry, fishing, hunting, mining and oil and gas extraction | 16.8 (4.1%) |
$75.0 (4.4%) |
610.7 (3.3%) |
| Utilities | 0.5 (0.1%) |
$2.6 (0.2%) |
132.4 (0.7%) |
| Construction | 41.6 (10.1%) |
$193.9 (11.3%) |
1,420.0 (7.7%) |
| Manufacturing | 51.1 (12.4%) |
$213.1 (12.4%) |
1,741.0 (9.4%) |
| Services-producing industries | 291.7 (70.8%) |
$1,191.7 (69.9%) |
14,583.6 (78.9%) |
| Wholesale and retail trade | 67.9 (16.5%) |
$249.6 (14.6%) |
2,819.2 (15.2%) |
| Transportation and warehousing | 22.4 (5.4%) |
$106.5 (6.2%) |
955.6 (5.2%) |
| Finance, insurance, real estate, rental and leasing | 12.9 (3.1%) |
$57.3 (3.3%) |
1,172.1 (6.3%) |
| Professional, scientific and technical services | 12.0 (2.9%) |
$51.8 (3.0%) |
1,454.6 (7.9%) |
| Business, building and other support services* | 30.3 (7.4%) |
$121.8 (7.1%) |
756.2 (4.1%) |
| Educational services | 11.6 (2.8%) |
$44.8 (2.6%) |
1,289.9 (7.0%) |
| Health care and social assistance | 50.7 (12.3%) |
$222.0 (13.0%) |
2,389.2 (12.9%) |
| Information, culture and recreation** | 8.5 (2.1%) |
$35.2 (2.1%) |
789.8 (4.3%) |
| Accommodation and food services | 31.9 (7.7%) |
$104.6 (6.1%) |
1,212.2 (6.6%) |
| Other services (excluding public administration) | 16.5 (4.0%) |
$65.7 (3.8%) |
786.0 (4.3%) |
| Public administration | 27.2 (6.6%) |
$132.4 (7.7%) |
958.9 (5.2%) |
| Unclassified | 10.1 (2.5%) |
$35.7 (2.1%) |
N/A |
| Canada | 411.9 (100.0%) |
$1,712.0 (100.0%) |
18,487.7 (100.0%) |
- Note: Data may not add up to the total due to rounding. Percentage shares are based on unrounded numbers. Includes claims for which at least $1 of EI sickness benefits was paid.
- * Includes management of companies and enterprises and administrative and support, waste management and remediation services.
- ** Includes information and cultural industries and arts, entertainment and recreation industries.
- Sources: Employment and Social Development Canada, Employment Insurance (EI) administrative data. Data are based on a 10% sample of EI administrative data. Statistics Canada, Labour Force Survey, table 14-10-0022-01 (for employment).
The average weekly sickness benefit rate was $426 in FY1718, a 2.3% increase compared to the previous year. A little more than a third (34.7%) of claimants received the maximum weekly benefit rate, which represented an increase of 1.7 percentage points compared to FY1617. On average, the highest weekly sickness benefit rate was paid for claims established in Nunavut ($520), by men ($464), and by claimants aged between 45 and 54 years old ($439).
Duration of Employment Insurance sickness benefits
A maximum of 15 weeks of EI sickness benefits may be paid to qualified individuals because of illness, injury or quarantine, though this number could be less depending on their physician’s recommendation.
The actual average duration of sickness benefits completed during FY1718 remained similar to past fiscal years with 9.8 weeks. On average, men and women received 9.5 and 10.1 weeks of sickness benefits, respectively.
As in the past, the average number of weeks of sickness benefits paid increased with the age of claimants. Claimants aged 24 years old and under experienced, on average, the shortest duration (9.0 weeks), while those aged 55 years old and over registered the longest duration (10.4 weeks of benefits).
A little more than a third (35.5%) of completed sickness claims in FY1718 had used the maximum number of 15 weeks of sickness benefits, which is a similar proportion as the years before. Women (36.8%) were more likely to use the maximum number of weeks than men (33.9%).
The use of all 15 weeks of benefits available also appears to be correlated with the age of claimants, going from 26.7% for claimants aged 24 years old and under to 40.6% for claimants aged 55 years and older over the reporting period (see Table 51).
| Age category | FY1314 | FY1415 | FY1516 | FY1617r | FY1718p |
|---|---|---|---|---|---|
| 24 years old and under | 25.3% | 29.4% | 27.0% | 28.2% | 26.7% |
| 25 to 44 years old | 31.9% | 32.6% | 32.8% | 32.2% | 32.1% |
| 45 to 54 years old | 38.8% | 38.2% | 37.6% | 38.9% | 38.4% |
| 55 years old and over | 41.7% | 41.7% | 41.9% | 42.7% | 40.6% |
| Canada | 35.6% | 36.1% | 35.9% | 36.3% | 35.5% |
- Note: Includes all claims for which at least $1 in EI sickness benefits was paid. Completed claims include those that are terminated and those that are dormant and remained inactive as of August the following fiscal year.
- p Preliminary data.
- r Revised data.
- Source: Employment and Social Development Canada, Employment Insurance (EI) administrative data. Data are based on a 10% sample of EI administrative data.
Duration of Employment Insurance sickness benefits after benefiting from a short-term disability plan offered by the employer
A recent departmental study* compared the characteristics of EI sickness claims established by people who benefited from a short-term disability plan offered by the employer (recognized by the Premium Reduction Program) before turning to EI sickness benefits with people who turned directly to EI sickness benefits.
The study showed that claimants for whom the EI program was the second payer were proportionally more likely to use the maximum 15-week period provided for EI sickness benefits than those who received only EI sickness benefits (39.7% compared to 32.0%, on average, for the period between 2000 and 2015).
Given that claimants who were covered by a plan offered by their employer had to use all their short-term disability insurance benefits before establishing an EI sickness claim, it appears that those claimants who used all 15 weeks of benefits were more likely to have severe medical issues that require longer recovery time.
* ESDC, Enhance Understanding of the Use of the Premium Reduction Program. (Ottawa : ESDC, Evaluation Directorate, 2019)
2.6.4 Employment Insurance compassionate care benefits
EI compassionate care benefits offer temporary income support for up to 26 weeks to eligible claimants who need to take time away from work to provide care or support to family members who have a serious medical condition with a significant risk of death within 26 weeks.Footnote 87 The benefits may be paid to one caregiver or shared between caregivers, and only one of them needs to serve the waiting period.
To be eligible for EI compassionate care benefits, claimants need to meet the eligibility requirements for EI special benefits in terms of hours of insurable of employment or earnings (see section 2.6) and must submit a medical certificate issued by the family member’s medical doctor or nurse practitioner to the Commission.Footnote 88
Compassionate care recipients
A supplemental study* using data on compassionate care applicants during FY1516 showed that 58.1% of people filed a claim to take care of a parent, 27.5% a common-law partner or spouse, 4.3% a brother or sister, 3.5% a child, and 6.6% another type of recipient. According to the same study, the number of compassionate care claims increased with the care recipient’s age. In 16.9% of cases, applicants who filed a claim did so to take care of a recipient aged between 18 and 54 years old, while in 34.8% of cases, applicants wanted to take care of a recipient aged 75 years and older.
* ESDC, Compassionate Care Benefits: Update (2004/2005 to 2015/2016). (Ottawa: ESDC, Evaluation Directorate, 2018).
Employment Insurance compassionate care claims, amount paid and level of benefits
Over FY1718, there were 11,010 new claims established for compassionate care benefits, which represented an 8.0% increase over the previous year. This annual change was smaller than those recorded in FY1516 and FY1617 (26.1% and 29.5%, respectively), which correspond to the period where the maximum number of weeks of payable compassionate care benefits rose from 6 to 26 weeks.
Less than one out of ten claims established in FY1718 had weeks of benefits that were shared among qualifying caregivers (6.9%). This proportion remained stable compared to FY1617 (6.4%).
All regions, except Nova Scotia, experienced a boost in the number of claims for compassionate care benefits over the reporting period (see Table 52). Both men and women recorded increases, although men experienced the largest percentage change. However, women continued to establish the majority of compassionate care claims (71.7%) relative to men (28.3%).
| Number of claims | Amount paid ($ millions) | |||||
|---|---|---|---|---|---|---|
| FY1617 | FY1718 | Change (%) | FY1617 | FY1718 | Change (%) | |
| Region | ||||||
| Newfoundland and Labrador | 106 | 129 | +21.7% | $0.6 | $0.8 | +29.1% |
| Prince Edward Island | 55 | 66 | +20.0% | $0.3 | $0.4 | +13.8% |
| Nova Scotia | 367 | 351 | -4.4% | $2.1 | $2.0 | -2.2% |
| New Brunswick | 245 | 283 | +15.5% | $1.4 | $1.5 | +5.6% |
| Quebec | 1,759 | 1,808 | +2.8% | $7.7 | $8.5 | +11.6% |
| Ontario | 4,452 | 4,966 | +11.5% | $23.0 | $27.3 | +18.9% |
| Manitoba | 391 | 397 | +1.5% | $2.2 | $2.2 | +2.8% |
| Saskatchewan | 258 | 284 | +10.1% | $1.7 | $1.8 | +5.8% |
| Alberta | 1,002 | 1,032 | +3.0% | $6.1 | $6.7 | +8.9% |
| British Columbia | 1,523 | 1,658 | +8.9% | $8.8 | $9.5 | +8.1% |
| Territories | 35 | 36 | +2.9% | $0.2 | $0.3 | +15.0% |
| Gender | ||||||
| Men | 2,812 | 3,120 | +11.0% | $16.8 | $19.1 | +13.5% |
| Women | 7,381 | 7,890 | +6.9% | $37.3 | $42.0 | +12.5% |
| Age category | ||||||
| 24 years old and under | 176 | 167 | -5.1% | $0.7 | $0.8 | +6.1% |
| 25 to 44 years old | 3,259 | 3,494 | +7.2% | $17.0 | $18.9 | +11.1% |
| 45 to 54 years old | 3,461 | 3,641 | +5.2% | $18.5 | $20.5 | +10.8% |
| 55 years old and over | 3,297 | 3,708 | +12.5% | $17.9 | $21.0 | +16.9% |
| Canada | 10,193 | 11,010 | +8.0% | $54.1 | $61.1 | +12.8% |
- Note: Data may not add up to the total due to rounding. Percentage change is based on unrounded numbers. Includes claims for which at least $1 of EI compassionate care benefits was paid.
- Source: Employment and Social Development Canada, Employment Insurance (EI) administrative data. Data are based on a 100% sample of EI administrative data.
By age group, individuals aged between 25 and 44 years old had established a smaller share of compassionate care claims (31.7%) than their relative weight in the Canadian labour forceFootnote 89 (43.2%). Conversely, people aged between 45 and 54 years old and those aged 55 years old and over had established a larger share of claims for compassionate care benefits (33.1% and 33.7% respectively) than their presence in the Canadian labour force (21.6% and 21.1% respectively).
The total amount paid in compassionate care benefits reached $61.1 million in FY1718, which is an increase of 12.8% compared to the previous reporting period.
As with new claims, the amounts paid in compassionate care benefits during FY1718 went up in all regions except Nova Scotia, and both men and women experienced an annual increase in their amounts received for compassionate care benefits (see Table 52). Furthermore, women received two thirds (68.7%) of the total amount of compassionate care benefits paid.
Claimants aged between 25 and 44 years old received a smaller share of the amount paid in compassionate care benefits than their demographic weight in the Canadian labour force: 30.9% of all benefits paid versus 43.2% of the labour force. Conversely, claimants aged between 45 and 54 years old and those aged 55 years old and over received 33.5% and 34.3% of the total amount of payments for compassionate care benefits, while they represent 21.6% and 21.1% of the labour force respectively. All age groups recorded a hike in the amounts received compared to the previous year.
The average weekly benefit rate for compassionate care benefits grew by 2.3% to $454 during the reporting period. A little less than half (45.3%) of claimants received the maximum weekly benefit rate. On average, the highest weekly benefit rate for compassionate care benefits was paid for claims established in the Territories ($521), by men ($488), and by claimants aged between 25 and 44 years old ($466).
Duration of Employment Insurance compassionate care benefits
The average duration of EI compassionate care claims completed in FY1718 was 12.0 weeks, which is higher than the average duration recorded in FY1617, and marks a significant increase compared to previous fiscal years (see Table 53). This change can be attributed, in particular, to the growth in the maximum number of weeks of compassionate care benefits available since January 3, 2016.
| Duration | FY1314 | FY1415 | FY1516 | FY1617 | FY1718p |
|---|---|---|---|---|---|
| Share in percentage of compassionate care claims using : | |||||
| 6 weeks of benefits or more | 57.6%r | 57.4%r | 54.8%r | 64.5%r | 65.1% |
| 26 weeks of benefits | N/A | N/A | N/A | 13.8%r | 20.0% |
| Average duration (weeks) | 4.7 | 4.7 | 4.6r | 9.8r | 12.0 |
- Note: Includes claims for which at least $1 of EI compassionate care benefits was paid. Completed claims include those that are terminated and those that are dormant and remained inactive as of August the following fiscal year.
- p Preliminary data.
- r Revised data.
- Source: Employment and Social Development Canada, Employment Insurance (EI) administrative data. Data are based on a 100% sample of EI administrative data.
Men and women received, on average, a similar number of weeks of compassionate care benefits for claims completed during FY1718 (12.1 and 11.9 weeks, respectively). Over the same period, claimants aged 44 years old and under received, on average, close to 11 weeks of compassionate care benefits, while claimants aged 55 years old and over received an average of 13 weeks.
Among compassionate care claims completed in FY1718, 65.1% used six weeks of benefits or more. This proportion, which is slightly higher than those recorded over previous years (see Table 53), appears to show that despite an increase in the maximum number of weeks of compassionate care benefits available since January 3, 2016, a large share of claims did not receive any extra available weeks, which may in part be due to the death of a care recipient. In total, 20.0% of completed compassionate care claims received the maximum number of 26 weeks of benefits during FY1718, an increase relative to FY1617 (13.8%).
A departmental studyFootnote 90 updating research results on the use and duration of compassionate care benefits confirmed that the death of a care recipient is one of the main reasons for not receiving or claiming the maximum number of weeks of benefits. Moreover, claimants who took care of their spouse or lived with the care recipient are most likely to use the entire benefit entitlement.
Similar proportions of men and women used six weeks or more of compassionate care benefits, as well as all the 26 weeks of benefits, among the claims completed during the reporting fiscal year. However, claimants aged 55 years old and over were more likely to receive six weeks or more of compassionate care benefits (67.8%) than claimants aged 24 years old and under (61.8%). They were also more likely to use the total 26 weeks of compassionate care benefits than claimants aged 24 years old and under (22.8% versus 17.9%).
2.6.5 Employment Insurance family caregiver benefit for adults
EI family caregiver benefits for adults were announced in Budget 2017 and came into effect on December 3, 2017. They are offered to any eligible person who must take temporary leave from work to provide care or support to a family member aged 18 or older who is suffering from a severe illness or injury. Family caregivers can obtain up to 15 weeks of benefits, which may be shared among eligible family members or other eligible people who are considered members of the family.
To be eligible for the family caregiver benefit for adults, claimants need to meet the eligibility requirements for EI special benefits in terms of hours of insurable of employment or earnings (see section 2.6) and must submit to the Commission a medical certificate issued by the medical doctor or nurse practitioner of the family member who is critically ill or injured.
Employment Insurance claims for family caregiver benefits for adults, amount paid and level of benefits
More than 2,600 claims were established for family caregiver benefits for adults between December 3, 2017, and March 31, 2018. Women established over two thirds of these claims (69.1%) (see Table 54). In terms of age, people aged 44 years old and under accounted for 28.5% of claims established for family caregiver benefits for adults, while 40.0% of claims for those benefits were established by people aged 55 years old and over.
| Number of claims | Amount paid ($ thousand) | |
|---|---|---|
| Region | ||
| Newfoundland and Labrador | 49 | $134.1 |
| Prince Edward Island | 18 | $47.4 |
| Nova Scotia | 68 | $179.8 |
| New Brunswick | 67 | $210.9 |
| Quebec | 505 | $1,466.3 |
| Ontario | 1,199 | $3,487.7 |
| Manitoba | 82 | $235.6 |
| Saskatchewan | 61 | $181.1 |
| Alberta | 221 | $693.4 |
| British Columbia and Territories | 338 | $988.0 |
| Unknown | 27 | $37.0 |
| Gender | ||
| Men | 815 | $2,647.4 |
| Women | 1,820 | $5,013.9 |
| Age category | ||
| 24 years old and under | 36 | $76.1 |
| 25 to 44 years old | 714 | $2,124.4 |
| 45 to 54 years old | 830 | $2,438.6 |
| 55 years old and over | 1,055 | $3,022.3 |
| Canada | 2,635 | $7,661.3 |
- Note: Data may not add up to the total due to rounding. Includes claims for which at least $1 of EI family caregiver benefits for adults was paid.
- Source: Employment and Social Development Canada, Employment Insurance (EI) administrative data. Data are based on a 100% sample of EI administrative data.
During the period of FY1718 in which benefits for family caregivers for adults were available, the amount paid out for those benefits totalled $7.7 million. Similar to what was observed with regards to the number of claims established, women and claimants aged 55 years old and over received a larger share of the benefits paid out compared to men and claimants in other age groups.
The average weekly benefit rate for family caregiver benefits for adults was $447. On average, the highest weekly benefit rate was paid for claims established by men ($491) and by claimants aged between 25 and 44 years old ($471).
Duration of Employment Insurance family caregiver benefits for adults
Given the short period during which benefits for family caregivers for adults were offered in FY1718, few claims were completed. Consequently, the statistics on the duration of claims for family caregiver benefits for adults are not shown.
2.6.6 Employment Insurance family caregiver benefits for children
The EI family caregiver benefit for childrenFootnote 91 offers temporary income support for a maximum period of 35 weeks to eligible workers and self-employed persons who take a leave from work to provide care for or support to a critically ill or injured child. Benefits can be shared between caregiversFootnote 92, who may receive them simultaneously or separately, up to the maximum number of weeks of eligibility.
To receive the family caregiver benefit for children, claimants need to meet the eligibility requirements for EI special benefits in terms of hours of insurable employment or earnings (see section 2.6) and provide to the Commission a medical certificate signed by the medical doctor or nurse practitioner of the critically ill or injured child.Footnote 93 To be considered critically ill, a child’s life must be at risk as a result of illness or injury, there must have been a significant change in the child’s baseline state of health and the child must require the care or support of his/her parent(s).
Employment Insurance claims for family caregiver benefits for children, amount paid and level of benefits
The number of new claims established for family caregiver benefits for children grew by 15.7% compared with the previous year, to 4,900 claims in FY1718. Most regions, except Prince Edward Island, Quebec and the Territories registered an increase in their number of claims over the reporting period (see Table 55).
| Number of claims | Amount paid ($ millions) | |||||
|---|---|---|---|---|---|---|
| FY1617 | FY1718 | Change (%) | FY1617r | FY1718 | Change (%) | |
| Region | ||||||
| Newfoundland and Labrador | 44r | 65 | +47.7% | $0.4r | $0.4 | +22.0% |
| Prince Edward Island | 22 | 18 | -18.2% | $0.1 | $0.1 | -3.6% |
| Nova Scotia | 86r | 93 | +8.1% | $0.6 | $0.5 | -5.5% |
| New Brunswick | 92r | 96 | +4.3% | $0.5 | $0.5 | +2.9% |
| Quebec | 889r | 882 | -0.8% | $5.5 | $5.8 | +4.3% |
| Ontario | 1,570r | 1,936 | +23.3% | $10.0r | $12.0 | +19.9% |
| Manitoba | 158r | 181 | +14.6% | $1.0 | $1.1 | +14.0% |
| Saskatchewan | 153 | 200 | +30.7% | $0.9 | $1.2 | +26.0% |
| Alberta | 613r | 747 | +21.9% | $4.3r | $4.8 | +12.4% |
| British Columbia | 553r | 633 | +14.5% | $3.1 | $3.7 | +21.0% |
| Territories | 16r | 12 | -25.0% | $0.1 | $0.1 | -42.5% |
| Unknown | 42 | 40 | -4.8% | $0.1 | $0.1 | +2.1% |
| Gender | ||||||
| Men | 818 | 1,007 | +23.1% | $5.3 | $6.3 | +20.0% |
| Women | 3,420r | 3,896 | +13.9% | $21.3r | $24.0 | +12.9% |
| Age category | ||||||
| 24 years old and under | 225r | 255 | +13.3% | $1.1 | $1.3 | +23.1% |
| 25 to 44 years old | 3,766r | 4,268 | +13.3% | $23.3 | $25.9 | +11.1% |
| 45 to 54 years old | 227r | 340 | +49.8 % | $2.0 | $2.8 | +37.7% |
| 55 years old and over | 20 | 40 | +100.0% | $0.1 | $0.3 | +145.0% |
| Canada | 4,238r | 4,903 | +15.7% | $26.6r | $30.3 | +14.3% |
- Note: Data may not add up to the total due to rounding. Percentage change is based on unrounded numbers. Includes claims for which at least $1 of EI family caregiver benefits for children was paid.
- r Revised data.
- Source: Employment and Social Development Canada, Employment Insurance (EI) administrative data. Data are based on a 100% sample of EI administrative data.
More claims for family caregiver benefits for children were established by women (79.5%) than men (20.5%). Yet, men and women alike recorded an annual increase in the number of new claims.
By age, claimants aged between 25 and 44 years old established the largest share of new claims for family caregiver benefits for children (87.0%), while those aged 24 years old and under and those aged 45 years old and over represented 5.2% and 7.8% of new claims respectively.
The amount paid in family caregiver benefits for children reached $30.3 million during the reporting period, which is an increase of 14.3% compared to the previous fiscal year. As with established claims, women received most of the benefits paid (79.2%), while by age, claimants aged between 25 and 44 years old received the majority of benefits paid for this type of benefit (85.4%)
The average weekly benefit rate paid to family caregivers for children was $457 for FY1718, which represents a growth of 2.5% compared to the previous year. On average, the highest weekly benefit rate was paid for claims established by men ($494) and for claimants aged between 45 to 54 years old ($466).
Duration of Employment Insurance family caregiver benefits for children
Under the family caregiver benefits for children, claimants are provided with up to 35 weeks of benefits that can be shared among eligible caregivers and split into segments over a claimant’s 52-week benefit period.
Individuals receiving family caregiver benefits for children used, on average, 16.7 weeks of benefits over the reporting period, a decrease of 0.6 weeks compared to FY1617. On average, women received more weeks of benefits than men, 18.4 weeks compared to 13.8 weeks respectively. The average number of weeks used was higher for claimants aged between 45 and 54 years old (20.0 weeks) and for those aged 55 years old and over (19.2 weeks).
2.6.7 Employment Insurance special benefits for self-employed persons
Self-employed persons may make a claim for EI special benefits after signing up for the EI Program. The special benefits available to self-employed persons are the same as those offered to salaried employees.
To be eligible for EI special benefits for self-employed persons, an individual must:
- register with the Canada Employment Insurance Commission (CEIC);
- wait for 12 months from the date of his or her confirmed registration before claiming EI special benefits;Footnote 94
- have reduced the amount of time devoted to his or her business by more than 40%;
- have earned the minimum number of self-employed earnings during the calendar year preceding the year he or she applies for benefits;
- pay EI premiums at the same rate as salaried employees for at least one year before he or she may claim benefits; and
- meet the eligibility criteria specific to the special benefits being claimed.Footnote 95
During FY1718, there were 1,900 additional self-employed persons who entered into a voluntary agreement with the CEIC in order to be eligible for EI special benefits, bringing the total number of self-employed persons who are enrolled in the EI Program to almost 21,200 participants. This represents a growth of 9.7% compared to the previous year (see Table 56).
Number of workers |
FY1314 |
FY1415 |
FY1516 |
FY1617 |
FY1718 |
|---|---|---|---|---|---|
Net enrolments |
1,530 |
1,448 |
1,704 |
1,820 |
1,874 |
New participants to the program (opted in) |
2,063 |
1,946 |
2,338 |
2,547 |
2,475 |
Registrants who cancelled or terminated participation (opted out) |
-533 |
-498 |
-634 |
-727 |
-601 |
Cumulative total, at the end of the fiscal year |
14,394 | 15,842 | 17,546 | 19,366 | 21,240 |
- Source: Employment and Social Development Canada, Service Canada administrative data, 100% sample.
A recent studyFootnote 96 by the Department compared self-employed persons who do not participate in the EI program to participants. It revealed that, on average at the time of registration, participants were younger and more often women, reported lower net incomes from self-employment and more of them declared income from paid employment, which may indicate that they were in transition to self-employment. However, when a claim is established, only 3 out of 10 self-employed persons reported any income from paid employment in the year before their claim. According to the same study, self-employed claimants started receiving benefits, on average, about 1.5 years (82 weeks) after registration.
Self-employed participants to the EI program who also have paid employment earnings have the choice to apply for EI special benefits as self-employed persons or as insured claimants (if they have paid EI premiums through their paid employment). If they claim benefits under the former, their benefits would be calculated on the basis of both self-employment and paid employment income, whereas for the latter, only earnings from employment would be taken into account. If they receive benefits under the self-employed scheme, they would have to pay premiums on their self-employment earnings for the rest of their working life.
Example: Self-employed participants with some employment income
Before being laid off, Terry worked as an electrician at a large pulp and paper mill in Corner Brook, Newfoundland. Terry decided to start his own company. He earns approximately $32,000 a year from his company, while working on call at the paper mill for about $10,000 a year.
Terry worries about being unable to work for a period of time due to an illness or injury. He decides to opt in to the EI program to be able in future to access benefits for self-employed.
If Terry suffers an injury and applies and qualifies for sickness benefits as a self-employed person, assuming he paid premiums for at least one year before making a claim, he would be eligible to receive about $444 per week in sickness benefits for up to 15 weeks (based on the aggregate of his self-employment and insurable employment income).
Employment Insurance special benefits for self-employed persons, claims, amount paid and level of benefits
A total of 746 special benefit claims were established by self-employed persons in FY1718, a 0.4% decrease compared with the previous fiscal year. The benefit types most frequently received by self-employed EI claimants were maternity benefits and parental benefits (see Table 57).
| Number of claims | Amount paid ($ millions) | |||||
|---|---|---|---|---|---|---|
| FY1617 | FY1718 | Change (%) | FY1617 | FY1718 | Change (%) | |
| Type of benefit | ||||||
| Maternity | 579 | 566 | -2.2% | $2.5 | $2.9 | +16.9% |
| Parental | 578 | 598 | +3.5% | $4.7 | $6.3 | +34.3% |
| Other EI special benefits | 156 | 167 | +7.1% | $0.5 | $0.6 | +19.1% |
| Region | ||||||
| Atlantic | 55 | 40 | -27.3% | $0.6 | $0.7 | +5.9% |
| Quebec | 24 | 29 | +20.8% | $0.1 | $0.1 | -12.6% |
| Ontario | 328 | 340 | +3.7% | $3.3 | $4.8 | +43.7% |
| Prairies | 156 | 161 | +3.2% | $2.3 | $2.3 | -0.5% |
| British Columbia and the Territories | 186 | 176 | -5.4% | $1.3 | $2.0 | +50.5% |
| Gender | ||||||
| Men | 25 | 26 | +4.0% | $0.2 | $0.2 | +35.3% |
| Women | 724 | 720 | -0.6% | $7.5 | $9.6 | +27.6% |
| Age category | ||||||
| 29 years old and under | 143 | 123 | -14.0% | $1.5 | $1.4 | -4.5% |
| 30 to 39 years old | 522 | 526 | +0.8% | $5.4 | $7.4 | +37.0% |
| 40 years old and over | 84 | 97 | +15.5% | $0.8 | $0.9 | +24.7% |
| Canada | 749 | 746 | -0.4% | $7.7 | $9.8 | +27.7% |
- Note: Data may not add up to the total due to rounding. Percentage change is based on unrounded numbers. Includes all claims to self-employed persons for which at least $1 in EI special benefits was paid. New claims established by benefit type may not sum as claimants can receive multiple benefit types on a single claim.
- Source: Employment and Social Development Canada, Employment Insurance (EI) administrative data. Data are based on a 100% sample of EI administrative data.
Ontario is the region that established the largest number of claims in FY1718. Similarly to Quebec and the Prairies, it also recorded an increase in the number of claims established by self-employed persons. Quebec’s under-representation in terms of new claims established (3.9%) reflects the fact that the province offers maternity, parental, adoption, and paternity benefits outside the EI program with mandatory participation of self-employed persons (see subsection 2.6.2).
As in the past, women made up the vast majority (96.5%) of new claims established for self-employed persons. By age, claimants between 30 and 39 years old accounted for the largest share of new claims (70.5%). However, claimants aged 40 years old and over saw the largest increase in new claims compared to FY1617. Claimants aged 29 years old and younger, for their part, saw a decrease in the number of claims established over the same period.
The total amount paid in EI special benefits to self-employed persons reached $9.8 million for the reporting period. This is a 27.7% increase compared to last fiscal year which is partly due to the rise of payments in parental benefits. These benefits represented 64.4% of the total special benefits received by self-employed persons, while maternity benefits accounted for 29.4% (see Table 57).
Ontario also contributed significantly to the increase in EI special benefits for self-employed persons, posting an increase of 43.7% compared to FY1617. The Atlantic provinces as well as British Columbia and the Territories recorded an increase in their respective amount paid, while Quebec and the Prairies saw a drop.
As observed with claims, women received the largest share of the total special benefits paid to self-employed persons. Both men and women saw an annual increase in their total amount received in benefits, 35.3% and 27.6% respectively.
Persons aged between 30 and 39 years old and those aged 40 years old and over posted an increase in special benefits paid for self-employed workers in comparison to the previous fiscal year, whereas those aged 29 years old and under experienced a decrease in benefits paid.
The average weekly benefit rateFootnote 97 for special benefits paid to self-employed persons increased by 0.8% to $337 per claim. On average, the highest weekly benefit rate was for claims established in British Columbia and the Territories ($347), by men ($358), and by claimants aged between 30 and 39 years old ($347).