
Land-based greenhouse gas emissions and removals
Greenhouse gas (GHG) emissions are the major drivers of climate change. Land use activities (such as timber harvesting and land conversion) as well as natural disturbances (such as forest fires and insect infestations) result in GHG emissions. Land use activities can also result in GHG removals. For example, as forests grow or recover, carbon is removed from the atmosphere and converted into biomass by trees. Tracking the trends in Canada's land-based GHG emissions and removals can help us understand how land management decisions could reduce emissions and increase removals over time.
The indicator provides annual estimates of Canada's GHG emissions and removals from managed lands. These are lands influenced by human intervention to perform production, ecological or social functions. Examples include agricultural land, wetlands, settlements, and managed forests.
National
National land-based greenhouse gas emissions and removals
Key results
- In 2023,
- Natural disturbances accounted for net emissions of about 1,100 megatonnes of carbon dioxide equivalent (Mt CO2 eq)
- Human activities accounted for net emissions of 4.6 Mt CO2 eq
- Between 1990 to 2001, estimates of land-based GHGs showed more removals than emissions in all years except for 1995 (net emissions of 150 Mt CO2 eq), 1998 (net emissions of 150 Mt CO2 eq) and 1999 (net emissions of 14 Mt CO2 eq)
- Since 2002, estimates show more emissions than removals, with net emissions ranging between 28 Mt CO2 eq and 1,100 Mt CO2 eq, driven mainly by wildfire emissions
National land-based greenhouse gas emissions and removals, Canada, 1990 to 2023

Data table for the long description
| Year | Natural disturbances (megatonnes of carbon dioxide equivalent) |
Human activities (megatonnes of carbon dioxide equivalent) |
Net exchange (megatonnes of carbon dioxide equivalent) |
|---|---|---|---|
| 1990 | -120 | 51 | -71 |
| 1991 | -84 | 46 | -38 |
| 1992 | -130 | 57 | -77 |
| 1993 | -86 | 69 | -17 |
| 1994 | -81 | 56 | -25 |
| 1995 | 87 | 65 | 150 |
| 1996 | -69 | 56 | -13 |
| 1997 | -110 | 53 | -60 |
| 1998 | 100 | 45 | 150 |
| 1999 | -36 | 50 | 14 |
| 2000 | -100 | 55 | -45 |
| 2001 | -65 | 38 | -27 |
| 2002 | 50 | 69 | 120 |
| 2003 | 25 | 66 | 91 |
| 2004 | 94 | 64 | 160 |
| 2005 | 12 | 67 | 79 |
| 2006 | 44 | 49 | 93 |
| 2007 | 46 | 46 | 92 |
| 2008 | 0.31 | 41 | 42 |
| 2009 | 31 | 12 | 43 |
| 2010 | 89 | 41 | 130 |
| 2011 | 120 | 45 | 160 |
| 2012 | 94 | 30 | 120 |
| 2013 | 27 | 32 | 59 |
| 2014 | 150 | 8.7 | 160 |
| 2015 | 250 | 46 | 290 |
| 2016 | 95 | 30 | 120 |
| 2017 | 220 | 22 | 240 |
| 2018 | 250 | 25 | 270 |
| 2019 | 160 | 15 | 180 |
| 2020 | 2.7 | 26 | 28 |
| 2021 | 290 | 15 | 310 |
| 2022 | 87 | 51 | 140 |
| 2023 | 1,100 | 4.6 | 1,100 |
Download data file (Excel/CSV; 1.91 kB)
Note: Data are accurate to 2 significant figures in accordance with Part III Annex 8 of the National Inventory Report. Net exchange is calculated by subtracting removals from emissions.
How this indicator was calculated
Note: Natural disturbances refer to emissions and removals related to wildfires and large insect infestations of the forest. Human activities refer to emissions and removals from managed lands (such as settlements, forested lands, agricultural land and wetlands) as well as transfers to harvested wood products. For more information, see the section on emissions and removals from human activities.
Source: Environment and Climate Change Canada (2025) National Inventory Report 1990-2023: Greenhouse gas sources and sinks in Canada.
Natural disturbances, such as forest fires and large insect infestations, have occurred in Canada's forests for thousands of years. These disturbances are part of the natural life cycle of the forest and generally help the forest renew itself. However, evidence demonstrates that climate change is driving an increase in natural disturbances. These disturbances can contribute to emissions of large amounts of GHGs into the atmosphere through the burning and decay of dead trees, as well as significant removals as the forest regenerates over time.Footnote 1
For the past 20 years, the total managed forest’s net GHG exchange (that is, the land-based GHG emissions minus removals) has been significantly impacted by these natural disturbances. In 2002, the net exchange shifted from removals to emissions as a result of an increase in emissions from natural disturbances.
In managed forests, emissions and removals due to natural disturbances are associated with human activities under specific circumstances. These circumstances are described in the methods section.
Human activities
Land-based GHG emissions and removals from human activities
Land-based GHG emissions and removals from human activities are commonly referred to as land use, land-use change and forestry (LULUCF) according to international standards.
Key results
- In 2023,
- most of the categories of land use activities emitted GHGs, with the forest sector being the largest emitter (19 megatonnes of carbon dioxide equivalent [Mt CO2 eq])
- agricultural land recorded the largest removals of GHGs (22 Mt CO2 eq)
- Between 1990 and 2023, human activities on managed lands resulted in net emissions for all years, ranging between 4.6 Mt CO2 eq and 69 Mt CO2 eq
- Human activities accounted for net emissions of 4.6 Mt CO2 eq in 2023, which is lower than the level observed in 1990 (51 Mt CO2)
Land-based greenhouse gas emissions and removals from human activities by activity sector, Canada, 1990 to 2023

Data table for the long description
| Year | Forest sector (megatonnes of carbon dioxide equivalent) |
Agricultural land (megatonnes of carbon dioxide equivalent) |
Wetlands (megatonnes of carbon dioxide equivalent) |
Settlements (megatonnes of carbon dioxide equivalent) |
Net exchange (megatonnes of carbon dioxide equivalent) |
|---|---|---|---|---|---|
| 1990 | 35 | 5.8 | 5.2 | 4.9 | 51 |
| 1991 | 37 | -1.3 | 5 | 5 | 46 |
| 1992 | 47 | 0.78 | 4.9 | 4.6 | 57 |
| 1993 | 52 | 7.9 | 5.2 | 4.2 | 69 |
| 1994 | 54 | -5.2 | 2.9 | 4.3 | 56 |
| 1995 | 65 | -6.2 | 2.9 | 3.7 | 65 |
| 1996 | 54 | -4.8 | 2.8 | 4.2 | 56 |
| 1997 | 54 | -8.6 | 2.8 | 4.2 | 53 |
| 1998 | 42 | -4.6 | 3.1 | 4.3 | 45 |
| 1999 | 54 | -12 | 3.3 | 4.6 | 50 |
| 2000 | 63 | -15 | 2.7 | 4.6 | 55 |
| 2001 | 40 | -9.8 | 2.7 | 4.4 | 38 |
| 2002 | 54 | 7.8 | 2.6 | 4.8 | 69 |
| 2003 | 48 | 11 | 2.7 | 5.1 | 66 |
| 2004 | 76 | -20 | 2.8 | 5.4 | 64 |
| 2005 | 79 | -20 | 2.7 | 4.9 | 67 |
| 2006 | 63 | -23 | 2.9 | 5.4 | 49 |
| 2007 | 55 | -17 | 2.9 | 5.4 | 46 |
| 2008 | 51 | -18 | 3 | 5.4 | 41 |
| 2009 | 39 | -34 | 2.9 | 4.7 | 12 |
| 2010 | 54 | -20 | 2.8 | 4.5 | 41 |
| 2011 | 49 | -12 | 2.8 | 5.2 | 45 |
| 2012 | 43 | -21 | 2.8 | 5.2 | 30 |
| 2013 | 45 | -22 | 3.1 | 6.1 | 32 |
| 2014 | 41 | -42 | 3.1 | 6.1 | 8.7 |
| 2015 | 46 | -8.2 | 2.8 | 6.1 | 46 |
| 2016 | 36 | -15 | 2.9 | 5.7 | 30 |
| 2017 | 34 | -21 | 2.7 | 5.4 | 22 |
| 2018 | 36 | -20 | 2.5 | 5.5 | 25 |
| 2019 | 22 | -15 | 2.7 | 5.4 | 15 |
| 2020 | 30 | -13 | 2.9 | 5.4 | 26 |
| 2021 | 23 | -16 | 2.8 | 5.6 | 15 |
| 2022 | 18 | 25 | 2.6 | 5.3 | 51 |
| 2023 | 19 | -22 | 2.6 | 5.2 | 4.6 |
Download data file (Excel/CSV; 2.30 kB)
Note: Data are accurate to 2 significant figures in accordance with Part III Annex 8 of the National Inventory Report. Net exchange is calculated by subtracting removals from emissions.
How this indicator was calculated
Note: Greenhouse gas exchange from the forest sector considers emissions and removals from managed forests and transfers to and from the harvested wood products pool. Harvested wood products originate from forest trees with contributions of bioenergy from urban trees and agricultural land. As such, the reported forest sector emissions may differ at times from some information presented in the National Inventory Report. For more information, see Chapter 6.4 of the National Inventory Report.
Source: Environment and Climate Change Canada (2025) National Inventory Report 1990-2023: Greenhouse Gas Sources and Sinks in Canada.
Forest sector
The forest sector category refers to emissions and removals from forest management activities such as timber harvesting, thinning and replanting and ecological processes, such as tree growth and decomposition. It also includes transfers to and disposals from the harvested wood products pool, which are the wood materials removed from the harvested site and turned into consumer products, such as timber for construction, furniture or paper products. The carbon removed from the atmosphere by trees is stored in the harvested wood products and eventually emitted back into the atmosphere or transferred into the waste stream where the product is disposed.
In 2023, the human-driven GHG contribution from the forest sector was a net emission of 19 Mt CO2 eq. While overall forest growth typically removes carbon from the atmosphere, natural disturbances and decomposition can result in net emissions from forests. For example, in 2023, natural ongoing ecological processes in Canadian forests resulted in net emissions of 24 Mt CO2 eq. At the same time, 5 Mt CO2 eq. of carbon was stored in harvested wood products.
GHG contributions from the forest sector varied between 1990 and 2023, peaking at 79 Mt CO2 eq in 2005 and since, decreasing to 19 Mt CO2 eq in 2023. These variations are related to harvest rates over the past several decades, particularly in the Mountain and Boreal regions, and had also increased indirectly due to a rise in natural disturbances. Natural disturbances indirectly impact GHG emissions in the forest sector through the decomposition of trees killed by low-level insect disturbances and reducing the areas of commercially mature growing trees that remove carbon.
As forest harvest expanded in Canada, in the decades prior to 2005, increasing areas were converted to emissions sources. When forests are harvested, the sites act as emission sources over many years following the disturbance because of the decaying debris left on the site and the slow regrowth of woody biomass. Furthermore, large proportions of harvested wood were used for short-lived products (such as paper) where the carbon is rapidly transferred out of the harvested wood product pool to the waste stream or used for bioenergy. These emissions were not fully offset by the removals from the regrowth of the historically harvested areas.
Since 2004, the rate of area harvested in Canada has leveled off, and in recent years removals from the land that was historically harvested are increasing at a greater rate than the emissions resulting from new harvests. Forest carbon emissions peaked in 2005 and have since decreased. This decreasing trend in emissions happened as carbon stocks in solid wood products have continued to increase, while those in paper products have declined since 2005. Additionally, since the early 2000s, most wood waste has been used for bioenergy production (converting biomass to energy), reducing transfers of wood to solid waste disposal where it is a source of methane.
The forest industry and carbon
Canada’s forest industry is important and understanding how tree harvesting impacts emissions and removals of CO2 to and from the atmosphere supports better decision making. Harvesting is part of a larger set of forest management activities, such as, forest inventory and planning, planting, thinning, fire control, and pest management, which are carried out by provinces and territories applying sustainable practices. Because these activities are connected and part of the forest planning process, the effects of harvesting can’t be measured on their own. Instead, changes in forest carbon in the managed forests are tracked as a whole, according to international guidelines.
When trees are harvested, the existing dead material on the ground and new harvest residues break down, releasing carbon dioxide (CO₂). As trees grow back, the new tree growth removes little carbon at first, but removals increase over time. After a period of time, CO₂ removals resulting from tree growth equal and become greater than the emissions from the decomposing material and harvested sites become carbon sinks again.
The trees that are harvested contain carbon that becomes forest products such as building lumber and paper, but also produce wood waste. Carbon stored in wood products can stay locked away for decades, adding to a global supply of stored carbon. Waste wood is burned for energy in homes and industries, releasing the carbon stored in wood as an emission. Wood products and bioenergy also help reduce fossil emissions by replacing more carbon intensive materials like coal, oil, concrete, and steel.
The carbon in forests is cycled between the trees, the wood products, the soil and the atmosphere. While the harvested forest regrows, it absorbs and stores carbon. When wood products reach the end of their use, whether short- or long-lasting, their carbon is reported as an emission.Footnote 2 Wood waste in landfills produces methane, a powerful GHG, but these emissions are counted in the Waste sector of the country where the wood products are buried. Since trees take in carbon from the air through photosynthesis, releasing it later doesn’t add new CO₂ like burning fossil fuels does.
Like many industries, forest harvesting and the transformation of harvested trees into forest products involves a wide range of activities that result in fossil fuel emissions that are reported in different parts of Canada’s National Inventory Report (NIR): Energy, Industry, and Waste. Where possible, the emissions from these activities are reported separately in Table 2–11 of the National GHG Inventory Report along with all emissions and changes in carbon associated with harvest. Fuel used by machines during tree harvesting is counted in the Energy-Transport sector. However, fuel used to transport the harvested wood away from the site isn’t reported because the fuel used specifically by transport trucks for wood transport cannot be isolated in national fuel-use data.
Agricultural land
The agricultural land category reports emissions and removals from annual and perennial cropland, as well as from forest lands and grassland converted to cropland. Cropland includes lands in annual crops, summerfallow,Footnote 3 and perennial crops. Managed agricultural grassland refers to rangeland that is used only for grazing domestic livestock.
Since 1990, agricultural land has typically contributed to GHG removals and consistently did so between 2004 and 2021. Removals by agricultural land has ranged between 8.2 Mt CO2 eq to 42 Mt CO2 eq. These removals are due to changes in agricultural practices, such as the adoption of conservation tillage,Footnote 4 increases in crop yield, and the reduced use of summerfallow. However, the removal rate from agricultural land has been decreasing in recent years due to a decline in the adoption rate of conservation tillage and the area of land used to grow perennial crops as well as increases in the conversion of forested land to agricultural land. The shift from net removals to emissions in 2022 was primarily driven by a significant drought in 2021, which reduced crop yields and carbon inputs from residues resulting in a very small loss of soil carbon over large areas of the Prairies. In 2023, crop yields were more consistent with recent harvests and soils returned to a net carbon sink again.
Wetlands
The wetlands category includes activities such as peat extraction for use in horticulture and land flooding to develop reservoirs for hydro-electric power development.
Trends in wetlands are mainly driven by the creation of large reservoirs occurring before 1990, resulting in higher emissions over the 1990 to 1993 period. Emissions from reservoirs declined from 1990 to 2023, while emissions from drained and excavated wetlands for peat extraction increased. Overall, during this time period, total emissions declined from 5.2 Mt CO2 eq to 2.6 Mt CO2 eq.
Settlements
The settlements category refers to emissions and removals occurring on developed lands (such as urban environments, transport infrastructure, oil and gas infrastructure and mining) and from the conversion of forests and agricultural land to settlements.
Total emissions for settlements fluctuated between 3.7 Mt CO2 eq and 6.1 Mt CO2 eq. Emissions were mainly driven by rates of forested land converted to settlements and are offset by the storage of carbon in urban trees (annual removals of about 4 Mt CO2 eq).
Regional
Regional land-based emissions and removals from human activities
Key results
- From 1990 to 2023,
- The West coast region consistently emitted GHGs, but showed a decrease in emissions from 19 megatonnes of carbon dioxide equivalent (Mt CO2 eq) to 7.4 Mt CO2 eq
- The Mountain region, which is important for forestry, shifted from removals to emissions. It had been the region contributing the most to removals in 1990 (26 Mt CO2 eq) but switched to emissions in 2002 onward, with emissions peaking in 2011 (32 Mt CO2 eq)
- The Boreal region showed fluctuations in the net exchanges, switching from removals prior to 1992, to emissions until 2008, then fluctuating between removals and emissions after that
- The Prairies region consistently showed removals from 1990 to 2021 (ranging between 0.62 Mt CO2 eq and 40 Mt CO2 eq) and experienced emissions for the first time in 2022 (12 Mt CO2 eq) as a result of the 2021 drought
- The Southeastern region shifted from emissions of 15 Mt CO2 eq to removals of 2.1 Mt CO2 eq
Regional land-based greenhouse gas emissions and removals from human activities, Canada, 1990 to 2023

Data table for the long description
| Region | Year | Forest sector (megatonnes of carbon dioxide equivalent) |
Agricultural land (megatonnes of carbon dioxide equivalent) |
Wetlands (megatonnes of carbon dioxide equivalent) |
Settlements (megatonnes of carbon dioxide equivalent) |
Net exchange (megatonnes of carbon dioxide equivalent) |
|---|---|---|---|---|---|---|
| Mountain | 1990 | -29 | 1 | 0.21 | 1.6 | -26 |
| Mountain | 1991 | -18 | 0.86 | 0.2 | 1.9 | -15 |
| Mountain | 1992 | -13 | 0.94 | 0.18 | 1.4 | -10 |
| Mountain | 1993 | -11 | 0.68 | 0.17 | 1.3 | -8.4 |
| Mountain | 1994 | -12 | 0.7 | 0.12 | 1.4 | -9.4 |
| Mountain | 1995 | -10 | 0.73 | 0.11 | 1.3 | -8.1 |
| Mountain | 1996 | -9.6 | 0.59 | 0.11 | 1.2 | -7.7 |
| Mountain | 1997 | -10 | 0.62 | 0.1 | 1.2 | -8.5 |
| Mountain | 1998 | -13 | 0.62 | 0.09 | 1.2 | -11 |
| Mountain | 1999 | -7.5 | 0.52 | 0.09 | 1.4 | -5.6 |
| Mountain | 2000 | -4 | 0.58 | 0.08 | 1.2 | -2.2 |
| Mountain | 2001 | -7.4 | 0.54 | 0.08 | 1.1 | -5.7 |
| Mountain | 2002 | 0.61 | 0.48 | 0.08 | 1 | 2.2 |
| Mountain | 2003 | 2.2 | 0.58 | 0.07 | 1.1 | 3.9 |
| Mountain | 2004 | 15 | 0.49 | 0.07 | 1.2 | 17 |
| Mountain | 2005 | 23 | 0.45 | 0.06 | 1 | 25 |
| Mountain | 2006 | 24 | 0.5 | 0.06 | 1 | 26 |
| Mountain | 2007 | 26 | 0.42 | 0.06 | 1.1 | 27 |
| Mountain | 2008 | 25 | 0.42 | 0.06 | 1 | 27 |
| Mountain | 2009 | 24 | 0.33 | 0.05 | 0.91 | 25 |
| Mountain | 2010 | 29 | 0.38 | 0.05 | 0.82 | 30 |
| Mountain | 2011 | 30 | 0.37 | 0.05 | 1.3 | 32 |
| Mountain | 2012 | 28 | 0.35 | 0.05 | 1.1 | 29 |
| Mountain | 2013 | 28 | 0.27 | 0.05 | 1.3 | 30 |
| Mountain | 2014 | 26 | 0.35 | 0.04 | 1 | 27 |
| Mountain | 2015 | 26 | 0.39 | 0.04 | 0.87 | 28 |
| Mountain | 2016 | 24 | 0.39 | 0.04 | 0.92 | 25 |
| Mountain | 2017 | 25 | 0.41 | 0.04 | 0.86 | 26 |
| Mountain | 2018 | 27 | 0.36 | 0.04 | 0.83 | 28 |
| Mountain | 2019 | 21 | 0.38 | 0.04 | 0.82 | 22 |
| Mountain | 2020 | 20 | 0.39 | 0.04 | 0.73 | 21 |
| Mountain | 2021 | 19 | 0.34 | 0.03 | 0.76 | 20 |
| Mountain | 2022 | 16 | 0.38 | 0.03 | 0.71 | 17 |
| Mountain | 2023 | 16 | 0.34 | 0.03 | 0.68 | 17 |
| Boreal | 1990 | -21 | 8.7 | 4.5 | 4 | -3.4 |
| Boreal | 1991 | -22 | 7.5 | 4.3 | 4 | -6.2 |
| Boreal | 1992 | -14 | 7 | 4.2 | 4.1 | 1.2 |
| Boreal | 1993 | -8.7 | 8.2 | 4.5 | 3.9 | 7.9 |
| Boreal | 1994 | -1.6 | 4.1 | 2.3 | 4 | 8.8 |
| Boreal | 1995 | 10 | 2.7 | 2.3 | 3.9 | 19 |
| Boreal | 1996 | 2.4 | 3.8 | 2.2 | 4.1 | 12 |
| Boreal | 1997 | 6.6 | 4.2 | 2.1 | 4.1 | 17 |
| Boreal | 1998 | 2.3 | 3.3 | 2.4 | 4.3 | 12 |
| Boreal | 1999 | 8.8 | 2.2 | 2.6 | 4.5 | 18 |
| Boreal | 2000 | 16 | 1.8 | 2 | 4.7 | 25 |
| Boreal | 2001 | 5.9 | 2 | 1.9 | 4.5 | 14 |
| Boreal | 2002 | 13 | 4.9 | 1.9 | 5.1 | 24 |
| Boreal | 2003 | 9.6 | 7.8 | 2 | 5.2 | 25 |
| Boreal | 2004 | 18 | -0.9 | 2 | 5.5 | 25 |
| Boreal | 2005 | 17 | 1.5 | 2 | 5.4 | 26 |
| Boreal | 2006 | 5.1 | -0.37 | 2.1 | 5.8 | 13 |
| Boreal | 2007 | -0.53 | 1.3 | 2.1 | 5.9 | 8.8 |
| Boreal | 2008 | -4.4 | 0.55 | 2.2 | 6 | 4.4 |
| Boreal | 2009 | -11 | -0.59 | 2.1 | 5.4 | -3.6 |
| Boreal | 2010 | -1.8 | 1.4 | 2 | 5.4 | 6.9 |
| Boreal | 2011 | -6.8 | 3.2 | 2 | 5.5 | 3.9 |
| Boreal | 2012 | -8.1 | -1.4 | 1.9 | 5.5 | -2.1 |
| Boreal | 2013 | -8.6 | 1.7 | 2.2 | 6.2 | 1.5 |
| Boreal | 2014 | -8.9 | -3.3 | 2.2 | 6.3 | -3.7 |
| Boreal | 2015 | -5.9 | 3.2 | 2 | 6.2 | 5.5 |
| Boreal | 2016 | -11 | 1.5 | 2 | 5.9 | -1.8 |
| Boreal | 2017 | -12 | 1.1 | 1.9 | 5.8 | -3.6 |
| Boreal | 2018 | -13 | -0.9 | 1.6 | 5.8 | -6.1 |
| Boreal | 2019 | -16 | 1.2 | 1.8 | 5.7 | -7.2 |
| Boreal | 2020 | -7.5 | 2.5 | 2 | 5.9 | 2.9 |
| Boreal | 2021 | -11 | 4.1 | 1.9 | 5.8 | 0.39 |
| Boreal | 2022 | -12 | 8.1 | 1.7 | 5.9 | 3.6 |
| Boreal | 2023 | -10 | 0.36 | 1.7 | 5.7 | -2.3 |
| West coast | 1990 | 19 | 0.24 | 0.04 | -0.08 | 19 |
| West coast | 1991 | 20 | 0.22 | 0.04 | -0.24 | 20 |
| West coast | 1992 | 22 | 0.23 | 0.04 | -0.2 | 22 |
| West coast | 1993 | 23 | 0.15 | 0.04 | -0.26 | 22 |
| West coast | 1994 | 22 | 0.2 | 0.04 | -0.39 | 22 |
| West coast | 1995 | 22 | 0.14 | 0.04 | -0.62 | 21 |
| West coast | 1996 | 20 | 0.18 | 0.04 | -0.22 | 20 |
| West coast | 1997 | 19 | 0.19 | 0.03 | -0.37 | 19 |
| West coast | 1998 | 17 | 0.19 | 0.03 | -0.43 | 17 |
| West coast | 1999 | 19 | 0.12 | 0.03 | -0.67 | 18 |
| West coast | 2000 | 19 | 0.16 | 0.03 | -0.66 | 18 |
| West coast | 2001 | 16 | 0.2 | 0.03 | -0.56 | 16 |
| West coast | 2002 | 17 | 0.18 | 0.03 | -0.57 | 17 |
| West coast | 2003 | 14 | 0.14 | 0.03 | -0.56 | 14 |
| West coast | 2004 | 18 | 0.22 | 0.03 | -0.62 | 17 |
| West coast | 2005 | 16 | 0.19 | 0.03 | -0.73 | 16 |
| West coast | 2006 | 14 | 0.2 | 0.02 | -0.65 | 14 |
| West coast | 2007 | 13 | 0.15 | 0.02 | -0.74 | 13 |
| West coast | 2008 | 12 | 0.17 | 0.02 | -0.77 | 11 |
| West coast | 2009 | 10 | 0.23 | 0.02 | -0.83 | 9.5 |
| West coast | 2010 | 12 | 0.15 | 0.02 | -0.82 | 11 |
| West coast | 2011 | 12 | 0.22 | 0.02 | -0.73 | 12 |
| West coast | 2012 | 12 | 0.19 | 0.02 | -0.56 | 12 |
| West coast | 2013 | 12 | 0.16 | 0.02 | -0.56 | 12 |
| West coast | 2014 | 12 | 0.2 | 0.02 | -0.5 | 12 |
| West coast | 2015 | 12 | 0.29 | 0.01 | -0.64 | 12 |
| West coast | 2016 | 12 | 0.33 | 0.01 | -0.68 | 11 |
| West coast | 2017 | 11 | 0.35 | 0.01 | -0.65 | 11 |
| West coast | 2018 | 12 | 0.42 | 0.01 | -0.45 | 12 |
| West coast | 2019 | 9.5 | 0.24 | 0.01 | -0.51 | 9.3 |
| West coast | 2020 | 9.3 | 0.25 | 0.01 | -0.56 | 9 |
| West coast | 2021 | 8.6 | 0.28 | 0.01 | -0.3 | 8.6 |
| West coast | 2022 | 8.1 | 0.37 | 0.01 | -0.59 | 7.9 |
| West coast | 2023 | 7.5 | 0.34 | 0.01 | -0.5 | 7.4 |
| Prairies | 1990 | -0.46 | -6.1 | 0 | -0.14 | -6.7 |
| Prairies | 1991 | -0.52 | -11 | 0 | -0.15 | -12 |
| Prairies | 1992 | -0.47 | -9.6 | 0 | -0.15 | -10 |
| Prairies | 1993 | -0.37 | -4.4 | 0 | -0.15 | -4.9 |
| Prairies | 1994 | -0.2 | -12 | 0 | -0.15 | -12 |
| Prairies | 1995 | -0.11 | -11 | 0 | -0.15 | -11 |
| Prairies | 1996 | -0.07 | -11 | 0 | -0.16 | -11 |
| Prairies | 1997 | -0.08 | -16 | 0 | -0.16 | -16 |
| Prairies | 1998 | -0.23 | -11 | 0 | -0.16 | -11 |
| Prairies | 1999 | -0.17 | -17 | 0 | -0.16 | -17 |
| Prairies | 2000 | -0.07 | -20 | 0 | -0.16 | -20 |
| Prairies | 2001 | -0.18 | -16 | 0 | -0.16 | -16 |
| Prairies | 2002 | -0.1 | -1.5 | 0 | -0.17 | -1.8 |
| Prairies | 2003 | -0.19 | -0.27 | 0 | -0.16 | -0.62 |
| Prairies | 2004 | -0.05 | -22 | 0 | -0.16 | -22 |
| Prairies | 2005 | 0.02 | -24 | 0 | -0.17 | -24 |
| Prairies | 2006 | 0 | -25 | 0 | -0.17 | -25 |
| Prairies | 2007 | 0.01 | -21 | 0 | -0.18 | -21 |
| Prairies | 2008 | 0.03 | -21 | 0 | -0.18 | -21 |
| Prairies | 2009 | 0.06 | -35 | 0 | -0.18 | -35 |
| Prairies | 2010 | 0.08 | -25 | 0 | -0.18 | -25 |
| Prairies | 2011 | 0.11 | -18 | 0 | -0.16 | -18 |
| Prairies | 2012 | 0.09 | -22 | 0 | -0.14 | -22 |
| Prairies | 2013 | 0.03 | -26 | 0 | -0.12 | -26 |
| Prairies | 2014 | 0.02 | -40 | 0 | -0.06 | -40 |
| Prairies | 2015 | 0.12 | -16 | 0 | -0.02 | -16 |
| Prairies | 2016 | 0.08 | -20 | 0 | -0.03 | -20 |
| Prairies | 2017 | 0.41 | -25 | 0 | -0.03 | -25 |
| Prairies | 2018 | 0.45 | -21 | 0 | -0.01 | -21 |
| Prairies | 2019 | 0.36 | -20 | 0 | -0.04 | -19 |
| Prairies | 2020 | 0.47 | -20 | 0 | -0.01 | -19 |
| Prairies | 2021 | 0.3 | -24 | 0 | 0 | -23 |
| Prairies | 2022 | 0.32 | 12 | 0 | 0.01 | 12 |
| Prairies | 2023 | 0.32 | -25 | 0 | -0.04 | -25 |
| Southeastern | 1990 | 13 | 2 | 0.41 | -0.52 | 15 |
| Southeastern | 1991 | 12 | 1.2 | 0.43 | -0.51 | 13 |
| Southeastern | 1992 | 13 | 2.2 | 0.44 | -0.56 | 15 |
| Southeastern | 1993 | 14 | 3.3 | 0.46 | -0.64 | 17 |
| Southeastern | 1994 | 14 | 1.9 | 0.47 | -0.64 | 16 |
| Southeastern | 1995 | 15 | 1.4 | 0.47 | -0.66 | 16 |
| Southeastern | 1996 | 15 | 1.7 | 0.49 | -0.63 | 17 |
| Southeastern | 1997 | 16 | 2.6 | 0.53 | -0.68 | 18 |
| Southeastern | 1998 | 14 | 2.4 | 0.58 | -0.53 | 16 |
| Southeastern | 1999 | 14 | 1.6 | 0.57 | -0.46 | 16 |
| Southeastern | 2000 | 13 | 1.9 | 0.59 | -0.47 | 15 |
| Southeastern | 2001 | 7.7 | 3.2 | 0.61 | -0.48 | 11 |
| Southeastern | 2002 | 6.5 | 3.8 | 0.63 | -0.57 | 10 |
| Southeastern | 2003 | 5.1 | 2.8 | 0.65 | -0.56 | 8 |
| Southeastern | 2004 | 8.5 | 1.7 | 0.67 | -0.53 | 10 |
| Southeastern | 2005 | 6.8 | 2.1 | 0.69 | -0.64 | 8.9 |
| Southeastern | 2006 | 4.2 | 1.7 | 0.71 | -0.62 | 6 |
| Southeastern | 2007 | 1.6 | 2 | 0.72 | -0.67 | 3.7 |
| Southeastern | 2008 | 3.4 | 2.1 | 0.72 | -0.65 | 5.6 |
| Southeastern | 2009 | 1.5 | 0.69 | 0.73 | -0.65 | 2.2 |
| Southeastern | 2010 | 1.8 | 2.6 | 0.75 | -0.69 | 4.4 |
| Southeastern | 2011 | 0.56 | 1.8 | 0.76 | -0.7 | 2.5 |
| Southeastern | 2012 | -1.9 | 2.1 | 0.76 | -0.73 | 0.23 |
| Southeastern | 2013 | 0.03 | 1.8 | 0.76 | -0.68 | 1.9 |
| Southeastern | 2014 | 0.15 | 0.66 | 0.77 | -0.59 | 0.99 |
| Southeastern | 2015 | 1.2 | 4.2 | 0.78 | -0.39 | 5.7 |
| Southeastern | 2016 | -0.48 | 2.7 | 0.8 | -0.43 | 2.5 |
| Southeastern | 2017 | -1.3 | 2.8 | 0.81 | -0.63 | 1.7 |
| Southeastern | 2018 | -1.5 | 1.8 | 0.82 | -0.64 | 0.47 |
| Southeastern | 2019 | -3.6 | 2.6 | 0.84 | -0.65 | -0.76 |
| Southeastern | 2020 | -3.1 | 3.5 | 0.85 | -0.65 | 0.69 |
| Southeastern | 2021 | -3.9 | 3 | 0.87 | -0.67 | -0.76 |
| Southeastern | 2022 | -4.4 | 4.4 | 0.89 | -0.69 | 0.14 |
| Southeastern | 2023 | -4.8 | 2.5 | 0.89 | -0.66 | -2.1 |
Download data file (Excel/CSV; 7.34 kB)
Note: Data are accurate to 2 significant figures in accordance with Part III Annex 8 of the National Inventory Report. Net exchange is calculated by subtracting removals from emissions.
How this indicator was calculated
Note: Regions are based on the location of the human activities across the country. Forest sector regional estimates provided do not include the long-term impact of emissions from forest harvest or deforestation prior to 1990.
Source: Environment and Climate Change Canada (2025) National Inventory Report 1990-2023: Greenhouse Gas Sources and Sinks in Canada.
The overall increase in removals of GHGs on the Prairies between 1990 and 2014 can be attributed to changes in agricultural land management practices, such as the adoption of conservation tillage, the proportion of annual and perennial crops, and the reduced use of summerfallow. These changes in land management decrease soil disturbance and thereby lower releases of carbon from the soil. In recent years, the decline in the proportion of perennial crops on the landscape and the rate of conservation tillage practices have been offset by increasing yields contributing to increased inputs of crop residue resulting in variable, but stable GHG removals for croplands as a whole. The transition from net removals to net emissions in 2022 stemmed largely from a major drought in 2021, reflecting how weather-related impacts can significantly affect crop production and reduce carbon inputs from residues. When crop yields decline due to drought, there are fewer plant residues to decompose and add organic carbon to the soil, leading to increased emissions instead of carbon storage (removals). The return to average yields in 2022 returned the soils to a carbon sink in 2023.
The increase in GHG emissions in the Boreal region and the shift from removals to emissions in the Mountain region are related to increased forest harvesting (in part to salvage timber from trees killed by the Mountain Pine Beetle and prevent its spread) as well as a reduction in net carbon removals from forests. The latter is due to insect infestations and fires in managed forests. The Boreal and the Mountain regions account for over 70% of the carbon transferred to harvested wood products. While timber harvesting transfers most of the carbon from stem wood to harvested wood products, it also results in emissions at the harvest site in the years immediately following the disturbance, primarily due to decomposition. The disturbances reduce the area of mature growing trees, which is already known to be slow in these regions and increase decomposition and salvage logging (the harvest of dead or dying standing trees). For more information, see the Forest sector in Land-based emissions and removals from human activities.
In the West Coast and Southeastern regions, forestry management practices (changes in harvest rates and forest regeneration) contributed to the reduction in emissions. That said, the West Coast still has the highest rate of carbon transfers to harvested wood products per hectare in Canada. In recent years, net GHG emissions have decreased in Southeastern region, due to forest growth.
The previously reported carbon sink in 1990 and subsequent years have been adjusted based on corrections made to the pre-1990 Forest Land disturbance history data and now more accurately reflect a reclassification from human activity to natural origin. The Mountain, Boreal and Southeastern regions saw changes in emissions and removals from the forest sector as a result of these recalculations. Refer to the Data sources and methods section for more information.
Natural disturbances
Land-based emissions and removals from natural disturbances
Forests remove carbon from the atmosphere as they grow and release it along with other GHGs when they decay after dying or burning in forest fires.
Key results
- In 2023,
- Emissions from wildfires (immediate emissions) contributed 1,100 megatonnes of carbon dioxide equivalent (Mt CO2 eq). These emissions were roughly four times observed wildfire emissions since 1990
- Emissions caused by insect infestations were 13 Mt CO2 eq
- Despite forest regrowth, emissions from post-wildfires were 35 Mt CO2 eq
- Since 2002, the net exchange from natural disturbances resulted in GHG emissions, ranging between 0.31 Mt CO2 eq and 1,100 Mt CO2 eq
Land-based greenhouse gas emissions and removals from natural disturbances in managed areas, Canada, 1990 to 2023

Data table for the long description
| Year | Wildfire – immediate emissions (megatonnes of carbon dioxide equivalent) |
Post-wildfire – emissions and removals (megatonnes of carbon dioxide equivalent) |
Insects – emissions and removals (megatonnes of carbon dioxide equivalent) |
Net exchange (megatonnes of carbon dioxide equivalent) |
|---|---|---|---|---|
| 1990 | 30 | -150 | 0.24 | -120 |
| 1991 | 59 | -140 | 0.35 | -84 |
| 1992 | 13 | -150 | 0.41 | -130 |
| 1993 | 61 | -150 | 0.42 | -86 |
| 1994 | 66 | -150 | 0.48 | -81 |
| 1995 | 220 | -130 | 0.57 | 87 |
| 1996 | 56 | -130 | 0.61 | -69 |
| 1997 | 15 | -130 | 0.62 | -110 |
| 1998 | 220 | -120 | 0.59 | 100 |
| 1999 | 81 | -120 | 0.37 | -36 |
| 2000 | 12 | -120 | 3 | -100 |
| 2001 | 38 | -110 | 8.3 | -65 |
| 2002 | 140 | -100 | 13 | 50 |
| 2003 | 100 | -99 | 23 | 25 |
| 2004 | 160 | -96 | 32 | 94 |
| 2005 | 65 | -92 | 39 | 12 |
| 2006 | 85 | -86 | 46 | 44 |
| 2007 | 78 | -84 | 52 | 46 |
| 2008 | 31 | -85 | 54 | 0.31 |
| 2009 | 65 | -85 | 51 | 31 |
| 2010 | 120 | -79 | 49 | 89 |
| 2011 | 150 | -72 | 43 | 120 |
| 2012 | 120 | -67 | 39 | 94 |
| 2013 | 58 | -67 | 36 | 27 |
| 2014 | 180 | -61 | 32 | 150 |
| 2015 | 260 | -49 | 30 | 250 |
| 2016 | 110 | -44 | 27 | 95 |
| 2017 | 230 | -36 | 23 | 220 |
| 2018 | 260 | -27 | 21 | 250 |
| 2019 | 170 | -24 | 19 | 160 |
| 2020 | 14 | -29 | 17 | 2.7 |
| 2021 | 290 | -15 | 16 | 290 |
| 2022 | 89 | -17 | 15 | 87 |
| 2023 | 1,100 | 35 | 13 | 1,100 |
Download data file (Excel/CSV; 2.13 kB)
Note: Data are accurate to 2 significant figures in accordance with Part III Annex 8 of the National Inventory Report. Net exchange is calculated by subtracting removals from emissions.
How this indicator was calculated
Note: Wildfire emissions and removals are divided in 2 categories, (1) wildfire – immediate emissions and (2) post wildfire. Wildfire – immediate emissions include emissions from trees and soils from the burning of wildfires. Post wildfire includes emissions released by the decay of dead trees and soil organic matter and removals related to forest regeneration. Insect disturbances include emissions from the decay of organic matter and removals from natural regeneration.
Source: Environment and Climate Change Canada (2025) National Inventory Report 1990-2023: Greenhouse Gas Sources and Sinks in Canada.
Natural disturbances are an important factor in determining whether forests remove or release GHGs each year. These disturbances contribute to immediate emissions (for example, from the burning of trees), as well as post-disturbance emissions and removals. Post-disturbance emissions are from the gradual decay of dead organic matter. Post-disturbance removals are related to the natural regeneration and regrowth of forests.
The variability in emissions and releases from natural disturbances can vary greatly from year to year. For example, emissions from managed lands were lower in 2020 than in adjacent years because of the smaller area burned.Footnote 5However, since the mid-2000s, emissions from wildfires and insect disturbances have been increasing. In 2023, emissions from wildfires were greater than emissions from all other human emissions of GHGs in Canada. Additionally, severe insect infestations in the early 2000s are having an effect on today's net GHG exchange and are expected to influence GHG emissions over the next few decades.
About the indicator
About the indicator
What the indicator measures
The Land-based greenhouse gas emissions and removals indicator tracks exchanges of greenhouse gas (GHG) emissions and removals between the atmosphere and Canada's managed lands. Reported GHG emissions and removals are annual totals from:
- Land use and land-use change activities
- Forest sector (managed forested land and harvested wood products)
- Agricultural land (cropland and agricultural grassland)
- Wetlands (peat extraction and reservoirs for hydropower)
- Settlements (developed land and land conversion to settlement)
- Natural disturbances (insect infestations and wildfires)
The indicator does not report emissions from Canadian economic sectors: oil and gas, transport, buildings, electricity, heavy industry, agriculture (such as fuel use, and crop and animal production) and waste. For information on those GHG emissions, refer to the Greenhouse gas emissions indicator.
Why this indicator is important
GHG emissions and their increasing concentrations in the atmosphere are having significant impacts on the environment, human health and the economy. Tracking the trends in Canada’s land-based GHG emissions and removals provides a useful context for understanding how different management activities could reduce emissions and increase removals over time. This indicator could also help identify opportunities for mitigating the impacts of climate change and the potential for enhancing carbon sequestration.
The distinction between emissions and removals from human activities versus natural disturbances allows for a better understanding of emissions that could be directly managed in the near to medium term. The National Inventory Report has made this distinction since 2017 in the 2015 National Inventory Report.
Related indicators
The Greenhouse gas emissions indicators report trends in total anthropogenic (human-made) GHG emissions at the national level, per person and per unit gross domestic product, by province and territory and by economic sector.
The Global greenhouse gas emissions indicator provides a global perspective on Canada's share of global GHG emissions.
The Greenhouse gas emissions from a consumption perspective indicator shows the impact of Canada's consumption of goods and services, regardless of where they are produced, on the levels of carbon dioxide released into the atmosphere.
The Greenhouse gas emissions projections indicator provides an overview of Canada's projected GHG emissions up to 2030.
The Greenhouse gas emissions from large facilities indicator reports GHG emissions from the largest GHG emitters in Canada (industrial and other types of facilities).
The Greenhouse gas concentrations indicators present atmospheric concentrations as measured from sites in Canada and at a global scale for 2 greenhouse gases: carbon dioxide and methane.
The Forest management and disturbances indicator presents a series of measures covering timber harvest, forest disturbances, and forest regeneration.
Data sources and methods
Data sources and methods
Data sources
This indicator is developed using data from Canada's National Inventory Report and includes emissions and removals associated with natural disturbances and with land use, land-use change and forestry (LULUCF) activity on managed lands. Managed lands are defined by the Intergovernmental Panel on Climate Change (IPCC) as "land where human interventions and practices have been applied to perform production, ecological or social functions".Footnote 6 Information on the land category definition and representation of managed lands is available in Chapter 6 of the National Inventory Report.
Land-based greenhouse gas (GHG) emissions and removals include emissions and removals of carbon dioxide (CO2). It also includes emissions of methane (CH4), nitrous oxide (N2O), and indirect CO2 from the atmospheric oxidation of carbon monoxide (CO) due to controlled biomass burning; CH4 and N2O emissions from wetland drainage and rewetting due to peat extraction; and N2O released following land conversion to cropland.
More information
Data used to develop the land-based emission and removal estimates presented in the National Inventory Report are drawn from published and unpublished sources from various government departments, industry sources and scientific papers.
Land-based GHG emission estimates are provided at the national level, by sector and by region. Annual GHG emission estimates are updated each year; the most recent edition of the inventory reported estimates for the period from 1990 to 2023. Complete details of the temporal coverage for each data source used for the indicators can be found in Chapter 6 of the National Inventory Report. Details on the role of Forest harvesting on forest carbon emissions and removals can be found in Chapter 2, Section 2.3.4.1.1.
Preparation of the GHG inventory, including the land-based emission and removal estimates, takes almost 16 months from the end of the reporting year because of the time needed to collect, validate, calculate and interpret the data. In keeping with good practice guidance for managing national inventories, methods and data are improved on an on-going basis to reflect new knowledge and improved data or methods. Inventory estimates are prepared by Environment and Climate Change Canada's Pollutant Inventories and Reporting Division with input from numerous experts and scientists across Canada. Preliminary estimates and draft text are reviewed extensively by experts and officials, before they are finalized. The final report is submitted electronically to the United Nations Framework Convention on Climate Change (UNFCCC) no later than mid-April, as required.
Methods
Land-based GHG emissions and removals are quantified using methods that are consistent with an internationally agreed methodological framework set out in the 2006 IPCC Guidelines for National Greenhouse Gas Inventories and 2019 IPCC Refinement to the 2006 IPCC Guidelines for National Greenhouse Gas Inventories. The methodologies used to estimate emissions and removals are reviewed, updated and improved on a periodic basis. Collaborative work with sector experts from within and outside Environment and Climate Change Canada is undertaken to incorporate available expertise and the latest advancements in scientific knowledge. Further information on these methods is available through Environment and Climate Change Canada's National Inventory Report.
More information
Land-based GHG emissions and removals are reported in carbon dioxide equivalents (CO2 eq), determined by multiplying the amount of emissions of a particular GHG by the global warming potential of that gas. GHGs differ in their ability to absorb heat in the atmosphere due to their differing chemical properties and atmospheric lifetimes. For example, over a period of 100 years, the potential of methane to trap heat in the atmosphere is 28 times greater than that of carbon dioxide. Therefore, methane is considered to have a global warming potential of 28. The UNFCCC Reporting Guidelines (PDF; 258 KB) publish the global warming potentials and atmospheric lifetimes to be used for each GHG reported in national GHG inventories; these can be found in Table 1-1 of the National Inventory Report.
Areas within managed forests are subject to both forest management and natural disturbances. Emissions and removals from these areas are associated with human activities under specific circumstances. All stands harvested or that have been affected by stand-replacing natural disturbances in the past but have reached commercial maturity, or a minimum operable age (for a given region) are recognized to be under human influence. Commercially mature stands subject to natural disturbances causing less than or equal to 20% biomass mortality (for example some insects that cause defoliation but low mortality) remain associated with human activities. Large, uncontrollable natural disturbances (for example wildfires or insect outbreaks causing more than 20% biomass mortality) are recognized to result from natural occurrences and the associated emissions and removals are reflected in the natural disturbance category. See Part II Annex 3 of the National Inventory Report for more information on the tracking and reporting of natural disturbances.Footnote 7
Spatial aggregation
Estimates for the land use, land-use change and forestry (LULUCF) sector in the National Inventory Report are provided for 18 reporting zones (Chapter 6, Figure 6-1 Canada's National Inventory Report). These reporting zones are similar to the ecozones of the National Ecological Framework, a hierarchical, spatially consistent national ecosystem classification.
In this indicator, the reporting zones were grouped into regional categories that better reflect trends in management practices. Table 1 shows the indicator regional categories and the corresponding National Inventory Report reporting zones.
| Indicator regional categories | National Inventory Report reporting zones |
|---|---|
| Mountain | Taiga Cordillera |
| Mountain | Boreal Cordillera |
| Mountain | Montane Cordillera |
| Boreal | Taiga Plains |
| Boreal | Taiga Shield West |
| Boreal | Boreal Plains |
| Boreal | Boreal Shield West |
| Boreal | Hudson Plains |
| Boreal | Boreal Shield East (excluding Newfoundland) |
| Boreal | Taiga Shield East |
| West Coast | Pacific Maritime |
| Prairies | Subhumid Prairies |
| Prairies | Semiarid Prairies |
| Southeastern | Boreal Shield East (Newfoundland) |
| Southeastern | Atlantic Maritime |
| Southeastern | Mixedwood Plains |
| Not reported | Arctic Cordillera |
| Not reported | Northern Arctic |
| Not reported | Southern Arctic |
Land-based greenhouse gas emissions and removals by land use categories
In this indicator, calculated emissions and removals data from the National Inventory Report are grouped into 4 broad classes. Table 2 shows the categories of Land-based GHG emissions and removals reported in the indicator compared with those reported in the National Inventory Report.
| Land-based emissions and removals categories reported in the sector | Land-based emissions and removals categories reported in the National Inventory Report |
|---|---|
| Forest sector | Forest land |
| Forest sector | Harvest wood products (HWP) |
| Agricultural land | Cropland |
| Agricultural land | Agricultural grassland |
| Wetlands | Peat extraction and flooded lands |
| Settlements | Settlements |
Note: Definitions for land-use change and forest land as reported in the National Inventory Report are consistent with the International Panel on Climate Change land categories. Harvested wood product includes those that originate from forest trees, urban trees or agricultural land.
Recent changes
Recalculations occurred for the forest sector, most significantly due to corrections made to the pre-1990 Forest Land disturbance history data. A multi-year analysis was completed to determine the area of forest land that had been historically harvested in Canada. The historical harvest area is a key factor in determining the area of land reported as anthropogenic and, consequently, the emissions and removals that are reported in the forest sector. The new compilation of historic (1889 to 1989) harvest data in Canada showed that the area of historically harvested forests was smaller by about 20%.Footnote 8 In other words, a smaller area of growing forest that actively removes CO2 from the atmosphere is counted as a smaller anthropogenic sink (lower removals). The previously reported carbon sink in 1990 and subsequent years has been adjusted based on these recalculations and now more accurately reflects a reclassification from human activity to natural origin. The impact of these recalculations shifted the forest sector from a net sink (removals) to a net source (emissions) for the entire time series. Refer to Section 6.3.1.5 of the National Inventory Report (Part 1) for more information.
Caveats and limitations
The methodologies for compiling land-based GHG emissions and removals improve over time. As a result, the land-based emissions and removals data reported in the indicator may be different from previously published estimates.
Harvested wood products are not limited to those that originate from forests and include those from urban trees and agricultural land. As such, the reported emissions from the forest sector may differ from the National Inventory Report. For more information, see Chapter 6.4 of the National Inventory Report.
Canada is a vast country with heterogeneous landscapes and climates. Factors such as geographic location, climatic conditions, plant species and age, and management activities all play a role in influencing the net amount of GHG that is removed or released back to the atmosphere from each location in Canada. The land-based emissions and removals data provide a simplified representation of the complex reality and may not account for all relevant ecological processes.
Current reporting of land-based emissions and removals does not account for climate feedback other than what is captured through natural disturbances such as wildfires and insect infestations. Climate feedback mechanisms can either amplify (positive feedback) or diminish (negative feedback) the effects of a changing climate. For example, as rising concentrations of GHGs warm Earth's climate, permafrost begins to melt. This melting releases the organic carbon stored, contributing to GHG releases that cause more warming, which causes more melting, and so on, in a self reinforcing cycle.
For a complete discussion of the caveats and limitations with respect to land-based GHG emissions and removals data, refer to the methodological issues sections in Chapter 6 of Canada's National Inventory Report.
Resources
Resources
References
Environment and Climate Change Canada (2025) Canada's official greenhouse gas inventory. Retrieved July 7, 2025.
Environment and Climate Change Canada (2025) National Inventory Report 1990-2022: Greenhouse gas sources and sinks in Canada. Retrieved on July 7, 2025.
Intergovernmental Panel on Climate Change (2003) Good Practice Guidance for Land Use, Land-use Change and Forestry. Retrieved on July 7, 2025.
Intergovernmental Panel on Climate Change (2006) 2006 IPCC Guidelines for National Greenhouse Gas Inventories, Vol. 4: Agriculture, Forestry and Other Land Use. Retrieved on July 7, 2025.
Intergovernmental Panel on Climate Change (2019) 2019 Refinement to the 2006 IPCC Guidelines for National Greenhouse Gas Inventories, Vol. 4: Agriculture, Forestry and Other Land Use. Retrieved on July 7, 2025.
Kurz WA, Hayne S, Fellows M, MacDonald JD, Metsaranta JM, Hafer M and Blain D (2018) Quantifying the impacts of human activities on reported greenhouse gas emissions and removals in Canada’s managed forest: conceptual framework and implementation. Canadian Journal of Forest Research 48: 1-14. Retrieved on August 22, 2024.
Kurz WA, Hudson B, Neilson E, Fellows M, Hafer M and MacDonald JD (2024). Revised historic harvest data improve estimates of the impacts of human activities on reported greenhouse gas emissions and removals in Canada’s managed forest. Canadian Journal of Forest Research. Retrieved on August 22, 2024.
Natural Resources Canada (2024) The State of Canada's Forests 2024. Retrieved July 7, 2025.
Warren FJ and Lemmen DS, editors (2014) Canada in a Changing Climate: Sector Perspectives on Impacts and Adaptation. Government of Canada, Ottawa, ON, 286p. Retrieved July 7, 2025.
Related information
Canada's Action on Climate Change
Land-based greenhouse gas emissions and removals infographic
Alternative format
Download the alternative format of the Land-based greenhouse gas emissions and removals indicator (PDF; 1.02 MB).
Infographic
Long description
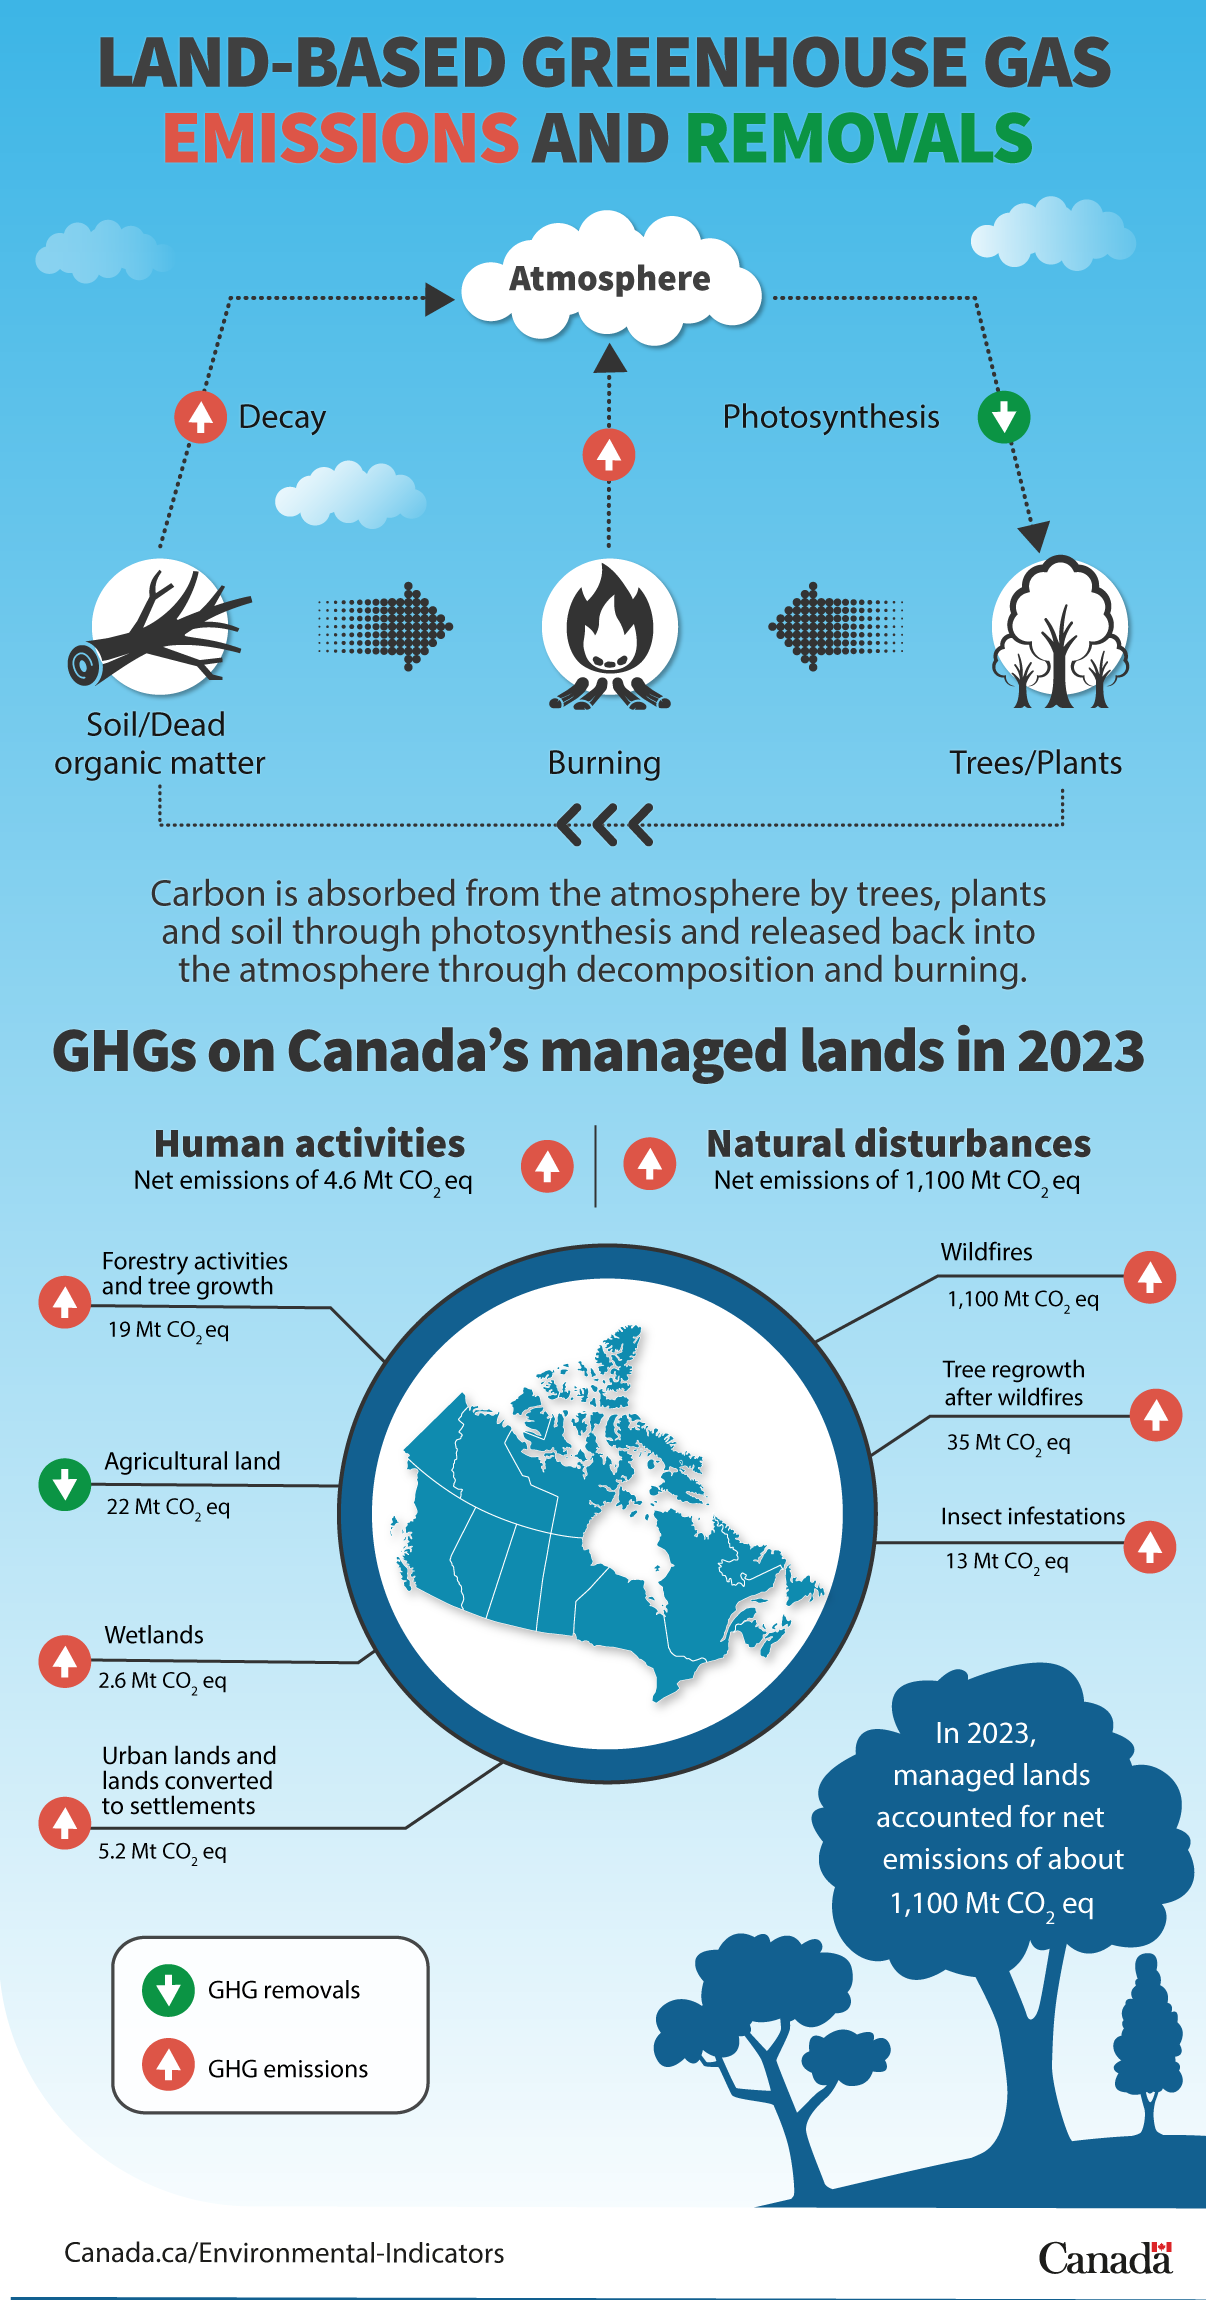
The infographic presents information on the Land-based greenhouse gas emissions and removals indicator. A graphic is shown to represent the carbon cycle where carbon is absorbed from the atmosphere by trees, plants and soil through photosynthesis and released back into the atmosphere through burning and decomposition of soil and dead organic matter.
Greenhouse gases on Canada's managed lands in 2023:
- Human activities accounted for net emissions of 4.6 Mt CO2 eq
- Natural disturbances accounted for net emissions of 1,100 Mt CO2 eq
Emissions from human activities in 2023:
- Forestry activities and tree growth contributed emissions of 19 Mt CO2 eq
- Agricultural land contributed removals of 22 Mt CO2 eq
- Wetlands contributed emissions of 2.6 Mt CO2 eq
- Urban lands and lands converted to settlements contributed emissions of 5.2 Mt CO2 eq
Emissions and removals from natural disturbances in 2023:
- Wildfires contributed emissions of 1,100 Mt CO2 eq
- Tree regrowth after wildfires contributed emissions of 35 Mt CO2 eq
- Insect infestations contributed emissions of 13 Mt CO2 eq
In 2023, managed lands accounted for net emissions of about 1,100 Mt CO2 eq.