
Nitrosamine impurities in medications: Test methods and test results
On this page
- Test method for sartans or angiotensin II receptor blockers (ARBs)
- Test method for ranitidine products
- Test methods for metformin products
- Test results for sartans or angiotensin II receptor blockers (ARBs)
- Test results for ranitidines
- Test results for metformin
The following testing methods have been developed by Health Canada and may serve as a potential testing option for regulators and industry to detect nitrosamine impurities in certain drug substances and drug products. These methods should be validated by the user if the resulting data are used to support a required quality assessment of the API or drug product, or if the results are used in a regulatory submission. Methods are subject to change as new information becomes available.
Test method for sartans or angiotensin II receptor blockers (ARBs)
Determination of N-nitrosodimethylamine (NDMA) and N-nitrosodiethylamine (NDEA) by GC-MS/MS (direct injection) in sartan finished products and drug substances
1. Principle and scope
The present method has been developed to detect and quantify the nitrosamine impurities N-nitrosodimethylamine (NDMA) and N-nitrosodiethylamine (NDEA) in valsartan, irbesartan and losartan finished products. The method is performed by gas chromatography-tandem mass spectrometry (GC-MS/MS) using direct injection.
The method can also be used to detect and quantify NDMA and NDEA in candesartan and olmesartan finished products, and in sartan drug substances (e.g., valsartan, irbesartan, losartan, candesartan and olmesartan). However, if interferences are observed, further validation may be required.
2. Reagents and reference standards
- Methanol, HPLC grade (CAS #: 67-56-1)
- NDMA: N-nitrosodimethylamine solution (5000 μg/mL in methanol; CAS #: 62-75-9)
- NDEA: N-nitrosodiethylamine solution, (100 μg/mL in methanol; CAS #: 55-18-5)
- NDMA-d6 solution: N-nitrosodimethylamine-d6 (1000 μg/mL in methanol; CAS #: 17829-05-9)
3. Instrument/Equipment
- Agilent GC 7890A with MS/MS 7000 with EI source or equivalent
- Agilent DB-624 25 m x 0.32 μm 1.8 μm or equivalent
- 2 mL amber screw-cap GC vials with caps (PTFE/Silicone)
- 20 x 125 mm screw cap round bottom glass tubes with caps
- Automatic pipettes, various volumes
- Top-loading balance suitable for ± 0.01 g and Analytical balance suitable for ± 0.0001 g readability
- Volumetric flasks (class A), various volumes
- Pasteur pipettes and pipette bulbs
- Spatula
- 15 mL amber glass vials with caps
- 40 mL amber glass vials with caps
- Vortex mixer, single and multi-tube
- Vial racks and storage racks
- Kimwipes
- Mortar and pestle
- Ultrasonic water bath
- Centrifuge, Beckmann-Coulter Allegra X-15R or equivalent
4. Preparation of solutions
Standard solutions
- Reference standard stock solutions (as purchased)
-
- NDMA standard solution in methanol (5000 ppm)
- NDEA standard solution in methanol (100 ppm)
- Internal reference standard stock solution (as purchased)
-
- NDMA-d6 standard solution in methanol (1000 ppm)
Diluted standard solutions
- NDMA standard solution (200 ppm):
- Transfer 800 μL of NDMA reference solution (5000 ppm) into a 20 mL volumetric flask, dilute to volume with methanol.
- Diluted standard solution (NDMA: 40 ppm, NDEA: 20 ppm):
- Transfer 800 μL of NDMA standard solution (200 ppm) and 800 μL of NDEA reference solution (100 ppm) into a 4 mL volumetric flask, dilute to volume with methanol.
- Internal standard solution-1 (20 ppm):
- Transfer 500 μL of NDMA-d6 standard solution (1000 ppm) into a 25 mL volumetric flask, dilute to volume with methanol.
- Internal standard solution-2 (0.2 ppm):
- Transfer 5 mL of internal standard solution-1 (20 ppm) into a 500 mL volumetric flask, dilute to volume with methanol.
Calibration solutions
- STD-12:
- Transfer 500 μL of diluted standard solution (NDMA: 40 ppm, NDEA: 20 ppm) and 50 μL of internal standard solution-1 (20 ppm) into a 5 mL volumetric flask, dilute to volume with methanol. Mix well.
- STD-7:
- Transfer 1000 μL of STD-12 into a 20 mL volumetric flask, dilute to volume with internal standard solution-2 (0.2 ppm). Mix well. This solution will be used for the system suitability test and system drift check.
- STD-11:
- 1:1 dilution of STD-12 with internal standard solution-2
- STD-10:
- 1:1 dilution of STD-11 with internal standard solution-2
- STD-9:
- 1:1 dilution of STD-10 with internal standard solution-2
- STD-8:
- 3:2 dilution of STD-9 with internal standard solution-2
- STD-6:
- 1:1 dilution of STD-7 with internal standard solution-2
- STD-5:
- 1:1 dilution of STD-6 with internal standard solution-2
- STD-4:
- 2:3 dilution of STD-5 with internal standard solution-2
- STD-3:
- 1:1 dilution of STD-4 with internal standard solution-2
- STD-2:
- 1:1 dilution of STD-3 with internal standard solution-2
- STD-1:
- 2:3 dilution of STD-2 with internal standard solution-2
| Description | NDMA concentration (µg/mL) | NDEA concentration (µg/mL) | NDMA-d6 concentration (µg/mL) |
|---|---|---|---|
| STD-1 | 0.002 | 0.001 | 0.2 |
| STD-2 | 0.005 | 0.0025 | 0.2 |
| STD-3 | 0.01 | 0.005 | 0.2 |
| STD-4 | 0.02 | 0.01 | 0.2 |
| STD-5 | 0.05 | 0.025 | 0.2 |
| STD-6 | 0.1 | 0.05 | 0.2 |
| STD-7 | 0.2 | 0.1 | 0.2 |
| STD-8 | 0.3 | 0.15 | 0.2 |
| STD-9 | 0.5 | 0.25 | 0.2 |
| STD-10 | 1 | 0.5 | 0.2 |
| STD-11 | 2 | 1 | 0.2 |
| STD-12 | 4 | 2 | 0.2 |
For NDMA, STD-1 to STD-6 are used as working range from 0.002 - 0.1 µg/mL, and STD-6 to STD-12 are used as working range from 0.1 - 4.0 µg/mL.
For NDEA, STD-1 to STD-5 are used as working range from 0.001 - 0.025 µg/mL, and STD-5 to STD-11 are used as working range from 0.025 - 1.0 µg/mL.
The working ranges of NDMA and NDEA can be adjusted as needed.
Sample Preparation
For finished product:
Weigh NLT 20 tablets and calculate average tablet weight. Carefully grind NLT 20 tablets into fine powder using a mortar and pestle.
Prepare triplicate samples for each product. Accurately weigh an amount equivalent to 250 mg of drug substance of the homogenized sample powder into a screw cap round bottom glass tube.
Using an automatic pipette, add 5 mL of NDMA-d6 internal standard solution-2 to each sample tube. Tightly cap the tubes, sonicate for 5 minutes, and then vortex the rack of tubes on the multi-tube vortex mixer at 2000 rpm for five minutes.
Centrifuge the tubes for at least 5 minutes at 1500 rpm. Carefully remove the tubes from the centrifuge. Use a Pasteur pipette to transfer an aliquot from each tube to a 2 mL GC vial and cap.
Note: Method accuracy was assessed by recovery studies. Valsartan, irbesartan and losartan finished products were spiked with reference standard solution in the following way:
- For samples with NDMA above 0.3 ppm and/or NDEA above 0.08 ppm:
- Spike sample solution with the reference standard solution at concentration level close to sample concentration and calculate recovery.
- For samples with NDMA below 0.3 ppm and/or NDEA below 0.08 ppm:
- Spike sample solution with STD-3 (1:1) to get solution containing 0.05 ppm of NDMA and 0.025 ppm of NDEA. Check S/N and calculate the LOD and LOQ.
For drug substance:
Prepare triplicate samples for each substance. Accurately weigh 250 mg of the homogenized sample powder into a screw cap round bottom glass tube.
Continue as per the instructions above for finished product. Spiking to determine method accuracy is recommended.
5. Instrument operating parameters:
Suggested GC parameters:
Injector Settings:
- Injector mode:
- Pulsed Splitless
- Injector temperature:
- 240°C
- Flow rate:
- 1.8 mL/min
- Septum purge flow:
- 3 mL/min
- Purge Flow:
- 50 mL/min after 0.75 minutes
- Injection volume:
- 2.0 µL
- Oven program:
- Initial Temp: 60°C
Hold: 2 minutes
| Ramp # | Rate (°C/min) | Final temp (°C) | Hold time (min) |
|---|---|---|---|
| 1 | 5 | 130 | 0 |
| 2 | 40 | 240 | 5 |
| Total run time: 24 minutes | |||
Suggested MS settings
- MS transfer line (aux. temp):
- 250°C
- Ion source:
- EI
- Source temperature:
- 250 °C
- Solvent delay:
- 6 minutes
- Stop time:
- 15 minutes
- Quench gas:
- Helium at 2.25 mL/min
- Collision gas:
- Nitrogen at 1.5 mL/min
| Analyte | Retention time (min) | Segment | Retention time window (min) | Precursor ion (m/z) | Product ion (m/z) | CE (V) |
Resolution | Dwell (ms) |
|---|---|---|---|---|---|---|---|---|
| NDMA-d6 (ISTD) | 7.8 | 1 | 7.5-8.1 | 80 | 50 | 5 | wide/wide | 100 |
| NDMA | 7.8 | 1 | 7.5-8.1 | 74 | 42 | 15 | wide/wide | 100 |
| 74 | 44 | 4 | 100 | |||||
| NDEA | 12.7 | 2 | 12.4-13.0 | 102 | 44 | 12 | wide/wide | 150 |
| 102 | 85 | 2 | 150 |
6. System suitability
The coefficient of determination (R2) for each calibration curve is NLT 0.995.
The signal-to-noise of the STD-1 (NDMA = 0.002 µg/mL; NDEA = 0.001 µg/mL) solution should be NLT 10.
7. Calculation
Construct calibration curves for NDMA and NDEA by plotting the ratio of response factor (NDMA or NDEA peak area divided by internal standard peak area) against standard concentration (µg/mL). Using the slopes and intercepts of the calibration curves, determine the content of NDMA and NDEA in each sample using the following equations.
For finished product:
The results, in ppm relative to the declared amount of sartan drug substance in the product, are given by:
Equation 1
![(ppm) = [(y-b)÷m] x AVGwt x V ÷ Wtspl ÷ LC](/content/dam/hc-sc/images/services/drug-and-health-products/compliance-enforcement/information-health-product/nitrosamine-impurities/test-methods/math1.jpg)
Where,
- y =
- ratio of peak area of NDMA or NDEA to peak area of NDMA-d6
- b =
- intercept of the linear curve
- m =
- slope of the linear curve
- Wtspl =
- sample weight (g)
- AVGwt =
- average tablet weight (g)
- LC =
- label claim of sample (g)
- V =
- 5 mL (volume)
Text description
Parts per million equals y minus b over m, which is the difference between the ratio of the peak area of the impurity to peak area of internal standard minus the intercept of the linear curve over the slope of the linear curve. This value is multiplied by average tablet weight, then multiplied by the volume, divided by the sample weight and then divided by the label claim of the sample.
For drug substance:
The results, in ppm relative to the drug substance being tested, are given by:
Equation 2
![(ppm) = [(y-b)÷m] x V ÷ Wtspl](/content/dam/hc-sc/images/services/drug-and-health-products/compliance-enforcement/information-health-product/nitrosamine-impurities/test-methods/math2.jpg)
Where,
- y =
- Ratio of Peak Area of NDMA or NDEA to Peak Area of NDMA-d6
- b =
- intercept of the linear curve
- m =
- slope of the linear curve
- Wtspl =
- sample weight (g)
- V =
- 5 mL (volume)
Text Description
Parts per million equals y minus b over m, which is the difference between the ratio of the peak area of the impurity to peak area of internal standard minus the intercept of the linear curve over the slope of the linear curve. This value is multiplied by the volume and then divided by the weight of the sample.
8. LOD and LOQ results
LOD/LOQ can be calculated using the S/N of the spiked sample solution (spiked with STD-3 at 1:1).
Theoretical LOD/LOQ:
If no spiked results are available, the theoretical LODs and LOQs can be calculated by using the S/N of STD-1 (NDMA: 0.002 µg/mL; NDEA 0.001 µg/mL).
For reference, the theoretical LOD/LOQ results at Health Canada are as follows:
| Drug substance conc. µg/mL | NDMA | NDEA | ||||||
|---|---|---|---|---|---|---|---|---|
| µg/mL | S/N | LOD (calc.) ppm | LOQ (calc.) ppm | µg/mL | S/N | LOD (calc.) ppm | LOQ (calc.) ppm | |
| 50 | 0.002 | 74 | 0.002 | 0.0054 | 0.001 | 55 | 0.002 | 0.0073 |
9. Sample chromatograms
Figure 1
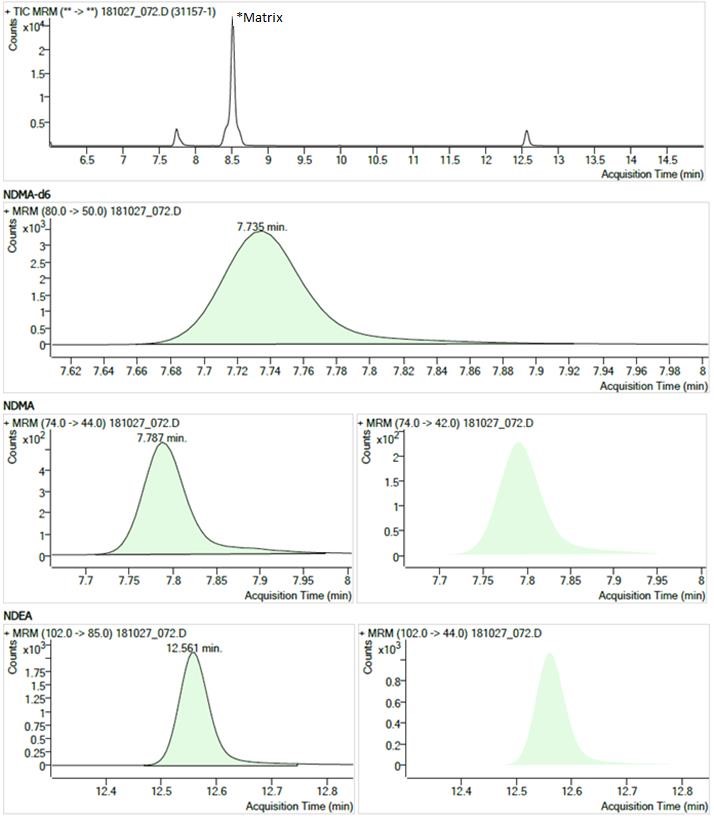
Text description
The figure shows chromatograms of a sample showing typical peaks for NDMA and NDEA. The chromatograms are arranged in 4 rows.
- The first row shows the Total Ion Current chromatogram from 6.0 to 15.0 minutes. There is a large peak at 8.5 minutes (labelled "matrix") and smaller peaks at 7.7 minutes (NDMA, NDMA-d6) and 12.6 minutes (NDEA).
- The second row shows a Multiple Reaction Monitoring chromatogram (m/z 80.0 → 50.0) with a single peak at 7.735 minutes for the NDMA-d6 internal standard.
- The third row shows two Multiple Reaction Monitoring chromatograms (m/z 74.0 → 44.0 and m/z 74.0 → 42.0) each with a single peak at 7.787 minutes for NDMA.
- The fourth row shows two Multiple Reaction Monitoring chromatograms (m/z 102.0 → 85.0 and m/z 102.0 → 44.0) each with a single peak at 12.561 minutes for NDEA.
Figure 2. Chromatogram of STD-1
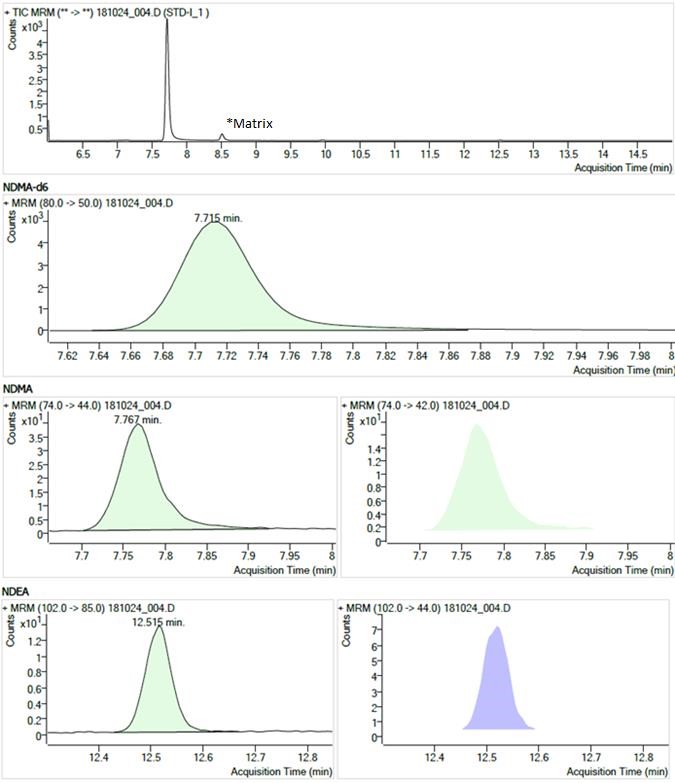
Text description
The figure shows chromatograms of the STD-1 standard solution. The chromatograms are arranged in 4 rows.
- The first row shows the Total Ion Current chromatogram from 6.0 to 15.0 minutes. There is a large peak at 7.7 minutes (NDMA, NDMA-d6) and a small peak at 8.5 minutes (labelled "matrix").
- The second row shows a Multiple Reaction Monitoring chromatogram (m/z 80.0 → 50.0) with a single peak at 7.715 minutes for the NDMA-d6 internal standard.
- The third row shows two Multiple Reaction Monitoring chromatograms (m/z 74.0 → 44.0 and m/z 74.0 → 42.0) each with a single peak at 7.767 minutes for NDMA.
- The fourth row shows two Multiple Reaction Monitoring chromatograms (m/z 102.0 → 85.0 and m/z 102.0 → 44.0) each with a single peak at 12.515 minutes for NDEA.
Test method for ranitidine products
Determination of N-nitrosodimethylamine (NDMA) in ranitidine products by UPLC-MS/MS
1. Principle and scope
The present method has been developed to detect and quantify N-nitrosodimethylamine
(NDMA) in ranitidine products by UPLC-tandem mass spectrometer (UPLC-MS/MS).
2. Reagents and reference standards
- NDMA, N-nitrosodimethylamine solution, 200 ppm, (CAS #62-75-9)
- Methanol, LC-MS grade (CAS #67-56-1)
- Formic acid, LC-MS grade (CAS #64-18-6)
- De-ionized water
3. Instrument/Equipment
- Waters UPLC-TQ-S micro with APCI source or equivalent
- Column: ACQUITY UPLC HSS T3 Column, 100Å, 1.8 µm, 3 mm x 150 mm or equivalent.
- 16 x 125 mm screw cap glass tubes
- 2.0 mL micro centrifuge tubes
- Eppendorf pipettes, various volumes, or equivalent
- Analytical balance
- Volumetric flasks (class A), various volumes, or equivalent
- Vortex mixer, single and multi-tube
- Mortar and pestle
- Ultrasonic water bath
- HPLC vials
- Centrifuge
4. Preparation of solutions
Storage
Calibration and sample solutions are stored in refrigerator.
Mobile Phase Preparation
- Mobile Phase A: 0.1% formic acid in water
- Preparation: Mix formic acid and water at a volume ratio of 1:1000.
- Mobile Phase B: 0.1% formic acid in methanol
- Preparation: Mix formic acid and methanol at a volume ratio of 1:1000.
Diluent Preparation
- Diluent: 5% methanol in water
- Preparation: Mix methanol and water at a volume ratio of 5:95.
Standard Solutions
- Reference standard stock solutions (as purchased)
- NDMA standard solution in methanol (200 ppm)
Calibration standard solutions
- STD-1:
- Transfer 50 µL of NDMA reference standard stock solution (200 ppm) into a 50 mL volumetric flask, dilute to volume with diluent. Mix well. This solution will be used as system suitability test and system drift check.
- STD-2:
- 1:1 dilution of STD-1 with diluent. Mix well.
- STD-3:
- 1:1 dilution of STD-2 with diluent. Mix well.
- STD-4:
- 1:1 dilution of STD-3 with diluent. Mix well.
- STD-5:
- 2:3 dilution of STD-4 with diluent. Mix well.
- STD-6:
- 1:1 dilution of STD-5 with diluent. Mix well.
- STD-7:
- 1:1 dilution of STD-6 with diluent. Mix well.
- STD-8:
- 2:3 dilution of STD-7 with diluent. Mix well.
- STD-9:
- 3:1 dilution of STD-8 with diluent. Mix well (LOD).
| Calibration standard solution | NDMA concentration (ng/mL) |
|---|---|
| STD-1 | 200 |
| STD-2 | 100 |
| STD-3 | 50 |
| STD-4 | 25 |
| STD-5 | 10 |
| STD-6 | 5 |
| STD-7 | 2.5 |
| STD-8 | 1 |
| STD-9 | 0.75 |
R2 for calibration curve should be NLT 0.99.
Sample Preparation
- Weigh at least 20 tablets, calculate average weight per tablet.
- Carefully grind the weighed tablets into fine powder using mortar and pestle.
Suggested sample preparation:
- Prepare in triplicate for each sample.
- Accurately weigh homogenized sample powder equivalent to about 150 mg of the API into separate glass centrifuge tubes.
- Add 5.0 mL of diluent to each sample tube. Tightly cap the tubes, sonicate for 10 minutes, and then vortex at 2500 rpm for 5 minutes.
- Transfer 2.0 mL solution to 2 mL centrifuge tube, centrifuge at 12 000 rpm for 5 minutes. Carefully remove the tubes from the centrifuge.
- Filter the supernatant using 0.2 µm PTFE syringe filter, discard the first 0.5 mL of filtrate. Collect and transfer the filtered sample solution into a 2 mL HPLC vial and cap.
The concentration of samples (weight and/or volume) may be modified as required.
Suggested Recovery Spiking:
Spike samples: Spike sample solutions with reference standard solution in triplicate and check recoveries.
5. Instrument operating parameters
Suggested UPLC parameters:
- Flow rate:
- 0.4 mL/min
- Injection volume:
- 10.0 µL
- Run time:
- 12.5 minutes
| Time (min) | Mobile phase A% | Mobile phase B% |
|---|---|---|
| 0 | 95 | 5 |
| 5 | 95 | 5 |
| 7 | 0 | 100 |
| 10 | 0 | 100 |
| 10.1 | 95 | 5 |
| 12.5 | 95 | 5 |
Suggested MS Parameters:
- APCI probe temperature:
- 450°C
- Source temperature:
- 150°C
- Corona:
- 4.0 kV
- Type:
- MRM
- Ion mode:
- Positive
- Span (Da):
- 0.3
- Start time:
- 3.3 minutes
- End time:
- 5.0 minutes
Run events:
- Event 1:
- 0.00 min flow state: Waste
- Event 2:
- 3.30 min flow state: LC
- Event 3:
- 5.00 min flow state: Waste
Note: Flow state setting may be adjusted as necessary depending on the system to divert ranitidine to waste.
MRM Parameters:
| Name | Parent ion (m/z) | Daughter ion (m/z | Dwell (s) | Cone (V) | Collision cell (eV) |
|---|---|---|---|---|---|
| NDMA | 75.1 | 42.9 | 0.3 | 22 | 10 |
| NDMA | 75.1 | 58.1 | 0.3 | 22 | 10 |
Note: Transition 75.1→58.1 is used for quantification; transition 75.1→42.9 usually has a higher background. It is possible to quantify by using another parent ion/daughter ion pair transition.
6. Calculation
The results, in ppm relative to the declared amount of drug substance in the product, are given by:
NDMA (ppm) = [(y-b)÷m] x AVGwt x V ÷ Wtspl ÷ LC
Where,
- y =
- peak area of NDMA
- b =
- intercept of the calibration curve
- m =
- slope of the calibration curve
- AVGwt =
- average tablet weight (mg)
- V =
- 5 mL (volume)
- Wtspl =
- sample weight (mg)
- LC =
- label claim of sample (mg)
Equation - Text Description
NDMA in parts per million equals y minus b over m, which is the difference between the peak area of the impurity minus the intercept of the linear curve over the slope of the linear curve. This value is multiplied by average tablet weight, then multiplied by the volume, divided by the sample weight and then divided by the label claim of the sample.
7. Range, limit of detection (LOD), and limit of quantification (LOQ)
| N/A | NDMA (ng/mL) | NDMA (ppm)Table 3 Footnote * |
|---|---|---|
| LOQ | 1 | 0.033 |
| LOD | 0.75 | 0.025 |
| Range | 1 – 200 | 0.03 – 6.7 |
|
||
8. Example of calibration curve and chromatograms
Figure 1. Calibration curve
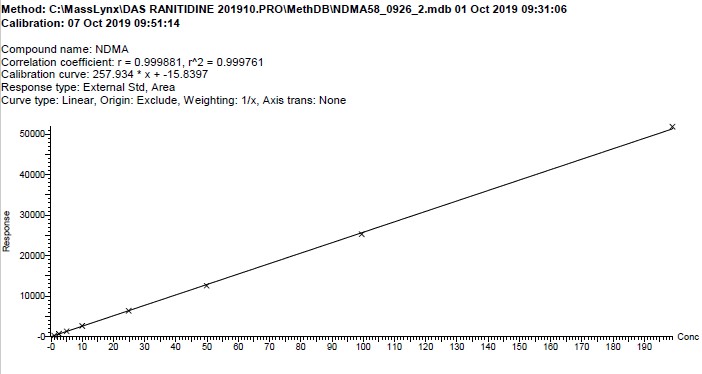
Text description
The figure shows a calibration curve with concentration of the NDMA standard solutions on the x axis and response (in arbitrary units) on the y axis. There is a data point for each of the nine standard solutions listed in the method, connected by a straight line. The correlation coefficient is r2 = 0.999761, and the calibration curve equation is y = 257.934 x – 15.8397.
Figure 2. Chromatograms of 200 ppb standard: MRM and UV
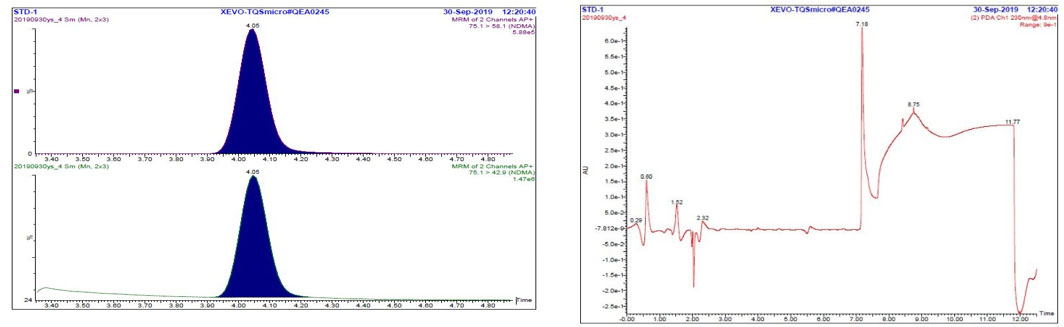
Text description
The figure includes two panels. The panel on the left shows two Multiple Reaction Monitoring chromatograms (m/z 75.1 → 58.1 and m/z 75.1 → 42.9) of the STD-1 standard solution, each with a single peak at 4.05 minutes for NDMA. The panel on the right shows the UV chromatogram of the STD-1 standard solution. The portion of the chromatogram between 3.3 and 5.0 minutes (corresponding to the period when flow is routed to the MS detector) is relatively flat, while the rest of the chromatogram contains multiple peaks and baseline shifts.
Figure 3. Chromatogram of sample: MRM and UV
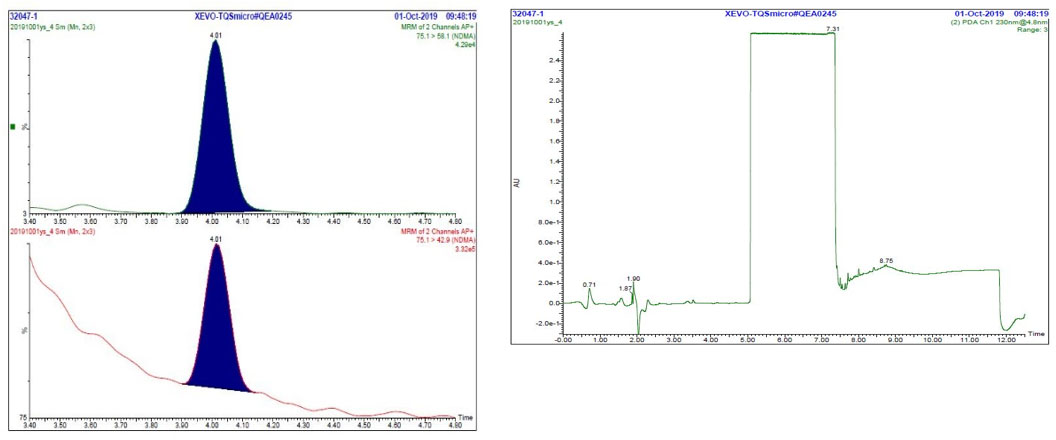
Text description
The figure includes two panels. The panel on the left shows two Multiple Reaction Monitoring chromatograms (m/z 75.1 → 58.1 and m/z 75.1 → 42.9) of a typical sample solution, each with a single peak at 4.01 minutes for NDMA. The panel on the right shows the UV chromatogram of a typical sample solution. The portion of the chromatogram between 3.3 and 5.0 minutes (corresponding to the period when flow is routed to the MS detector) is relatively flat, while the rest of the chromatogram contains multiple peaks and baseline shifts.
Test methods for metformin products
Determination of nitrosamine impurities in metformin products by UPLC-MS/MS
1. Principle and scope
The present method has been developed to detect and quantify the following nitrosamine impurities in Metformin products by UPLC with tandem mass spectrometer (UPLC-MS/MS): N-nitrosodimethylamine (NDMA), N-nitrosodiethylamine (NDEA), N-nitrosodiisopropylamine (NDIPA), N-ethyl-N-nitroso-isopropylamine (NEIPA), N-nitroso-di-N-butylamine (NDBA) and N-Nitroso-N-methyl-4-aminobutyric acid (NMBA).
2. Reagents and reference standards
- NDMA, N-Nitrosodimethylamine solution (200 ppm), CAS # 62-75-9
- NDEA, N-Nitrosodiethylamine solution (100 ppm), CAS # 55-18-5
- NEIPA, N-ethyl-N-nitroso-isopropylamine solution (100 ppm), CAS # 16339-04-01
- NDIPA, N-Nitrosodiisopropylamine solution (100 ppm), CAS # 601-77-4
- NDBA, N-Nitroso-di-n-butylamine solution (100 ppm), CAS # 924-16-3
- NMBA, N-Nitroso-N-methyl-4-aminobutyric acid, CAS # 61445-55-4
- Methanol, LC-MS grade, CAS # 67-56-1
- Formic Acid, LC-MS grade, CAS # 64-18-6
- De-ionized water
3. Instrument/Equipment
- Waters UPLC-TQ-S micro with APCI source or equivalent.
- Column: ACQUITY UPLC HSS T3 Column, 100 Å, 1.8 µm, 3 mm X 150 mm or equivalent
- 16 x 125 mm screw cap glass tubes
- 2.0 mL micro centrifuge tubes
- Eppendorf pipettes, various volumes, or equivalent
- Analytical balance
- Volumetric Flasks (class A), various volumes, or equivalent
- Vortex mixer, single and multi-tube
- Mortar and pestle
- Ultrasonic Water bath
- HPLC vials
- Centrifuges
4. Preparation of solutions
4.1 Storage
Calibration and sample solutions are stored in refrigerator.
4.2 Mobile phase preparation
- Mobile Phase A: 0.1% formic acid in water
- Preparation: Mix formic acid and water at a volume ratio of 1:1000.
- Mobile Phase B: 0.1% formic acid in methanol
- Preparation: Mix formic acid and methanol at a volume ratio of 1:1000.
4.3 Diluent preparation
- Diluent: 5% Methanol in water
- Preparation: Mix methanol and water at a volume ratio of 5:95.
4.4 Standard solutions
Reference Standard Stock Solutions (as purchased)
- NDMA Standard Solution in Methanol (200 ppm)
- NDEA Standard Solution in Methanol (100 ppm)
- NEIPA Standard Solution in Methanol (100 ppm)
- NDIPA Standard Solution in Methanol (100 ppm)
- NDBA Standard Solution in Methanol (100 ppm)
Suggested NMBA Stock Standard Solution (100 ppm) preparation
Accurately weigh 2.0 mg of NMBA to 20 mL volumetric flask. Dissolve and dilute to volume with methanol.
Note: The concentration of NMBA stock standard solution can be varied. The dilution for the preparation of the Intermediate Stock Standard Solution -1 and -2 can be calculated and adjusted accordingly to make the final concentration close to 200 ppb and 5 ppb.
Intermediate Stock Standard Solution-1 (200 ppb) preparation
Transfer 100 µL of NDMA reference standard stock solution (200 ppm), 200 µL of the other Nitrosamine reference standard stock solutions (100 ppm) and 200 µL of NMBA Stock Standard Solution (100 ppm) into a 100 mL volumetric flask, dilute to volume with diluent. Mix well.
Intermediate Stock Standard Solution-2 (5 ppb) preparation (STD-4)
Transfer 500 µL of Intermediate Stock Standard Solution-1 (200 ppb) into a 20 mL volumetric flask, dilute to volume with diluent. Mix well.
| STD solution | Working solution | Working solution Conc. (ppb) | Volume of working solution (mL) | Total vol. (mL) | Nitrosamine STD conc. (ppb) |
|---|---|---|---|---|---|
| LOD | Intermediate Stock Standard Solution-2 | 5 | 0.5 | 5 | 0.5 |
| LOQ | Intermediate Stock Standard Solution-2 | 5 | 0.75 | 5 | 0.75 |
| STD-1 | Intermediate Stock Standard Solution-2 | 5 | 1 | 5 | 1 |
| STD-2 | Intermediate Stock Standard Solution-2 | 5 | 2 | 5 | 2 |
| STD-3 | Intermediate Stock Standard Solution-2 | 5 | 3 | 5 | 3 |
| STD-4 | Intermediate Stock Standard Solution-2 | 5 | 5 | ||
| STD-5 | Intermediate Stock Standard Solution-1 | 200 | 0.25 | 5 | 10 |
| STD-6 | Intermediate Stock Standard Solution-1 | 200 | 0.375 | 5 | 15 |
| STD-7 | Intermediate Stock Standard Solution-1 | 200 | 0.5 | 5 | 20 |
| STD-8 | Intermediate Stock Standard Solution-1 | 200 | 0.625 | 5 | 25 |
| STD-9 | Intermediate Stock Standard Solution-1 | 200 | 1.25 | 5 | 50 |
R2 for calibration curve should be NLT 0.995.
STD-9 will be used for system suitability and system drift.
4.5 Sample preparation
- Weigh at least 20 tablets, calculate average weight per tablet.
- Carefully grind the weighed tablets into fine powder using mortar and pestle.
Suggested Sample Preparation:
- Prepare in triplicate for each sample.
- Accurately weigh homogenized sample powder equivalent to about 500 mg of the Metformin API into separate glass centrifuge tubes.
- Add 10.0 mL of diluent to each sample tube. Tightly cap the tubes, sonicate for 20 minutes, and then vortex at 2500 rpm for 10 minutes.
- Centrifuge sample at 2500 rpm for 10 minutes.
- Transfer 2.0 mL of the supernatant to 2 mL centrifuge tube, centrifuge at 12 000 rpm for 5 minutes. Carefully remove the tubes from the centrifuge.
- Transfer sample solution to HPLC vials for analysis.
The concentration (weight and/or volume) of samples may be modified as required.
4.6 Suggested recovery spiking:
- If no nitrosamines were found in the sample, prepare one spiked sample solution and check S/N. Otherwise, prepare spiking sample in triplicate.
- Accurately weigh homogenized sample powder equivalent to about 500 mg of the Metformin API into separate glass centrifuge tubes.
- Add 10.0 mL of Diluent, then 125 µL of Intermediate Stock Standard solution -1 (200 ppb), to each sample tube. Tightly cap the tubes, sonicate for 20 minutes, then vortex at 2500 rpm for 10 minutes.
- Centrifuge samples at 2500 rpm for 10 minutes.
- Transfer 2.0 mL solution to 2 mL centrifuge tube, centrifuge at 12 000 rpm for 5 minutes. Carefully remove the tubes from the centrifuge.
- Transfer sample solution to HPLC vials for analysis.
5. Instrument operating parameters
5.1 Suggested UPLC parameters:
- Flow Rate:
- 0.4 mL/min
- Injection Volume:
- 10.0 µL
- Run Time:
- 30 min
| Time (min) | Mobile phase A % | Mobile phase B % |
|---|---|---|
| 0 | 95 | 5 |
| 5 | 95 | 5 |
| 22 | 0 | 100 |
| 27 | 0 | 100 |
| 28 | 95 | 5 |
| 30 | 95 | 5 |
5.2 Suggested MS parameters:
- APCI probe Temp:
- 400°C
- Source Temperature:
- 150°C
- Corona:
- 4.0 kV
- Type:
- MRM
- Ion mode:
- Positive
- Span (Da):
- 0
- Start time:
- 3.5 min
- End time:
- 21 min
Run Events:
- Event 1: 0.00 min
- Flow State: Waste
- Event 2: 3.5 min
- Flow State: LC
- Event 3: 21 min
- Flow State: Waste
Note: Flow state setting may be adjusted as necessary depending on the system to divert metformin to waste.
5.3 MRM parameters:
| Name | Time period (min) | Parent ion (m/z) | Daughter ion (m/z) | Dwell (s) | Cone (V) | Collision cell (eV) |
|---|---|---|---|---|---|---|
| NDMA | 3.5 – 6.0 | 75.0 | 43.1 | 0.1 | 30 | 10 |
| 75.0 | 58.0Table 11 Footnote * | 0.1 | 30 | 8 | ||
| NMBA | 6.0 – 10.0 | 146.9 | 44.0 | 0.1 | 22 | 12 |
| 146.9 | 117.0Table 11 Footnote * | 0.1 | 22 | 4 | ||
| NDEA | 10.0 – 13.0 | 103.0 | 47.1 | 0.1 | 30 | 12 |
| 103.0 | 75.0Table 11 Footnote * | 0.1 | 30 | 10 | ||
| NEIPA | 12.8 – 15.0 | 117.0 | 47.0 | 0.1 | 26 | 14 |
| 117.0 | 75.0Table 11 Footnote * | 0.1 | 26 | 10 | ||
| NDIPA | 14.6 – 17.0 | 131.0 | 43.1 | 0.1 | 26 | 10 |
| 131.0 | 89.0Table 11 Footnote * | 0.1 | 26 | 6 | ||
| NDBA | 17.0 – 21.0 | 159.0 | 57.1 | 0.1 | 32 | 12 |
| 159.0 | 103.0Table 11 Footnote * | 0.1 | 32 | 10 | ||
|
||||||
6. Calculation
The results, in ppm relative to the declared amount of drug substance in the product, are given by:
Nitrosamine impurity (ppm) = [(y-b)÷m] × AVGwt × V ÷ Wtspl ÷ LC
Where: Nitrosamine impurity refers to NDMA, NDEA, NEIPA, NDIPA NDBA or NMBA
- y =
- Peak Area of the nitrosamine impurity
- b =
- Intercept of the Linear Curve
- m =
- Slope of the Linear Curve
- AVGwt =
- Average Tablet Weight (mg)
- V =
- 10 mL (volume)
- Wtspl =
- Sample Weight (mg)
- LC =
- Label claim of Sample (mg)
Equation - Text Description
Nitrosamine impurity in parts per million (ppm) equals y minus b over m, which is the difference between the peak area minus the intercept of the calibration curve over the slope of the calibration curve. This value is multiplied by average tablet weight, then multiplied by the volume, divided by the sample weight and then divided by the label claim of the sample.
7. Range, limit of detection (LOD) and limit of quantification (LOQ)
| Comp. name | Conc. (ng/mL) | Conc. (ppmTable 12 Footnote *) | ||||
|---|---|---|---|---|---|---|
| LOD | LOQ | Range | LOD | LOQ | Range | |
| NDMA | 0.5 | 0.75 | 0.75 – 50 | 0.010 | 0.015 | 0.015 – 1.0 |
| NDEA | 0.1 | 0.5 | 0.5 – 50 | 0.002 | 0.010 | 0.010 – 1.0 |
| NEIPA | 0.1 | 0.5 | 0.5 – 50 | 0.002 | 0.010 | 0.010 – 1.0 |
| NDIPA | 0.1 | 0.5 | 0.5 – 50 | 0.002 | 0.010 | 0.010 – 1.0 |
| NDBA | 0.1 | 0.5 | 0.5 – 50 | 0.002 | 0.010 | 0.010 – 1.0 |
| NMBA | 0.25 | 0.5 | 0.5 – 50 | 0.005 | 0.010 | 0.010 – 1.0 |
|
||||||
8. Example chromatograms
Figure 1. MRM Chromatogram of 5 ppb standard - NDMA
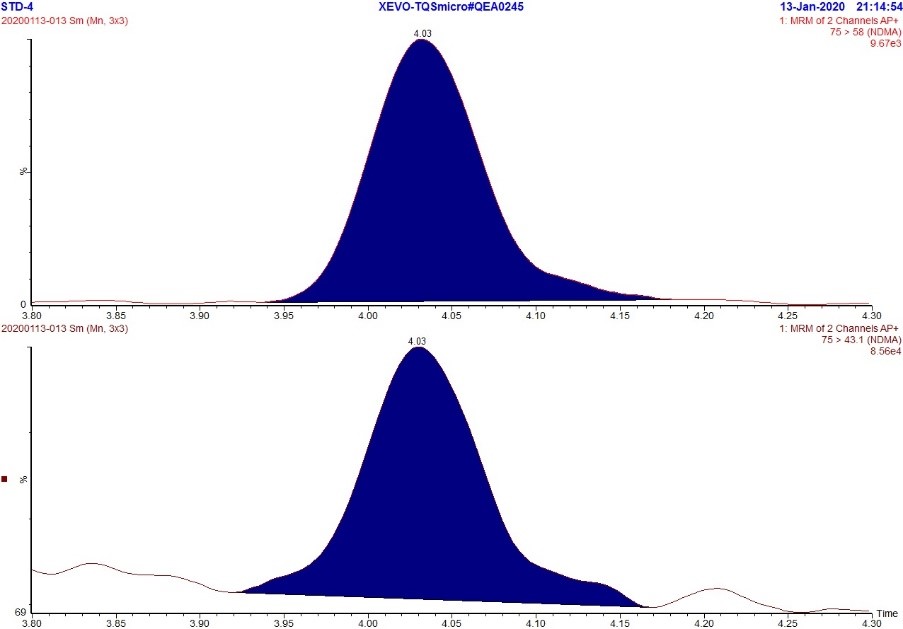
Text Description
The figure includes two rows. The top row shows an MRM chromatogram (m/z 75.0 → 58.0) of the 5 ppb NDMA standard while the bottom row shows an MRM chromatogram (m/z 75.0 → 43.1) of the 5 ppb NDMA standard. Each chromatogram displays a single peak at approximately 4.03 minutes.
Figure 2. MRM Chromatogram of 5 ppb standard - NMBA
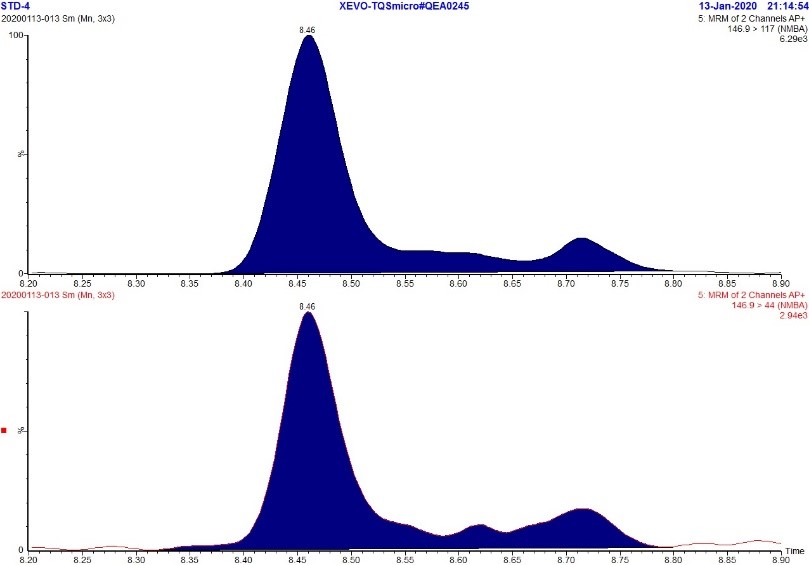
Text Description
The figure includes two rows. The top row shows an MRM chromatogram (m/z 146.9 → 117.0) of the 5 ppb NMBA standard while the bottom row shows an MRM chromatogram (m/z 146.9 → 44.0) of the 5 ppb NMBA standard. Each chromatograph displays a large peak at approximately 8.5 minutes and two smaller peaks at approximately 8.6 and 8.7 minutes. The presence of these extra peaks are likely due to the asymmetric structure of NMBA.
Figure 3. MRM Chromatogram of 5ppb standard - NDEA
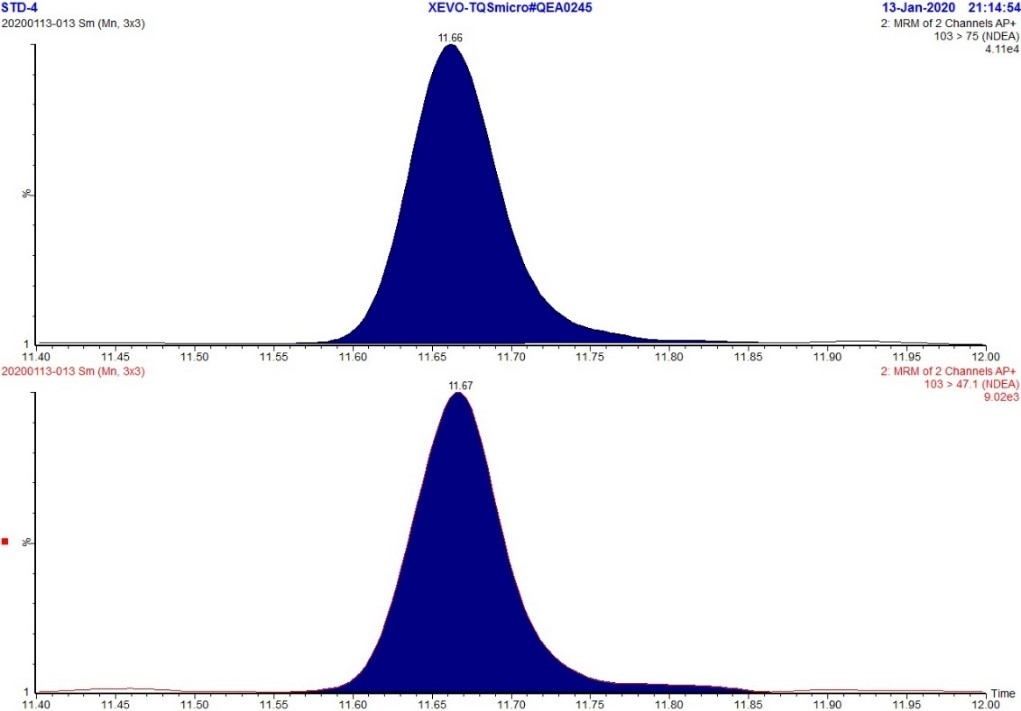
Text Description
The figure includes two rows. The top row shows an MRM chromatogram (m/z 103.0 → 75.0) of the 5 ppb NDEA standard while the bottom row shows an MRM chromatogram (m/z 103.0 → 47.1) of the 5 ppb NDEA standard. Each chromatogram displays a single peak at approximately 11.7 minutes.
Figure 4. MRM Chromatogram of 5 ppb standard – NEIPA
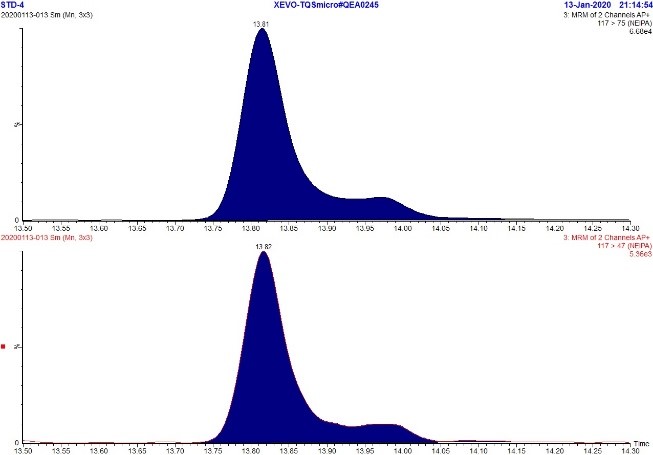
Text Description
The figure includes two rows. The top row shows an MRM chromatogram (m/z 117.0.0 → 75.0) of the 5 ppb NEIPA standard while the bottom row shows an MRM chromatogram (m/z 117.0 → 47.0) of the 5 ppb NEIPA standard. Each chromatograph displays a large peak at approximately 13.8 minutes and a smaller shoulder peak at approximately 14.0 minutes. The presence of the shoulder is likely due to the asymmetric structure of NEIPA.
Figure 5. MRM Chromatogram of 5 ppb standard - NDIPA
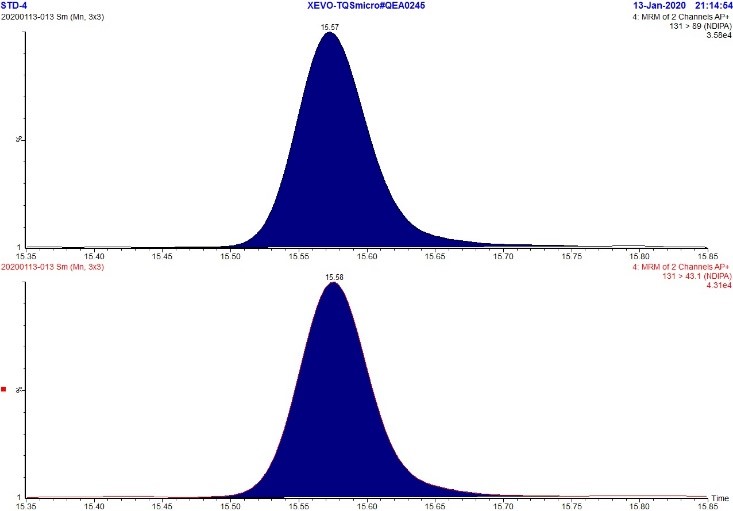
Text Description
The figure includes two rows. The top row shows an MRM chromatogram (m/z 131.0 → 89.0) of the 5 ppb NDIPA standard while the bottom row shows an MRM chromatogram (m/z 131.0 → 43.1) of the 5 ppb NDIPA standard. Each chromatograph displays a single peak at approximately 15.6 minutes.
Figure 6. MRM Chromatogram of 5 ppb standard - NDBA
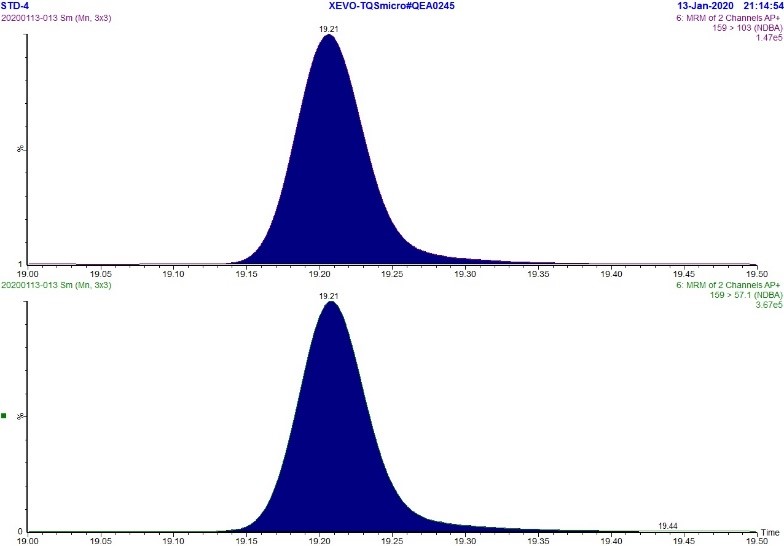
Text Description
The figure includes two rows. The top row shows an MRM chromatogram (m/z 159.0 → 103.0) of the 5 ppb NDBA standard while the bottom row shows an MRM chromatogram (m/z 159.0 → 57.1) of the 5 ppb NDBA standard. Each chromatograph displays a single peak at approximately 19.2 minutes.
Determination of N-nitrosodimethylamine Impurity in Metformin Products by GC-MS/MS
1. Principle and scope
The present method has been developed to detect and quantify N-nitrosodimethylamine (NDMA) impurity in Metformin products by GC-MS/MS.
2. Reagents and reference standards
- NDMA, N-Nitrosodimethylamine solution (200 ppm), CAS # 62-75-9
- NDMA-d6, N-nitrosodimethylamine-d6 solution (1000ppm), CAS # 17829-05-9
- Dichloromethane, GC grade, CAS # 75-09-2
3. Instrument/Equipment
- Agilent GC 7890A with MSMS 7000 with EI source or equivalent
- Column: Agilent DB-624 30m x 0.32 µm x 1.8 µm or equivalent
- 16 x 125 mm screw cap glass tubes
- 2.0 mL micro centrifuge tubes
- Eppendorf pipettes, various volumes, or equivalent
- Analytical balance
- Volumetric Flasks (class A), various volumes, or equivalent
- Vortex mixer, single and multi-tube
- Mortar and pestle
- Ultrasonic Water bath
- GC vials
- Centrifuges
4. Preparation of solutions
4.1 Storage
Calibration and sample solutions are stored in freezer.
4.2 Standard solutions
Reference standard solutions (as purchased)
- NDMA Standard Solution in Methanol (200 ppm)
- NDMA-d6 Standard Solution in Methanol (1000 ppm)
NDMA stock solution-1 (1 ppm) preparation
Transfer 125 µL of NDMA reference standard solution (200 ppm) into a 25 mL volumetric flask, dilute to volume with Dichloromethane. Mix well.
Internal standard solution-1 (2 ppm) preparation
Transfer 100 µL of NDMA-d6 reference standard solution (1000 ppm) into a 50 mL volumetric flask, dilute to volume with Dichloromethane. Mix well.
Internal standard solution-2 (10 ppb) preparation
Transfer 2.5 mL of Internal Standard Solution-1 (2 ppm) into a 500 mL volumetric flask, dilute to volume with Dichloromethane. Mix well.
| STD solution | Volume of STD spiking solution (uL) |
Volume of ISTD-1(uL) |
Diluent | Volumetric flask (mL) |
NDMA STD conc. (ppb) |
ISTD conc. (ppb) |
|---|---|---|---|---|---|---|
| STD-1 | 500 (NDMA Stock Solution-1) | 50 | Dichloromethane | 10 | 50 | 10 |
| STD-2 | 250 (NDMA Stock Solution-1) | 50 | Dichloromethane | 10 | 25 | 10 |
| STD-3 | 100 (NDMA Stock Solution-1) | 50 | Dichloromethane | 10 | 10 | 10 |
| STD-4 | 50 (NDMA Stock Solution-1) | 50 | Dichloromethane | 10 | 5 | 10 |
| STD-5 | 25 (NDMA Stock Solution-1) | 50 | Dichloromethane | 10 | 2.5 | 10 |
| STD-6 | 50 (NDMA Stock Solution-1) | 250 | Dichloromethane | 50 | 1 | 10 |
| STD-7(LOQ) | 5000(STD-6) | 0 | ISTD-2 | 10 | 0.5 | 10 |
| LOD | 1000(STD-6) | 0 | ISTD-2 | 10 | 0.1 | 10 |
- R2 for calibration curve should be NLT 0.995.
- STD-1 will be used for system suitability and system drift.
4.3 Sample preparation
- Weigh at least 20 tablets, calculate average weight per tablet.
- Carefully grind the weighed tablets into fine powder using mortar and pestle.
Sample preparation:
- Prepare in triplicate for each sample.
- Accurately weigh homogenized sample powder equivalent to about 500 mg of the Metformin API into separate glass centrifuge tubes.
- Add 10.0 mL of Internal Standard Solution-2 to each sample tube. Tightly cap the tubes, sonicate for 20 minutes, and then vortex at 2500 rpm for 10 minutes.
- Centrifuge sample at 2500 rpm for 15 minutes.
- Transfer 2.0 mL of the supernatant to 2 mL centrifuge tube, centrifuge at 12 000 rpm for 5 minutes. Carefully remove the tubes from the centrifuge.
- Transfer sample solution to GC vials for analysis.
4.4 Recovery spiking:
- If no nitrosamine impurity is found in the sample, prepare one spiked sample solution and check S/N. Otherwise, prepare spiking sample in triplicate.
- Accurately weigh homogenized sample powder equivalent to about 500 mg of the Metformin API into separate glass centrifuge tubes.
- Add 10.0 mL of Internal Standard Solution-2. Add 25 µL of NDMA Standard Solution-1 (1 ppm) to each sample tube. Tightly cap the tubes, sonicate for 20 minutes, then vortex at 2500 rpm for 10 minutes.
- Centrifuge samples at 2500 rpm for 15 minutes.
- Transfer 2.0 mL solution to 2 mL centrifuge tube, centrifuge at 12 000 rpm for 5 minutes. Carefully remove the tubes from the centrifuge.
- Transfer sample solution to GC vials for analysis.
5. Instrument operating parameters
5.1 GC parameters:
Injector settings:
- Injector Mode:
- Pulsed Splitless
- Injector temperature:
- 240°C
- Flow Rate:
- 1.3 mL/min
- Septum Purge Flow:
- 10 mL/min
- Purge Flow:
- 50 mL/min after 1 minute
- Injection Volume:
- 2.0 µL
- Oven Program:
Initial temperature: - 60°C; Hold: 2 min
| Ramp# | Rate (°C /min) | Final temp (ºC) | Hold time (min) |
|---|---|---|---|
| 1 | 20 | 220 | 2 |
| 2 | 60 | 240 | 3 |
- Total Run Time:
- 15.33 min
5.2 MS parameters:
- MS transfer line (Auxiliary temperature):
- 240°C
- Ion Source:
- EI
- Source Temperature:
- 250°C
- Solvent delay:
- 4 min
- Stop time:
- 7 min
- Quench gas:
- Helium at 2.5 mL/min
- Collision gas:
- Nitrogen at 1.5 mL/min
5.3 MRM parameters:
| Name | Retention time (min) |
Precursor ion (m/z) | Product ion (m/z) | Left delta RT | Right delta RT | Resolution (MS1 and MS2) | CE | Dwell (ms) |
|---|---|---|---|---|---|---|---|---|
| NDMA | 5.8 | 74 | 42 | 1.0 | 1.2 | Unit/wide | 7 | 165.8 |
| 74 | 44Footnote * | 1.0 | 1.2 | Unit/wide | 4 | 165.8 | ||
| NDMA-d6 | 5.8 | 80.1 | 50.1 | 1.0 | 1.2 | Unit/wide | 5 | 165.8 |
Table notes
|
||||||||
6. Calculation
The results, in ppm relative to the declared amount of drug substance in the product, are given by:
Where:
Nitrosamine impurity, NDMA, (ppm) = [(y-b)÷m] × AVGwt × V ÷ Wtspl ÷ LC
- y =
- ratio of peak area of NDMA to peak area of NDMA-d6
- b =
- Intercept of the Linear Curve
- m =
- Slope of the Linear Curve
- Wtspl =
- Sample Weight (mg)
- AVGwt =
- Average Tablet Weight (mg)
- LC =
- Label claim of Sample (mg)
- V =
- 10 mL (volume)
Equation - Text Description
Nitrosamine impurity in parts per million (ppm) equals y minus b over m, which is the difference between the peak area minus the intercept of the calibration curve over the slope of the calibration curve. This value is multiplied by average tablet weight, then multiplied by the volume, divided by the sample weight and then divided by the label claim of the sample.
7. Range, limit of detection (LOD) and limit of quantification (LOQ)
| Comp. name | Conc. (ng/mL) | Conc. (ppmTable x Footnote *) | ||||
|---|---|---|---|---|---|---|
| LOD | LOQ | Range | LOD | LOQ | Range | |
| NDMA | 0.1 | 0.5 | 0.5-50 | 0.002 | 0.01 | 0.01-1.00 |
|
||||||
8. Example chromatograms
Figure 1. Chromatogram of STD-4 (1ppb NDMA standard)

Text Equivalent
The figure shows chromatograms of a sample showing typical peaks for NDMA and NDMA-d6. The chromatograms are arranged in three rows.
- The first row shows the Total Ion Chromatogram from 5.6 to 6.25 minutes. There is a large peak at 5.853 minutes (NDMA-d6) and another large peak at 5.872 minutes (NDMA).
- The second row shows a Multiple Reaction Monitoring chromatogram (m/z 74.0 → 44.0) with a peak at 5.872 minutes for NDMA.
- The third row shows a Multiple Reaction Monitoring chromatogram (m/z 80.1 → 50.1) with a single peak at 5.853 minutes for the NDMA-d6 internal standard.
Figure 2. Sample chromatogram
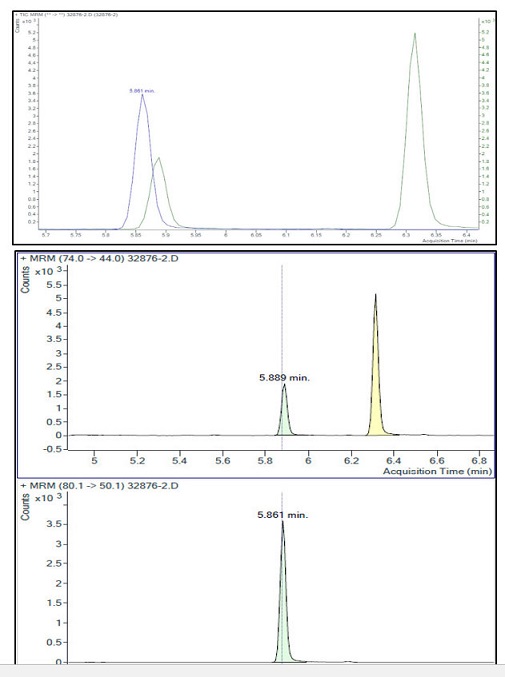
Text Equivalent
The figure shows chromatograms of a sample showing typical peaks for NDMA and NDMA-d6. The chromatograms are arranged in three rows.
- The first row shows the Total Ion Chromatogram from 5.7 to 6.4 minutes. There is a large peak at 5.861 minutes (NDMA-d6), a small peak at 5.889 minutes (NDMA), and a matrix related peak at 6.32 minutes.
- The second row shows a Multiple Reaction Monitoring chromatograms (m/z 74.0 → 44.0) with a peak at 5.889 minutes for NDMA and a large matrix related peak at 6.3 minutes.
- The third row shows a Multiple Reaction Monitoring chromatogram (m/z 80.1 → 50.1) with a single peak at 5.861 minutes for the NDMA-d6 internal standard.
Test results for sartans or angiotensin II receptor blockers (ARBs)
Health Canada has tested samples of ARBs on the Canadian market for NDMA and NDEA. The results, found in the table below, indicate:
- levels of NDMA or NDEA, if detected
- whether these levels exceed acceptable limits, based on a lifetime exposure
- whether the product was recalled
We will continue to assess new developments to determine whether more testing is necessary.
| Market authorization holder (Company) name | Product name and DIN | Strength (mg) |
Lot number | Expiry date | NDMA result ng/tablet |
NDEA result ng/tablet |
Recalled in Canada | Date added |
|---|---|---|---|---|---|---|---|---|
| Accel Pharma Inc. | ACCEL-CANDESARTAN DIN 02463784 |
32 | 1805003937 | 2020-02-29 | Not Detected | Not Detected | No | December 20, 2018 |
| Actavis Pharma Company | ACT VALSARTAN DIN 02337517 |
320 | K44166 | 2018-07-31 | 15242.72Table 1 Footnote 1 | 12.78 | Yes | December 20, 2018 |
| Actavis Pharma Company | ACT VALSARTAN DIN 02337517 |
320 | K45371 | 2018-10-31 | 10770.86Table 1 Footnote 1 | 186.67Table 1 Footnote 1 | Yes | December 20, 2018 |
| Actavis Pharma Company | ACT- OLMESARTAN DIN 02442205 |
40 | F83746 | 2020-03-31 | Not Detected | Not Detected | No | December 20, 2018 |
| Angita Pharma Inc. | AG-IRBESARTAN DIN 02474417 |
300 | IE317017AR | 2019-10-31 | Not Detected | Not Detected | No | December 20, 2018 |
| Apotex Inc. | APO-OLMESARTAN/HCTZ DIN 02453614 |
40/12.5 | NF7704 | 2019-02-28 | Not Detected | Not Detected | No | December 20, 2018 |
| Apotex Inc. | APO-OLMESARTAN/HCTZ DIN 02453614 |
40/12.5 | NN7635 | 2019-12-31 | Not Detected | Not Detected | No | December 20, 2018 |
| Apotex Inc. | APO-LOSARTAN/HCTZ DIN 02371235 |
50/12.5 | NL1445 | 2019-08-31 | Not Detected | Not Detected | No | December 20, 2018 |
| Apotex Inc. | APO-LOSARTAN DIN 02353512 |
100 | NL1461 | 2019-08-31 | Not Detected | Not Detected | No | December 20, 2018 |
| AstraZeneca Inc. | ATACAND – CANDESARTAN DIN 02311658 |
32 | KL0275 | 2021-04-30 | Not Detected | Not Detected | No | December 20, 2018 |
| Auro Pharma Inc. | AURO-CANDESARTAN HCT DIN 02421046 |
32/12.5 | WKSA18004-A | 2020-07-29 | Not Detected | Not Detected | No | December 20, 2018 |
| Auro Pharma Inc. | AURO-IRBESARTAN DIN 02406098 |
75 | IA7517001-A | 2020-06-30 | Not Detected | 4.7 | No | April 29, 2019 |
| Auro Pharma Inc. | AURO-IRBESARTAN DIN 02406098 |
75 | IA7517002-A | 2020-11-05 | Not Detected | 4.44 | No | April 29, 2019 |
| Auro Pharma Inc. | AURO-IRBESARTAN DIN 02406098 |
75 | IA7517003-A | 2020-11-05 | Not Detected | 4.61 | No | April 29, 2019 |
| Auro Pharma Inc. | AURO-IRBESARTAN DIN 02406101 |
150 | IA1517002-A | 2020-10-31 | Not Detected | 9.77 | No | April 29, 2019 |
| Auro Pharma Inc. | AURO-IRBESARTAN DIN 02406101 |
150 | IA1517001-A | 2020-06-30 | Not Detected | 13.63Table 1 Footnote 2 | NoTable 1 Footnote 2 | April 29, 2019 |
| Auro Pharma Inc. | AURO-IRBESARTAN DIN 02406101 |
150 | IA1517003-A | 2020-10-31 | Not Detected | 8.97 | No | April 29, 2019 |
| Auro Pharma Inc. | AURO-IRBESARTAN DIN 02406128 |
300 | IA3017001-A | 2020-06-30 | Not Detected | 27.81Table 1 Footnote 2 | NoTable 1 Footnote 2 | April 29, 2019 |
| Auro Pharma Inc. | AURO-IRBESARTAN DIN 02406128 |
300 | IA3017003-A | 2020-10-31 | Not Detected | 17.47 | No | April 29, 2019 |
| Auro Pharma Inc. | AURO-IRBESARTAN DIN 02406128 |
300 | IA3017002-A | 2020-10-31 | Not Detected | 19.6 | No | April 29, 2019 |
| Auro Pharma Inc. | AURO-IRBESARTAN HCT DIN 02447894 |
300/25 | IN3018001-A | 2020-04-06 | Not Detected | 26.78Table 1 Footnote 2 | NoTable 1 Footnote 2 | April 29, 2019 |
| Auro Pharma Inc. | AURO-IRBESARTAN HCT DIN 02447886 |
300/12.5 | IR3018001-A | 2020-04-06 | Not Detected | 30.29 | This lot was never distributed | April 29, 2019 |
| Auro Pharma Inc. | AURO-IRBESARTAN HCT DIN 02447878 |
150/12.5 | IN1518001-A | 2020-04-06 | Not Detected | 15.82Table 1 Footnote 1 | Yes | April 29, 2019 |
| Auro Pharma Inc. | AURO-OLMESARTAN DIN 02443872 |
40 | WOSB18004-A | 2020-01-12 | Not Detected | Not Detected | No | December 20, 2018 |
| Auro Pharma Inc. | AURO-LOSARTAN DIN 02403358 |
100 | WB1018003-A | 2021-03-15 | Not Detected | Not Detected | No | December 20, 2018 |
| Auro Pharma Inc. | AURO-VALSARTAN DIN 02414201 |
40 | VWSA17003-A | 2019-10-31 | Not Detected | 1.41 | No | January 16, 2019 |
| Auro Pharma Inc. | AURO-VALSARTAN DIN 02414201 |
40 | VWSA18007-A | 2020-08-24 | Not Detected | 1.07 | No | January 16, 2019 |
| Auro Pharma Inc. | AURO-VALSARTAN DIN 02414201 |
40 | VWSA18003-A | 2020-08-23 | Not Detected | 1.04 | No | January 16, 2019 |
| Auro Pharma Inc. | AURO-VALSARTAN DIN 02414228 |
80 | VWSB17010-A | 2019-07-31 | Not Detected | Not Detected | No | January 16, 2019 |
| Auro Pharma Inc. | AURO-VALSARTAN DIN 02414228 |
80 | VWSB17011-A | 2019-07-31 | Not Detected | Not Detected | No | January 16, 2019 |
| Auro Pharma Inc. | AURO-VALSARTAN DIN 02414236 |
160 | VWSC17001-A | 2018-12-31 | Not Detected | < 3.20 | No | January 16, 2019 |
| Auro Pharma Inc. | AURO-VALSARTAN DIN 02414236 |
160 | VWSC17005-A | 2019-05-31 | Not Detected | < 3.20 | No | January 16, 2019 |
| Auro Pharma Inc. | AURO-VALSARTAN DIN 02414236 |
160 | VWSC18002-A | 2020-01-19 | Not Detected | 4.58 | No | January 16, 2019 |
| Auro Pharma Inc. | AURO-VALSARTAN DIN 02414236 |
160 | VWSC18001-A | 2020-01-19 | < 6.40 | 4.39 | No | January 16, 2019 |
| Auro Pharma Inc. | AURO-VALSARTAN DIN 02414236 |
160 | VWSC18016-A | 2020-08-24 | Not Detected | 4.7 | No | January 16, 2019 |
| Auro Pharma Inc. | AURO-VALSARTAN DIN 02414244 |
320 | VWSD17001-B | 2019-05-31 | Not Detected | Not Detected | No | January 16, 2019 |
| Auro Pharma Inc. | AURO-VALSARTAN DIN 02414244 |
320 | VWSD18005-A | 2020-08-25 | Not Detected | 12.14 | No | January 16, 2019 |
| Auro Pharma Inc. | AURO-VALSARTAN DIN 02414244 |
320 | VWSD18001-A | 2020-04-15 | Not Detected | 8.56 | No | January 16, 2019 |
| Auro Pharma Inc. | AURO-VALSARTAN DIN 02414244 |
320 | VWSD18001-A | 2020-04-15 | Not Detected | 8.61 | No | December 20, 2018 |
| Auro Pharma Inc. | AURO-VALSARTAN HCT DIN 02408112 |
80/12.5 | HHSA18001-A | 2021-08-02 | Not Detected | 1.88 | No | January 16, 2019 |
| Jamp Pharma Corp | JAMP-OLMESARTAN DIN 02461668 |
40 | MC218002A | 2020-04-30 | Not Detected | Not Detected | No | December 20, 2018 |
| Jamp Pharma Corp | JAMP-LOSARTAN-HCTZ DIN 02408252 |
100/25 | LY218001A | 2019-06-30 | Not Detected | Not Detected | No | December 20, 2018 |
| Jamp Pharma Corp | JAMP-IRBESARTAN DIN 02418215 |
300 | IE318005A | 2020-03-31 | Not Detected | Not Detected | No | December 20, 2018 |
| Merck Canada Inc. | OLMETEC – OLMESARTAN DIN 02318679 |
40 | N021852 | 2020-04-30 | Not Detected | Not Detected | No | December 20, 2018 |
| Mint Pharmaceuticals Inc. | MINT-LOSARTAN/HCTZ DS DIN 02389673 |
100/25 | 1805009844 | 2021-07-31 | Not Detected | Not Detected | No | December 20, 2018 |
| Mylan Pharmaceuticals ULC | MYLAN-VALSARTAN DIN 02383527 |
40 | 3048813 | 2017-11-30 | < 1.60 | 8.32 | Yes | January 16, 2019 |
| Mylan Pharmaceuticals ULC | MYLAN-VALSARTAN DIN 02383535 |
80 | 3056368 | 2019-06-30 | < 3.20 | 22.43 | Yes | January 16, 2019 |
| Mylan Pharmaceuticals ULC | MYLAN-VALSARTAN DIN 02383543 |
160 | 3056371 | 2019-06-30 | Not Detected | 62.76 | Yes | January 16, 2019 |
| Mylan Pharmaceuticals ULC | MYLAN-VALSARTAN DIN 02383551 |
320 | 3048815 | 2017-11-30 | Not Detected | 132.77 | Yes | January 16, 2019 |
| Novartis Pharmaceuticals Canada Inc. | DIOVAN DIN 02289504 |
320 | BEK32 | 2021-07-31 | Not Detected | Not Detected | No | December 20, 2018 |
| Pharmascience Inc. | PMS-CANDESARTAN HCTZ DIN 02391295 |
16 | 615170 | 2020-04-30 | Not Detected | Not Detected | No | December 20, 2018 |
| Pharmascience Inc. | PMS-LOSARTAN DIN 02309777 |
100 | 613936 | 2021-03-31 | Not Detected | 10.41 | No | December 20, 2018 |
| Pharmascience Inc. | PMS-LOSARTAN-HCTZ DIN 02392232 |
100/12.5 | 0803847 | 2020-06-30 | Not Detected | Not Detected | No | December 20, 2018 |
| Pharmascience Inc. | PMS-IRBESARTAN DIN 02317087 |
300 | 615908 | 2021-03-31 | Not Detected | Not Detected | No | December 20, 2018 |
| Pharmascience Inc. | PMS-IRBESARTAN-HCTZ DIN 02328526 |
300/12.5 | 606524 | 2018-11-30 | Not Detected | Not Detected | No | December 20, 2018 |
| Pharmascience Inc. | PMS-IRBESARTAN-HCTZ DIN 02328526 |
300/12.5 | 611016 | 2019-11-30 | Not Detected | Not Detected | No | December 20, 2018 |
| Ranbaxy Pharmaceuticals Canada Inc. | RAN-VALSARTAN DIN 02363119 |
160 | 2884804 | 2019-05-31 | Not Detected | Not Detected | No | December 20, 2018 |
| Sandoz Canada Inc. | SANDOZ CANDESARTAN DIN 02417340 |
32 | JC3223 | 2020-06-30 | Not Detected | Not Detected | No | December 20, 2018 |
| Sandoz Canada Inc. | SANDOZ CANDESARTAN PLUS DIN 02420732 |
32 | HY8217 | 2020-04-30 | Not Detected | Not Detected | No | December 20, 2018 |
| Sandoz Canada Inc. | SANDOZ OLMESARTAN DIN 02443422 |
40 | HX2039 | 2020-02-28 | Not Detected | Not Detected | No | December 20, 2018 |
| Sandoz Canada Inc. | SANDOZ LOSARTAN DIN 02313359 |
100 | JD6746 | 2020-04-30 | Not Detected | Not Detected | No | December 20, 2018 |
| Sandoz Canada Inc. | SANDOZ VALSARTAN DIN 02356775 |
320 | HW4965 | 2020-12-31 | 2703.76Table 1 Footnote 1 | Not Detected | Yes | December 20, 2018 |
| Sandoz Canada Inc. | SANDOZ IRBESARTAN DIN 02328496 |
300 | HX4282 | 2020-01-31 | Not Detected | Not Detected | No | December 20, 2018 |
| Sandoz Canada Inc. | SANDOZ IRBESARTAN DIN 02328496 |
300 | JD1818 | 2020-05-31 | Not Detected | Not Detected | No | December 20, 2018 |
| Sanis Health Inc. | IRBESARTAN DIN 02372398 |
300 | 35213058A | 2019-12-31 | Not Detected | Not Detected | No | December 20, 2018 |
| Sanofi-Aventis Canada Inc. | AVAPRO – IRBESARTAN DIN 02237925 |
300 | KC001 | 2020-01-31 | Not Detected | Not Detected | No | December 20, 2018 |
| Septa Pharmaceuticals Inc. | SEPTA-LOSARTAN DIN 02424983 |
100 | LR318004A | 2020-03-31 | Not Detected | Not Detected | No | December 20, 2018 |
| Sivem Pharmaceuticals Inc. | LOSARTAN HCT DIN 02388987 |
100/25 | QX1018005-B | 2021-06-08 | Not Detected | Not Detected | No | December 20, 2018 |
| Sivem Pharmaceuticals Inc. | IRBESARTAN DIN 02385309 |
300 | HX7687 | 2019-12-31 | Not Detected | Not Detected | No | December 20, 2018 |
| Sivem Pharmaceuticals Inc. | IRBESARTAN HCT DIN 02385325 |
300/12.5 | HY7380 | 2020-11-30 | Not Detected | Not Detected | No | December 20, 2018 |
| Teva Canada Limited | TEVA-CANDESARTAN DIN 02366339 |
32 | 2537058 | 2020-05-31 | Not Detected | Not Detected | No | December 20, 2018 |
| Teva Canada Limited | TEVA-LOSARTAN DIN 02357976 |
100 | 2070318 | 2021-03-31 | Not Detected | Not Detected | No | December 20, 2018 |
| Teva Canada Limited | TEVA-LOSARTAN/HCTZ DIN 02358263 |
50/12.5 | 35349397A | 2020-09-30 | Not Detected | 10.3 | No | December 20, 2018 |
| Teva Canada Limited | TEVA-IRBESARTAN DIN 02316412 |
300 | 35213086A | 2019-12-31 | Not Detected | Not Detected | No | December 20, 2018 |
| Teva Canada Limited | TEVA-VALSARTAN DIN 02356686 |
320 | 35211729R | 2019-03-31 | Not Detected | Not Detected | No | December 20, 2018 |
| Teva Canada Limited | TEVA-VALSARTAN/HCTZ DIN 02357038 |
320/12.5 | 35212732 | 2019-10-31 | 14538.35Table 1 Footnote 1 | Not Detected | This lot was never distributed | December 20, 2018 |
| Teva Canada Limited | TEVA-VALSARTAN/HCTZ DIN 02357038 |
320/12.5 | 35211546R | 2019-01-31 | 258.19Table 1 Footnote 1 | 1770.87 | Yes | December 20, 2018 |
| Teva Canada Limited | TEVA-VALSARTAN/HCTZ DIN 02357046 |
320/25 | 35212731R | 2019-11-30 | 13367.64Table 1 Footnote 1 | Not Detected | Yes | December 20, 2018 |
|
||||||||
Test results for ranitidines
Health Canada has tested samples of ranitidine products on the Canadian market for NDMA. We established an interim acceptable concentration limit of 0.32 ppm for NDMA based on a maximum recommended daily dose of 300 mg.
The results, found in the table below, indicate:
- the level of NDMA detected
- whether the product was recalled
We will continue to assess new developments to determine whether more testing is necessary.
| Market authorization holder (Company) name | Product name and DIN | Strength (mg) | Lot number | Expiry date | NDMA (ppm)Table 2 Footnote 1 | Product recalled |
|---|---|---|---|---|---|---|
| Laboratoire Riva Inc | OPTION+ Acid Reducer (75 mg) DIN 02452464 | 75 | 612043-B | 2020-05-30 | 0.1099 | Yes |
| Pharmascience Inc | LIFE BRAND Acid Reducer (150 mg) DIN 02400103 | 150 | 617496 | 2020-10-31 | 0.0816 | Yes |
| Pharmascience Inc | REXALL Acid Reducer 02247551 |
75 | 611186D | 2020-04-30 | 0.4779Table 2 Footnote 2 | Yes |
| Pharmascience Inc | Equate Acid Reducer 02293471 | 150 | 618318 | 2020-10-31 | 0.0707 | Yes |
| Sanofi Consumer Health Inc Sanofi Sante Grand Public Inc | ZANTAC 02230287 | 75 | AK4388 | 2021-11-30 | 0.2452 | Yes |
| Sanofi Consumer Health Inc Sanofi Sante Grand Public Inc | ZANTAC 02277301 | 150 | AK6951 | 2021-01-31 | 0.0904 | Yes |
| Vita Health Products Inc | Equate Acid Reducer 02298740 | 75 | 8E228B4RKB | 2020-06-30 | 0.1246 | Yes |
| Vita Health Products Inc | Equate Acid Reducer 02298902 | 150 | 6152524N3J | 2020-12-31 | 0.0526 | Yes |
|
||||||
Test results for metformin
Health Canada has tested samples of metformin products on the Canadian market for NDMA. We established an interim acceptable concentration limit of 0.0376 ppm for NDMA for drug products with a maximum daily dose of 2.55 g/day, and 0.048 ppm for drug products with a maximum daily dose of 2 g/day.
The results, found in the table below, indicate:
- the level of NDMA detected
- whether the product was recalled
We will continue to assess new developments to determine whether more testing is necessary.
| Market authorization holder (Company) name | Product name and DIN | Strength (mg) | Lot number | Expiry date | NDMA (ppm)Table 3 Footnote 1 | Product recalled |
|---|---|---|---|---|---|---|
| Apotex Inc | Apo-Metformin ER 02305062 | 500 | PK3968 | 2020-09-30 | 0.044 ppm | Yes |
| Apotex Inc | Apo-Metformin ER 02460653 | 1000 | PY5749 | 2021-03-31 | NDTable 3 Footnote 2 | No |
| Astrazeneca Canada Inc | Xigduo 02449943 | 5/1000 | X1032A | 2022-07-31 | ND | No |
| Astrazeneca Canada Inc | Komboglyze 02389185 | 2.5/1000 | RB696 | 2022-04-30 | ND | No |
| Auro Pharma Inc | Auro-Metformin 02438283 | 850 | MR19008-85A | 2022-04-15 | ND | No |
| Auro Pharma Inc | Auro-Metformin 02438275 | 500 | MR19054-50A | 2022-04-28 | ND | No |
| Boehringer Ingelheim (Canada) Ltd Ltee | Jentadueto 02403250 | 2.5/500 | 960201 | 2021-11-05 | ND | No |
| Boehringer Ingelheim (Canada) Ltd Ltee | Jentadueto 02403277 | 2.5/1000 | 960205 | 2022-05-19 | ND | No |
| Boehringer Ingelheim (Canada) Ltd Ltee | Jentadueto 02403269 | 2.5/850 | 958144 | 2022-03-26 | ND | No |
| Boehringer Ingelheim (Canada) Ltd Ltee | Synjardy 02456591 | 5/1000 | 960496 | 2022-04-13 | ND | No |
| Dominion Pharmacal | Dom-Metformin [Metformin 850] 02242726 | 850 | 624624 | 2021-09-30 | ND | No |
| Jamp Pharma Corporation | Jamp-Metformin 02380218 | 850 | X20386 | 2020-07-31 | ND | Yes |
| Janssen Inc | Invokamet 02455455 | 150/1000 | JIL0T01 | 2022-04-30 | ND | No |
| Laboratoire Riva Inc | Riva-Metformin 02242783 | 850 | C8385 | 2020-12-31 | ND | No |
| Merck Canada Inc | Janumet Xr 02416786 | 50/500 | R017925 | 2020-04-22 | Detected; < LOQTable 3 Footnote 3 | No |
| Merck Canada Inc | Janumet 02333872 | 50/1000 | R017774 | 2020-04-20 | ND | No |
| Merck Canada Inc | Janumet 02333864 | 50/850 | R031038 | 2020-08-12 | ND | No |
| Merck Canada Inc | Janumet 02333856 | 50/500 | N020597 | 2020-04-30 | ND | No |
| Merck Canada Inc | Janumet Xr 02416794 | 50/1000 | R015954 | 2020-04-21 | Detected; < LOQ | No |
| Merck Canada Inc | Janumet Xr 02416808 | 100/1000 | R019378 | 2020-04-28 | Detected; < LOQ | No |
| Mint Pharmaceuticals Inc | Mint-Metformin 02388774 | 850 | XB10217 | 2020-05-31 | Detected; < LOQ | No |
| Mylan Pharmaceuticals Ulc | Mylan-Metformin [Metformin 850] 02229656 | 850 | 4680005A | 2020-08-31 | ND | No |
| Pharmascience Inc | Pms-Metformin [Metformin 850] 02242589 | 850 | 624407 | 2021-08-31 | ND | No |
| Pharmascience Inc | Pms-Metformin -Tab 500mg [Metformin 500] 02223562 | 500 | 624584 | 2021-08-31 | ND | No |
| Pro Doc Limitee | Pro-Metformin 02314894 | 850 | 624623 | 2021-09-30 | ND | No |
| Ranbaxy Pharmaceuticals Canada Inc. | Ran-Metformin 02269058 | 850 | AJZ8003A | 2020-04-30 | Detected; < LOQ | No |
| Sandoz Canada Incorporated | Sandoz Metformin Fc 02246820 | 500 | HZ0133 | 2020-11-30 | ND | No |
| Sandoz Canada Incorporated | Sandoz Metformin Fc 02246820 | 500 | HT4634 | 2020-07-31 | ND | No |
| Sandoz Canada Incorporated | Sandoz Metformin Fc 02246820 | 500 | JD7946 | 2021-06-30 | ND | No |
| Sandoz Canada Incorporated | Sandoz Metformin Fc 02246820 | 500 | HL3031 | 2020-08-31 | ND | No |
| Sandoz Canada Incorporated | Sandoz Metformin Fc 02246821 | 850 | JR3918 | 2022-01-31 | ND | No |
| Sanis Health Inc | Metformin 02353385 | 850 | JJ1245 | 2021-05-31 | ND | No |
| Sanis Health Inc | Metformin 02353385 | 850 | JD0660 | 2021-05-31 | ND | No |
| Sanis Health Inc | Metformin 02353377 | 500 | JN3158 | 2021-10-31 | ND | No |
| Sanofi-Aventis Canada Inc | Glucophage 02162849 | 850 | 8123285 | 2022-08-31 | ND | No |
| Sivem Pharmaceuticals Ulc | Metformin Fc 02385341 | 500 | JW5467 | 2022-04-30 | ND | No |
| Sivem Pharmaceuticals Ulc | Metformin Fc 02385368 | 850 | JR3921 | 2022-01-31 | ND | No |
| Sivem Pharmaceuticals Ulc | Metformin Fc 02385368 | 850 | JW8773 | 2022-05-31 | ND | No |
| Takeda Canada Inc | Kazano 02417235 | 12.5/1000 | 11616020 | 2021-05-31 | ND | No |
| Teva Canada Limited | Ratio-Metformin 02242931 | 850 | 35212386A | 2020-03-31 | ND | No |
| Teva Canada Limited | Act Metformin 02257726 | 500 | 4770082F | 2021-05-31 | ND | No |
| Teva Canada Limited | Act Metformin 02257734 | 850 | 4780009F | 2020-10-31 | ND | No |
| Valeant Canada Lp/Valeant Canada S.E.C. | Glumetza 02300451 | 1000 | 19L031P | 2022-10-31 | 0.032 ppm | No |
|
||||||