
Cannabis data overview: Inventory, sales and licensed area
Types of cannabis
Data collected is for these types of cannabis in the legal industry:
- dried cannabis
- edible cannabis
- cannabis extracts
- cannabis topicals
- cannabis plants
- cannabis seeds
Data categories
Data for all categories includes:
- medical sales
- non-medical sales
- packaged inventory (formerly finished inventory)
- unpackaged inventory (formerly unfinished inventory)
- licensed area
This update reflects the data reported under the Cannabis Tracking System Order. Data is subject to revision as verification and validation occur on an ongoing basis. Please note that, except in rare instances, Health Canada generally does not make estimates for reporting parties that have not submitted their information into the Cannabis Tracking System.
Additional cannabis data is available on the Cannabis research and data page.
This data, as well as more detailed data on sales and inventories broken down by cannabis product class, is also available on Open Government.
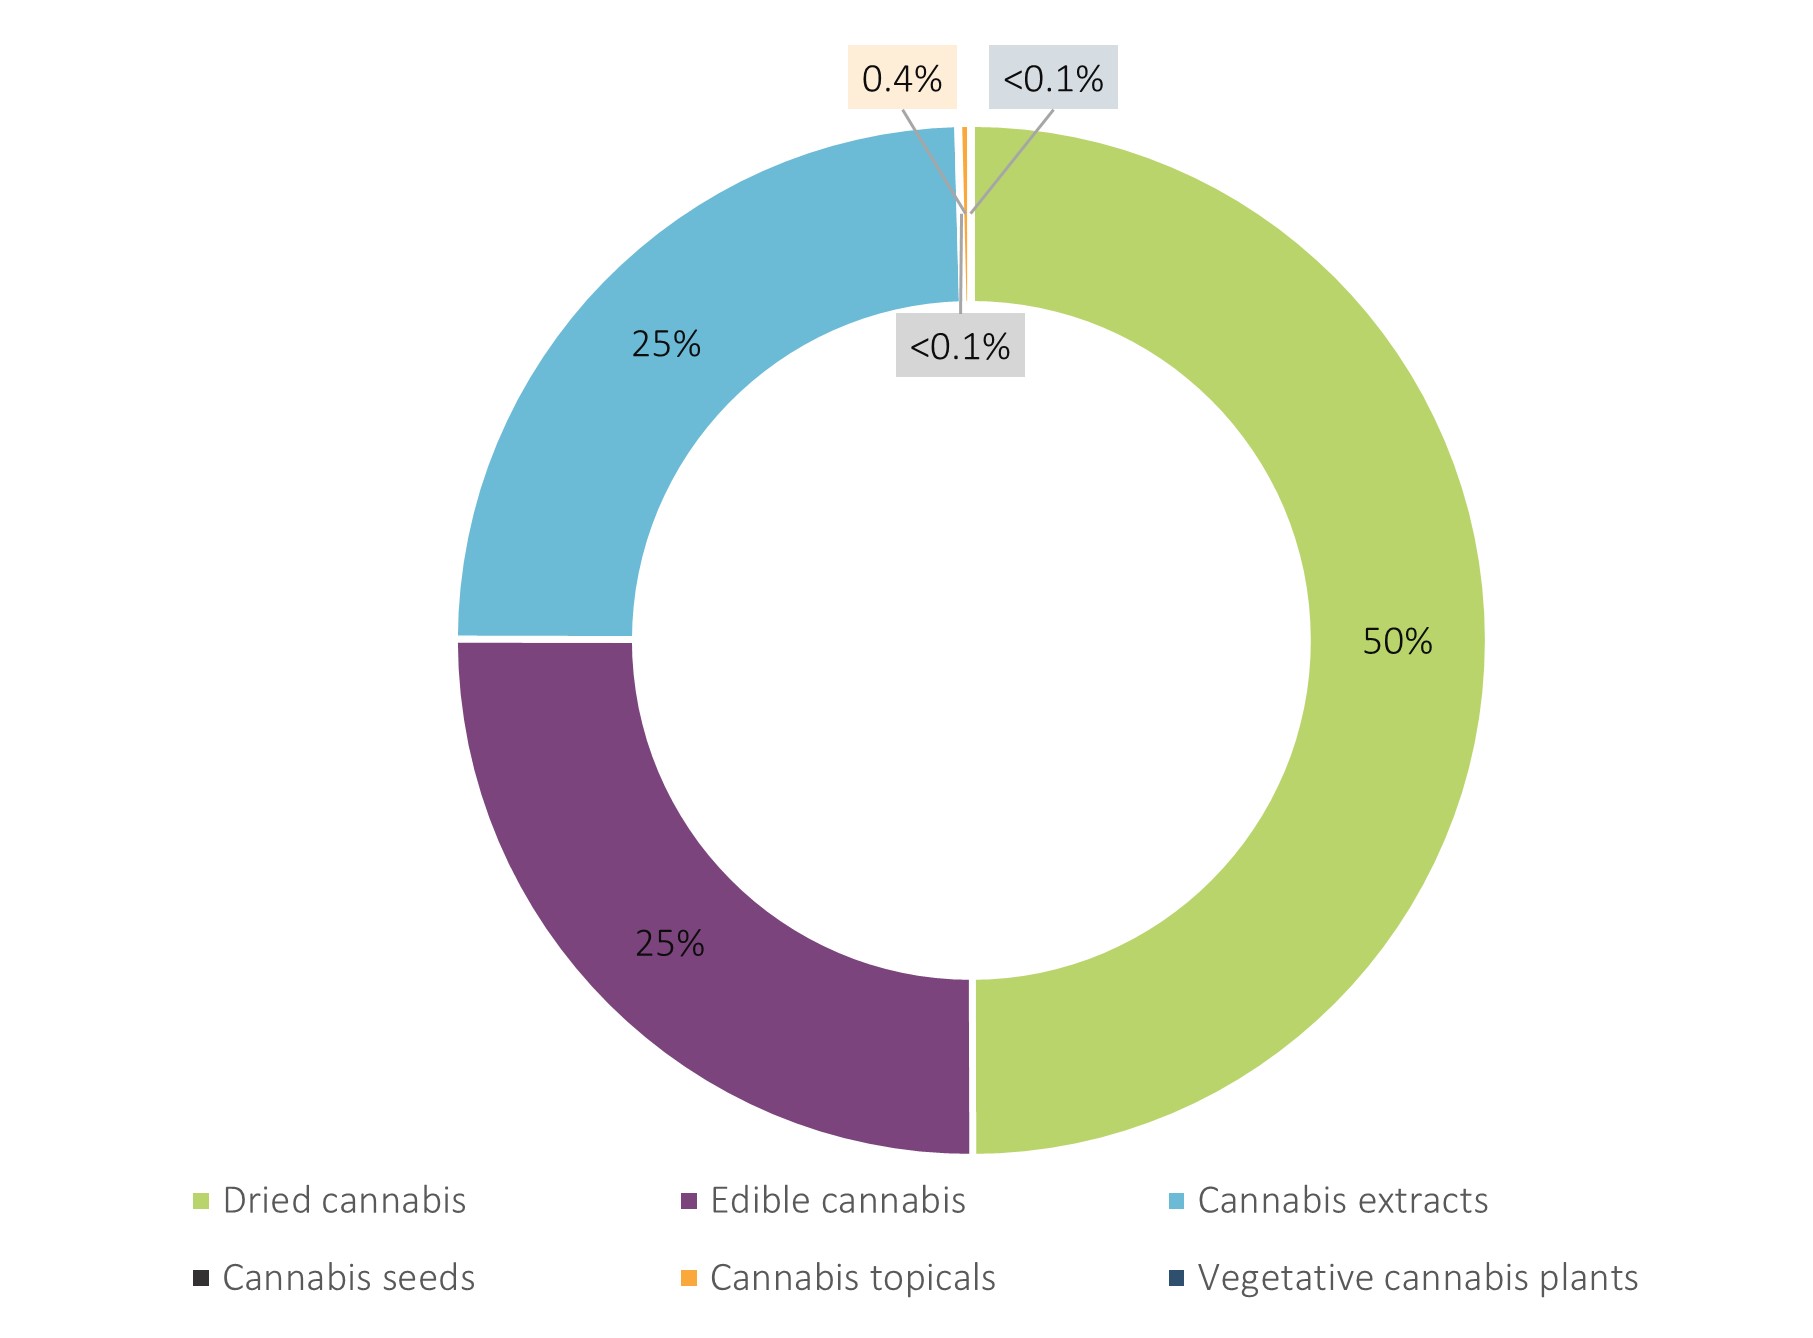
(Total sales up 7% from December 2024)
View accessible format
| Cannabis product type | Total medical and non-medical sales (units) | Percentage share of total sales |
|---|---|---|
| Dried cannabis | 12,157,733 | 46% |
| Edible cannabis | 6,731,962 | 25% |
| Cannabis extracts | 7,473,266 | 28% |
| Cannabis seeds | 5,674 | < 0.1% |
| Cannabis topicals | 112,289 | 0.4% |
| Vegetative cannabis plants | 131 | < 0.1% |
(Packaged inventory up 3% from December 2024)

View accessible format
| Cannabis product type | Total packaged inventory (units) | Percentage share of packaged inventory |
|---|---|---|
| Dried cannabis | 36,123,563 | 43% |
| Edible cannabis | 24,353,645 | 29% |
| Cannabis extracts | 23,847,709 | 28% |
| Cannabis seeds | 76,918 | 0.1% |
| Cannabis topicals | 547,836 | 0.6% |
| Vegetative cannabis plants | 90 | < 0.1% |
Ratio of total packaged inventory to retail sales, for federal licence holders, distributors and retailers, by product type
(for example, for every unit of a product sold, there are 3 in inventory):
- Dried cannabis: 3.0 to 1
- Edibles: 3.6 to 1
- Extracts: 3.2 to 1
- Seeds: 13.6 to 1
- Topicals: 4.9 to 1
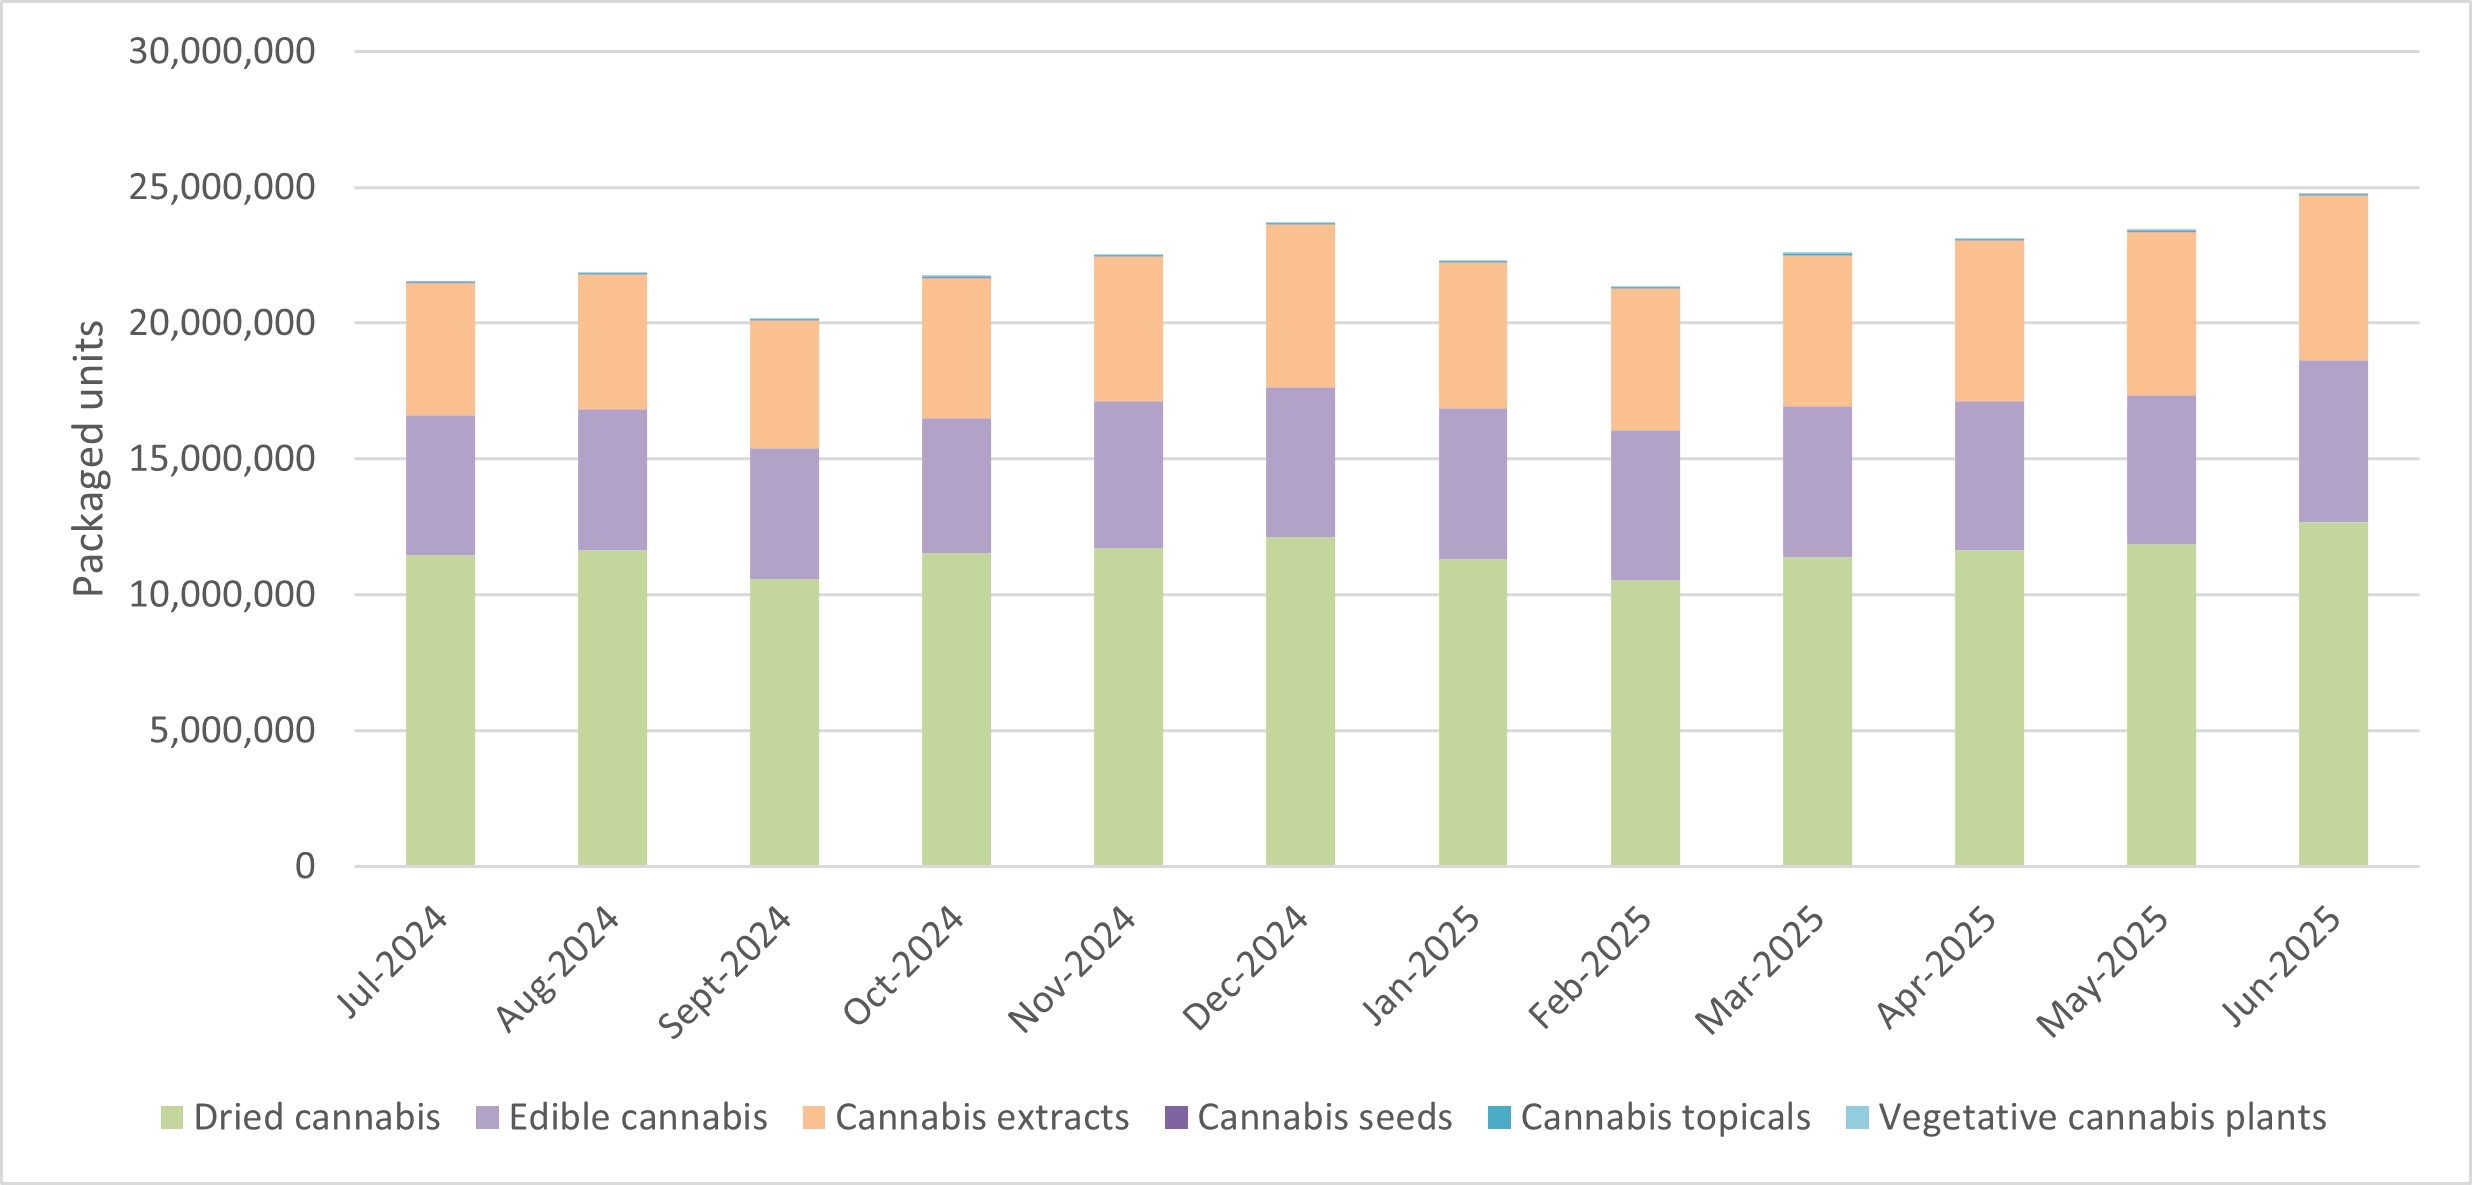
Sold by distributors and retailers to consumers
View accessible format
| Year-month | Non-medical sales (units) | |||||
|---|---|---|---|---|---|---|
| Dried cannabis | Edible cannabis | Cannabis extracts | Seeds | Topicals | Vegetative cannabis plants | |
| 2024-10 | 11,541,892 | 4,953,781 | 5,177,738 | 3,962 | 34,752 | 203 |
| 2024-11 | 11,710,774 | 5,403,602 | 5,355,223 | 5,284 | 35,762 | 194 |
| 2024-12 | 12,119,501 | 5,533,903 | 5,977,326 | 4,720 | 38,569 | 147 |
| 2025-01 | 11,328,156 | 5,796,188 | 5,402,839 | 3,484 | 34,996 | 112 |
| 2025-02 | 10,555,442 | 5,508,129 | 5,209,170 | 3,378 | 38,499 | 214 |
| 2025-03 | 11,398,013 | 5,550,412 | 5,559,570 | 4,295 | 48,086 | 1,430 |
| 2025-04 | 11,642,648 | 5,496,587 | 5,899,508 | 13,291 | 45,440 | 4,084 |
| 2025-05 | 11,872,674 | 5,479,196 | 6,016,393 | 12,947 | 44,034 | 9,457 |
| 2025-06 | 12,677,105 | 5,958,554 | 6,067,414 | 8,863 | 46,800 | 6,414 |
| 2025-07 | 12,349,779 | 5,980,752 | 6,979,518 | 6,386 | 42,279 | 1,175 |
| 2025-08 | 12,488,460 | 5,971,492 | 7,001,878 | 5,632 | 42,484 | 133 |
| 2025-09 | 12,095,203 | 5,579,621 | 6,806,597 | 5,215 | 41,314 | 106 |
| 2025-10 | 12,344,263 | 5,737,534 | 7,044,735 | 5,381 | 42,644 | 181 |
| 2025-11 | 11,473,275 | 5,484,863 | 6,845,048 | 5,080 | 42,344 | 123 |
| 2025-12 | 11,928,539 | 6,155,283 | 7,224,376 | 5,669 | 51,711 | 58 |
Sold by federal licence holders to registered medical clients

View accessible format
| Year-month | Medical sales (units) | |||||
|---|---|---|---|---|---|---|
| Dried cannabis | Edible cannabis | Cannabis extracts | Seeds | Topicals | Vegetative cannabis plants | |
| 2024-10 | 248,406 | 485,508 | 271,905 | 48 | 48,664 | 30 |
| 2024-11 | 231,751 | 433,972 | 240,679 | 0 | 46,707 | 192 |
| 2024-12 | 221,276 | 454,341 | 244,968 | 53 | 48,602 | 859 |
| 2025-01 | 246,668 | 505,775 | 273,968 | 51 | 53,368 | 275 |
| 2025-02 | 214,501 | 451,514 | 236,584 | 615 | 43,484 | 40 |
| 2025-03 | 233,743 | 485,742 | 282,428 | 69 | 48,248 | 242 |
| 2025-04 | 233,910 | 493,624 | 260,805 | 124 | 44,319 | 104 |
| 2025-05 | 226,348 | 505,736 | 285,782 | 109 | 48,643 | 484 |
| 2025-06 | 224,815 | 519,989 | 268,347 | 41 | 47,454 | 24 |
| 2025-07 | 227,379 | 560,775 | 284,385 | 0 | 47,299 | 12 |
| 2025-08 | 207,449 | 518,331 | 247,243 | 23 | 45,384 | 163 |
| 2025-09 | 214,313 | 534,645 | 251,353 | 1 | 47,905 | 104 |
| 2025-10 | 223,520 | 570,210 | 272,747 | 1 | 53,319 | 71 |
| 2025-11 | 218,041 | 536,315 | 252,792 | 51 | 49,067 | 48 |
| 2025-12 | 229,194 | 576,679 | 248,890 | 5 | 60,578 | 63 |
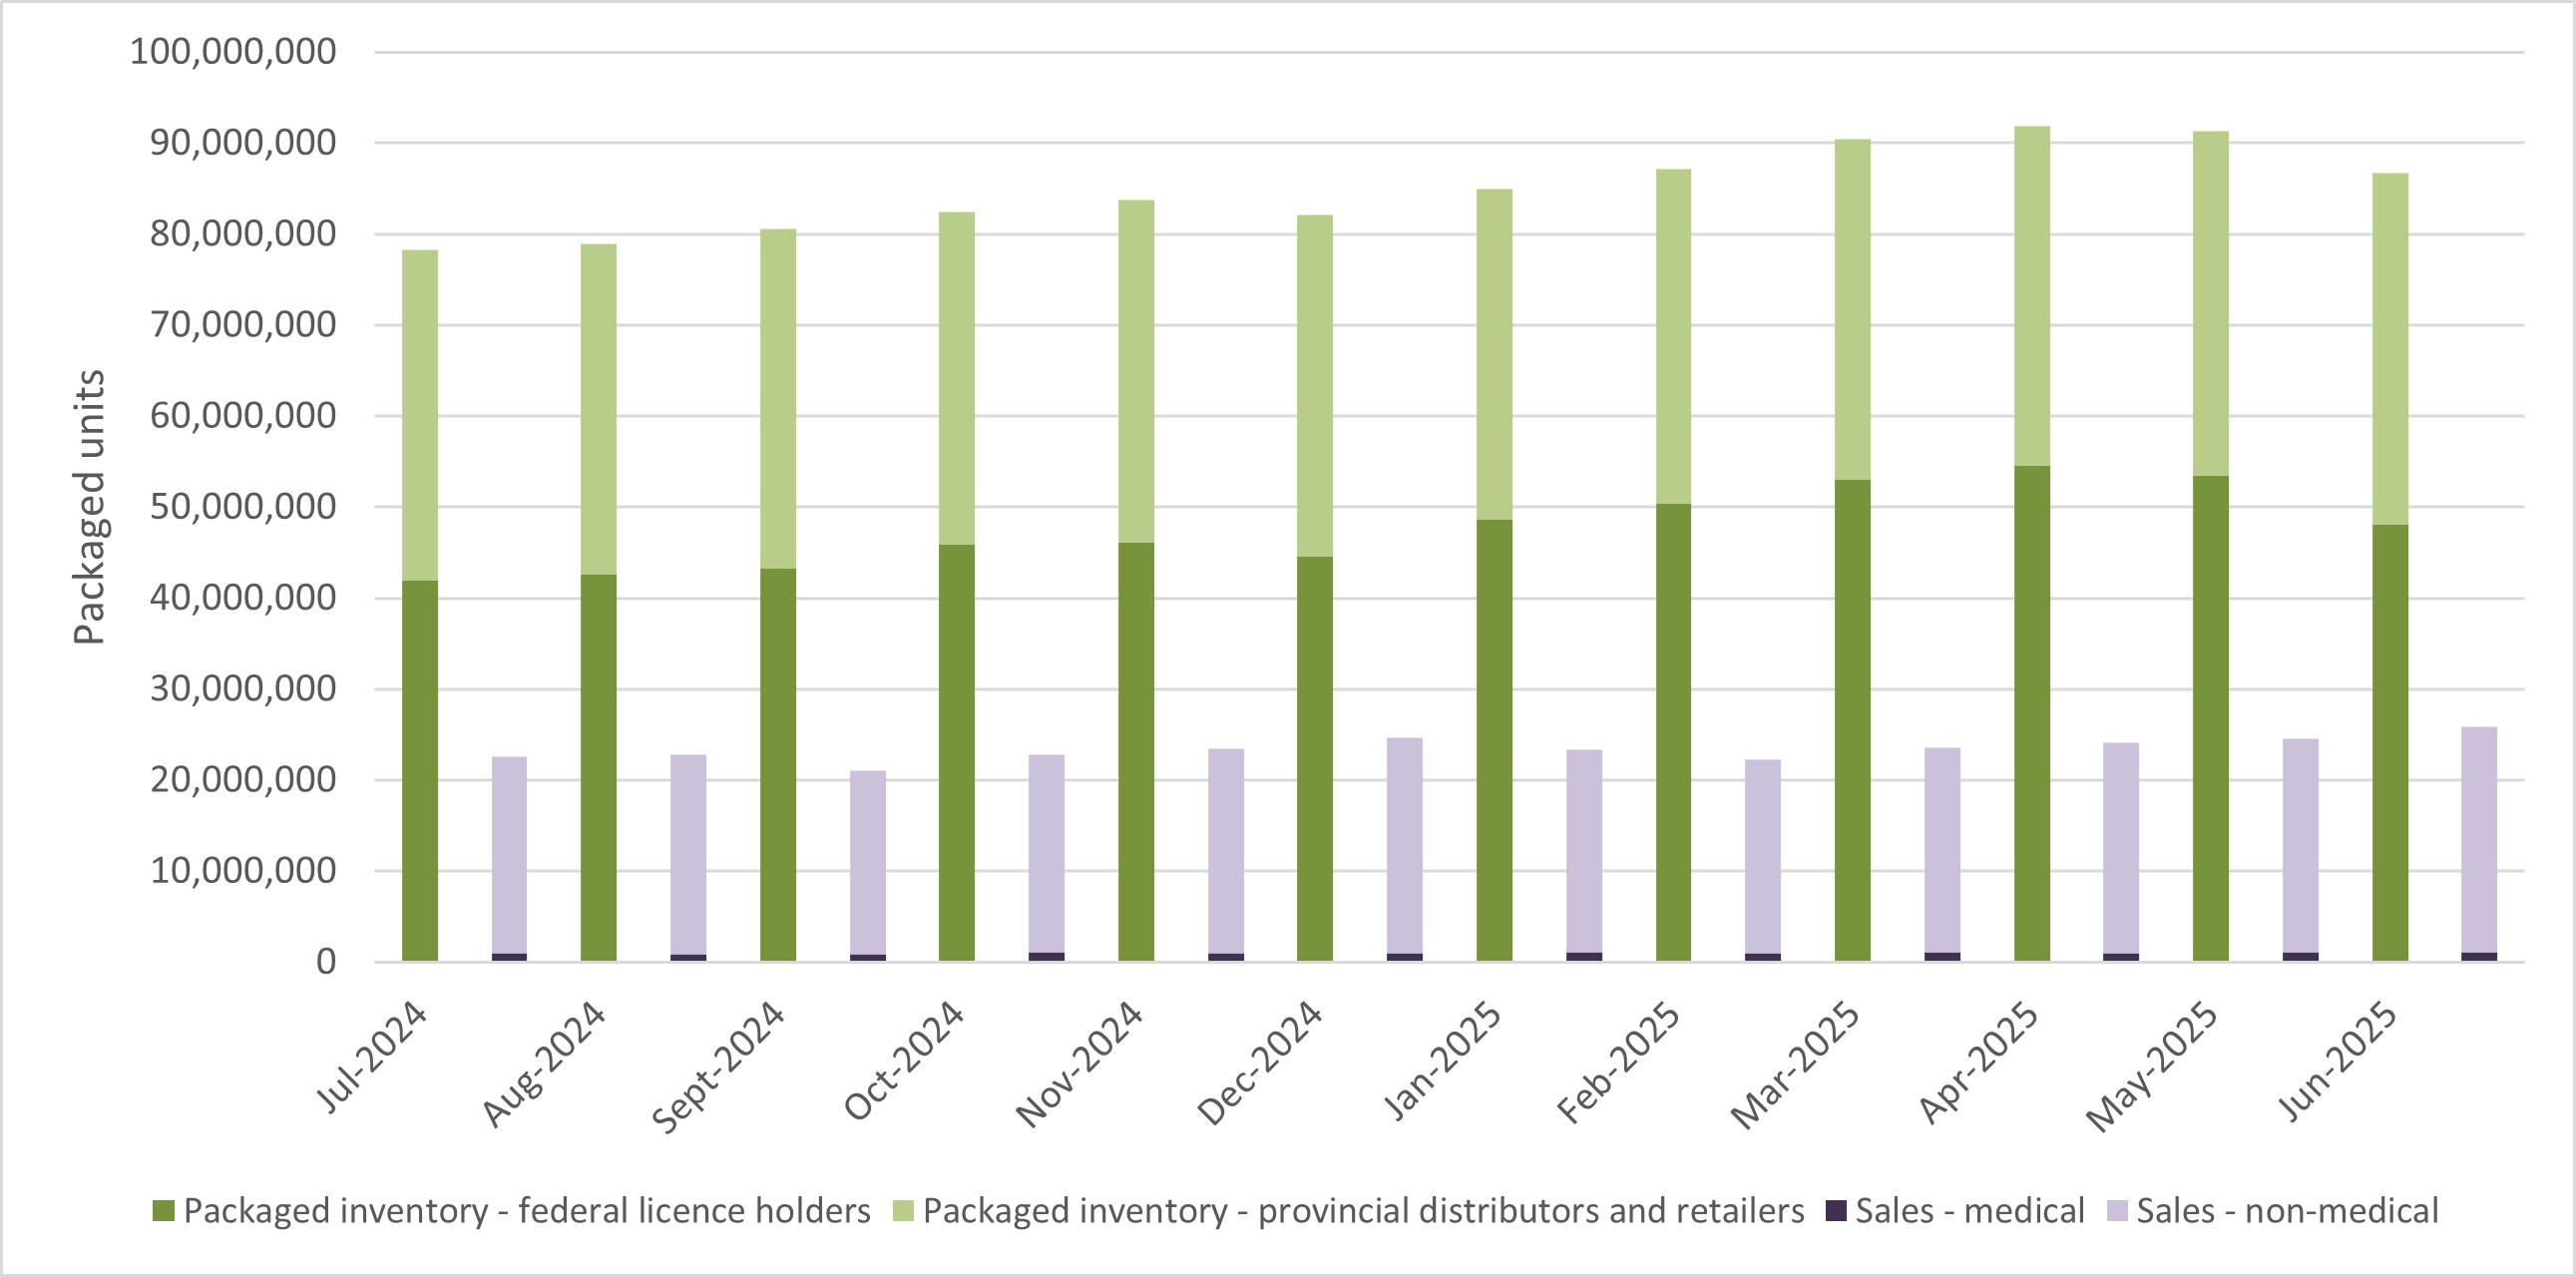
View accessible format
| Year-month | Packaged inventory (units) | Sales (units) | ||
|---|---|---|---|---|
| Federal licence holders | Provincial distributors and retailers | Medical | Non-medical | |
| 2024-10 | 45,904,375 | 36,478,045 | 1,054,561 | 21,712,327 |
| 2024-11 | 46,133,226 | 37,586,549 | 953,301 | 22,510,838 |
| 2024-12 | 44,653,197 | 37,454,355 | 970,099 | 23,674,166 |
| 2025-01 | 48,671,453 | 36,332,577 | 1,080,105 | 22,565,775 |
| 2025-02 | 50,439,652 | 36,720,878 | 946,738 | 21,314,832 |
| 2025-03 | 53,029,652 | 37,459,784 | 1,050,472 | 22,561,806 |
| 2025-04 | 54,553,605 | 37,306,626 | 1,032,886 | 23,101,558 |
| 2025-05 | 53,518,059 | 37,766,235 | 1,067,102 | 23,434,701 |
| 2025-06 | 48,095,853 | 38,654,087 | 1,060,670 | 24,765,150 |
| 2025-07 | 48,524,579 | 37,159,437 | 1,119,850 | 25,359,889 |
| 2025-08 | 47,789,387 | 36,068,682 | 1,018,593 | 25,510,079 |
| 2025-09 | 47,646,905 | 36,399,107 | 1,048,321 | 24,528,056 |
| 2025-10 | 48,870,635 | 37,199,065 | 1,119,868 | 25,174,738 |
| 2025-11 | 48,877,088 | 38,182,046 | 1,056,314 | 23,850,733 |
| 2025-12 | 46,887,833 | 37,985,010 | 1,115,409 | 25,365,646 |
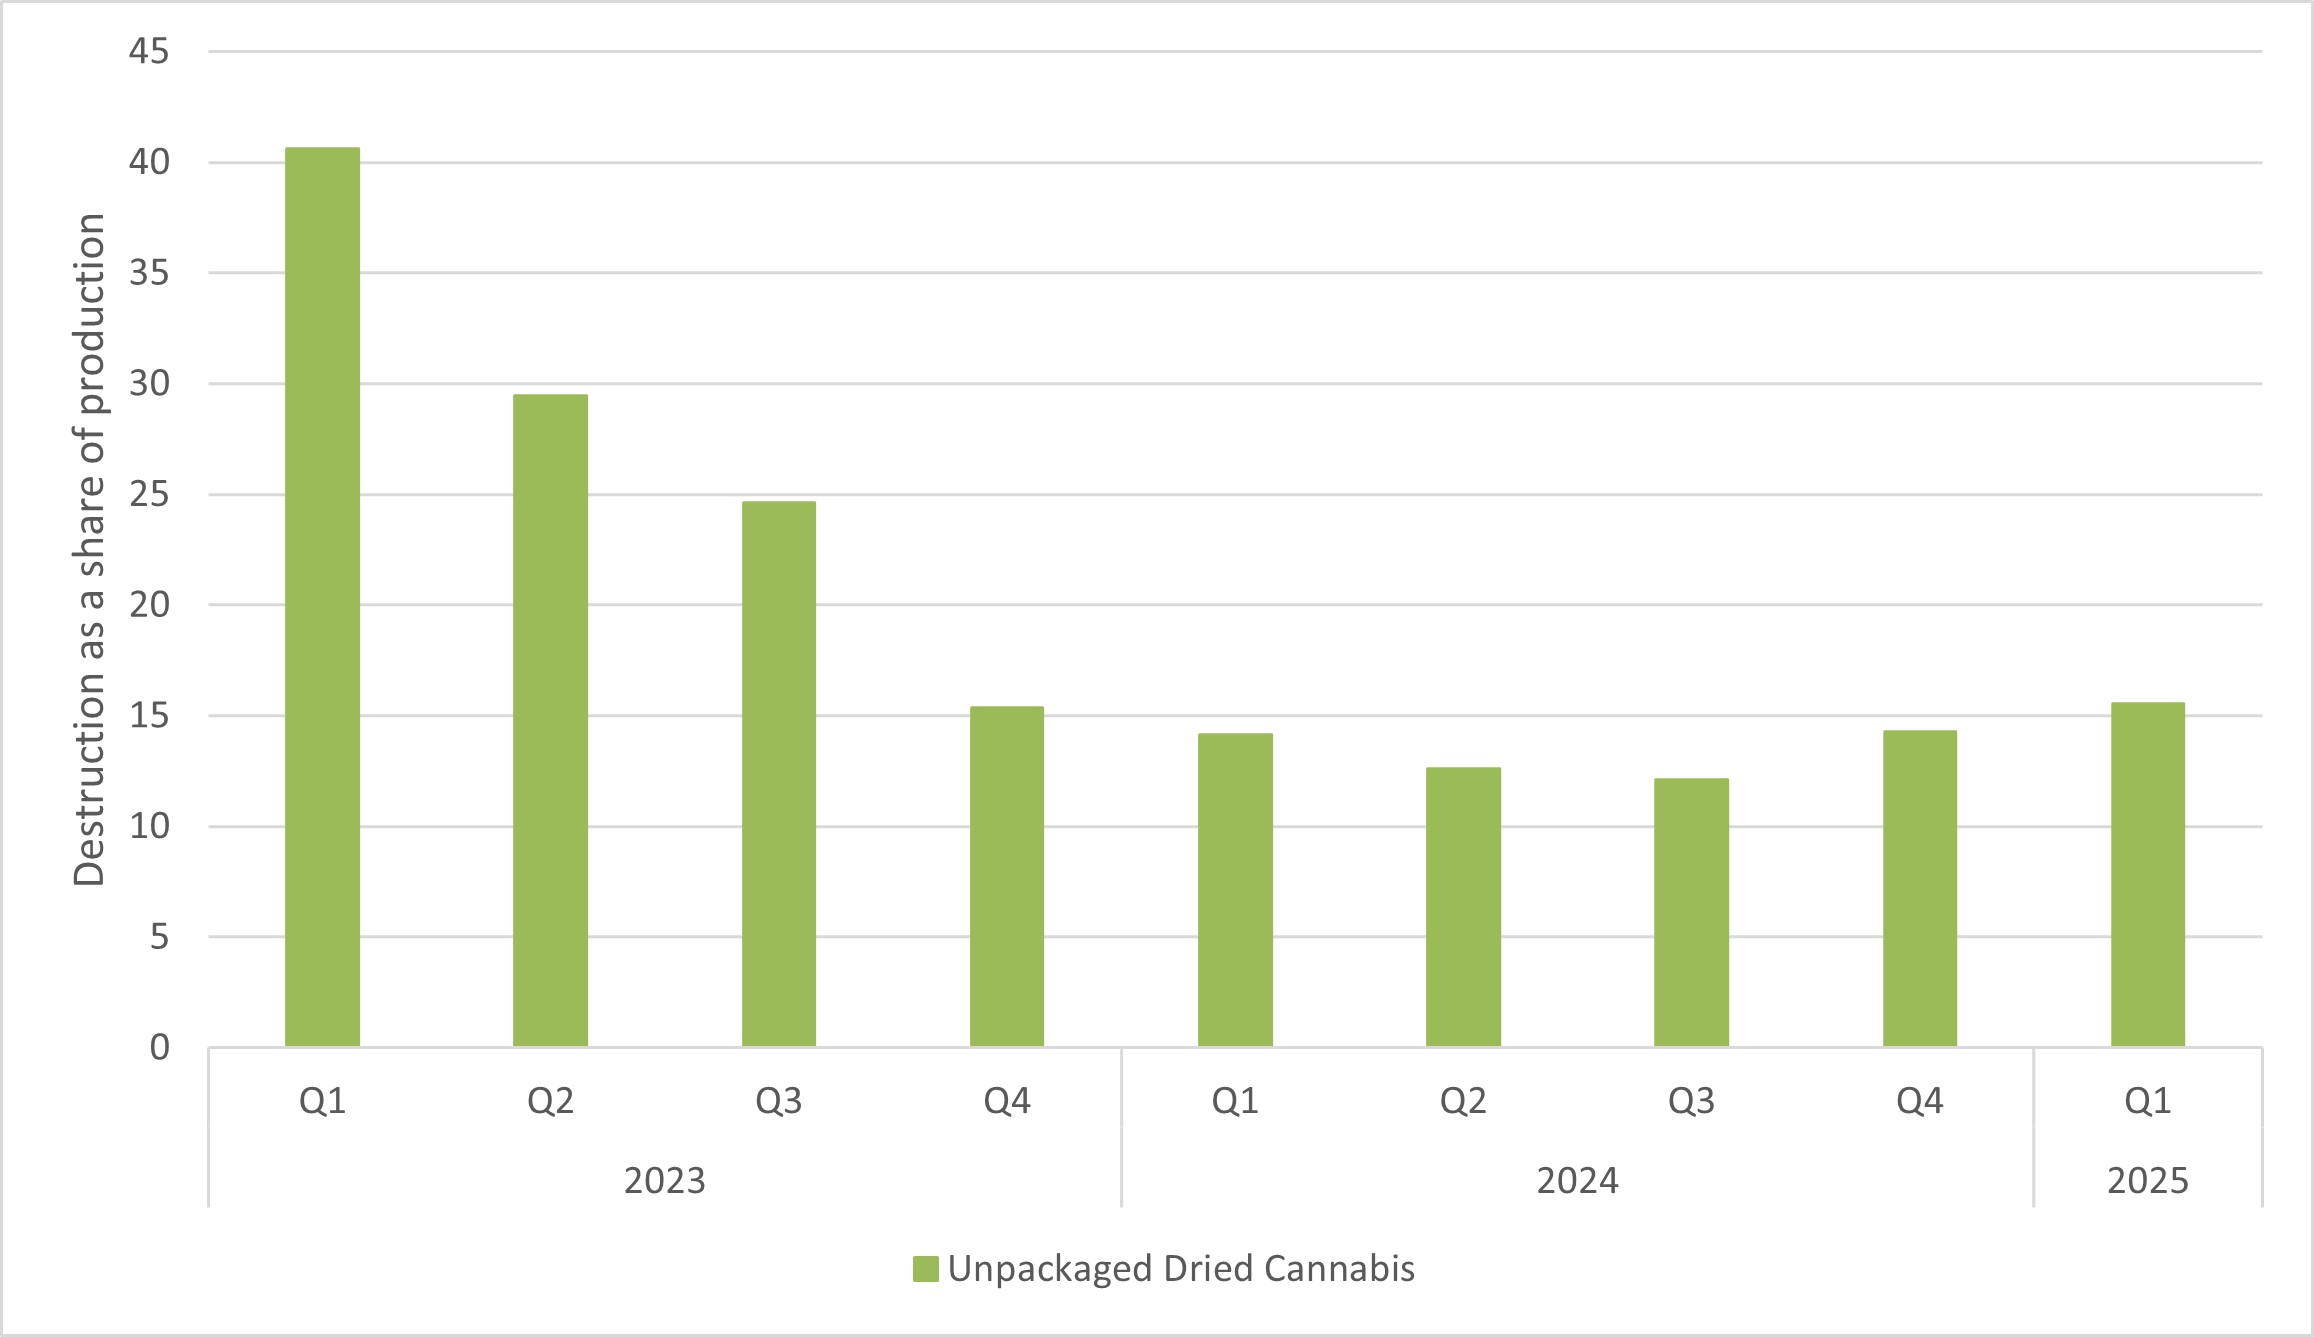
View accessible format
| Quarter-year | Destruction of unpackaged dried cannabis as a share of production |
|---|---|
| Q1-2024 | 14.1% |
| Q2-2024 | 12.6% |
| Q3-2024 | 12.1% |
| Q4-2024 | 14.3% |
| Q1-2025 | 15.5% |
| Q2-2025 | 10.4% |
| Q3-2025 | 7.9% |
| Q4-2025 | 9.8% |
Total licensed area:
- Indoor growing area: 1,444,879 m2
- Processing area: 345,151 m2
- Outdoor growing area: 699 hectares (6,988,400 m2)
Health Canada collects data on cannabis under the Cannabis Tracking System Order. The Order came into force on October 17, 2019.
Data collected by Health Canada under the Access to Cannabis for Medical Purposes Regulations (ACMPR) is available in archived format.
You can also access archived data on these pages: