
Cannabis plants data: Production, inventory and sales
This page has been archived on the Web
Updated information can be found on Cannabis data overview: Inventory, sales and licensed area. Information identified as archived is provided for reference, research or recordkeeping purposes.
Definitions
- Packaged inventory
- Cannabis held in stock by a cultivator, processor, distributor, or retailer that is packaged for sale to consumers at the retail level.
- Packaged production
- The number of cannabis products resulting from unpackaged cannabis being placed into final packaging for sale to consumers at the retail level during the reporting period.
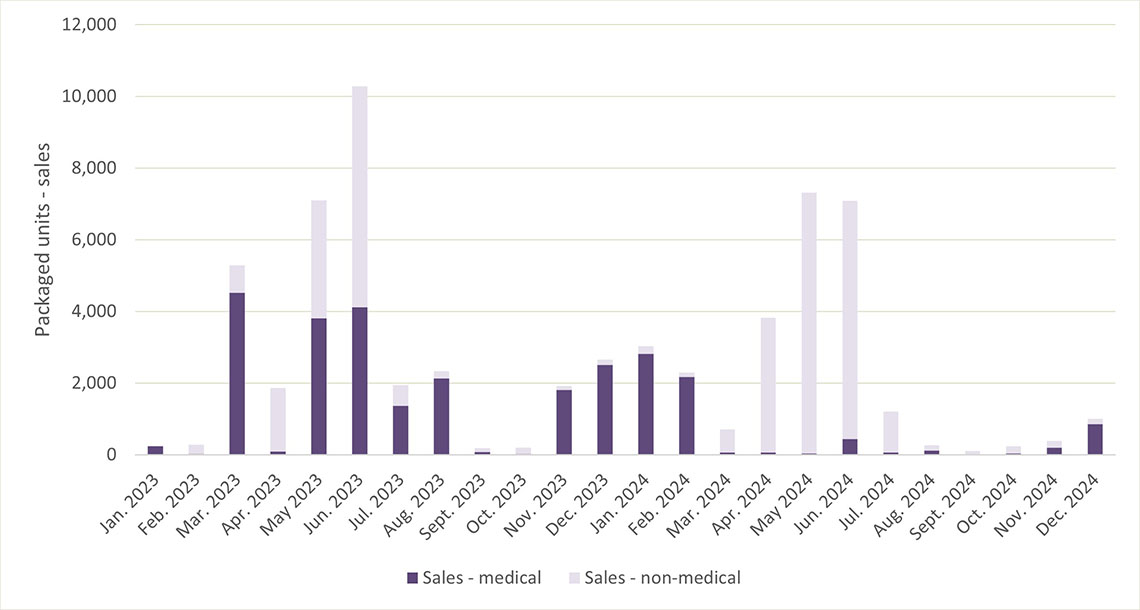
- Sales (medical)
- Cannabis products sold directly to medical clients by holders of a federal licence for medical sales.
- Sales (non-medical)
- Cannabis products sold directly in the Canadian retail market, online or in-person, by a provincially or territorially authorized distributor or retailer, for non-medical purposes.
- Unpackaged inventory
- Cannabis held in stock by a cultivator or processor that is not packaged for sale to consumers at the retail level.
- Unpackaged production
- The amount of cannabis produced from activities conducted onsite by cultivators and/or processors and added to the unpackaged inventory during the reporting period.
- Vegetative cannabis plants
- Cannabis plants that are not budding or flowering (clones and seedlings).
- Whole cannabis plants
- Budding or flowering cannabis plants (unpackaged only).
The data on this page is also available on Open Government.
Cannabis plants data
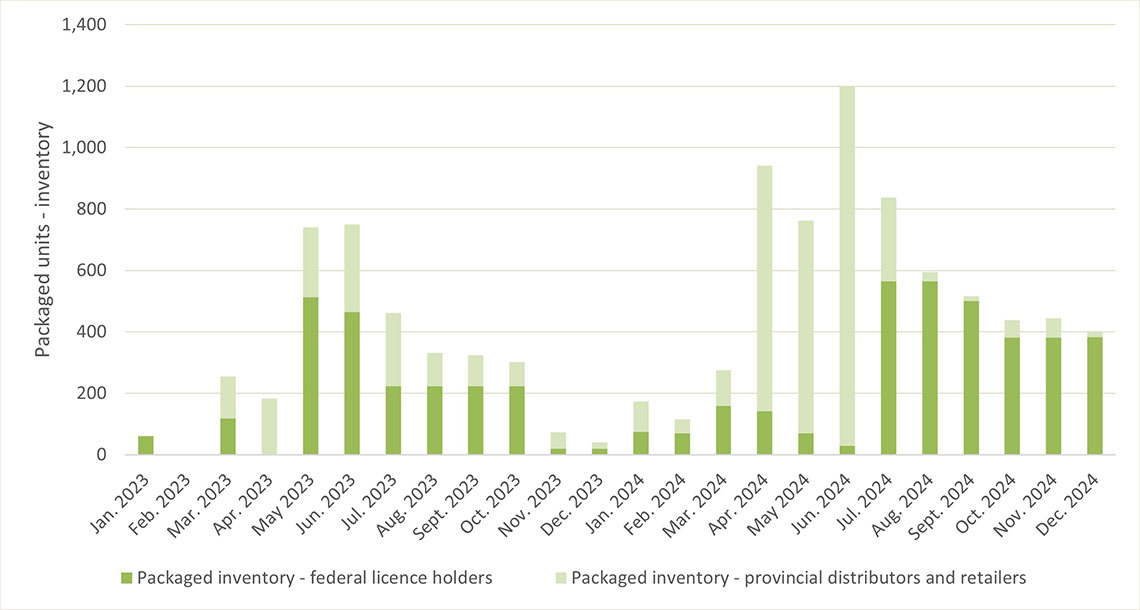
The data presented in this figure is available in Table 1.
The data presented in this figure is available in Table 1.

The data presented in this figure is available in Table 2.
| Year-Month | Unpackaged production | Unpackaged inventory | Packaged production | Packaged inventory | Sales | ||
|---|---|---|---|---|---|---|---|
| Federal licence holders | Provincial distributors and retailers | Medical | Non-Medical | ||||
| 2024-12 | 1,790,521 | 2,433,181 | 103 | 384 | 15 | 859 | 147 |
| 2024-11 | 2,006,964 | 2,488,464 | 107 | 382 | 62 | 192 | 194 |
| 2024-10 | 1,989,706 | 2,474,956 | 461 | 381 | 57 | 30 | 203 |
| 2024-09 | 1,817,940 | 2,574,198 | 50 | 500 | 17 | 4 | 98 |
| 2024-08 | 2,015,215 | 3,078,650 | 94 | 565 | 30 | 120 | 150 |
| 2024-07 | 2,233,626 | 4,488,491 | 2,195 | 565 | 273 | 59 | 1,150 |
| 2024-06 | 2,690,083 | 4,173,307 | 4,158 | 30 | 1,170 | 436 | 6,655 |
| 2024-05 | 2,834,149 | 3,666,197 | 3,836 | 70 | 693 | 34 | 7,283 |
| 2024-04 | 2,252,820 | 2,907,869 | 2,582 | 142 | 799 | 69 | 3,752 |
| 2024-03 | 1,878,992 | 2,483,379 | 652 | 160 | 115 | 66 | 646 |
| 2024-02 | 1,780,554 | 2,310,138 | 135 | 70 | 45 | 2,170 | 123 |
| 2024-01 | 1,757,213 | 2,233,739 | 155 | 75 | 99 | 2,815 | 210 |
| 2023-12 | 1,547,130 | 2,285,207 | 111 | 20 | 21 | 2,513 | 145 |
| 2023-11 | 1,627,211 | 2,311,822 | 85 | 20 | 53 | 1,803 | 117 |
| 2023-10 | 1,502,821 | 2,206,855 | 361 | 224 | 78 | 28 | 168 |
| 2023-09 | 1,420,920 | 2,088,637 | 106 | 224 | 100 | 74 | 113 |
| 2023-08 | 1,640,226 | 2,542,766 | 271 | 224 | 108 | 2,133 | 196 |
| 2023-07 | 1,785,221 | 3,133,680 | 248 | 224 | 238 | 1,365 | 577 |
| 2023-06 | 2,068,097 | 3,050,582 | 1,821 | 464 | 286 | 4,120 | 6,158 |
| 2023-05 | 2,229,726 | 2,967,779 | 4,156 | 514 | 227 | 3,808 | 3,284 |
| 2023-04 | 1,847,854 | 2,877,371 | 2,740 | 0 | 183 | 96 | 1,769 |
| 2023-03 | 2,063,292 | 2,682,534 | 1,917 | 119 | 136 | 4,525 | 757 |
| 2023-02 | 1,761,786 | 2,659,192 | 279 | 0 | 0 | 22 | 253 |
| 2023-01 | 1,935,008 | 2,546,610 | 1,090 | 60 | 0 | 236 | 0 |
| 2022-12 | 1,819,911 | 2,486,045 | 10 | 111 | 0 | 991 | 4 |
| 2022-11 | 1,911,992 | 2,645,631 | 90 | 111 | 4 | 1,211 | 0 |
| 2022-10 | 1,876,313 | 2,735,704 | 154 | 117 | 2 | 2,488 | 0 |
| 2022-09 | 1,819,087 | 2,731,199 | 14 | 111 | 3 | 52 | 0 |
| 2022-08 | 2,074,810 | 3,259,900 | 208 | 0 | 3 | 149 | 0 |
| 2022-07 | 2,094,381 | 3,734,324 | 1,126 | 0 | 0 | 704 | 0 |
| 2022-06 | 2,679,947 | 3,902,098 | 4,599 | 0 | 44 | 2,980 | 7 |
| 2022-05 | 2,937,809 | 3,662,437 | 722 | 0 | 7 | 614 | 33 |
| 2022-04 | 2,384,393 | 3,168,718 | 1,648 | 0 | 0 | 794 | 27 |
| 2019-10 | 2,576,671 | 2,835,956 | 178 | 6 | 17 | 78 | 24 |
| 2019-11 | 2,353,129 | 2,986,388 | 32 | 6 | 0 | 27 | 5 |
| 2019-12 | 2,542,479 | 3,183,834 | 14 | 6 | 0 | 14 | 2 |
| 2020-01 | 2,747,881 | 3,312,373 | 0 | 6 | 0 | 0 | 2 |
| 2020-02 | 2,318,173 | 3,261,563 | 4,626 | 6 | 0 | 10 | 0 |
| 2020-03 | 2,706,760 | 2,927,958 | 6,246 | 6 | 0 | 6 | 0 |
| 2020-04 | 2,753,562 | 2,976,254 | 5,233 | 6 | 0 | 4 | 0 |
| 2020-05 | 3,070,596 | 3,380,923 | 9 | 6 | 0 | 5 | 40 |
| 2020-06 | 3,194,625 | 3,724,514 | 124 | 6 | 0 | 977 | 24 |
| 2020-07 | 2,867,413 | 3,301,036 | 1,030 | 6 | 0 | 1,134 | 24 |
| 2020-08 | 2,288,027 | 2,796,804 | 506 | 6 | 0 | 1,134 | 10 |
| 2020-09 | 2,574,056 | 2,716,252 | 337 | 6 | 0 | 677 | 3 |
| 2020-10 | 2,336,037 | 2,515,660 | 360 | 71 | 2 | 220 | 10 |
| 2020-11 | 1,965,223 | 2,268,810 | 30 | 71 | 0 | 846 | 2 |
| 2020-12 | 2,366,696 | 2,442,941 | 214 | 71 | 3 | 1,734 | 6 |
| 2021-01 | 2,211,123 | 2,481,765 | 9 | 6 | 3 | 1 | 3 |
| 2021-02 | 2,319,803 | 2,626,535 | 75 | 6 | 0 | 1,036 | 0 |
| 2021-03 | 2,566,764 | 2,615,864 | 148 | 6 | 0 | 569 | 0 |
| 2021-04 | 2,584,721 | 2,882,420 | 378 | 242 | 0 | 1,127 | 3 |
| 2021-05 | 2,953,240 | 3,311,435 | 571 | 6 | 0 | 744 | 16 |
| 2021-06 | 3,480,780 | 3,991,396 | 325 | 6 | 0 | 805 | 31 |
| 2021-07 | 2,809,211 | 3,433,820 | 32 | 6 | 0 | 470 | 2 |
| 2021-08 | 2,527,133 | 2,947,711 | 173 | 6 | 0 | 7 | 0 |
| 2021-09 | 2,535,927 | 2,639,983 | 53 | 6 | 0 | 512 | 2 |
| 2021-10 | 2,422,372 | 2,650,396 | 21 | 6 | 0 | 651 | 0 |
| 2021-11 | 2,683,017 | 2,845,832 | 83 | 6 | 0 | 1,031 | 0 |
| 2021-12 | 2,527,553 | 2,739,886 | 216 | 156 | 0 | 599 | 0 |
| 2022-01 | 2,296,174 | 2,820,382 | 28 | 150 | 0 | 61 | 0 |
| 2022-02 | 2,422,900 | 3,085,459 | 244 | 0 | 0 | 384 | 0 |
| 2022-03 | 2,595,971 | 3,091,661 | 57 | 0 | 0 | 2,336 | 0 |
| Year-Month | Unpackaged production | Unpackaged inventory |
|---|---|---|
| 2024-12 | 1,261,236 | 2,402,783 |
| 2024-11 | 1,183,188 | 2,432,223 |
| 2024-10 | 1,248,015 | 2,435,780 |
| 2024-09 | 1,669,142 | 3,197,142 |
| 2024-08 | 2,287,678 | 3,237,878 |
| 2024-07 | 1,206,206 | 2,189,907 |
| 2024-06 | 1,149,710 | 2,126,582 |
| 2024-05 | 1,201,853 | 2,088,491 |
| 2024-04 | 1,057,500 | 2,030,707 |
| 2024-03 | 1,085,931 | 2,426,041 |
| 2024-02 | 1,059,974 | 2,374,362 |
| 2024-01 | 1,026,032 | 2,421,724 |
| 2023-12 | 1,063,660 | 2,048,187 |
| 2023-11 | 976,227 | 1,923,886 |
| 2023-10 | 951,026 | 1,994,530 |
| 2023-09 | 1,191,309 | 2,542,842 |
| 2023-08 | 1,539,790 | 2,429,010 |
| 2023-07 | 967,099 | 1,929,392 |
| 2023-06 | 1,227,466 | 2,015,086 |
| 2023-05 | 1,194,395 | 1,969,771 |
| 2023-04 | 1,098,802 | 2,165,664 |
| 2023-03 | 1,213,302 | 2,168,508 |
| 2023-02 | 1,093,431 | 2,185,240 |
| 2023-01 | 1,104,490 | 2,214,383 |
| 2022-12 | 1,247,186 | 2,368,437 |
| 2022-11 | 1,150,896 | 2,285,130 |
| 2022-10 | 1,202,940 | 2,482,464 |
| 2022-09 | 1,448,054 | 2,835,271 |
| 2022-08 | 1,806,039 | 3,049,530 |
| 2022-07 | 1,427,299 | 2,666,539 |
| 2022-06 | 1,423,657 | 2,596,437 |
| 2022-05 | 1,411,510 | 2,663,888 |
| 2022-04 | 1,372,902 | 2,745,346 |
| 2019-10 | 1,419,889 | 2,532,483 |
| 2019-11 | 1,274,336 | 2,371,870 |
| 2019-12 | 1,470,283 | 2,568,565 |
| 2020-01 | 1,481,252 | 2,575,352 |
| 2020-02 | 1,434,562 | 2,726,490 |
| 2020-03 | 1,712,330 | 2,967,146 |
| 2020-04 | 1,749,090 | 3,224,931 |
| 2020-05 | 1,647,312 | 3,137,131 |
| 2020-06 | 1,770,954 | 3,034,803 |
| 2020-07 | 1,955,526 | 3,179,929 |
| 2020-08 | 1,719,068 | 3,555,001 |
| 2020-09 | 1,587,402 | 2,977,751 |
| 2020-10 | 1,693,769 | 3,117,193 |
| 2020-11 | 1,171,934 | 2,780,018 |
| 2020-12 | 1,252,196 | 2,730,170 |
| 2021-01 | 1,582,537 | 2,779,054 |
| 2021-02 | 1,656,371 | 2,867,283 |
| 2021-03 | 1,780,444 | 2,794,105 |
| 2021-04 | 1,706,217 | 2,814,676 |
| 2021-05 | 1,834,527 | 2,858,134 |
| 2021-06 | 1,930,978 | 2,813,991 |
| 2021-07 | 2,417,086 | 3,337,713 |
| 2021-08 | 2,326,451 | 3,576,697 |
| 2021-09 | 2,175,796 | 3,752,522 |
| 2021-10 | 1,777,893 | 3,175,277 |
| 2021-11 | 1,871,755 | 3,002,000 |
| 2021-12 | 1,988,492 | 3,215,507 |
| 2022-01 | 1,404,377 | 3,090,553 |
| 2022-02 | 1,510,040 | 3,077,921 |
| 2022-03 | 1,510,306 | 2,833,597 |
| Year-Month | Unpackaged inventory | Packaged inventory | Sales | ||
|---|---|---|---|---|---|
| Federal licence holders | Provincial distributor and retailers | Medical | Non-Medical | ||
| 2018-10 | 1,692,003 | 0 | 0 | 618 | 0 |
| 2018-11 | 2,168,869 | 0 | 0 | 1,257 | 0 |
| 2018-12 | 2,330,814 | 0 | 0 | 1,027 | 50 |
| 2019-01 | 2,682,433 | 0 | 0 | 819 | 23 |
| 2019-02 | 3,131,711 | 0 | 0 | 356 | 17 |
| 2019-03 | 3,798,357 | 0 | 0 | 190 | 17 |
| 2019-04 | 4,103,169 | 0 | 0 | 416 | 17 |
| 2019-05 | 4,903,776 | 16 | 0 | 202 | 10 |
| 2019-06 | 5,379,742 | 22 | 58 | 832 | 47 |
| 2019-07 | 5,274,187 | 16 | 4 | 561 | 9 |
| 2019-08 | 5,393,211 | 6 | 0 | 136 | 0 |
| 2019-09 | 4,944,695 | 6 | 0 | 104 | 0 |
Note: Prior to October 17, 2019, the Cannabis Tracking System did not distinguish cannabis plants as "vegetative cannabis plants" or "whole cannabis plants". |
|||||