
Edible cannabis data: Production, inventory and sales
This page has been archived on the Web
Updated information can be found on Cannabis data overview: Inventory, sales and licensed area. Information identified as archived is provided for reference, research or recordkeeping purposes.
Definitions
- Edible cannabis
- Products that are solid or liquid at a temperature of 22 ± 2°C and that are intended to be eaten or drunk the same way as foods such as chocolate, cookies, sodas, teas.
- Packaged inventory
- Cannabis held in stock by a cultivator, processor, distributor, or retailer that is packaged for sale to consumers at the retail level.
- Packaged production
- The number of cannabis products resulting from unpackaged cannabis being placed into final packaging for sale to consumers at the retail level during the reporting period.
- Sales (medical)
- Cannabis products sold directly to medical clients by holders of a federal licence for medical sales.
- Sales (non-medical)
- Cannabis products sold directly in the Canadian retail market, online or in-person, by a provincially or territorially authorized distributor or retailer, for non-medical purposes.
The data on this page is also available on Open Government.
Edible cannabis data

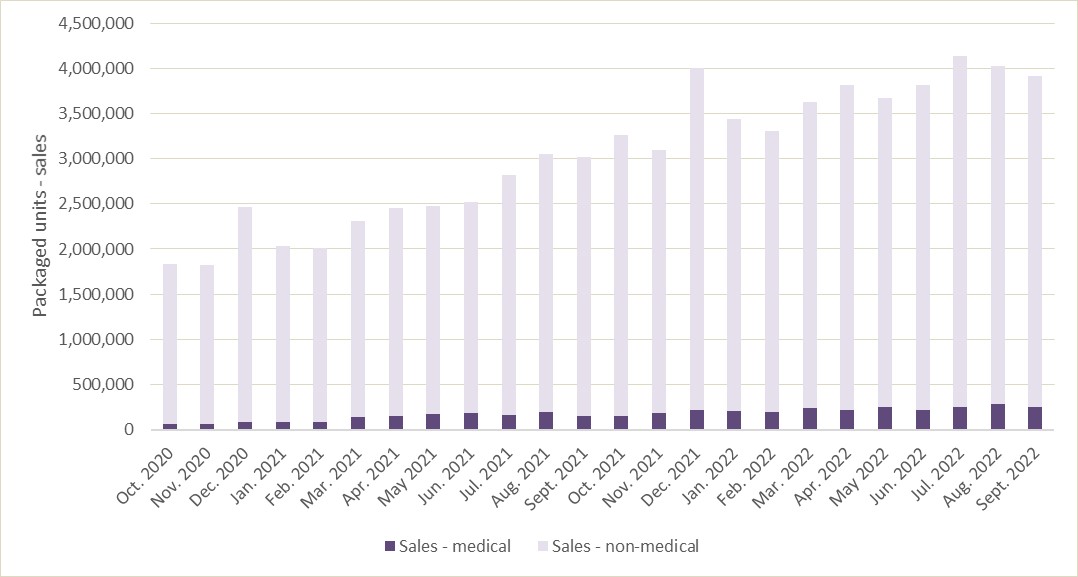
The data presented in this figure is available in Table 1.
The data presented in this figure is available in Table 1.
| Year-Month | Packaged production | Packaged inventory | Sales | ||
|---|---|---|---|---|---|
| Federal licence holders | Provincial distributors and retailers | Medical | Non-Medical | ||
| 2024-12 | 5,554,369 | 12,508,267 | 10,417,357 | 454,341 | 5,533,903 |
| 2024-11 | 5,378,773 | 12,248,905 | 10,385,815 | 433,972 | 5,403,602 |
| 2024-10 | 6,435,890 | 13,253,020 | 10,068,284 | 485,508 | 4,953,781 |
| 2024-09 | 4,908,597 | 12,202,477 | 10,231,322 | 396,103 | 4,821,010 |
| 2024-08 | 5,562,127 | 12,076,719 | 10,066,274 | 391,208 | 5,177,062 |
| 2024-07 | 5,745,712 | 12,097,706 | 10,024,583 | 459,916 | 5,128,127 |
| 2024-06 | 4,756,033 | 11,424,155 | 10,249,378 | 417,049 | 5,071,800 |
| 2024-05 | 5,640,784 | 11,414,369 | 10,342,047 | 436,523 | 4,898,996 |
| 2024-04 | 5,677,260 | 10,827,306 | 9,626,209 | 455,093 | 4,843,098 |
| 2024-03 | 4,993,200 | 10,437,060 | 9,998,600 | 388,040 | 4,840,010 |
| 2024-02 | 4,415,271 | 10,436,768 | 9,830,457 | 416,869 | 4,555,582 |
| 2024-01 | 5,401,475 | 10,592,388 | 9,532,519 | 417,932 | 4,467,673 |
| 2023-12 | 4,746,198 | 10,916,787 | 8,480,151 | 359,643 | 5,059,537 |
| 2023-11 | 6,097,114 | 11,712,813 | 9,827,268 | 404,649 | 4,353,296 |
| 2023-10 | 6,331,739 | 12,071,415 | 9,489,558 | 315,292 | 4,482,196 |
| 2023-09 | 5,496,018 | 11,068,808 | 8,451,134 | 300,557 | 4,223,106 |
| 2023-08 | 5,229,463 | 10,668,699 | 8,890,470 | 311,454 | 4,555,589 |
| 2023-07 | 4,198,277 | 10,669,457 | 7,925,741 | 283,500 | 4,476,621 |
| 2023-06 | 4,725,595 | 11,566,165 | 8,411,609 | 292,832 | 4,123,438 |
| 2023-05 | 4,731,469 | 10,974,490 | 8,532,159 | 354,673 | 3,713,795 |
| 2023-04 | 4,219,227 | 11,649,576 | 7,834,416 | 247,895 | 3,761,498 |
| 2023-03 | 4,875,127 | 11,114,583 | 8,227,954 | 304,841 | 3,853,304 |
| 2023-02 | 4,323,003 | 10,995,819 | 8,068,607 | 259,108 | 3,470,537 |
| 2023-01 | 3,826,747 | 10,219,088 | 7,571,570 | 304,869 | 3,747,704 |
| 2022-12 | 3,655,721 | 11,650,030 | 7,509,448 | 271,195 | 4,455,645 |
| 2022-11 | 5,175,751 | 11,711,900 | 8,505,780 | 294,511 | 3,442,539 |
| 2022-10 | 4,556,469 | 11,761,302 | 7,762,955 | 253,993 | 3,720,904 |
| 2022-09 | 4,406,949 | 11,704,540 | 7,697,988 | 250,578 | 3,665,372 |
| 2022-08 | 4,218,849 | 11,672,783 | 7,821,449 | 279,468 | 3,748,942 |
| 2022-07 | 3,638,920 | 13,031,755 | 7,363,994 | 252,228 | 3,889,390 |
| 2022-06 | 4,673,333 | 14,305,064 | 8,090,550 | 211,488 | 3,607,536 |
| 2022-05 | 4,526,299 | 13,722,180 | 7,835,478 | 244,057 | 3,430,172 |
| 2022-04 | 4,415,718 | 13,445,709 | 7,379,341 | 216,827 | 3,600,659 |
| 2019-10 | 0 | 0 | 0 | 0 | 0 |
| 2019-11 | 451,027 | 451,027 | 0 | 0 | 0 |
| 2019-12 | 812,793 | 547,761 | 189,895 | 2,373 | 81,698 |
| 2020-01 | 780,229 | 806,059 | 254,024 | 2,861 | 359,230 |
| 2020-02 | 1,579,731 | 1,355,031 | 688,353 | 6,746 | 511,372 |
| 2020-03 | 2,191,867 | 1,879,271 | 1,547,073 | 9,142 | 767,957 |
| 2020-04 | 2,289,280 | 2,670,393 | 2,015,202 | 14,131 | 901,583 |
| 2020-05 | 2,764,441 | 3,872,253 | 2,463,071 | 20,241 | 982,161 |
| 2020-06 | 2,925,408 | 4,913,525 | 2,849,316 | 22,630 | 1,090,424 |
| 2020-07 | 2,195,564 | 5,236,890 | 3,194,733 | 22,159 | 1,310,970 |
| 2020-08 | 2,939,966 | 6,636,104 | 3,138,965 | 19,489 | 1,407,345 |
| 2020-09 | 2,892,530 | 6,777,618 | 3,933,843 | 57,003 | 1,501,640 |
| 2020-10 | 4,109,200 | 7,959,801 | 4,737,999 | 65,206 | 1,694,974 |
| 2020-11 | 3,648,093 | 8,454,222 | 5,539,909 | 66,656 | 1,542,135 |
| 2020-12 | 3,688,432 | 8,946,760 | 6,297,815 | 78,272 | 2,219,885 |
| 2021-01 | 3,184,017 |
9,880,507 |
6,279,311 |
81,709 |
1,954,912 |
| 2021-02 | 2,658,747 |
9,932,997 |
5,858,418 |
82,141 |
1,930,152 |
| 2021-03 | 3,174,434 |
10,480,113 | 5,637,826 |
136,260 |
2,174,948 |
| 2021-04 | 4,138,153 |
11,623,946 | 5,777,525 |
153,234 |
2,299,139 |
| 2021-05 | 4,473,475 |
12,150,784 | 6,282,665 |
176,463 |
2,300,367 |
| 2021-06 | 4,101,309 |
11,583,450 | 7,225,400 |
179,622 |
2,341,444 |
| 2021-07 | 3,534,368 |
12,229,313 | 7,328,816 |
155,628 |
2,660,243 |
| 2021-08 | 3,181,015 |
12,338,913 | 6,971,980 |
190,489 |
2,855,895 |
| 2021-09 | 4,547,356 |
12,136,149 | 6,876,355 |
151,109 |
2,867,343 |
| 2021-10 | 3,496,088 | 12,658,823 | 6,679,174 | 150,204 | 3,108,937 |
| 2021-11 | 4,888,697 | 12,743,629 | 7,214,965 | 182,222 | 2,915,476 |
| 2021-12 | 3,581,804 | 11,574,333 | 7,326,963 | 215,555 | 3,784,246 |
| 2022-01 | 3,951,332 | 11,840,653 | 6,919,310 | 209,754 | 3,231,142 |
| 2022-02 | 3,973,743 | 12,401,980 | 7,015,372 | 196,313 | 3,110,271 |
| 2022-03 | 5,198,375 | 13,357,254 | 7,546,828 | 235,118 | 3,390,819 |