
Nutrition labelling: Nutrition facts table
Learn about the nutrition facts table and how to use it, including information on serving size and percent daily value (% DV).
On this page
- What is the nutrition facts table
- Serving size
- How to use the nutrition facts table
- How to compare similar prepackaged foods
What is the nutrition facts table
Most packaged foods in Canada must have a nutrition facts table, which shows:
- the serving size
- how many calories are in that serving size
- the amount of 12 nutrients expressed in units like grams (g) and milligrams (mg), per serving size
- percent daily values (% DVs)
Figure 1. Nutrition facts table

Figure 1 - Text description
The nutrition facts table shows the number of calories, the amount and the % DV of the nutrients in 1 cup of an unspecified food.
Serving size
The serving size on a prepackaged food is listed at the top of the nutrition facts table.
The serving size on a prepackaged food:
- represents the amount of food typically eaten by consumers in 1 sitting
- is based on a reference amount
- isn't a recommendation of how much of the food to eat or drink
Depending on how much you choose to have, your portion size may or may not match the serving size.
Serving sizes come in common household measurements, such as:
- in cups, teaspoons or tablespoons, for example, 1/3 cup
- a number of pieces, for example, 6 crackers
- a fraction of the food, for example, 1/4 pizza
The common household measurement is followed by the metric equivalent in grams (g) or millilitres (mL).
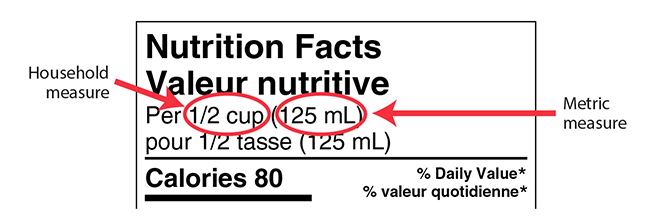
Figure 2 - Text description
The nutrition facts table shows the metric equivalent of 1/2 cup as 125 mL.
Serving sizes make it easy to:
- compare similar foods
- know how many calories and nutrients you're eating from a prepackaged food
Serving size on single-serving prepackaged foods
On single-serving prepackaged foods containing up to 200% of the reference amount for that food, the serving size is the amount in the whole container.
For example, the reference amount for milk is 250 mL. For containers of milk up to 500 mL (200% of 250 mL), the serving size shown in the nutrition facts table is the amount of milk in the entire container. The figure shows a 473 mL carton of milk with a serving size of "Per 1 carton (473 mL)."
Figure 3. Serving size on a single-serving prepackaged food

Figure 3 - Text description
The nutrition facts table of the milk carton shows the serving size as "Per 1 carton (473 mL)."
Serving size on multiple-serving prepackaged foods
For products containing more than 1 serving, also known as multiple-serving prepackaged foods, serving sizes are an amount as close as possible to the food's reference amount.
Serving sizes for these products are based on the type of food, such as:
- foods that can be measured
- foods that come in pieces or are divided
- amounts of foods that are typically eaten in 1 sitting
These factors help make serving sizes more consistent for similar foods. This makes it easier to compare the nutrition information between these foods.
The following examples show how serving size appears depending on the type of food product.
-
Foods that can be measured
Foods that can be measured, like yogurt, usually display serving size as a common household measurement, such as:
- cups
- teaspoons
- tablespoons
This is paired with its metric equivalent in millilitres (mL) or grams (g). Similar products have the same millilitre or gram amount, which makes them easier to compare.
For example, yogurt has a reference amount of 115 g. This amount of yogurt is what you might eat in 1 sitting. The serving size on all tubs of yogurt is based on 115 g. This makes it easier for you to compare different tubs of yogurt.
Figure 4. Food that can be measured

Figure 4 - Text description
Two different size yogurt containers each show the serving size as "Per 2/3 cup (115g)." The same size bowl appears next to both yogurts A and B. Together, these images show that the serving sizes of yogurts A and B are easier to compare when they are the same.
-
Foods that come in pieces or are divided
Foods that come in pieces, like crackers, or are divided into pieces before eating, like lasagna, show serving size as either:
- the number of pieces or
- as a fraction of the food
This is paired with its weight in grams (g). Similar products have the same or very similar gram amounts.
For example, the serving size on cracker boxes is as close to 20 g as possible. This is because 20 g is the reference amount. While the number of crackers may change from product to product, weights should be similar. This makes it easier for you to compare different types of crackers.
Figure 5. Food that come in pieces

Figure 5 - Text description
Two different boxes of crackers compare serving sizes. Crackers A shows the serving size as "Per 6 crackers (21 g)." Crackers B shows the serving size as "Per 11 crackers (19 g)." A balanced justice scale holding the number of crackers shown in the serving sizes appears in between the cracker boxes. These images show that crackers A and B are easier to compare when the weight of the serving sizes are very close.
-
Amounts of foods that are typically eaten in 1 sitting
Foods like sliced bread show serving size as an amount that is typically eaten in 1 sitting, followed by its weight in grams.
For example, the serving size on a bag of bread shows 2 slices of bread and its weight in grams (g). This reflects that most people eat 2 slices of bread at 1 sitting. This makes it easier for you to compare different types of bread.
Figure 6. Amounts of foods that are typically eaten in 1 sitting

Figure 6 - Text description
Two different loaves of bread compare serving sizes. Bread A shows the serving size as "Per 2 slices (90 g)." Bread B shows the serving size as "Per 2 slices (76 g)." Two thick slices of bread appear below bread A and two thin slices appear below bread B. Together, these images show that the serving sizes of breads A and B are easier to compare when they are based on the same number of slices.
How to use the nutrition facts table
The information in the nutrition facts table is based on the serving size.
Use the percent daily value (% DV) to help you make informed food choices. The % DV is a quick reference to tell you if a food product contains a little or a lot of a certain nutrient:
- 5% DV or less is a little
- 15% DV or more is a lot
The nutrition facts table can help you to identify nutrients you may want to limit, such as:
- sodium
- sugars
- saturated fat
The nutrition facts table can also help you to identify nutrients you may want more of, such as:
- iron
- fibre
- calcium
- potassium
Learn more about the table of daily values that are used to calculate the % DV.
How to compare similar prepackaged foods
Follow these steps to compare prepackaged foods:
- Note the serving size written at the top of the nutrition facts table. It tells you the amount of food the information is for.
- Compare the % DV of each prepackaged food to determine which food has more or less of each nutrient.
Food products without a nutrition facts table
Some products don't have to display a nutrition facts table, including:
- alcoholic beverages
- fresh fruits and vegetables
- refillable glass dairy containers
- very small packages, such as one-bite candy
- raw, single-ingredient meat, poultry, fish and seafood (except ground meat)
- items with insignificant calories and nutrients, such as herbs and spices
- food sold by small-batch producers, such as those sold at craft shows and farmer's markets
- food sold only in grocery stores where the product is prepared or packaged in-store
- individual portions for immediate consumption, such as a sandwich or muffin sold in plastic wrap
Restaurants and food service businesses don't need to provide a nutrition facts table with their products.